Abstract
We enrolled 33 patients with COVID‐19 (23 men and 10 women; age 59 ± 15; males, n = 23; females, n = 10) admitted to the Department of Infectious Diseases of Grande Ospedale Metropolitano “Bianchi‐Melacrino‐Morelli” of Reggio Calabria, Italy, between March and May 2020. Whole blood samples were collected before the start of therapeutic treatment using all virus spread containment measures. Sample preparation protocols were designed in order to minimize operators direct specimen's manipulation. On univariate analysis, circulating levels of CRP were strongly and inversely related to CD3+ (rho = −0.77, p < 0.001), CD3+4+ (rho = −0.74, p < 0.001), and CD3+8+ (rho = −0.66, p = 0.001) implying that the shared variances between absolute values T cells and CRP ranged from 44 to 59%. Of note, the strength of these associations was higher in patients with relatively lower (below the median value) white blood cells (WBC) as compared to those with WBC above the median value. CRP also correlated with NK bright (rho = −0.56, p = 0.005) but failed to be related with CD19+ (rho = −0.38, p = 0.07), CD4+/CD8+ ratio (rho = 0.03, p = 0.89), CD16+ CD56+ (rho = −0.18, p = 0.43), and NKdim (rho = −0.15, p = 0.49). Lymphocyte subsets alteration monitoring in COVID‐19 positive patients may be a valid aid to control treatment efficacy of therapy and to choose better clinical approach. In particular, the negative correlation between CD3+, CD3+CD4+, CD3+CD8+ T cells values and CRP could be a useful tool to predict patient's response to therapy, particularly in patients with relatively lower WBC.
Keywords: COVID‐19, C‐reactive protein, inflammation, SARS‐CoV‐2
COVID‐19 affects both innate and adaptive host immune responses, but mechanisms mediating viral response are largely unknown [1, 2, 3]. In a cross sectional study, in a series of symptomatic patients with documented COVID‐19 infection, we investigated the relationship between circulating levels of T, B, and NK cells and a biomarker of inflammation such as C‐reactive protein (CRP). We enrolled 33 patients (23 men and 10 women; age 59 ± 15; males, n = 23; females, n = 10—see Table 1) admitted to the Department of Infectious Diseases of Grande Ospedale Metropolitano “Bianchi‐Melacrino‐Morelli” of Reggio Calabria, Italy, between March and May 2020.
TABLE 1.
Main clinical characteristics of patients included into the study
| Variables | |
|---|---|
| Age (years) | 59 ± 15 |
| Hypertension (%) | 66% |
| Dementia (%) | 24% |
| Chronic renal failure (%) | 24% |
| Obesity (%) | 18% |
| Type 2 diabetes (%) | 33% |
| Chronic Obstructive Pulmonary Disease (%) | 21% |
| Cancer (%) | 21% |
| Heart failure (%) | 33% |
| Male/female | 23/10 |
| CRP (mg/L) | 8 (3–44) |
| IL‐6 (pg/ml) | 8 (4.5–27.5) |
| Hemoglobin (g/dl) | 13.0 ± 1.9 |
| White blood cells (103/μl) | 6.50 (4.88–8.44) |
| Neutrophils (103/μl) | 4.26 (2.62–6.02) |
| Lymphocytes (103/μl) | 1.50 (1.24–1.94) |
| CD19+ (cell/μl) | 150 (90–229) |
| CD3+ (cell/μl) | 1033 (751–1394) |
| CD3+4+ (cell/μl) | 681 (494–893) |
| CD3+8+ (cell/μl) | 298 (185–490) |
| CD4+/CD8+ (%) | 2 (1–3) |
| CD16+CD56+ (cell/μl) | 220 (121–317) |
| NK‐DIM (cell/μl) | 290 (176–363) |
| NK‐Bright (cell/μl) | 5 (2–8) |
Note: Data are mean ± SD, median, and inter‐quartile range or absolute number, as appropriate.
1. MATERIALS AND METHODS
The study received approval by the Ethical Committee of our institution and informed consent was obtained from each participant. Whole blood samples were collected before the start of therapeutic treatment using all virus spread containment measures. Sample preparation protocols were designed in order to minimize operators direct specimen's manipulation. We provided double samples analysis: (a) standard panel connected with BD FACS Canto software that allows to analyze mature B, T and NK lymphocyte subsets through a mixture of monoclonal antibodies (CD3 FITC /CD16+CD56+ PE/ CD45 PERCP‐Cy5/CD4 PeCy7/CD19 APC/CD8 APC‐Cy7) and BD Trucount Tubes, each with a calibrated number of fluorescent beads for absolute counts of lymphocyte subsets; (b) optimized panel (CD4 FITC/CD56 PE/CD8 PERCP‐Cy5/CD19 PeCy7/CD HLA‐DR APC/CD16 APC‐H7/CD3V450/CD45V500) connected with BD FACS Diva software for a deeply study of natural killer (NK) cells in order to subdivide NK into three compartments: NK CD56 bright (CD56++/CD16+/−), producing cytokines, NK CD56dim (CD56+CD16++), with cytotoxic activity and NK CD56‐CD16+, that increase in chronicle viral infections Sample's analysis was performed by BD FACS Canto II using Facs Diva software (version 6.1.3). In the first protocol, we used BD Multitest 6 color TBNK Kit with BD Trucount Tube. This IVD test has received the CE mark for an expanded clinical application of a test assess immune function in patients with COVID‐19. In the second protocol, we prepared manually moAbs subsets tubes in order to subdivide NK into three compartments (NK CD56bright CD56++/CD16+/−, NK CD56dim, and NK CD56−CD16+). The multicolor panel contained following moAbs provided by Becton Dickinson: CD4 (FITC)/CD56(PE)/CD8 (PERCP‐Cy5)/CD19 (PeCy7)/CD HLA‐DR (APC)/CD16 (APC‐H7)/CD3(V450)/CD45(V500).
These protocols allowed us to study CD3+, CD4+ and CD8+ T lymphocytes and CD19+ B lymphocytes percentage and absolute counts, CD4+/CD8+ ratio that represent an excellent indicator of patient's immune system condition and NK CD16+ CD56+.
2. RESULTS
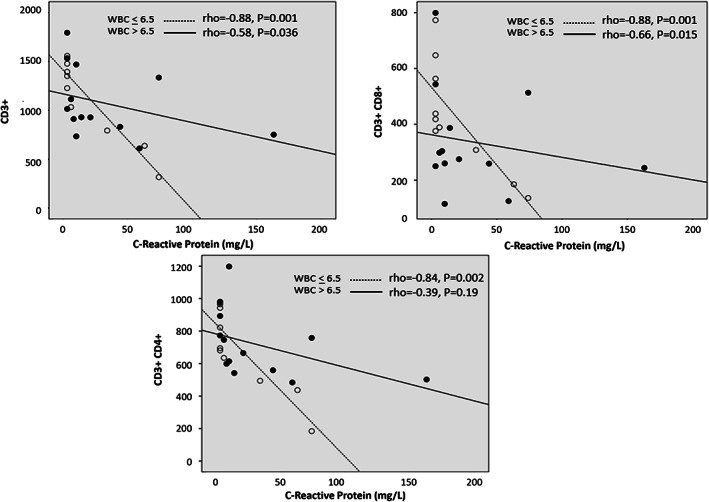
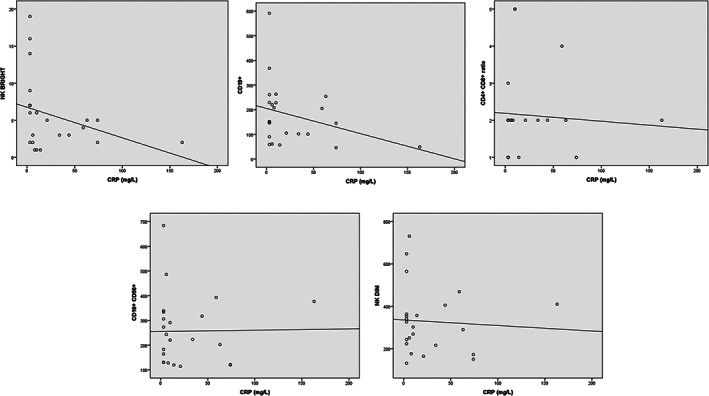
On univariate analysis, circulating levels of CRP were strongly and inversely related to CD3+ (rho = −0.77, p < 0.001), CD3+4+ (rho = −0.74, p < .001) and CD3+8+ (rho = −0.66, p = 0.001) implying that the shared variances between absolute values T cells and CRP ranged from 44 to 59%. Of note, the strength of these associations was higher in patients with relatively lower (below the median value) WBC as compared to those with WBC above the median value (see Figure 1). CRP also correlated with NK bright (rho = −0.56, p = 0.005) and the clinical staging of the disease (rho = 0.43, p = 0.04) but failed to be related with CD19+ (rho = −0.38, p = 0.07), CD4+/CD8+ ratio (rho = 0.03, p = 0.89), CD16+ CD56+ (rho = −0.18, p = 0.43), and NKdim (rho = −0.15, p = 0.49; see Figure 2).
FIGURE 1.

Relationship between CRP with CD3+, CD3+CD4+, CD3+CD8+ T cells values separately in patients with WBC below and above the median value
FIGURE 2.

Association of CRP with NK bright (rho = −0.56, p = 0.005), CD19+ (rho = −0.38, p = 0.07), CD4+/CD8+ ratio (rho = 0.03, p = 0.89), CD16+ CD56+ (rho = −0.18, p = 0.43), and NKdim (rho = −0.15, p = 0.49)
Lymphocyte subsets alteration monitoring in COVID‐19 positive patients may be a valid aid to control treatment efficacy of therapy and to choose better clinical approach. The strong associations among CD3+, CD3+4+, and CD3+8+ with CRP could represent the basis to plan a prospective study to assess whether these biomarkers can be useful to predict the response to therapy. For interested readers, other results on the same topic are reported elsewhere [4, 5, 6, 7].
AUTHOR CONTRIBUTIONS
Carmelo Mangano and Bianca Oliva: Conceptualization; data curation; formal analysis; investigation; methodology; resources; software; supervision; validation; writing‐original draft; writing‐review & editing.
CONFLICT OF INTEREST
No conflict of interest is related to the article.
Supporting information
Cytometry Part A Author Checklist: MIFlowCyt‐Compliant Items
Cytometer Setup report: Quality control check was performed before each analysis session using BD FACS 7‐color setup beads. These setup beads tubes contain a lyophilized pellet that is rehydrated with bead diluent immediately before cytometer setup. During cytometer setup, as showed in figure, BD FACS 7 ‐color setup beads are used by the software to adjust voltages and correct spectral overlap, or spillover if it is necessary. The setup beads are used also to measure the sensitivity of each fluorescence detector. Cytometer setup values produced daily are important to ensure consistent performance of the flow cytometer and to detect possible problems that require service.
ACKNOWLEDGMENTS
The GOM‐COVID‐19 working group is composed by:
Carmelo Mangano, Damiano Larnè, Rosa Basile, Mariastella Carpentieri, Saverio De Lorenzo, Giuseppe Ieropoli, Alfredo Kunkar, Maria Polimeni, Domenico Sofo, Daniela Casile, Giuseppe Foti (Department of Infection Diseases Grande Ospedale Metropolitano “Bianchi‐Melacrino‐Morelli” of Reggio Calabria, Italy)
Bianca Maria Oliva, Cristina Garreffa, Antonella Fameli, Veronica Latella, Anna Maria Silva, Bruno Modafferi (Department of Analysis Lab, Grande Ospedale Metropolitano Bianchi‐Melacrino‐Morelli of Reggio Calabria, Italy)
Macheda Sebastiano, Massimo Caracciolo (Department of Anesthesia and Intensive Care Grande Ospedale Metropolitano “Bianchi‐Melacrino‐Morelli” of Reggio Calabria, Italy)
Francesco Marino (Department of Nephrology Grande Ospedale Metropolitano “Bianchi‐Melacrino‐Morelli” of Reggio Calabria, Italy)
Carmelo Battaglia, Maria Ripepi (Department of Respiratory Diseases Grande Ospedale Metropolitano “Bianchi‐Melacrino‐Morelli” of Reggio Calabria, Italy)
Mangano C, Oliva BM, The GOM‐COVID‐19 Working Group. Relationship between lymphocyte subsets values and C‐reactive protein in COVID‐19 patients. Cytometry. 2021;99:462–465. 10.1002/cyto.a.24327
The components of the “GOM‐COVID‐19 Working Group” are given in the Acknowledgments section.
Contributor Information
Carmelo Mangano, Email: carmelo.mangano2020@gmail.com.
Bianca Maria Oliva, Email: biancoliva@gmail.com.
REFERENCES
- 1. Grifoni A, Weiskopf D, Ramirez SI, Mateus J, Dan JM, Moderbacher CR, et al. Targets of T cell responses to SARS‐CoV‐2 coronavirus in humans with COVID‐19 disease and unexposed individuals. Cell. 2020;181(7):1489‐1501.e15. [DOI] [PMC free article] [PubMed] [Google Scholar]
- 2. Weiskopf D, Schmitz KS, Raadsen MP, Grifoni A, Okba NMA, Endeman H, et al. Phenotype of SARS‐CoV‐2‐specific T‐cells in COVID‐19 patients with acute respiratory distress syndrome. medRxiv. 2020:2020.04.11.20062349. [DOI] [PMC free article] [PubMed]
- 3. Braun J, Loyal L, Frentsch M, Wendisch D, Georg P, Kurth F, et al. Presence of SARS‐CoV‐2 reactive T cells in COVID‐19 patients and healthy donors. medRxiv. 2020:2020.04.17.20061440.
- 4. Vabret N, Britton GJ, Gruber C, Hegde S, Kim J, Kuksin M, et al. Immunology of COVID‐19: current state of the science. Immunity. 2020;52(6):910–41. [DOI] [PMC free article] [PubMed] [Google Scholar]
- 5. Liang J, Nong S, Jiang L, et al. Correlations of disease severity and age with hematology parameter variations in patients with COVID‐19 pre‐ and post‐treatment. J Clin Lab Anal. 2020;35(1):e23609. [DOI] [PMC free article] [PubMed] [Google Scholar]
- 6. Gan J, Li J, Li S, Yang C. Leucocyte subsets effectively predict the clinical outcome of patients With COVID‐19 pneumonia: A retrospective case‐control study. Front Public Health. 2020;8:299. [DOI] [PMC free article] [PubMed] [Google Scholar]
- 7. Wang L. C‐reactive protein levels in the early stage of COVID‐19. Med Mal Infect. 2020. Jun;50(4):332–4. 10.1016/j.medmal.2020.03.007. [DOI] [PMC free article] [PubMed] [Google Scholar]
Associated Data
This section collects any data citations, data availability statements, or supplementary materials included in this article.
Supplementary Materials
Cytometry Part A Author Checklist: MIFlowCyt‐Compliant Items
Cytometer Setup report: Quality control check was performed before each analysis session using BD FACS 7‐color setup beads. These setup beads tubes contain a lyophilized pellet that is rehydrated with bead diluent immediately before cytometer setup. During cytometer setup, as showed in figure, BD FACS 7 ‐color setup beads are used by the software to adjust voltages and correct spectral overlap, or spillover if it is necessary. The setup beads are used also to measure the sensitivity of each fluorescence detector. Cytometer setup values produced daily are important to ensure consistent performance of the flow cytometer and to detect possible problems that require service.


