

Abstract
We primarily quantified exposure patterns, transmission characteristics, and the clinical spectrum of severe acute respiratory syndrome coronavirus 2 (SARS‐CoV‐2) infection among household contacts of individuals with severe coronavirus disease‐2019 (COVID‐19). We conducted a retrospective cohort study of 20 index patients hospitalized with severe COVID‐19 and 79 of their household contacts. We determined the transmission frequency, range of manifestations of SARS‐CoV‐2 infection, and factors associated with infection in household settings. Of the 79 household contacts, 53 (67%) developed SARS‐CoV‐2 infection (49 [62%] symptomatic, 4 [5%] asymptomatic). Eight patients (10%) developed severe COVID‐19, and one died of COVID‐19 pneumonia (case‐fatality rate: 1.9%). The probability of SARS‐CoV‐2 infection was similar in children and adults (55% vs. 72%, p = .14), with children being less likely to develop the symptomatic disease (46% vs. 68%, p = .06). Handwashing ≥ 5 times/day was associated with reduced infection risk (52.8% vs. 76.9%, p = .04). SARS‐CoV‐2 has a high frequency of transmission among household contacts. Nonhospitalized individuals with SARS‐CoV‐2 infection should be quarantined in patient care facilities rather than at home to minimize spread, if possible, and frequent handwashing should be practiced to prevent transmission.
Keywords: coronavirus disease 2019, COVID‐19, handwashing, infectious disease transmission, quarantine, SARS‐CoV‐2, severe acute respiratory syndrome coronavirus 2
Highlights
The new coronavirus, SARS‐CoV‐2, is the cause of the COVID‐19 pandemic. It is readily transmitted and may cause severe pneumonia, but information on its infectivity and the full disease spectrum of the infection is limited because many infections are undiagnosed.
The study followed a cohort of 79 household contacts of 20 unrelated index patients with severe COVID‐19 pneumonia. All household contacts had exposure to infection, and the complete cohort was followed‐up; thus, it was possible to determine the rates of transmission and the severity and complete clinical course of all infections. We were also able to determine the risk factors for transmission and severe disease and to compare the susceptibility of children and adults to infection and disease.
1. INTRODUCTION
The severe acute respiratory syndrome coronavirus 2 (SARS‐CoV‐2) is a recently identified virus belonging to the family of human coronaviruses. 1 The disease caused by SARS‐CoV‐2 was named coronavirus disease‐2019 (COVID‐19) by the World Health Organization (WHO). On March 11, 2020, the WHO declared COVID‐19 a global pandemic. The median and mean incubation periods of SARS‐CoV‐2 have been estimated as 3 and 5 days, respectively, with a range of 0–24 days. 2 , 3 COVID‐19 typically presents with respiratory symptoms, such as fever or chills, cough, shortness of breath, sore throat, congestion or runny nose, or difficulty breathing. However, other clinical presentations often associated with COVID‐19 included fatigue, muscle or body aches, headache, the new loss of taste or smell, nausea, vomiting, diarrhea, and skin rashes. The estimated mean basic reproduction number (R 0) for COVID‐19 is 2.2, 2 and the estimated case‐fatality rate is 2.3% among individuals with confirmed SARS‐CoV‐2 infection in China, 4 which is similar to the range of R0 from 1.4 to 2.5 reported by WHO. 5 Although the R0 did not differ from that in SARS in China 6 (R0 of 2.0–3.0), the case fatality rate was much lower than that of SARS (2.3% vs. 11%). Data on Middle East respiratory syndrome (MERS) are unavailable in China. Nevertheless, the case R0 of less than 1 and fatality of 34.4% among patients with MERS have been reported by a study in another country. 7
Recent advances have been made in identifying the clinical features, diagnostic methods, and treatment strategies of individuals with COVID‐19. 3 , 8 , 9 , 10 However, current published studies focus mainly on diagnosed cases that represent only a fraction of all those infected. 3 , 8 , 9 , 10 , 11 , 12 Many cases of SARS‐CoV‐2 infection may be missed if contact tracing and testing protocol have not been implemented, especially in the cases of asymptomatic infection without the progress to overt COVID‐19. 13 , 14 , 15 , 16 Thus, the frequency of SARS‐CoV‐2 infection and the proportions of individuals infected with SARS‐CoV‐2 who develop the clinical disease (COVID‐19) and severe COVID‐19 are unknown. Wu and McGoogan 4 reported that 64% of 1183 case clusters in 20 provinces outside of Hubei in China were outbreaks within family households. Furthermore, some studies reported elder ages of household contacts and spouse relationship with index case were risk factors for transmission of SARS‐CoV‐2 within household. 17 , 18 , 19 There is no commonly agreed approach regarding quarantine policies for individuals with asymptomatic or mild SARS‐CoV‐2 infection.
We conducted a household study to investigate the epidemiological characteristics and range of clinical manifestations after SARS‐CoV‐2 exposure. The primary objective was to quantify exposure patterns, transmission characteristics, and the clinical spectrum of SARS‐CoV‐2 infection. Household contact is the major source of SARS‐CoV‐2 infection, which particularly puts children at risk. 12 Children have a very different subset of illness, who may develop an exaggerated immune response, characterized by exaggerated cytokine release and manifests with features similar to Kawasaki disease. The syndrome has been referred to as multisystem inflammatory syndrome in children with negative clinical outcomes. 19 We further investigated the characteristics and outcomes of children with COVID‐19.
2. PATIENTS AND METHODS
2.1. Study design and participants
We conducted a single‐center cohort study on the household contacts of individuals with COVID‐19. Patients were recruited from Beijing Ditan Hospital, which is affiliated with the Capital Medical University, an academic tertiary care center in Beijing, China, designated for the diagnosis and treatment of COVID‐19. The standard of care for patients with SARS‐CoV‐2 is described in Section S1. Eligible patients were those who presented to our medical center and also had at least one family member with a confirmed diagnosis of COVID‐19. The date range of admission/hospitalization was between January 21 and February 14 in 2020. Epidemiological and clinical data were collected, including data for transmission tree analysis with the chronology of symptom onset and virus transmission recorded; the history of the first presentation and disease progression; and physical findings, laboratory testing results, imaging results, treatment, and outcomes. The requirement for informed consent was waived because the study was retrospective and posed minimal risk to the individuals included in the analysis.
Data were collected from medical records and self‐reported data from a questionnaire administered during the patient's visit to the clinic or their hospital stay. A sample of the questionnaire is presented in Section S2. Details of the laboratory procedures, sample collection, and testing are also described in Section S3. All computed tomography (CT) findings were confirmed by the chief of the radiology department. The records to obtain the data used in this study were accessed on March 30.
2.2. Study measurements
Primary measurements included aggregated case counts on outcomes to the proportion of patients with SARS‐CoV‐2 infection, proportion of patients with COVID‐19, proportion of patients with severe COVID‐19, and case‐fatality rates among household members.
The proportion of household members who tested positive for SARS‐CoV‐2 and the proportion who developed COVID‐19 were measured to determine the frequency of SARS‐CoV‐2 infection and symptomatic disease, respectively. The proportion of household contacts that developed severe COVID‐19 and the case‐fatality rate, which was defined as the percentage of those with SARS‐CoV‐2 infection who died due to COVID‐19, were also measured.
Secondary measures included: (1) epidemiological predictors of transmission of SARS‐CoV‐2 by comparing individuals with and without COVID‐19 after exposure to index patients; (2) epidemiologic parameters, including the incubation period, the interval from symptom onset to the first medical visit or hospitalization, and the duration of symptoms and recovery; (3) clinical baseline predictors of the development of severe COVID‐19; and (4) a comparison of the clinical presentation of COVID‐19 in children and adults.
In our study, the index case in the household referred to the first person in the household with a confirmed COVID‐19 or positive COVID‐19 PCR test without clinical confirmation yet. Other household members were defined as successive (secondary) cases with exposure and their data were included in a separate dataset. Case confirmation for SARS‐CoV‐2 infection was based on laboratory microbiological diagnosis through detection of the virus using reverse transcription polymerase chain reaction (RT‐PCR) assays, regardless of the presence of clinical signs and symptoms. Samples were obtained for RT‐PCR testing at the first clinic visit or on the day of admission to the hospital. Those with negative RT‐PCR results, who were clinically suspected to be infected, were admitted to a single‐occupancy isolation room for further observation until they met the discharge criteria. Successive patients with SARS‐CoV‐2 infection were assigned further into the subgroups of asymptomatic, mild/moderate COVID‐19, and severe COVID‐19.
Patients who met any of the following criteria were considered as having severe COVID‐19: (1) dyspnea with a respiratory rate more than 30/min; (2) hypoxemia with oxygen saturation less than 93%; (3) PaO2/FiO2 less than 300 mmHg; or (4) complications including sepsis, metabolic acidosis, organ failure, or acute respiratory distress syndrome. Noninfected family members were those who had negative RT‐PCR test results on at least two samples collected on separate dates and no clinical evidence of COVID‐19. Household contacts who did not meet any of these definitions were classified as possible cases.
2.3. Ethical considerations
The study protocol was approved by the Institutional Review Board of Beijing Ditan Hospital, Capital Medical University in Beijing (approval number: 2020‐015‐01). Data were collected from medical records. All data were deidentified before analysis. The need for informed consent was waived by the Institutional Review Board because the study posed minimal risk to the enrollees.
2.4. Statistical analysis
Transmission trees were constructed that allowed for the tabulation of exposure frequency and the numbers of successive cases with generations of infection from the index case. Using data from each individual, aggregated case counts of varying disease severity were analyzed and reported as the percentage of participants in each outcome category. χ 2 or Fisher's exact tests were used to identify risk factors for severe COVID‐19. Variables with p < .05 in the univariate analyses were further investigated in a multivariate logistic regression model. All statistical analyses were performed using SPSS Version 16.0 (SPSS Inc.). All tests were two‐tailed, and p values of less than .05 were considered statistically significant.
3. RESULTS
The index cases had a reported date of symptom onset between January 21, 2020 and February 14, 2020. All individuals in the household were followed with the last follow‐up of the last patient on March 5, 2020. There were 99 participants from 20 unrelated households enrolled in the study. Their median age was 38 years (range: 0.8–86 years), with 41 (41%) males and 22 (22%) children under 18 years (median age: 5.4 years, range: 0.8–13 years). Six of the 20 index patients (30%) had severe COVID‐19. The transmission trees of familial SARS‐CoV‐2 outbreaks linked to the index patient in each household are shown in Section S4 (Figure S1). All secondary cases within the households comprised only one generation of infection if the index case was classified as Generation 0. Details regarding recruitment and disease severity are shown in Figure 1 and Table 1. Among the household contacts of the index patients (N = 79), the proportion of patients with SARS‐CoV‐2 infection, the diagnosis of COVID‐19, and severe COVID‐19 were 67% (53/79), 62% (49/79), and 10% (8/79), respectively. Among the household contacts, the incidence of asymptomatic infection was 5% (4/79), and the case‐fatality rate among secondary cases was 1.9% (1/53).
Figure 1.
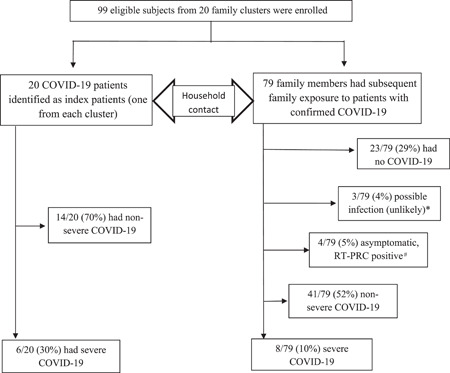
Study subjects and their status of SARS‐CoV‐2 infection with disease ranges. *These family members were classified as possible infected cases because two had one day of fever (<37.5°C and one had diarrhea (6–7 loose stool/day for 2 days) after contacting the index patients. The community health providers considered that they were unlikely infected and advised patients to be quarantined at home for 14 days. Thus, clinical workup or laboratory investigations were not conducted at the onset of their symptoms, although two of them had two consecutive negative RT‐PCR results on throat swab samples after the quarantine period. There were no new infected patients reported to be linked to these family members. There were 69 patients of COVID‐19 in our cohort, including 20 index patients and 49 subsequent infected patients in 20 family clusters. These patients were confirmed with the diagnosis between January 21 and February 14 in 2020. During this period, 365 new patients were confirmed with COVID‐19 in Beijing City. Thus, our infected patients represented 19% of all cases in the city. The daily reports of cases with confirmed COIVD‐19 in Beijing can be found on the website: (https://ncov.dxy.cn/ncovh5/view/pneumonia_area?aid=110000&from=dxy&link=&share=&sourc).
Table 1.
Spectrum of infection and disease severity among the index patients and their household contacts
| Variables | Index patients | Outcomes among the household contacts of the index patients | |||||
|---|---|---|---|---|---|---|---|
| (N = 20) | (N = 79) | ||||||
| Disease ranges | Nonsevere disease | Severe disease | No infection | Possible case | Asymptomatic infection | Nonsevere disease | Severe disease |
| Proportion | 14 (70%) | 6 (30%) | 23 (29%) | 3 (4%) | 4 (5%) | 41 (52%) | 8 (10%) |
| Ratio | Nonsevere versus severe = 7:3 | Noninfected versus infected = 3:7 | |||||
3.1. Epidemiologic features and risk of infection
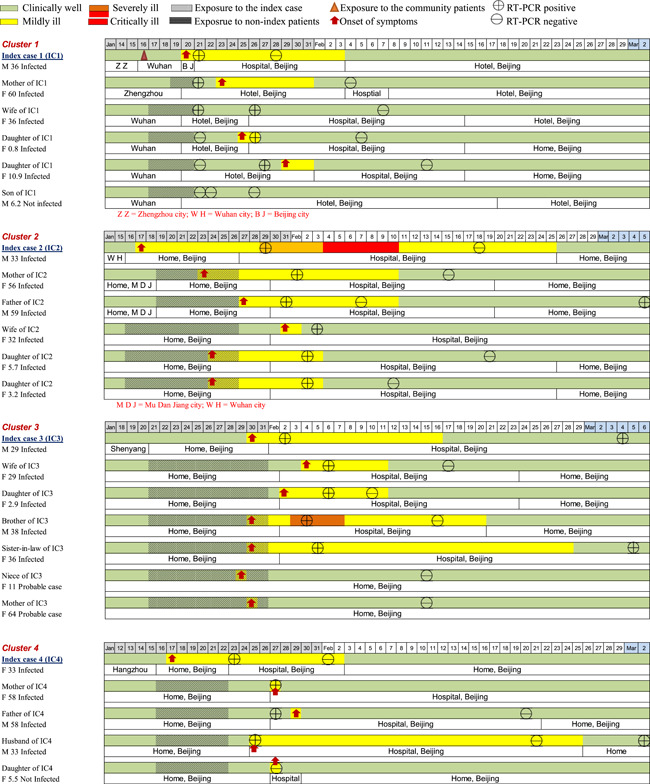
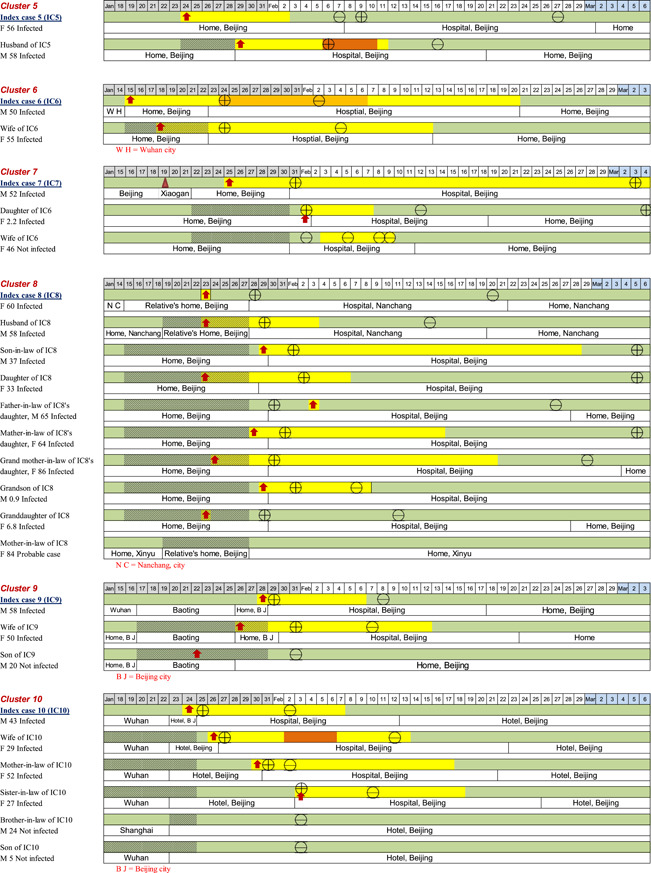
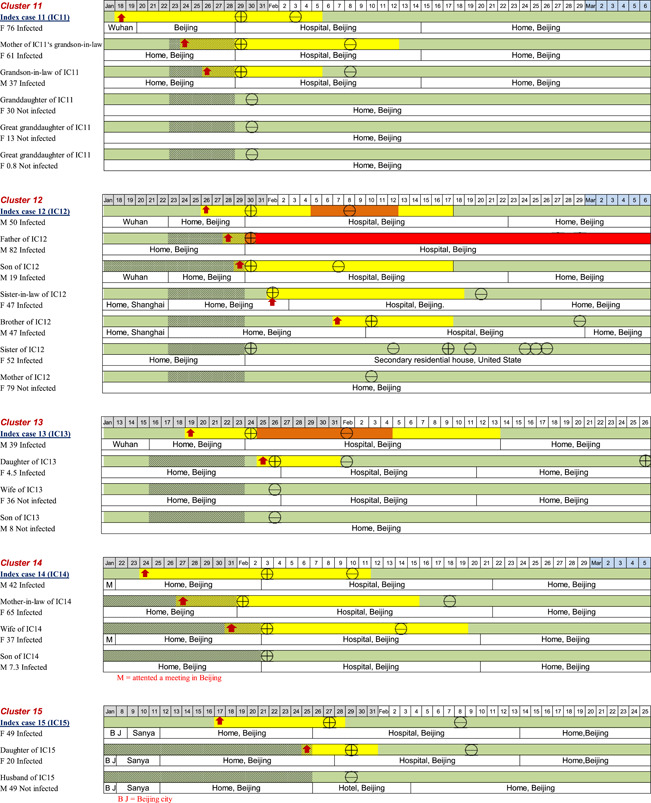
In terms of the locations of possible exposure to the virus for the 20 index patients, 13/20 (65%) of them were residents of Wuhan City or had traveled from Wuhan City to Beijing; 2/20 (10%) of them had environmental exposure at work or had attended social events in Beijing where transmission was believed to have occurred through cases originating from Wuhan; the remaining 5/20 (25%) of the patients had no contact with a known source. The timelines of disease occurrence within each household and individual history of exposure, chronology of symptom onset, and disease course are shown in Figure 2. All family members in each household had a clear direct exposure to the index case, except for two members of one family (Household 20), in which there were two adults (grandparents) who had family exposure only to the infected child of the index patient. They had no direct contact with the index patient and did not become infected.
Figure 2.
The timelines of the individual's history of exposure, chronology of symptom onset, and disease course
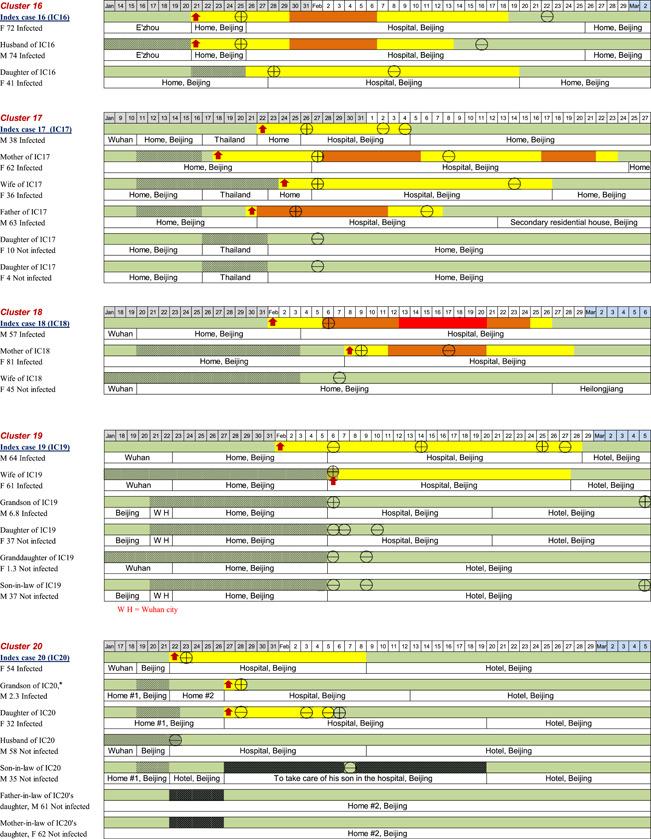
On the basis of the individual data, we estimated the epidemiologic parameters for 53 successive cases. Household members with no symptoms or with symptom onset before the index case were excluded (n = 7). The mean incubation period and serial interval (time between the onset of symptoms in an index patient and onset of symptoms in an infected contact) were 5.5 (95% confidence interval [CI]: 4.52–6.48) days and 5.5 (95% CI: 4.43–6.57) days, respectively (n = 46). The mean interval from illness onset to the first medical visit and hospital admission (n = 49) was 2.2 (95% CI: 1.93–2.48) days and 2.5 (95% CI: 1.66–3.34) days, respectively. The mean interval from the onset of COVID‐19 related symptoms to recovery (n = 49) was 15.1 (95% CI: 12.5–17.7) days.
To investigate the predictors of SARS‐CoV‐2 infection, we compared epidemiologic features between the noninfected participants and participants with first‐generation infection (Table 2). The analyses showed that a significantly higher proportion of those who did not develop infection washed their hands more than five times per day (77% [20/26] vs. 53% [28/53], p = .04). However, there were no differences in other variables between the two groups, including travel history, disease severity of the index case, time and location of SARS‐CoV‐2 exposure, physical contact with the index case, household size, income status, family member's highest education level, or knowledge about the disease.
Table 2.
Epidemiological data of family members after contact with the index patients
| Variables No. (%), or as specified | Noninfected family membersa (n = 26) | Infected family membersb (n = 53) | p |
|---|---|---|---|
| Proportion of all cases with exposure | 26/79 (32.9%) | 53/79 (67.1%) | NA |
| Age, median (IQR), years | 32.5 (7.6‐51.3) | 37.0 (19.5‐58.5) | .25 |
| Sex, male | 10/26 (38.5%) | 18/53 (34.0%) | .69 |
| Index patient lived at or traveled to Wuhan | 20/26 (76.9%) | 32/53 (60.4%) | .15 |
| Index patient had severe COVID‐19 | 4/26 (15.4%) | 15/53 (28.3%) | .21 |
| Exposure period to the index patient, mean (95% CI), days | 7.5 (5.89–9.11) | 9.1 (7.94‐10.3) | .12 |
| Contact time with the index patient > 7 h/day | 14/26 (53.8%) | 38/53 (71.7%) | .12 |
| Had been exposed to cough or sneeze from the index patient | 6/26 (23.1%) | 21/53 (39.6%) | .15 |
| Slept in the same room as the index patient | 7/26 (26.9%) | 20/53 (37.7%) | .34 |
| Frequent physical contact with the index patient | 9/26 (34.6%) | 22/53 (41.5%) | .56 |
| Wearing mask > 50% of the time before the index patient was diagnosed | 7/26 (26.9%) | 11/53 (20.8%) | .54 |
| Wearing mask > 50% of the time after the index patient's diagnosis was confirmed | 20/26 (76.9%) | 47/53 (88.7%) | .30 |
| Washed hands > 5 times/day during the period with the index patient | 20/26 (76.9%) | 28/53 (52.8%) | .04 |
| Living area > 100 m2 | 8/26 (30.8%) | 23/53 (43.4%) | .28 |
| Member of the household with a postgraduate degree | 12/26 (46.2%) | 27/53 (50.9%) | .69 |
| Household size > four persons (including the index patient) | 20/26 (76.9%) | 41/53 (77.4%) | .97 |
| Annual household income > US$ 30,000 | 19/26 (73.1%) | 34/53 (64.2%) | .43 |
| Cigarette smoker in the household | 5/26 (19.2%) | 8/53 (15.1%) | .89 |
| Staying in the same residence for quarantine | 7/26 (26.9%) | 10/53 (18.9%) | .41 |
| Understand how the disease could be transmitted | 11/26 (42.3%) | 26/53 (49.1%) | .57 |
| Initial care by infectious disease specialists | 26/26 (100%) | 53/53 (100%) | >.99 |
| Received instructions from healthcare providers | 23/26 (88.5%) | 46/53 (86.8%) | >.99 |
Abbreviations: IQR, interquartile rangel; RT‐PCR, reverse transcription polymerase chain reaction.
Participants in this group comprised individuals with no change in health and negative RT‐PCR results on at least two samples collected on different days (confirmed noninfected), and possible cases but unlikely to be infected (clinically well and RT‐PCR negative at the end of the quarantine period).
Index patients were excluded from this group.
3.2. Clinical features and children with COVID‐19
Among the 73 participants with laboratory‐confirmed COVID‐19, including the 20 index cases and 53 secondary cases, six who had transient mild symptoms or asymptomatic infection underwent monitoring for the development of COVID‐19 (thus, some variables were not recorded). The clinical data of the 73 case patients are shown in Table 3. Their mean age was 42 years and 43% were male. Common initial symptoms included fever (80%), cough (56%), and fatigue (44%), and myalgia/arthralgia (25%), whereas diarrhea (8%) or nausea/vomiting (1%) occurred infrequently. Common initial findings were as follows: lymphopenia (63%), elevated C‐reactive protein (54%), lactate dehydrogenase (LDH; 50%), and bilateral patchy shadowing (58%) or ground‐glass opacities (76%) on CT scans. The date of symptom resolution was documented for 69 of 73 household contacts with SARS‐CoV‐2 infection (four asymptomatic cases were excluded). The mean duration of symptoms was 15.1 (95% CI: 12.5–17.7) days. One of the 53 secondary cases with SARS‐CoV‐2 infection (the father of Index Patient 12) died and the other 52 recovered.
Table 3.
Clinical data of patients with confirmed SARS‐CoV‐2 infection from 20 clusters in 2020a
| Variables | All Patients | Nonsevere COVID‐19 | Severe COVID‐19 | Adult | Children | ||
|---|---|---|---|---|---|---|---|
| n (%), or as specified | (n = 73) | (n = 59) | (n = 14) | p | (n = 61) | (n = 12) | p |
| Age, median (IQR), yrs | 43.0 (30.5–58.0) | 38.0 (27.0–58.0) | 57.5 (38.8–72.5) | .01 | 50.0 (36.0–60.0) | 3.8 (2.2–6.8) | <.001 |
| Sex, male | 31/73 (42.5) | 21/59 (35.6) | 10/14 (71.4) | .02 | 27/61 (44.3) | 4/12 (33.3) | .48 |
| Mean incubation period (95% CI), daysb | n = 46 | n = 38 | n = 8 | .32 | n = 36 | n = 10 | .92 |
| 5.5 (4.52–6.48) | 5.8 (4.75–6.85) | 4.4 (1.77–7.03) | 5.6 (4.46–6.74) | 5.5 (3.52–7.48) | |||
| Smoking history | 7/73 (9.6) | 3/59 (5.1) | 4/14 (28.6) | .03 | 6/61 (9.8) | 1/12 (8.3) | >.99 |
| Chronic conditions | 25/73 (34.2) | 15/59 (25.4) | 10/14 (71.4) | .003 | 25/61 (41.0) | 0/12 (0) | .02 |
| Hospitalization at the onset of illness | 12/73 (16.4) | 7/59 (11.9) | 5/14 (35.7) | .08 | 12/61 (19.7) | 0/12 (0) | .21 |
| Initial symptoms and signs | |||||||
|---|---|---|---|---|---|---|---|
| Headache | 13/73 (17.8) | 10/59 (16.9) | 3/14 (21.4) | .99 | 12/61 (19.7) | 1/12 (8.3) | .60 |
| Fever | 58/73 (79.5) | 44/59 (74.6) | 14/14 (100) | .08 | 51/61 (83.6) | 7/12 (58.3) | .11 |
| Temperature ≥ 38°C | 43/73(58.9) | 31/59 (52.5) | 12/14 (85.7) | .03 | 37/61 (60.7) | 6/12 (50.0) | .72 |
| Fatigue | 32/73 (43.8) | 26/59 (44.1) | 6/14 (42.9) | .94 | 31/61 (50.8) | 1/12 (8.3) | .007 |
| Cough | 41/73 (56.2) | 29/59 (49.2) | 12/14 (85.7) | .01 | 37/61 (60.7) | 4/12 (33.3) | .08 |
| Sore throat | 4/73 (5.5) | 3/59 (5.1) | 1/14 (7.1) | >.99 | 4/61 (6.6) | 0/12 (0) | .83 |
| Shortness of breath | 9/73 (12.3) | 3/59 (5.1) | 6/14 (42.9) | .001 | 9/61 (14.8) | 0/12 (0) | .35 |
| Nausea/vomiting | 1/73 (1.4) | 0/59 (0) | 1/14 (7.1) | .43 | 1/61 (1.6) | 0/12 (0) | >.99 |
| Diarrhea | 6/73 (8.2) | 6/59 (10.2) | 0/14 (0) | .48 | 4/61 (6.6) | 2/12 (16.7) | .56 |
| Myalgia/arthralgia | 18/73 (24.7) | 15/59 (25.4) | 3/14 (21.4) | >.99 | 18/61 (29.5%) | 0/12 (0) | .07 |
| O2 saturation < 93% | 4/73 (5.5) | 0/59 (0) | 4/14 (28.6) | <.001 | 4/61 (6.6) | 0/12 (0) | .83 |
| Chest pain | 1/73 (1.4) | 1/59 (1.7) | 0/14 (0) | >.99 | 1/61 (1.6) | 0/12 (0) | >.99 |
| ≥2 Signs or symptoms | 42/73 (57.5) | 31/59 (52.5) | 11/14 (78.6) | .08 | 39/61 (63.9) | 3/12 (25.0) | .01 |
| Laboratory findings | |||||||
|---|---|---|---|---|---|---|---|
| PaO2:FiO2, median (IQR) | n = 22 | n = 12 | n = 10 | <.001 | n = 22 | n = 0 | NA |
| 352.5 (261.5‐449.3) | 269.5 (218.8‐323.3) | 459.5 (387.5‐503.3) | 352.5 (261.5‐449.3) | NA | |||
| Leukocyte (count /L), mean (±SD) | n = 56 | n = 43 | n = 13 | .67 | n = 45 | n = 11 | .01 |
| 4.93 ± 1.72 | 4.99 ± 1.64 | 4.75 ± 2.05 | 4.57 ± 1.38 | 6.59 ± 2.21 | |||
| Hemoglobin (g/L), mean (±SD) | n = 55 | n = 42 | n = 13 | .29 | n = 44 | n = 11 | .02 |
| 137.31 ± 14.71 | 141.15 ± 16.9 | 136.12 ± 13.97 | 139.57 ± 14.34 | 128.27 ± 13.11 | |||
| Lymphopeniac | 36/57 (63.2) | 23/44 (52.3) | 13/13 (100) | .005 | 35/46(76.1) | 1/11(9.1) | <.001 |
| Thrombocytopeniad | 12/55 (21.8) | 7/42 (16.7) | 5/13 (38.5) | .20 | 12/44 (27.3) | 0/11 (0) | .12 |
| Sodium (mmol/L), mean (±SD) | n = 55 | n = 42 | n = 13 | .00 | n = 44 | n = 11 | .22 |
| 138.70 ± 2.63 | 139.61 ± 1.66 | 135.76 ± 3.08 | 1 | 138.57 ± 2.89 | 139.25 ± 1.09 | ||
| Potassium (mmol/L), mean (±SD) | n = 55 | n = 42 | n = 13 | .82 | n = 44 | n = 11 | <.001 |
| 3.85 ± 0.43 | 3.84 ± 0.41 | 3.87 ± 0.52 | 3.74 ± 0.38 | 4.27 ± 0.36 | |||
| Chloride (mmol/L), mean (±SD) | n = 55 | n = 42 | n = 13 | .04 | n = 44 | n = 11 | .06 |
| 102.80 ± 3.14 | 103.49 ± 2.31 | 100.56 ± 4.36 | 102.41 ± 3.23 | 104.35 ± 2.25 | |||
| Creatinine ≥ 133 (μmol/L) | 2/57 (3.5) | 2/44 (4.5) | 0/13 (0) | >.99 | 2/46 (4.3) | 0/11 (0) | 1.0 |
| Aspartate aminotransferase > 40 (U/L) | 8/39 (20.5) | 4/31 (12.9) | 4/8 (50.0) | .04 | 8/32 (25.0) | 0/7 (0) | .31 |
| Alanine aminotransferase > 40 (U/L) | 7/55 (12.7) | 4/42 (9.5) | 3/13 (23.1) | .42 | 7/44 (15.9) | 0/11 (0) | .36 |
| Total bilirubin ≥ 17.1 (μmol/L) | 5/30 (16.7) | 4/24 (16.7) | 1/6 (16.7) | >.99 | 5/24 (20.8) | 0/6 (0) | .55 |
| Creatinine kinase ≥ 200 (U/L) | 11/52 (21.2) | 3/39 (7.7) | 8/13 (61.5) | <.001 | 11/42 (26.2) | 0/10 (0) | .16 |
| C‐reactive protein level ≥ 10 (mg/L) | 28/52 (53.8) | 15/39 (38.5) | 13/13 (100) | <.001 | 28/43 (65.1) | 0/9 (0) | .001 |
| Elevated erythrocyte sedimentation rate, mean (±SD) | n = 14 | n = 12 | n = 2 | .35 | n = 12 | n = 2 | .09 |
| 27.07 ± 21.97 | 24.75 ± 21.98 | 41.00 ± 22.63 | 31.17 ± 21.03 | 2.50 ± 2.12 | |||
| Lactose dehydrogenase ≥ 250 (U/L) | 14/28 (50.0) | 9/23 (39.1) | 5/5 (100) | .04 | 10/22 (45.5) | 4/6 (66.7) | .65 |
| d‐dimer ≥ .5 mg/L | 11/29 (37.9) | 6/24 (25) | 5/5 (100) | .004 | 10/23 (43.5) | 1/6 (16.7) | .36 |
| Activated partial thromboplastin time, seconds | n = 54 | n = 41 | n = 13 | .95 | n = 44 | n = 10 | .83 |
| 37.28 ± 8.03 | 37.24 ± 8.24 | 37.40 ± 7.64 | 37.40 ± 8.65 | 36.78 ± 4.67 | |||
| Prothrombin time, s, mean (±SD) | n = 54 | n = 41 | n = 13 | .10 | n = 44 | n = 10 | .26 |
| 11.88 ± 1.33 | 11.71 ± 1.38 | 12.42 ± 1.02 | 11.98 ± 1.42 | 11.45 ± 0.70 | |||
| Myoglobin (ng/mL), mean (±SD) | n = 14 | n = 11 | n = 3 | .29 | n = 12 | n = 2 | .36 |
| 26.50 ± 26.38 | 22.45 ± 24.32 | 41.33 ± 33.86 | 29.25 ± 27.65 | 10.00 ± 1.41 | |||
| CT findings | |||||||
|---|---|---|---|---|---|---|---|
| Local patchy shadowing | 6/67 (9.0) | 6/54 (11.1) | 0/13 (0) | .47 | 6/56(10.7) | 0/11 (0) | .58 |
| Bilateral patchy shadowing | 39/67 (58.2) | 28/54 (51.9) | 11/13 (84.6) | .03 | 37/56 (66.1) | 2/11 (18.2) | .009 |
| Interstitial abnormalities | 4/67 (6.0) | 1/54 (1.9) | 3/13 (23.1) | .03 | 4/56 (7.1) | 0/11 (0) | .83 |
| Ground‐glass opacities | 51/67 (76.1) | 39/54 (72.2) | 12/13 (92.3) | .25 | 49/56 (87.5) | 2/11 (18.2) | <.001 |
| Clinical outcomes | |||||||
|---|---|---|---|---|---|---|---|
| ARDS | 8/73 (11.0) | 0/59 (0) | 8/14 (57.1) | <.001 | 8/61 (13.1) | 0/12 (0) | .41 |
| Acute renal injury | 2/73 (2.7) | 0/59 (0) | 2/14 (14.3) | .04 | 2/61 (3.3) | 0/12 (0) | >.99 |
| Septic shock | 1/73 (1.4) | 0/59 (0) | 1/14 (7.1) | .43 | 1/61 (1.6) | 0/12 (0) | >.99 |
| Coinfections | 16/73 (21.9) | 7/59 (11.9) | 9/14 (64.3) | <.001 | 16/61 (26.2) | 0/12 (0) | .10 |
| More than one complication | 19/73 (26.0) | 7/59 (11.9) | 12/14 (85.7) | <.001 | 19/61 (31.1) | 0/12 (0) | .06 |
| Clinical recovery | 72/73 (98.6) | 59/59 (100) | 13/14 (92.9) | .43 | 60/61 (98.4) | 12/12 (100) | >.99 |
| Cases remained at the hospital | 12/73 (16.4) | 9/59 (15.3) | 3/14 (21.4) | .87 | 11/61 (18.0) | 1/12 (8.3) | .69 |
| Discharged | 61/73 (83.6) | 50/59 (84.7) | 11/14 (78.6) | .87 | 50/61 (82.0) | 11/12 (91.7) | .69 |
| Length of stay for cases discharged, mean (SD), days | n = 57 | n = 46 | n = 11 | .005 | n = 46 | n = 11 | .56 |
| 20.0 ± 5.7 | 19.0 ± 5.4 | 24.2 ± 4.8 | 20.2 ± 5.7 | 19.1 ± 5.6 | |||
Abbreviations: ARDS, acute respiratory distress syndrome; CT, computed tomography; IQR, interquartile range; PaO2:FiO2, ratio of the partial pressure of arterial oxygen to the fraction of inspired oxygen; SD, standard deviation.
None of the infected patients in our cohort had the following clinical characteristics: conjunctival congestion, hemoptysis, throat congestion or swelling, lymphadenopathy, procalcitonin level ≥ 0.5 ng/mL, a complication of rhabdomyolysis, or disseminated intravascular coagulation, or death.
Incubation times were estimated by assessing patients with available data. Those with asymptomatic infections (n = 4) or index cases without a clear history of exposure (n = 20) were excluded from the analyses.
Lymphopenia: Lymphocyte count <1500/µl.
Thrombocytopenia: Platelet count <150.000/µl.
Compared to the nonsevere cases, patients with severe COVID‐19 were significantly older and were more likely to have a history of smoking or pre‐existing chronic conditions. Severe cases were significantly more common among men than women. Characteristics of severe COVID‐19 included fever (temperature ≥ 38°C), shortness of breath, oxygen saturation less than 93%, lower PaO2/FiO2, lymphopenia, hyponatremia, hypochloremia, elevated creatinine kinase, elevated LDH, elevated aspartate aminotransferase, and d‐dimer levels ≥ 0.5 mg/L. In the multivariate competing risks model, the independent predictors of severe disease included: history of smoking (odds ratio [aOR]: 28.32; 95% CI: 3.24–247.50), shortness of breath (aOR: 20.12; 95% CI: 3.19–126.76), and pre‐existing chronic diseases (aOR = 6.00; 95% CI: 1.20–29.94).
There was no significant difference in the frequency of SARS‐CoV‐2 infection among children and adults (55% [12/22] and 72% [41/57], respectively, p = .14), but children were less likely than adults to develop the symptomatic disease (46% [10/22] and 68% [39/57], respectively, p = .06). None of the children developed severe COVID‐19. Although the mean incubation time in children was similar to that in adults, a lower proportion of children had pre‐existing chronic conditions, fatigue, multiple symptoms, lymphopenia, hyperkinemia, hypochloremia, or an elevated C‐reactive protein level (Table 3). However, there was no significant difference in the mean duration from symptom onset to recovery between children and adults (19.1 ± 5.6 days vs 11.8 ± 6.5 days; p = .75).
4. DISCUSSION
We examined a cohort of 99 individuals from 20 households and determined the incidence of secondary cases of SARS‐CoV‐2 infection and COVID‐19, the proportion of individuals with severe COVID‐19, and the case‐fatality rate among household contacts. Recent studies suggest that SARS‐CoV‐2 is transmitted primarily through respiratory droplets expelled from coughing, talking, and sneezing. 13 Data on influenza have demonstrated that airborne viruses are transmitted by touching inanimate objects covered with the virus and then touching the nose or eye. 15 The same may apply to SARS‐CoV‐2 transmission. In the epidemiological data analyses, we observed that handwashing at least five times per day was associated with a reduced risk of infection. Our study is the largest cohort in China to provide evidence on the transmissibility of SARS‐CoV‐2 and outcomes after household contact with an individual with COVID‐19. A previous study by Jing et al. 20 found that patients aged more than 60 years were most susceptible to household infection of SARS‐CoV‐2. However, the transmissibility of the virus was during the incubation periods was less than that in the period of overt disease. When compared the household data on COVID‐19 with those of SARS or MERS, COVID‐19 infection seems more transmissible than SARS and MERS in the households. The secondary attack rates were estimated to be 10.2%–17.1% for COVID‐19 in China. In contrast, the estimated rates were 6.2% and 4.0% for SARS in China and for MERS in Saudi Arabia, respectively. 7 , 21 In addition, our study results suggest that maintaining hand hygiene is effective in reducing the risk of SARS‐CoV‐2 infection among household contacts. In our study, the proportion of household contacts who developed SARS‐CoV‐2 infection, symptomatic COVID‐19, and severe COVID‐19 were 67%, 62%, and 10%, respectively. Among family members who were exposed to the index cases and became infected, if we calculated the percentage of severe cases (n = 8) among COVID‐19 patients (n = 49), the proportion of severe cases (16.3%) was similar to that (15.7%) found in a study conducted by Guan et al. 3 (patient exposure routes were mainly in the community setting). The case‐fatality rate of 1.9% among the secondary cases with confirmed SARS‐CoV‐2 infection was lower than that reported (2.3%–3.4%) in previous studies. 4 , 22 None of the previous studies have reported all the cases of SARS‐CoV‐2 infection in the community, and it is likely that many cases were not included in these studies because they were undetected. In addition, children were underrepresented in previous studies as they often have mild infections and do not require healthcare. 2 , 3 , 8 , 9 , 22 , 23 , 24 Therefore, our results provide a more reliable estimate of the case‐fatality rate since we studied all cases of infection and followed them until their recovery or death.
Patients with asymptomatic infection remain a major concern regarding SARS‐CoV‐2 transmission. Many published studies have presented the epidemiologic and clinical features of patients with COVID‐19 admitted to hospitals. 3 , 8 , 9 , 10 , 11 , 12 However, these cohorts only investigated the pathogenicity of SARS‐CoV‐2 and the case‐fatality rates of COVID‐19. The asymptomatic SARS‐CoV‐2 infection was first largely reported on the Diamond Princess Cruise ship, where an estimated 17.9% of cases were asymptomatic on the board. 25 Buitrago‐Garcia et al. 26 reported that the overall estimate of the proportion of asymptomatic was 20% with a prediction interval of 3%–67% and the secondary attack rate was lower in contacts of people with asymptomatic infection than those with symptomatic infection in their living systematic review. The incidence of asymptomatic infection requires further investigation. In a recent publication, Sahu et al. 13 outlined the process of the viral transmission from a person to others into 4 potential categories. These included presymptomatic transmission (incubation period), asymptomatic transmission (index patients never have symptoms), symptomatic transmission, and environmental/community transmission (unable to trace the contact). Further efforts could be made on the prevention of COVID‐19 transmission by initiating the stepwise contact tracing protocol, which includes a discussion with the index patients and obtaining details of all individual encounters, contacting all encounters with assessing the risk of exposure, creating interventional plans stratified by the exposure risk for all encounters, and execution of the plan with clear instructions of when and how to complete the quarantine period. In our study, since our focus was on the transmission of the family cluster, our data reflects the local practice patterns on contract tracing among the transmission within the household and family members, which did not include all encounters of the index cases. 13 In the clinical data analyses, we identified the following independent predictors for developing severe COVID‐19: shortness of breath as an initial symptom, pre‐existing chronic conditions, and a history of smoking. Patients with such characteristics should be considered for close monitoring in the hospital, ideally for a period of 18 days based on the maximum time for recovery in our study. Further studies are needed to determine methods for the prevention of SARS‐CoV‐2 infection among children in the household setting. 17 Since none of the children had severe COVID‐19, our data supported the approach of medical monitoring without hospital admission for children, unless they are younger than one year.
Our study had several limitations. In the comparisons of severe and nonsevere cases, and adults and children, findings that lack statistical significance should be interpreted with caution because of the relatively small sample size and limited statistical power. Nonsignificant p values do not necessarily rule out a clinically or epidemiologically important difference between groups, and these differences should be further determined by more quantitative assessments in future studies. However, several important associations, including handwashing and predictors of severe COVID‐19, were statistically significant, and these findings have important implications for the prevention of SARS‐CoV‐2 infection and the treatment of COVID‐19. Although our study has the inherent limitations of the retrospective study design and relatively small sample size, it is by the larger study on household transmission conducted to date, and household transmission has epidemiological features that are distinct from those of community transmission. Further investigations are needed to understand if the transmission of SARS‐CoV‐2 in families can be reduced by the household members wearing facemasks. Data from household contact studies have indicated that asymptomatic infections indeed occur, and evidence from laboratory and epidemiological suggest that asymptomatic individuals may be as likely as individuals with symptoms to transmit SARS‐CoV‐2 to others. 27 The transmission from asymptomatic individuals was estimated to account for more than half of all transmission. The identification and isolation of persons with asymptomatic COVID‐19 will play an important role in reducing the spread of SARS‐CoV‐2.
In summary, SARS‐CoV‐2 has a high frequency of transmission among household contacts. In our patient cohort, the estimated R 0 was 2.00, which is similar to the transmissibility of SARS‐CoV‐2 in the household to that reported in community outbreaks. Household contact led to 67% of the family members being infected with SARS‐CoV‐2 in this study. Isolating a patient with infection at home may lead to further spread of infection and it may be preferable to send individuals with mild disease to a designated facility with appropriate levels of patient support (in nonhospital setting) after confirming the infection. The study also provides empirical evidence supporting public health messaging about handwashing as a preventive measure. Our data can also be adopted in the statistical models used for estimating disease scale and severity in community settings, where household outbreaks are dominant.
AUTHOR CONTRIBUTIONS
Calvin Q. Pan and Wen Xie conceived the study. Calvin Q. Pan designed the study and interpreted the data and wrote the manuscript. Wen Xie supervised the data collection. Wen Xie and Zhihai Chen had roles in clinical management and patient recruitment, and formulated the treatment regimens. Qi Wang, Meihua Song, Ying Cao, and Lin Wang contributed to data collection and data entry. Calvin Q. Pan and Ying Cao performed the statistics. All authors reviewed and approved the final version of the manuscript. Calvin Q. Pan is the guarantor. The corresponding author attests that all listed authors meet authorship criteria and that no others meeting the criteria have been omitted.
ETHICS STATEMENT
The study protocol was approved by the Institutional Review Board of Beijing Ditan Hospital, Capital Medical University in Beijing (approval number: 2020‐015‐01). The requirement for informed consent was waived because the study was retrospective and posed minimal risk to the individuals included in the analysis.
INFORMED CONSENT
The requirement for informed consent was waived because the study was retrospective and had minimal risk.
Supporting information
Supporting information.
ACKNOWLEDGMENTS
The authors would like to thank all physicians who participated in the management of these patients; Dr Ruming Xie and Dr Budong Chen (Beijing Ditan Hospital, Capital Medical University, China) for the verification of findings on our study patients; biostatistician, Dr Yueh Wang (IQVIA, Taipei City); and epidemiologist, Dr. Aritra Das (IQVIA, Kolkata, India) for their assistance on the statistic work of calculating epidemiologic parameters; Ms. Bonita Pan (Fiorello H LaGuardia High School, New York) for statistical assistance and proofreading the manuscript.
Xie W, Chen Z, Wang Q, et al. Infection and disease spectrum in individuals with household exposure to SARS‐CoV‐2: a family cluster cohort study. J Med Virol. 2021;93:3033–3046. 10.1002/jmv.26847
DATA AVAILABILITY STATEMENT
The data that support the findings of this study are available from the corresponding author on reasonable request. Participant data without names and identifiers may be shared with other researchers after approval from the corresponding author and the authorities, including the Institutional Review Board and the National Health Commission. A proposal with a detailed description of study objectives and a statistical analysis plan will be needed for evaluation of the reasonability to request for our data. The corresponding author will make a decision based on these materials.
REFERENCES
- 1. Zhu N, Zhang D, Wang W, et al. A novel coronavirus from patients with pneumonia in China, 2019. N Engl J Med. 2020;382(8):727‐733. [DOI] [PMC free article] [PubMed] [Google Scholar]
- 2. Li Q, Guan X, Wu P, et al. Early transmission dynamics in Wuhan, China, of novel coronavirus‐infected pneumonia. N Engl J Med. 2020;382(13):1199‐1207. [DOI] [PMC free article] [PubMed] [Google Scholar]
- 3. Guan W, Ni Z, Hu Y, et al. Clinical characteristics of coronavirus disease 2019 in China. N Engl J Med. 2020;382(18):1708‐1720. [DOI] [PMC free article] [PubMed] [Google Scholar]
- 4. Wu Z, McGoogan JM. Characteristics of and important lessons from the coronavirus disease 2019 (COVID‐19) outbreak in China: summary of a report of 72314 cases from the Chinese Center for Disease Control and Prevention. JAMA. 2020;323(13):1239‐1242. [DOI] [PubMed] [Google Scholar]
- 5.World Health Organization. Laboratory testing for 2019 novel coronavirus (2019‐nCoV) in suspected human cases. https://www.who.int/health-topics/coronavirus/laboratory-diagnostics-for-novelcoronavirus
- 6. Chan‐Yeung M, Xu RH. SARS: epidemiology. Respirology. 2003;8 Suppl(Suppl 1):S9‐S14. [DOI] [PMC free article] [PubMed] [Google Scholar]
- 7. Drosten C, Meyer B, Müller MA, et al. Transmission of MERS‐coronavirus in household contacts. N Engl J Med. 2014;371(9):828‐835. [DOI] [PubMed] [Google Scholar]
- 8. Chen N, Zhou M, Dong X, et al. Epidemiological and clinical characteristics of 99 cases of 2019 novel coronavirus pneumonia in Wuhan, China: a descriptive study. Lancet. 2020;395(10223):507‐513. [DOI] [PMC free article] [PubMed] [Google Scholar]
- 9. Huang C, Wang Y, Li X, et al. Clinical features of patients infected with 2019 novel coronavirus in Wuhan, China. Lancet. 2020;395(10223):497‐506. [DOI] [PMC free article] [PubMed] [Google Scholar]
- 10. Lei J, Li J, Li X, Qi XCT. Imaging of the 2019 novel coronavirus (2019‐nCoV) pneumonia. Radiology. 2020;295(1):18. [DOI] [PMC free article] [PubMed] [Google Scholar]
- 11. Holshue ML, DeBolt C, Lindquist S, et al. First case of 2019 novel coronavirus in the United States. N Engl J Med. 2020;382(10):929‐936. [DOI] [PMC free article] [PubMed] [Google Scholar]
- 12. Wei M, Yuan J, Liu Y, Fu T, Yu X, Zhang ZJ. Novel coronavirus infection in hospitalized infants under 1 year of age in China. JAMA. 2020;323(13):1313‐1314. [DOI] [PMC free article] [PubMed] [Google Scholar]
- 13. Sahu KK, Kumar R. Preventive and treatment strategies of COVID‐19: From community to clinical trials. J Family Med Prim Care. 2020;9(5):2149‐2157. [DOI] [PMC free article] [PubMed] [Google Scholar]
- 14. Bai Y, Yao L, Wei T, et al. Presumed asymptomatic carrier transmission of COVID‐19. JAMA. 2020;323(14):1406‐1407. [DOI] [PMC free article] [PubMed] [Google Scholar]
- 15. Rothe C, Schunk M, Sothmann P, et al. Transmission of 2019‐nCoV infection from an asymptomatic contact in Germany. N Engl J Med. 2020;382(10):970‐971. [DOI] [PMC free article] [PubMed] [Google Scholar]
- 16. Pan X, Chen D, Xia Y, et al. Asymptomatic cases in a family cluster with SARS‐CoV‐2 infection. Lancet Infect Dis. 2020;20(4):410‐411. [DOI] [PMC free article] [PubMed] [Google Scholar]
- 17. Li W, Zhang B, Lu J, et al. Characteristics of household transmission of COVID‐19. Clin Infect Dis. 2020;71(8):1943‐1946. [DOI] [PMC free article] [PubMed] [Google Scholar]
- 18. Wang Z, Ma W, Zheng X, Wu G, Zhang R. Household transmission of SARS‐CoV‐2. J Infect. 2020;81(1):179‐182. [DOI] [PMC free article] [PubMed] [Google Scholar]
- 19. Rathore V, Galhotra A, Pal R, Sahu KK. COVID‐19 pandemic and children: A review. J Pediatr Pharmacol Ther. 2020;25(7):574‐585. [DOI] [PMC free article] [PubMed] [Google Scholar]
- 20. Jing QL, Liu MJ, Zhang ZB, et al. Household secondary attack rate of COVID‐19 and associated determinants in Guangzhou, China: a retrospective cohort study. Lancet Infect Dis. 2020;20(10):1141‐1150. [DOI] [PMC free article] [PubMed] [Google Scholar]
- 21. Centers for Disease Control and Prevention . Efficiency of quarantine during an epidemic of severe acute respiratory syndrome‐‐Beijing, China, 2003. MMWR Morb Mortal Wkly Rep. 2003;52(43):1037‐1040. [PubMed] [Google Scholar]
- 22.WHO. WHO Director‐General's Opening Remarks at the Media Briefing on COVID‐19; 2020. https://www.who.int/dg/speeches/detail/who-director-general-s-opening-remarks-at-the-media-briefing-on-covid-19---19-january-2020. Assessed January 19 2021.
- 23. Bi Q, Wu Y, Mei S, et al. Epidemiology and transmission of COVID‐19 in 391 cases and 1286 of their close contacts in Shenzhen, China: a retrospective cohort study. Lancet Infect Dis. 2020;20(8):911‐919. [DOI] [PMC free article] [PubMed] [Google Scholar]
- 24. WHO . Novel Coronavirus (2019‐nCoV) situation reports. https://www.who.int/emergencies/diseases/novel-coronavirus-2019/situation-reports. Accessed January 19 2021.
- 25. Mizumoto K, Kagaya K, Zarebski A, Chowell G. Estimating the asymptomatic proportion of coronavirus disease 2019 (COVID‐19) cases on board the Diamond Princess cruise ship, Yokohama, Japan, 2020. Euro Surveill. 2020;25(10):2000180. [DOI] [PMC free article] [PubMed] [Google Scholar]
- 26. Buitrago‐Garcia D, Egli‐Gany D, Counotte MJ, et al. Occurrence and transmission potential of asymptomatic and presymptomatic SARS‐CoV‐2 infections: a living systematic review and meta‐analysis. PLoS Med. 2020;17(9):e1003346. [DOI] [PMC free article] [PubMed] [Google Scholar]
- 27. Johansson MA, Quandelacy TM, Kada S, et al. SARS‐CoV‐2 transmission from people without COVID‐19 symptoms. JAMA Netw Open. 2021;4(1):e2035057. [DOI] [PMC free article] [PubMed] [Google Scholar]
Associated Data
This section collects any data citations, data availability statements, or supplementary materials included in this article.
Supplementary Materials
Supporting information.
Data Availability Statement
The data that support the findings of this study are available from the corresponding author on reasonable request. Participant data without names and identifiers may be shared with other researchers after approval from the corresponding author and the authorities, including the Institutional Review Board and the National Health Commission. A proposal with a detailed description of study objectives and a statistical analysis plan will be needed for evaluation of the reasonability to request for our data. The corresponding author will make a decision based on these materials.