

Abstract
A meta‐analysis was performed to identify patients with coronavirus disease 2019 (COVID‐19) presenting with gastrointestinal (GI) symptoms during the first and second pandemic waves and investigate their association with the disease outcomes. A systematic search in PubMed, Scopus, Web of Science, ScienceDirect, and EMBASE was performed up to July 25, 2020. The pooled prevalence of the GI presentations was estimated using the random‐effects model. Pairwise comparison for the outcomes was performed according to the GI manifestations' presentation and the pandemic wave of infection. Data were reported as relative risk (RR), or odds ratio and 95% confidence interval. Of 125 articles with 25,252 patients, 20.3% presented with GI manifestations. Anorexia (19.9%), dysgeusia/ageusia (15.4%), diarrhea (13.2%), nausea (10.3%), and hematemesis (9.1%) were the most common. About 26.7% had confirmed positive fecal RNA, with persistent viral shedding for an average time of 19.2 days before being negative. Patients presenting with GI symptoms on admission showed a higher risk of complications, including acute respiratory distress syndrome (RR = 8.16), acute cardiac injury (RR = 5.36), and acute kidney injury (RR = 5.52), intensive care unit (ICU) admission (RR = 2.56), and mortality (RR = 2.01). Although not reach significant levels, subgroup‐analysis revealed that affected cohorts in the first wave had a higher risk of being hospitalized, ventilated, ICU admitted, and expired. This meta‐analysis suggests an association between GI symptoms in COVID‐19 patients and unfavorable outcomes. The analysis also showed improved overall outcomes for COVID‐19 patients during the second wave compared to the first wave of the outbreak.
Keywords: COVID‐19, GIT, meta‐analysis, pandemic, SARS‐CoV‐2
Highlights
-
•
Gastrointestinal (GI) symptoms in COVID‐19 patients were associated with unfavorable outcomes.
-
•
Cases presenting with GI symptoms on admission were more subjected to complications.
-
•
GI cohorts of COVID‐19 cases showed a double risk of ICU admission and mortality.
-
•
Overall outcomes for COVID‐19 patients during the second wave showed improvement compared to the first wave of the outbreak.
1. INTRODUCTION
The coronavirus disease 2019 (COVID‐19) pandemic has demonstrated the deadly impact of a highly transmissible, novel respiratory pathogen infecting humans. 1 Much of the initial response to the pathogen was centered around finding ways to prevent patients from developing severe respiratory symptoms, often with poor outcomes. 2 The patients' risk for developing complications was comorbid conditions or abnormal laboratory values on presentation. 3 , 4 The typical symptoms of the illness are fever, dry cough, loss of taste or smell, fatigue, and shortness of breath. While acute respiratory manifestations of the disease are still the focal point of clinical research, the Centers for Disease Control and Prevention reports that gastrointestinal (GI) symptoms may be indicators of COVID‐19 infection. 5 Also, viral shedding in the feces of infected patients is not uncommon. 6 There are conflicting reports of the significance of GI symptoms in predicting the outcome of patients with COVID‐19. Therefore, GI symptoms have not been used as a predictive tool by healthcare providers. 7 , 8
However, we believe the further analysis is indicated for several reasons. First, GI pathology in COVID‐19 infections is attributed to the angiotensin‐converting enzyme‐2 (ACE‐2) receptor expressed in epithelial cells of the GI tract, which mediates direct viral entry and damage. 5 , 6 Second, the gut‐lung axis is thought to play a role in indirect GI damage via the exaggerated immune reaction typical in these patients. 6 Third, respiratory viruses have been demonstrated to increase CD4+ T‐cell entry into the small intestine leading to a surge of cytokine release. 9 Fourth, hepatocytes also express the ACE‐2 receptor, which may play a role in acute liver injuries often seen in hospitalized patients with COVID‐19. 10 Lastly, the fecal–oral transmission may be a major source of spread, particularly in healthcare settings. 11
In this sense, the purpose of this meta‐analysis is to analyze patients with COVID‐19 in terms of the presence of GI symptoms and its potential contribution to the outcomes of the disease. We also compared the differences in presentation and outcome between the first and the second wave of patients with COVID‐19.
2. METHODS
2.1. Search strategy
The study protocol was based on the Preferred Reporting Items for Systematic Reviews and Meta‐Analyses guidelines. 12 A comprehensive literature search of all eligible articles was conducted by two reviewers (RME and RM) utilizing the electronic medical databases; Web of Science, PubMed, Scopus, Science Direct, and Embase up to July 25, 2020. The subsequent set of MeSH terms and keywords related to gastrointestinal manifestations and COVID‐19 were applied, including (“2019‐ncov,” “SARS‐COV‐2,” “Wuhan coronavirus,” OR “COVID‐19”) AND (“Gastrointestinal manifestations,” “Gastrointestinal symptoms,” “Gastrointestinal presentations,” “GI symptoms,” “Digestive symptoms,” “Gastric symptoms,” “Digestive manifestations,” “Gastrointestinal features” OR “Gastrointestinal involvement”) AND (“Viral shedding,” “Fecal shedding,” “Feces,” OR “Fecal oral”). No language, time, and/or country limitations have been applied. We also screened manually the references list of articles for potentially relevant articles.
2.2. Eligibility criteria
We screened the records against the following inclusion criteria: (a) study population: patients with COVID‐19 (including adult, but not pediatric and/or pregnant women) enclosing data on gastrointestinal manifestations such as diarrhea, vomiting, nausea, abdominal pain, anorexia, dysgeusia/ageusia, heartburn, constipation, hemoptysis, hematochezia, hematemesis, melena or fecal occult blood or underwent fecal shedding screening using fecal RNA reverse‐transcription polymerase chain reaction (RT‐PCR). (b) Study design: Observational studies including case series, prospective/retrospective cohort studies, and case–control studies. (c) Articles reporting original enough data demographics, laboratory values, and/or outcomes. (d) Peer‐reviewed articles. We excluded articles with the following characteristics: (a) pediatric and/or pregnant women, (b) case reports, case series with sample size less than five patients, (c) duplicate data, (d) reviews, editorial materials, non‐peer‐reviewed articles, and preprint versions, and (e) articles reporting irrelevant, or insufficient data.
2.3. Definitions and subgroup analysis
Positive GI cases were those who had at least one of the following gastrointestinal symptoms: anorexia, nausea, vomiting, diarrhea, abdominal pain, recent‐onset constipation, heartburn, dysgeusia/ageusia, hematemesis, hematochezia, and/or melena. Non‐GI controls were defined as asymptomatic cohorts or presenting with respiratory and/or neurologic and/or systemic symptoms, not including any reported GI symptoms. Patients with a severe phenotype should meet at least one of the following three criteria: (a) respiratory distress and respiratory rate higher than 30 per minute; (b) fingertip blood oxygen saturation less than 93% during rest; (c) partial arterial oxygen pressure (PaO2)/fraction of inspiration oxygen (FiO2) ≤ 300 mmHg. 13
Regarding pairwise meta‐analysis, we conducted five comparisons, including (1) severe patients with COVID‐19 versus non‐severe ones; (2) hospitalized patients versus discharged cases; (3) ICU admission patients versus floor hospitalization patients; (4) nonsurvived patients versus survived; and (5) finally COVID‐19 patients with positive fecal RNA RT‐PCR versus negative cases.
In addition, a subgroup analysis was performed according to the publication date to investigate a potential difference between the first and second waves of the pandemic. The former was defined as patients infected with COVID‐19 before May 15, 2020. The latter was defined as patients infected with COVID‐19 at or after May 16, 2020. 14 , 15 May 15 was selected for two reasons: It is closest to the median date of publication of the included 126 studies. It is approximately the date of various re‐opening strategies in many geographic areas. Also, studies were categorized according to geographic distribution into Asian and non‐Asian studies.
2.4. Data extraction and covariate assessment
Independent investigators (AE, MHA, MMS, MO, RM, NM, and ASA) abstracted the reported data in a pre‐specified excel sheet. Studies' characteristics, patient demographics, and clinical presentation, comorbid conditions, and results of laboratory testing were also retrieved. Complications such as acute respiratory distress syndrome (ARDS), acute cardiac injury, arrhythmias, acute liver injury, acute kidney injury (AKI), shock, and sepsis, degree of severity, intensive care unit (ICU) admission, treatment protocols, length of hospital stay, and outcomes were collected. RME has revised the whole extracted data and resolved any dissonance.
2.5. Data synthesis and statistical analysis
All statistical analyses were processed with Comprehensive Meta‐Analysis version 3.0 and STATA 16.0, and the results were considered significant at a p value less than .05. Related events or means and standard deviations (SDs) of each arm were extracted. Other statistical variable data, like median and interquartile range (IQR), were converted to means and SDs. One‐arm meta‐analysis was first performed using the Continuous Random‐effects model and the DerSimonian–Laird method. The pooled mean effect size and proportion were estimated for quantitative and binary data, respectively. Next, a two‐arms meta‐analysis was performed to compare clinical outcomes and admission outcomes between cohorts presented with gastrointestinal manifestations and those without gastrointestinal symptoms. Data were reported as standardized mean difference (SMD), relative risk (RR), or odds ratio (OR), and 95% confidence interval (CI).
Heterogeneity was quantified by using I 2 statistics. Articles were considered to have significant heterogeneity between studies when the p value less than .1 or I 2 greater than 50%. 16 Subgroup analysis by the pandemic wave of infection (first/early wave vs. second/late wave) and ethnicity (Asian, American, European, and Mexican) was carried out. Random‐effects Meta‐regression was performed to identify the influence of potential effect modifiers on the pooled results and explain the heterogeneity between studies. Covariates as geographical distribution and date of publication were employed. Also, publication bias was evaluated by Egger's regression test. 17
3. RESULTS
3.1. Characteristics of included studies
Systematic search as depicted in Figure 1A yield 125 eligible publications, including 25,252 participants. 18 , 19 , 20 , 21 , 22 , 23 , 24 , 25 , 26 , 27 , 28 , 29 , 30 , 31 , 32 , 33 , 34 , 35 , 36 , 37 , 38 , 39 , 40 , 41 , 42 , 43 , 44 , 45 , 46 , 47 , 48 , 49 , 50 , 51 , 52 , 53 , 54 , 55 , 56 , 57 , 58 , 59 , 60 , 61 , 62 , 63 , 64 , 65 , 66 , 67 , 68 , 69 , 70 , 71 , 72 , 73 , 74 , 75 , 76 , 77 , 78 , 79 , 80 , 81 , 82 , 83 , 84 , 85 , 86 , 87 , 88 , 89 , 90 , 91 , 92 , 93 , 94 , 95 , 96 , 97 , 98 , 99 , 100 , 101 , 102 , 103 , 104 , 105 , 106 , 107 , 108 , 109 , 110 , 111 , 112 , 113 , 114 , 115 , 116 , 117 , 118 , 119 , 120 , 121 , 122 , 123 , 124 , 125 , 126 , 127 , 128 , 129 , 130 , 131 , 132 , 133 , 134 , 135 , 136 , 137 , 138 , 139 , 140 , 141 Articles were published in 11 countries, predominated by China (101 studies; Figure 1B). They were published from January 24 to July 25, 2020, covering the two COVID‐19 pandemic waves. The sample size ranged from 6 to 1452 per article. The basic characteristics of the 125 articles used for one‐arm meta‐analysis are listed in Table 1. For pairwise comparisons, 60 articles compared the clinical data, laboratory features, and outcomes of COVID‐19 patients with and without GI symptoms (Table 2). 18 , 24 , 29 , 34 , 36 , 40 , 42 , 43 , 44 , 45 , 46 , 47 , 50 , 51 , 53 , 54 , 58 , 60 , 62 , 64 , 65 , 67 , 70 , 73 , 74 , 77 , 80 , 81 , 83 , 86 , 87 , 89 , 91 , 92 , 93 , 94 , 95 , 96 , 98 , 99 , 102 , 110 , 111 , 116 , 117 , 118 , 119 , 121 , 122 , 123 , 124 , 130 , 132 , 133 , 142 Of these, 26 studies compared severe/critical COVID‐19 patients versus mild cases, 18 , 34 , 43 , 44 , 46 , 47 , 51 , 53 , 62 , 67 , 70 , 73 , 74 , 77 , 92 , 93 , 98 , 99 , 102 , 111 , 117 , 118 , 119 , 121 , 122 , 133 four articles compared between hospitalized patients and those not required hospitalization, 45 , 80 , 89 , 142 five studies compared ICU admitted patients versus floor hospitalization, 50 , 80 , 96 , 116 , 142 11 publications compared between those who died with those who survived, 29 , 34 , 58 , 60 , 83 , 91 , 94 , 110 , 117 , 123 , 137 three articles reported the comparison between COVID‐19 patients with positive versus negative fecal shedding, 36 , 65 , 130 and of the remaining 14 studies comparing cohorts with and without GI symptoms. 24 , 40 , 42 , 46 , 54 , 64 , 81 , 86 , 87 , 95 , 101 , 124 , 133 , 138
Figure 1.
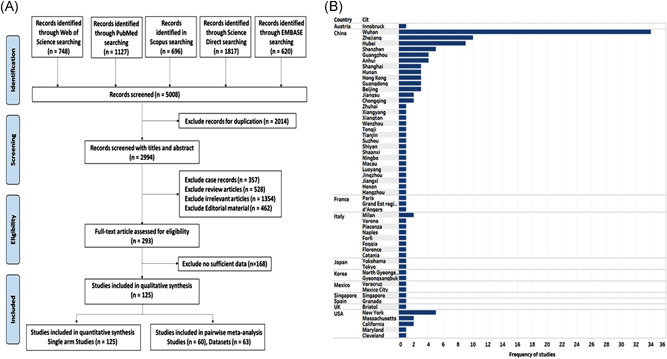
Selection of eligible studies and their geographic region. (A) Flowchart for systematic literature search (B) Mapping the geographic distribution of the studies
Table 1.
Characteristics of the included studies in the single‐arm meta‐analysis
| First author | Publication date | Study location | Country | Geographic distribution | Study design | Sample size | Age, years, mean ± SD | Sex (% male) | GI symptoms (number) | ||||
|---|---|---|---|---|---|---|---|---|---|---|---|---|---|
| Diarrhea | Vomiting | Nausea | Abd pain | Anorexia | |||||||||
| Aghemo A 19 | 11‐May | Milan | Italy | European | Retrospective | 292 | 65.0 ± 14.1 | 68.15 | 69 | 11 | – | – | – |
| Ai J 20 | 9‐Jun | Xiangyang | China | Asian | Retrospective | 7 | 54.1 ± 15.5 | 57.14 | 6 | 2 | 4 | 6 | 7 |
| Annweiler C 21 | 18‐Jun | d'Angers | France | European | Retrospective | 353 | 84.7 ± 7.0 | 45.33 | 77 | 22 | 22 | – | – |
| Barillari M 22 | 25‐Jul | Multiple | Italy | European | Observational multicenter | 294 | 42.1 ± 12.3 | 50.00 | 81 | 42 | 42 | 37 | 84 |
| Cai Q 23 | 18‐Mar | Shenzhen | China | Asian | Open‐Label nonrandomized Control | 80 | 47.9 ± 18.7 | 43.75 | 1 | – | – | – | – |
| Cao C 24 | 15‐Jun | Ningbo, Jingzhou Hubei | China | Asian | Retrospective | 157 | 49.3 ± 14.5 | 47.13 | 25 | – | 21 | – | 47 |
| Cavaliere K 25 | 20‐Apr | New York | USA | American | Retrospective | 6 | 67.8 ± 12.4 | 50.00 | – | – | – | – | – |
| Chang D 26 | 17‐Mar | Beijing | China | Asian | Retrospective | 13 | 38.7 ± 10.4 | 76.92 | 1 | – | – | – | – |
| Chang D 27 | 20‐Jun | Beijing | China | Asian | Retrospective | 67 | 46.6 ± 15.8 | 56.72 | 6 | – | – | – | – |
| Chen A 28 | 16‐May | Maryland | USA | American | Prospective Case‐Control | 101 | 48.3 ± 14.7 | 40.59 | 51 | 14 | 30 | 26 | 54 |
| Chen F 29 | 8‐Jul | Wuhan | China | Asian | Retrospective | 681 | 63.7 ± 13.3 | 53.16 | 119 | – | – | – | – |
| Chen J 30 | 19‐Mar | Shanghai | China | Asian | Retrospective | 249 | 50.3 ± 20.7 | 50.60 | 8 | – | – | – | 8 |
| Chen L 31 | 13‐May | Guangdong | China | Asian | Retrospective | 51 | 59.5 ± 13.6 | 66.67 | 3 | – | – | – | – |
| Chen M 32 | 13‐May | Hubei | China | Asian | Retrospective | 11 | 48.4 ± 14.1 | 72.73 | 2 | – | 3 | – | – |
| Chen N 33 | 30‐Jan | Wuhan | China | Asian | Retrospective | 99 | 55.5 ± 13.1 | 67.68 | 2 | 1 | 1 | – | – |
| Chen R 34 | 11‐May | Multi provinces | China | Asian | Retrospective | 548 | 56.0 ± 14.5 | 57.12 | 14 | 18 | – | – | – |
| Chen X 35 | 30‐Jun | Guangzhou | China | Asian | Retrospective | 267 | 48.3 ± 20.7 | 45.32 | 19 | 7 | 14 | – | 47 |
| Chen Y 36 | 3‐Apr | Wuhan | China | Asian | Retrospective | 42 | 51.9 ± 14.3 | 35.71 | 7 | 3 | 4 | – | – |
| Cholankeril G 142 | 10‐Jun | California | USA | American | Retrospective | 207 | 49.3 ± 22.9 | 50.24 | 22 | 22 | 22 | 14 | – |
| Cholankeril G 37 | 10‐Apr | California | USA | American | Retrospective | 116 | 50.7 ± 23.7 | 53.45 | 12 | 12 | 12 | 10 | 22 |
| Deng W 38 | 19‐Jun | Chongqing | China | Asian | Retrospective | 61 | 54.8 ± 12.9 | 40.98 | 3 | – | – | – | – |
| Duan X 39 | 26‐May | Luoyang | China | Asian | Retrospective | 25 | 52.0 ± 19.3 | 60.00 | 2 | 1 | 1 | – | 3 |
| Effenberger M 40 | 20‐Apr | Innsbruck | Austria | European | Retrospective | 40 | 65.4 ± 15.1 | 60.00 | 22 | 5 | 11 | – | – |
| Fang Z 41 | 21‐Mar | Xiangtan | China | Asian | Retrospective | 32 | 43.0 ± 14.8 | 50.00 | 3 | – | – | – | – |
| Ferm S 42 | 1‐Jun | New York | USA | American | Retrospective | 892 | 59.3 ± 18.5 | 59.87 | 177 | 91 | 148 | 70 | 105 |
| Fu J 43 | 6‐May | Suzhou | China | Asian | Retrospective | 75 | 46.0 ± 14.0 | 60.00 | 6 | – | – | – | – |
| Guan W 44 | 28‐Feb | Multi provinces | China | Asian | Retrospective | 1099 | 46.7 ± 17.1 | 57.96 | 42 | 55 | 55 | – | – |
| Hajifathalian K 45 | 8‐May | New York | USA | American | Retrospective | 1059 | 61.1 ± 18.3 | 57.70 | 234 | 91 | 168 | 72 | 240 |
| Han C 46 | 15‐Apr | Wuhan | China | Asian | Retrospective | 206 | 60.5 ± 48.1 | 44.17 | 67 | 24 | – | 9 | 70 |
| Han J 47 | 25‐Jun | Tianjin | China | Asian | Retrospective | 185 | 44.0 ± 17.9 | 51.35 | 11 | – | – | – | – |
| Hong L 48 | 24‐Jun | Zhejiang | China | Asian | Retrospective | 127 | 45.7 ± 51.1 | 55.91 | 13 | 5 | 5 | – | 38 |
| Hu J 49 | 28‐May | Zhejiang | China | Asian | Retrospective | 884 | 46.0 ± 14.4 | 51.47 | 71 | 31 | 31 | – | – |
| Huang C 50 | 24‐Jan | Wuhan | China | Asian | Retrospective | 41 | 49.3 ± 12.6 | 73.17 | 1 | – | – | – | – |
| Huang M 51 | 1‐Jun | Jiangsu | China | Asian | Retrospective | 60 | 60.0 ± 52.6 | 58.33 | 4 | 2 | 2 | – | – |
| Jehi L 52 | 10‐Jun | Cleveland | USA | American | Prospective | 1108 | 52.3 ± 19.9 | 49.91 | 185 | 129 | – | – | 216 |
| Jin A 53 | 12‐May | Beijing | China | Asian | Retrospective | 45 | 58.8 ± 20.1 | 40.00 | – | 1 | 2 | – | 5 |
| Jin X 54 | 24‐Mar | Zhejiang | China | Asian | Retrospective | 651 | 45.1 ± 14.4 | 50.84 | – | – | – | – | – |
| Kaafarani H 55 | 1‐May | Massachusetts | USA | American | Retrospective | 141 | 58.0 ± 17.1 | 65.25 | 42 | 31 | 31 | 21 | – |
| Lapostolle F 56 | 30‐May | Paris | France | European | Prospective observational | 1452 | 42.9 ± 18.1 | 48.21 | 352 | 168 | 288 | – | 305 |
| Lei Z 57 | 9‐Apr | Guangzhou | China | Asian | Retrospective | 119 | 53.4 ± 13.2 | 64.71 | 7 | 4 | 4 | – | – |
| Leung C 58 | 27‐Apr | Multi provinces | China | Asian | Retrospective | 154 | 72.2 ± 8.5 | 57.79 | 7 | 2 | 2 | – | – |
| Li J 59 | 19‐May | Wuhan | China | Asian | Retrospective | 54 | 53.3 ± 47.4 | 16.67 | 4 | 6 | 52 | – | – |
| Li J 60 | 1‐Jun | Wuhan | China | Asian | Retrospective | 74 | 64.3 ± 12.6 | 59.46 | 6 | – | – | – | 41 |
| Li K 18 | 29‐Feb | Chongqing | China | Asian | Retrospective | 83 | 45.5 ± 12.3 | 53.01 | 7 | – | – | 7 | – |
| Li W 61 | 17‐Apr | Hubei | China | Asian | Retrospective | 105 | 47.7 ± 11.8 | 57.14 | 2 | 3 | 3 | – | 6 |
| Li X 62 | 12‐Apr | Wuhan | China | Asian | Retrospective | 548 | 59.0 ± 15.5 | 50.91 | 179 | 45 | – | 16 | – |
| Liang Y 63 | 29‐Jun | Guangdong | China | Asian | Prospective | 86 | 29.5 ± 37.8 | 51.16 | 6 | 4 | – | – | 15 |
| Lin L 64 | 2‐Apr | Zhuhai | China | Asian | Retrospective | 95 | 45.3 ± 18.3 | 47.37 | 23 | 4 | 17 | – | 17 |
| Lin W 65 | 16‐Jul | Guangzhou | China | Asian | Retrospective | 217 | 49.7 ± 20.0 | 49.77 | 17 | 4 | 9 | 3 | 38 |
| Liu B 66 | 3‐Jun | Wuhan | China | Asian | Prospective | 68 | 44.3 ± 16.4 | 36.76 | 5 | 4 | 4 | – | – |
| Liu F 67 | 14‐Apr | Wuhan | China | Asian | Retrospective | 140 | 64.3 ± 13.8 | 35.00 | 5 | – | 3 | 3 | 9 |
| Liu F 68 | 17‐Jun | Wuhan | China | Asian | Retrospective | 17 | 57.0 ± 9.6 | 76.47 | 4 | – | – | – | – |
| Liu F 69 | 12‐Mar | Zhejiang | China | Asian | Prospective | 10 | 42.0 ± 11.8 | 40.00 | – | – | 3 | – | – |
| Liu J 70 | 18‐Apr | Wuhan | China | Asian | Retrospective | 40 | 48.7 ± 13.9 | 37.50 | 3 | 1 | 3 | 1 | – |
| Liu k 71 | 5‐May | Hubei | China | Asian | Retrospective | 137 | 53.3 ± 46.7 | 44.53 | 11 | – | – | – | – |
| Liu y 72 | 9‐Feb | Shenzhen | China | Asian | Retrospective | 12 | 53.7 ± 18.0 | 66.67 | 2 | 2 | 2 | – | – |
| Lo I 73 | 15‐Mar | Macau | China | Asian | Retrospective | 10 | 48.3 ± 27.4 | 30.00 | 8 | – | 5 | 2 | – |
| Lui G 74 | 18‐Apr | Hong Kong | China | Asian | prospective | 11 | 56.7 ± 20.7 | 63.64 | 2 | – | – | – | – |
| Luo S 75 | 20‐Mar | Hubei | China | Asian | Retrospective | 183 | 53.8 ± NA | 55.74 | 68 | 119 | 134 | 45 | 180 |
| Mao B 76 | 14‐May | Shanghai | China | Asian | Retrospective | 188 | 46.0 ± 24.0 | 50.00 | 6 | 1 | 1 | – | 24 |
| Mo P 77 | 16‐Mar | Wuhan | China | Asian | Retrospective | 155 | 54.0 ± 17.8 | 55.48 | 7 | 3 | 3 | 3 | 26 |
| Nobel Y 78 | 12‐Apr | New York | USA | American | Retrospective case‐control | 278 | NA | 52.16 | 56 | 63 | 63 | – | – |
| Noh J 79 | 21‐May | Gyeongsangbuk | Korea | Asian | Prospective | 199 | 38.0 ± 13.1 | 34.67 | 9 | – | – | – | 1 |
| Ortiz‐Brizuela E 80 | 14‐May | Mexico City | Mexico | Mexican | Prospective | 309 | 43.3 ± 15.6 | 59.22 | 94 | 30 | – | 39 | – |
| Pan L 81 | 14‐Apr | Hubei | China | Asian | Retrospective | 204 | 52.9 ± 15.9 | 52.45 | 35 | 4 | – | 2 | 81 |
| Park S 82 | 10‐Jun | North Gyeongsang | Korea | Asian | Prospective | 46 | 33.7 ± 28.9 | 45.65 | 7 | – | 1 | 5 | 1 |
| Peng S 83 | 10‐Apr | Wuhan | China | Asian | Retrospective | 11 | 60.3 ± 13.3 | 72.73 | 3 | – | 6 | – | 6 |
| Poggiali E 84 | 26‐Mar | Piacenza | Italy | European | Retrospective | 10 | 50.0 ± 18.0 | 60.00 | 6 | 3 | – | 1 | – |
| Qi L 85 | 17‐May | Hunan | China | Asian | Retrospective | 147 | 43.7 ± 14.1 | 45.58 | – | – | – | – | – |
| Ramachandran P 86 | 29‐Jun | New York | USA | American | Retrospective | 150 | 62.1 ± 15.1 | 55.33 | 15 | 6 | 6 | 3 | – |
| Redd W 87 | 22‐Apr | Massachusetts | USA | American | Retrospective | 318 | 63.4 ± 16.6 | 54.72 | 107 | 49 | 84 | 46 | 110 |
| Remes‐Troche J 88 | 21‐May | Veracruz | Mexico | Mexican | Retrospective | 112 | 43.7 ± 15.0 | 72.32 | 20 | 8 | – | 11 | – |
| Rivera‐Izquierdo M 89 | 16‐Jun | Granada | Spain | European | Prospective | 76 | 45.8 ± 11.4 | 30.26 | 31 | 7 | 17 | 21 | 12 |
| Shi H 90 | 24‐Feb | Wuhan | China | Asian | Retrospective | 81 | 49.5 ± 11.0 | 51.85 | 3 | 4 | – | – | 1 |
| Sun H 91 | 8‐May | Wuhan | China | Asian | Retrospective | 244 | 70.0 ± 8.1 | 54.51 | 72 | – | – | 10 | – |
| Tabata S 92 | 12‐Jun | Tokyo | Japan | Asian | Retrospective | 71 | 62.0 ± 22.9 | 54.93 | 8 | – | – | – | – |
| To K 93 | 23‐Mar | Hong Kong | China | Asian | Retrospective | 23 | 57.7 ± 27.5 | 56.52 | 2 | – | 1 | – | – |
| Tomlins J 94 | 27‐Apr | Bristol | UK | European | Retrospective | 95 | 72.0 ± 17.1 | 63.16 | 11 | 13 | 13 | 5 | – |
| Wan Y 95 | 15‐Apr | Guangdong, Hubei, Jiangxi | China | Asian | Retrospective | 230 | 47.8 ± 16.2 | 56.09 | 49 | – | – | 3 | – |
| Wang D 96 | 7‐Feb | Wuhan | China | Asian | Retrospective | 138 | 55.3 ± 19.3 | 54.35 | 14 | 5 | 14 | 3 | 55 |
| Wang K 97 | 23‐Mar | Hubei | China | Asian | Retrospective | 114 | 51.3 ± 40.7 | 50.88 | 3 | – | – | – | – |
| Wang R 98 | 11‐Apr | Anhui | China | Asian | Retrospective | 125 | 38.8 ± 13.8 | 56.80 | 50 | 24 | 24 | – | – |
| Wang X 99 | 3‐Apr | Wuhan | China | Asian | Retrospective | 1012 | 49.0 ± 14.1 | 51.78 | 152 | 36 | – | 37 | – |
| Wang Z 100 | 12‐Mar | Wuhan | China | Asian | Retrospective | 69 | 46.3 ± 20.0 | 46.38 | 10 | 3 | – | – | 7 |
| Wei X 101 | 18‐Apr | Wuhan | China | Asian | Retrospective | 84 | 45.0 ± 37.0 | 33.33 | 26 | 6 | 16 | 2 | – |
| Wei Y 102 | 17‐Apr | Anhui | China | Asian | Retrospective | 167 | 42.3 ± 15.3 | 56.89 | 56 | 17 | 17 | – | – |
| Wu J 103 | 29‐Feb | Jiangsu | China | Asian | Retrospective | 80 | 46.1 ± 15.4 | 48.75 | 1 | 1 | 1 | – | – |
| Xie J 104 | 6‐Jun | Zhejiang | China | Asian | Retrospective | 104 | 54.0 ± 15.6 | 60.58 | 13 | 3 | 6 | 2 | – |
| Xiong Y 105 | 3‐Mar | Hubei | China | Asian | Retrospective | 42 | 49.5 ± 14.1 | 59.52 | 10 | – | – | – | – |
| Xu K 106 | 9‐Apr | Hangzhou & Shenzhen | China | Asian | Retrospective | 113 | 52.7 ± 14.8 | 58.41 | – | – | – | – | – |
| Xu X 107 | 28‐Feb | Guangzhou | China | Asian | Retrospective | 90 | 51.3 ± 50.4 | 43.33 | 5 | 2 | 5 | – | – |
| Xu X 108 | 19‐Feb | Zhejiang | China | Asian | Retrospective case series | 62 | 41.7 ± 14.8 | 56.45 | 3 | – | – | – | – |
| Yang W 109 | 26‐Feb | Wenzhou | China | Asian | Retrospective | 149 | 45.1 ± 13.3 | 54.36 | 11 | 2 | 2 | – | – |
| Yang X 110 | 21‐Feb | Wuhan | China | Asian | Retrospective | 52 | 59.7 ± 13.3 | 67.31 | – | 2 | – | – | – |
| Yang Y 111 | 29‐Apr | Shenzhen | China | Asian | Retrospective | 50 | 54.0 ± 41.5 | 58.00 | 4 | – | – | – | – |
| Yin S 112 | 30‐Apr | Hunan | China | Asian | Retrospective | 33 | 47.5 ± 24.8 | 48.48 | 5 | – | – | – | – |
| Yoshimura Y 113 | 12‐Jun | Yokohama | Japan | Asian | Retrospective | 17 | 69.0 ± 10.0 | 47.06 | 1 | 4 | 4 | – | – |
| Young B 114 | 3‐Mar | Singapore | Singapore | Asian | Retrospective | 18 | 50.3 ± 31.1 | 50.00 | 3 | – | – | – | – |
| Zayet S 115 | 16‐Jun | Grand Est region | France | European | Retrospective & observational | 70 | 56.7 ± 19.3 | 41.43 | 28 | 2 | 22 | 14 | – |
| Zeng Q 116 | 12‐Jun | Henan & Shaanxi Provinces | China | Asian | Retrospective &observational | 149 | 42.3 ± 18.5 | 61.07 | 11 | 4 | 8 | – | 20 |
| Zhang G 117 | 9‐Apr | Wuhan | China | Asian | Retrospective | 221 | 53.5 ± 20.4 | 48.87 | 25 | – | – | 5 | 80 |
| Zhang H 118 | 23‐Jun | Wuhan | China | Asian | Retrospective | 107 | 66.7 ± 45.9 | 56.07 | 15 | – | – | – | – |
| Zhang J 119 | 15‐Apr | Wuhan | China | Asian | Retrospective | 663 | 56.2 ± 18.5 | 48.42 | 61 | 17 | 31 | 5 | – |
| Zhang J 120 | 6‐Jun | Wuhan | China | Asian | Retrospective | 135 | 62.3 ± 10.4 | 57.78 | 18 | 15 | 15 | 2 | 12 |
| Zhang J 121 | 28‐Apr | Wuhan | China | Asian | Retrospective | 111 | 42.3 ± 18.5 | 41.44 | 10 | – | – | – | – |
| Zhang J 122 | 19‐Feb | Wuhan | China | Asian | Retrospective | 140 | 56.3 ± 45.9 | 50.71 | 18 | 7 | 24 | 8 | 17 |
| Zhang L 123 | 29‐Jun | Wuhan | China | Asian | Retrospective | 409 | 64.0 ± 11.1 | 57.21 | 91 | 42 | 50 | 28 | – |
| Zhang L 124 | 1‐Apr | Anhui | China | Asian | Retrospective | 80 | 44.1 ± 17.1 | 58.75 | 33 | 17 | 17 | – | – |
| Zhang L 125 | 26‐Mar | Wuhan | China | Asian | Retrospective | 28 | 63.7 ± 10.4 | 60.71 | 3 | – | – | – | – |
| Zhang P 126 | 5‐Jun | Wuhan | China | Asian | Retrospective | 136 | 67.7 ± 14.8 | 63.24 | 28 | – | – | – | – |
| Zhang X 127 | 20‐Mar | Zhejiang | China | Asian | Retrospective | 645 | 45.3 ± 13.9 | 50.85 | 53 | 22 | 22 | – | – |
| Zhao D 129 | 12‐Mar | Anhui | China | Asian | Comparative | 19 | 43.7 ± 21.5 | 57.89 | 1 | – | – | – | – |
| Zhao F 130 | 16‐May | Shenzhen | China | Asian | Retrospective | 401 | 46.7 ± 20.0 | 47.38 | 25 | 1 | 1 | – | – |
| Zhao W 131 | 3‐Mar | Hunan | China | Asian | Retrospective | 101 | 44.4 ± 12.3 | 55.45 | 3 | 2 | 2 | – | – |
| Zheng S 132 | 21‐Apr | Zhejiang | China | Asian | Retrospective | 96 | 54.7 ± 15.2 | 60.42 | 10 | 2 | 5 | – | – |
| Zheng T 133 | 8‐Jun | Wuhan | China | Asian | Retrospective | 1320 | 49.0 ± 12.6 | 43.86 | 107 | 57 | 57 | 11 | 62 |
| Zheng Y 134 | 30‐Apr | Shiyan | China | Asian | Retrospective | 73 | 46.7 ± 40.7 | 54.79 | 1 | – | – | – | 3 |
| Zhong Q 135 | 28‐Mar | Wuhan | China | Asian | Retrospective | 49 | 31.3 ± 3.7 | 14.29 | – | 3 | – | – | – |
| Zhou B 136 | 17‐Apr | Tongji | China | Asian | Retrospective | 41 | 56.0 ± 10.4 | 53.66 | – | – | – | – | |
| Zhou F 137 | 9‐Mar | Wuhan | China | Asian | Retrospective | 191 | 56.3 ± 15.6 | 62.30 | 9 | 7 | 7 | – | – |
| Zhou Z 138 | 19‐Mar | Wuhan | China | Asian | Retrospective | 254 | 50.3 ± 21.5 | 45.28 | 46 | 15 | 21 | 3 | – |
| Zhu H 139 | 7‐Jun | Zhejiang | China | Asian | Retrospective | 98 | 49.6 ± 15.7 | 32.65 | 8 | – | – | – | – |
| Zhu Z 140 | 22‐Apr | Zhejiang | China | Asian | Retrospective | 127 | 50.9 ± 15.3 | 35.43 | 43 | – | 57 | 4 | 59 |
| Zou X 141 | 14‐Jun | Shanghai | China | Asian | Retrospective | 105 | 61.0 ± 14.1 | 52.38 | 19 | 4 | – | – | – |
| Zuo T 128 | 26‐Jun | Hong Kong | China | Asian | Retrospective | 30 | 46.0 ± 25.2 | 53.33 | 4 | 11 | – | – | – |
Note: All articles were published in 2020.
Abbreviations: GI, gastrointestinal; NA, not applicable.
Table 2.
Characteristics of the included studies in the pairwise meta‐analysis
| First author | Year | DOP | Journal name | City | Country | Ethnicity | Sample size | Age, years (mean ± SD) | Sex(F/M) | |||
|---|---|---|---|---|---|---|---|---|---|---|---|---|
| (1) Comparison between severe versus non‐severe groups | Severe | Non‐severe | Severe | Non‐severe | Severe | Non‐severe | ||||||
| Chen L 31 | 2020 | 13‐May | Journal of Infection | Guangdong | China | Asian | 20 | 31 | 62.5 ± 13.3 | 57.6 ± 13.7 | 6/14 | 11/20 |
| Fu J 43 | 2020 | 6‐May | Thrombosis Research | Suzhou | China | Asian | 16 | 59 | 51.8 ± 12.8 | 45.1 ± 14.0 | 6/10 | 24/35 |
| Guan W 44 | 2020 | 28‐Feb | New England Journal of Medicine | Multiple | China | Asian | 173 | 926 | 52.3 ± 18.5 | 45.3 ± 17.0 | 73/100 | 386540 |
| Han J 47 | 2020 | 25‐Jun | Epidemiol Infect | Tianjin | China | Asian | 30 | 155 | 61.6 ± 12.4 | 40.6 ± 16.8 | 13/17 | 77/78 |
| Huang M 51 | 2020 | 1‐Jun | The Am Jof the Medical Sciences | Jiangsu | China | Asian | 8 | 52 | NA | NA | NA | NA |
| Jin A 53 | 2020 | 12‐May | Biosafety and Health | Beijing | China | Asian | 20 | 25 | 74.7 ± 10.7 | 46.0 ± 17.0 | 10/10 | 17/8 |
| Li K 18 | 2020 | 29‐Feb | Invest Radiol | Chongqing | China | Asian | 25 | 58 | 53.7 ± 12.3 | 41.9 ± 10.6 | 10/15 | 29/29 |
| Li X 62 | 2020 | 12‐Apr | J of Allergy & Clinical Immunol | Wuhan | China | Asian | 269 | 279 | 63.7 ± 13.3 | 55.3 ± 16.3 | 116/153 | 153/126 |
| Liu F 67 | 2020 | 14‐Apr | Journal of Clinical Virology | Wuhan | China | Asian | 33 | 107 | 76.7 ± 16.3 | 61.0 ± 12.6 | 25/8 | 66/41 |
| Liu J 70 | 2020 | 18‐Apr | EBioMedicine | Wuhan | China | Asian | 13 | 27 | 59.7 ± 10.1 | 43.2 ± 12.3 | 6/7 | 19/8 |
| Lo I 73 | 2020 | 15‐Mar | Int J Biol Sci | Macau | China | Asian | 4 | 6 | 61.0 ± 5.0 | 37.0 ± 19.0 | 3/1 | 4/2 |
| Lui G 74 | 2020 | 18‐Apr | Journal of Infection | Hong Kong | China | Asian | 5 | 6 | 65.7 ± 5.9 | 49.2 ± 14.8 | 1/4 | 3/3 |
| Mo P 77 | 2020 | 16‐Mar | Clin Infect Dis | Wuhan | China | Asian | 85 | 70 | 60.7 ± 14.1 | 45.7 ± 15.6 | 30/55 | 39/31 |
| Tabata S 92 | 2020 | 12‐Jun | The Lancet Infectious Diseases | Tokyo | Japan | Asian | 28 | 43 | 68.3 ± 16.3 | 57.0 ± 22.9 | 11/17 | 21/22 |
| To K 93 | 2020 | 23‐Mar | The Lancet Infectious Diseases | Hong Kong | China | Asian | 10 | 13 | 60.0 ± 26.7 | 56.0 ± 28.1 | 4/6 | 6/7 |
| Wang R 98 | 2020 | 11‐Apr | Int Journal of Infectious Diseases | Anhui | China | Asian | 25 | 100 | 49.4 ± 13.6 | 39.5 ± 14.8 | 9/16 | 45/55 |
| Wang X 99 | 2020 | 3‐Apr | Clin Microbiol Infect | Wuhan | China | Asian | 100 | 912 | 54.8 ± 11.1 | 48.7 ± 14.8 | 38/62 | 450/462 |
| Wei Y 101 | 2020 | 17‐Apr | Journal of Infection | Anhui | China | Asian | 30 | 137 | 49.0 ± 12.6 | 40.8 ± 15.5 | 10/20 | 62/75 |
| Yang Y 111 | 2020 | 29‐Apr | J Allergy Clin Immunol | Shenzhen | China | Asian | 25 | 14 | 58.3 ± 26.7 | 50.5 ± 41.5 | 11/14 | 7/7 |
| Zhang G 117 | 2020 | 9‐Apr | Journal of Clinical Virology | Wuhan | China | Asian | 55 | 166 | 62.7 ± 16.3 | 50.4 ± 20.9 | 20/35 | 93/73 |
| Zhang H 118 | 2020 | 23‐Jun | Cancer | Wuhan | china | Asian | 56 | 51 | 67.7 ± 45.9 | 59.7 ± 30.4 | 19/37 | 28/23 |
| Zhang J 119 | 2020 | 15‐Apr | Clinical Microbiology and Inf | Wuhan | china | Asian | 315 | 254 | 52.2 ± 18.5 | 48.7 ± 18.5 | 166/149 | 138/116 |
| Zhang J 121 | 2020 | 28‐Apr | Journal of Clinical Virology | Wuhan | china | Asian | 18 | 93 | 63.3 ± 24.4 | 38.2 ± 12.2 | 4/14 | 61/32 |
| Zhang J 122 | 2020 | 19‐Feb | Allergy | Wuhan | china | Asian | 58 | 82 | 58.7 ± 45.9 | 51.8 ± 38.5 | 25/33 | 44/38 |
| Zheng S 132 | 2020 | 21‐Apr | BMJ | Zhejiang | china | Asian | 74 | 22 | 56.8 ± 13.7 | 46.9 ± 14.4 | 25/49 | 13/9 |
| Zhu Z 140 | 2020 | 22‐Apr | Int Journal of Infectious Diseases | Zhejiang | China | Asian | 16 | 111 | 57.5 ± 11.7 | 49.9 ± 15.5 | 7/9 | 38/73 |
| (2) Comparison between hospitalized and nonhospitalized cohorts | Hosp | None | Hosp | None | Hosp | Non | ||||||
| Cholankeril G 142 | 2020 | 10‐Jun | Am J Gastroenterol | California | USA | American | 60 | 147 | 60.7 ± 25.2 | 44.0 ± 20.0 | 28/32 | 75/72 |
| Hajifathalian K 45 | 2020 | 8‐May | Gastroenterology | New York | USA | American | 768 | 291 | 64.7 ± 17.1 | 51.6 ± 17.8 | 302/466 | 146/145 |
| Ortiz‐Brizuela E 80 | 2020 | 14‐May | Rev Invest Clin | Mexico | Mexico | Mexican | 140 | 169 | 49.7 ± 16.5 | 39.3 ± 14.1 | 55/85 | 71/98 |
| Rivera‐Izquierdo M 89 | 2020 | 16‐Jun | Int J Environ Res Public Health | Granada | Spain | European | 11 | 65 | NA | NA | NA | NA |
| (3) Comparison between ICU admission and general hospital ward | ICU | Floor | ICU | Floor | ICU | Floor | ||||||
| Huang C 50 | 2020 | 24‐Jan | Lancet | Wuhan | China | Asian | 13 | 28 | 50.3 ± 14.8 | 49.2 ± 12.2 | 2/11 | 9/19 |
| Ortiz‐Brizuela E 80 | 2020 | 14‐May | Rev Invest Clin | Mexico | Mexico | Mexican | 29 | 111 | 52.3 ± 17.8 | 49.2 ± 15.9 | 9/20 | 46/65 |
| Wang D 96 | 2020 | 7‐Feb | Jama | Wuhan | China | Asian | 36 | 102 | 67.0 ± 15.6 | 50.0 ± 18.5 | 14/22 | 49/53 |
| Zeng Q 116 | 2020 | 12‐Jun | Transbound Emerg Dis | Henan | China | Asian | 27 | 122 | 57.3 ± 20.0 | 39.0 ± 17.0 | NA | NA |
| Cholankeril G 142 | 2020 | 10‐Jun | Am J Gastroenterol | California | USA | American | 17 | 43 | 55.7 ± 20.7 | 62.3 ± 23.7 | 7/10 | 21/22 |
| (4) Comparison between patients who expired and those survived | Died | Alive | Died | Alive | Died | Alive | ||||||
| Chen F 29 | 2020 | 8‐Jul | Journal of Critical Care | Wuhan | China | Asian | 104 | 577 | 72.8 ± 11.7 | 61.7 ± 13.3 | 39/65 | 280/297 |
| Chen R 34 | 2020 | 11‐May | J of Allergy & Clinical Immunol | Multiple | China | Asian | 103 | 445 | 66.9 ± 12.1 | 53.5 ± 13.9 | 34/69 | 201/244 |
| Leung C 58 | 2020 | 27‐Apr | Mechanisms of Ageing and Devel | Multiple | China | Asian | 89 | 65 | 74.3 ± 10.4 | 69.3 ± 5.9 | 36/53 | 29/36 |
| Li J 60 | 2020 | 1‐Jun | Am J of the medical sciences | Wuhan | China | Asian | 14 | 60 | 72.3 ± 5.9 | 61.7 ± 12.6 | 3/11 | 27/33 |
| Peng S 83 | 2020 | 10‐Apr | J of Thoracic and CV Surgery | Wuhan | China | Asian | 3 | 8 | NA | NA | 1/2 | 2/6 |
| Sun H 91 | 2020 | 8‐May | J of American Geriatrics Society | Wuhan | China | Asian | 121 | 123 | 72.0 ± 8.9 | 67.7 ± 5.9 | 39/82 | 72/51 |
| Tomlins J 94 | 2020 | 27‐Apr | Journal of Infection | Bristol | UK | European | 20 | 75 | 78.0 ± 9.6 | 70.7 ± 19.3 | 8/12 | 27/48 |
| Yang X 110 | 2020 | 21‐Feb | Lancet Respir Med | Wuhan | China | Asian | 32 | 20 | 64.6 ± 11.2 | 51.9 ± 12.9 | 11/21 | 6/14 |
| Zhang G 117 | 2020 | 9‐Apr | Journal of Clinical Virology | Wuhan | China | Asian | 9 | 23 | 71.7 ± 17.8 | 60.7 ± 16.3 | 2/7 | 8/15 |
| Zhang L 123 | 2020 | 29‐Jun | Gastroenterology | Wuhan | China | Asian | 102 | 307 | 66.3 ± 10.4 | 62.3 ± 14.1 | 30/72 | 145/162 |
| Zhou F 137 | 2020 | 9‐Mar | Lancet | Wuhan | China | Asian | 54 | 137 | 69.3 ± 9.6 | 51.7 ± 9.6 | 16/38 | 56/81 |
| (5) Comparison between positive and negative fecal RNA for SARS‐COV‐2 groups | Positive | Negative | Positive | Negative | Positive | Negative | ||||||
| Chen Y 36 | 2020 | 3‐Apr | J Med Virol | Wuhan | China | Asian | 28 | 14 | 52.2 ± 14.1 | 48.7 ± 12.1 | 16/12 | 11/3 |
| Lin W 65 | 2020 | 16‐Jul | J Med Virol | Guangzhou | China | Asian | 46 | 171 | 52.0 ± 15.6 | 48.3 ± 21.5 | 20/26 | 89/82 |
| Zhao F 130 | 2020 | 16‐May | Gastroenterology | Shenzhen T | China | Asian | 80 | 321 | 37.3 ± 25.2 | 37.7 ± 42.9 | 48/32 | 163/158 |
| (6) Rest of studies comparing cohorts with and without GI symptoms but lacking outcomes data | GI | Non‐GI | GI | Non‐GI | GI | Non‐GI | ||||||
| Cao C 24 | 2020 | 15‐Jun | Critical Care | China | Asian | Retrospective | 63 | 94 | 51.9 ± 14.9 | 47.5 ± 14.0 | 39/24 | 44/50 |
| Effenberger M 40 | 2020 | 20‐Apr | Gut | Austria | European | Retrospective | 9 | 18 | 78.3 ± 13.8 | 58.4 ± 17.1 | 3/6 | 9/9 |
| Ferm S 42 | 2020 | 1‐Jun | Clin Gastroenterol Hepatol | USA | American | Retrospective | 219 | 658 | NA | NA | NA | NA |
| Han C 46 | 2020 | 15‐Apr | Am J Gastroenterol | China | Asian | Retrospective | 48 | 89 | 62.5 ± 44.4 | 61.0 ± 47.4 | 35/13 | 41/48 |
| Jin X 54 | 2020 | 24‐Mar | Gut | China | Asian | Retrospective | 74 | 577 | 46.1 ± 14.2 | 45.1 ± 14.4 | 37/37 | 283/294 |
| Lin L 64 | 2020 | 2‐Apr | Gut | China | Asian | Retrospective | 58 | 37 | 48.0 ± 17.1 | 41.1 ± 19.5 | 31/27 | 19/18 |
| Pan L 81 | 2020 | 14‐Apr | Am J Gastroenterol | China | Asian | Retrospective | 103 | 101 | 52.2 ± 15.9 | 53.6 ± 16.1 | 48/55 | 49/52 |
| Ramachandran P 86 | 2020 | 29‐Jun | Dig Dis | USA | American | Retrospective | 31 | 119 | 57.6 ± 17.2 | 63.3 ± 14.6 | 12/19 | 55/64 |
| Redd W 87 | 2020 | 22‐Apr | Gastroenterology | USA | American | Retrospective | 195 | 123 | 62.3 ± 15.9 | 65.0 ± 17.6 | 93/102 | 51/72 |
| Wan Y 95 | 2020 | 15‐Apr | Lancet Gastroenterol Hepatol | China | Asian | Retrospective | 49 | 181 | 53.3 ± 18.5 | 46.3 ± 15.6 | 22/27 | 79/102 |
| Wei X 101 | 2020 | 18‐Apr | Cl Gastroenterology and Hepatol | China | Asian | Retrospective | 26 | 58 | 47.2 ± 33.3 | 42.7 ± 31.8 | 18/8 | 38/20 |
| Zhang L 124 | 2020 | 1‐Apr | Zhonghua Wei Zhong Bing Ji Jiu Yi Xue | China | Asian | Retrospective | 33 | 47 | 45.1 ± 16.5 | 43.4 ± 17.5 | 11/22 | 22/25 |
| Zheng T 133 | 2020 | 8‐Jun | Journal Medical Virology | China | Asian | Retrospective | 192 | 1128 | 48.0 ± 13.3 | 50.0 ± 12.6 | 102/90 | 639/489 |
| Zhou Z 138 | 2020 | 19‐Mar | Gastroenterology | China | Asian | Retrospective | 66 | 188 | 50.6 ± 11.3 | 51.4 ± 12.8 | 44/22 | 95/93 |
Abbreviations: DOP, publication date; ICU, intensive care unit; NA, not applicable.
3.2. The pooled prevalence of patients with gastrointestinal manifestations
The one‐arm meta‐analysis included 25,252 COVID‐19 positive patients with a mean age of 52.1 years (95% CI, 49.9–54.3). The males accounted for 52.2% (95%CI, 50.8%–53.6%). Most common comorbid conditions were hypertension (22.3%, 95% CI, 19.3%–25.6%) and obesity (20.7%, 95%CI, 17.1%–24.9%).
Of the overall COVID‐19 patients, 20.3% (95% CI, 16.6%–23.9%) presented with GI features, and 26.7% (95%CI, 16.9%–36.5%) had confirmed fecal viral shedding with positive fecal RNA RT‐PCR test. The most common presenting gastrointestinal symptoms were anorexia (19.9%), dysgeusia/ageusia (15.4%), and diarrhea (13.2%). Fecal testing showed persistent viral shedding for an average time of 19.2 days (95%CI, 16.1–22.4) before being negative. The proportion of GI features was 18.7% (95%CI, 13.6%–23.8%) in studies published during the first pandemic wave, which was insignificant from the second wave (23.1%, 95%CI, 18.7%–27.5%). Subgroup analysis by geographical region showed a higher frequency of patients presented with gastrointestinal involvement in European studies (36.7%, 95%CI, 28.3%–45.1%) compared with Asian (18.1%, 95% CI, 13.9%–22.2%) and American (24.6%, 95% CI, 19.5%–29.6%) studies (Figure 2).
Figure 2.
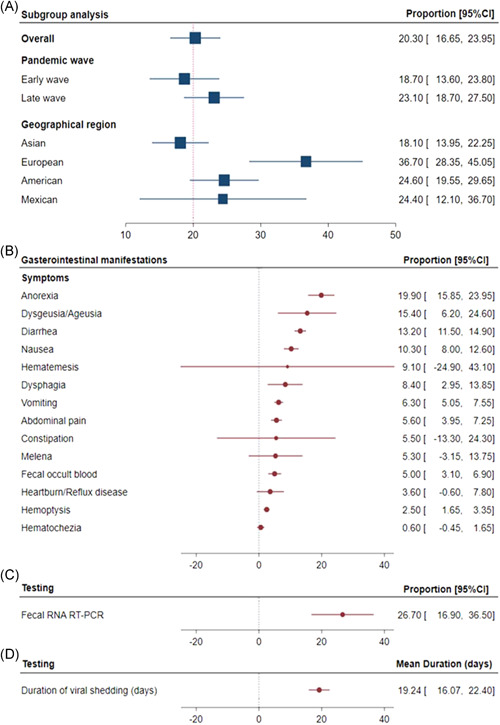
Prevalence of gastrointestinal manifestations. (A) The proportion of patients with COVID‐19 presenting with gastrointestinal symptoms. One‐arm meta‐analysis was applied. Overall proportion and confidence intervals are shown. Subgroup analysis was performed stratifying studies by the date of publication (during the first wave; < May 15, or during the second wave; > May 15) and by geographical regions (Asia, Europe, America, and Mexico). (B) The proportion of gastrointestinal symptoms in COVID‐19 cohorts. (C) Prevalence of fecal shedding confirmed by fecal RNA RT‐PCR. (D) Duration of viral shedding (days). CI, confidence interval; COVID‐19, coronavirus disease 2019; RT‐PCR, reverse‐transcription polymerase chain reaction
A pooled one‐arm meta‐analysis of detailed demographic, clinical, and laboratory features of COVID‐19 patients with gastrointestinal presentations is demonstrated in Table S1. As depicted in Figure 3, subgroup analysis by the pandemic waves revealed a higher prevalence of acute cardiac injury and ICU admission (both p < .001) in the first wave. In contrast, second wave articles reported higher ARDS frequencies, AKI, mechanical ventilation use, and a higher risk of mortality (all p < .001).
Figure 3.

Subgroup analysis for pooled one‐arm meta‐analysis of COVID‐19 outcomes by the pandemic wave. Odds ratio and 95% confidence intervals were reported. p values comparing the first and second waves were estimated using Student's t‐test. ARDS, acute respiratory distress syndrome; COVID‐19, coronavirus disease 2019
3.3. Differential outcomes of patients presenting with gastrointestinal manifestations
Pairwise comparative analysis of COVID‐19 cases with and without GI symptoms is shown in Table 3. COVID‐19 patients presented with GI features were more likely to be older (SMD = 0.53; 95% CI = 0.41–0.64, p < .001), and males (OR = 1.29; 95% CI = 1.14–1.46, p < .001). Black patients were also less likely to present with GI features. They had higher odds of having comorbid conditions as hypertension (OR = 2.12; 95%CI = 1.76–2.56), diabetes (OR = 2.06, 95% CI = 1.66–2.55, p < .001), chronic kidney disease (OR = 1.78, 95% CI = 1.21–2.63, p = .003), chronic liver disease (OR = 1.51, 95% CI = 1.14–2.0, p = .004), and malignancy (OR = 1.44, 95% CI = 1.11–1.87, p = .005).
Table 3.
Summary for pairwise comparison in the meta‐analysis
| Sample size | Test of association | Effect size | Heterogeneity | Pub bias | |||||||||
|---|---|---|---|---|---|---|---|---|---|---|---|---|---|
| Characteristics | Number studies | Total | Poor prognosis | Good prognosis | Statistical method | Effect measure | Analysis model | Estimate | 95% CI | p value | I 2 | p value | p value |
| A. Demographic characteristics | |||||||||||||
| Age, years | 59 | 14,200 | 4342 | 9858 | IV | SMD | Random | 0.531 | 0.413–0.649 | <.001 | 86.68% | <.001 | .070 |
| Sex: (Male) | 59 | 14,062 | 4318 | 9744 | MH | OR | Random | 1.292 | 1.144–1.460 | <.001 | 43.90% | <.001 | .488 |
| Sex: (Female) | 59 | 14,062 | 4318 | 9744 | MH | OR | Random | 0.774 | 0.685–0.874 | <.001 | 43.90% | <.001 | .488 |
| BMI, kg/m2 | 13 | 3731 | 1673 | 2058 | IV | SMD | Random | 0.124 | −0.047 to 0.295 | .154 | 77.37% | <.001 | .790 |
| Race/Ethnicity: (Asian) | 4 | 1476 | 876 | 600 | MH | OR | Random | 1.124 | 0.782–1.617 | .527 | 0.0% | .795 | .628 |
| Race/Ethnicity: (White) | 4 | 1476 | 876 | 600 | MH | OR | Random | 0.786 | 0.456–1.356 | .387 | 51.27% | .104 | .935 |
| Race/Ethnicity: (Black) | 4 | 1476 | 876 | 600 | MH | OR | Random | 0.705 | 0.499–0.997 | .048 | 0.0% | .735 | .196 |
| Race/Ethnicity: (Hispanic) | 3 | 417 | 108 | 309 | MH | OR | Random | 1.137 | 0.370–3.499 | .823 | 61.51% | .074 | .991 |
| Cigarette smoking | 26 | 6123 | 1719 | 4404 | MH | OR | Random | 1.594 | 1.312–1.937 | <.001 | 0.0% | .665 | .439 |
| B. Vital signs at presentations | |||||||||||||
| pH | 3 | 341 | 59 | 282 | IV | SMD | Random | 0.290 | 0.008–0.573 | .044 | 0.0% | .963 | .342 |
| PaO2 (mm/Hg) | 4 | 392 | 97 | 313 | IV | SMD | Random | −0.442 | −1.343 to 0.460 | .337 | 91.45% | <.001 | .107 |
| PaCO2 (mm/Hg) | 4 | 392 | 97 | 313 | IV | SMD | Random | −0.465 | −0.824 to −0.106 | .011 | 47.55% | .126 | .034 |
| PaO2:FiO2 ratio (mm/Hg) | 4 | 451 | 105 | 346 | IV | SMD | Random | −1.067 | −1.428 to −0.705 | <.001 | 52.14% | .099 | .678 |
| SpO2 (%) | 8 | 2080 | 479 | 1601 | IV | SMD | Random | −1.039 | −1.340 to −0.738 | <.001 | 82.42% | <.001 | .907 |
| Highest temperature (°C) | 15 | 4411 | 1268 | 3143 | IV | SMD | Random | 0.231 | 0.120–0.342 | <.001 | 54.64% | .006 | .440 |
| C. General clinical presentations | |||||||||||||
| Fever ( ≥ 37.3°C) | 51 | 13,373 | 4076 | 9297 | MH | OR | Random | 1.364 | 1.081–1.722 | .009 | 68.64% | <.001 | .075 |
| Dry cough | 49 | 13,142 | 3964 | 9178 | MH | OR | Random | 1.207 | 1.043–1.396 | .011 | 46.50% | <.001 | .369 |
| Expectoration | 22 | 7759 | 1765 | 5994 | MH | OR | Random | 1.470 | 1.125–1.920 | .005 | 67.91% | <.001 | .967 |
| Chest pain | 18 | 4622 | 1543 | 3079 | MH | OR | Random | 1.374 | 0.866–2.182 | .178 | 70.67% | <.001 | .326 |
| Dizziness | 10 | 2152 | 960 | 1192 | MH | OR | Random | 1.703 | 0.979–2.962 | .060 | 31.60% | .156 | .191 |
| Rhinorrhea | 14 | 2966 | 806 | 2160 | MH | OR | Random | 1.166 | 0.750–1.814 | .494 | 36.72% | .082 | .050 |
| Anosmia | 6 | 1997 | 1163 | 834 | MH | OR | Random | 0.898 | 0.435–1.854 | .771 | 55.58% | .047 | .956 |
| Dyspnea | 42 | 11,927 | 3524 | 8403 | MH | OR | Random | 3.368 | 2.584–4.388 | <.001 | 76.68% | <.001 | .181 |
| Headache | 30 | 8667 | 2188 | 6479 | MH | OR | Random | 1.130 | 0.809–1.580 | .473 | 59.55% | <.001 | .253 |
| Sore throat | 30 | 8747 | 2060 | 6687 | MH | OR | Random | 1.063 | 0.820–1.378 | .646 | 41.47% | .010 | .598 |
| Myalgia | 41 | 11,027 | 3497 | 7530 | MH | OR | Random | 1.307 | 1.048–1.630 | .017 | 60.67% | <.001 | .581 |
| Fatigue | 33 | 9903 | 3189 | 6714 | MH | OR | Random | 1.604 | 1.288–1.999 | <.001 | 70.47% | <.001 | .260 |
| Nasal congestion | 8 | 4431 | 674 | 3757 | MH | OR | Random | 1.154 | 0.738–1.806 | .530 | 5.87% | .385 | .240 |
| D. Comorbidities | |||||||||||||
| Hypertension | 44 | 10,807 | 3351 | 7456 | MH | OR | Random | 2.126 | 1.764–2.561 | <.001 | 58.54% | <.001 | .625 |
| Diabetes mellitus | 48 | 11,722 | 3779 | 7943 | MH | OR | Random | 2.061 | 1.661–2.557 | <.001 | 54.60% | <.001 | .911 |
| Cardiovascular disease | 34 | 8702 | 3224 | 5478 | MH | OR | Random | 2.264 | 1.748–2.933 | <.001 | 51.94% | <.001 | .192 |
| Cerebrovascular disease | 15 | 4328 | 1123 | 3205 | MH | OR | Random | 2.249 | 1.482–3.414 | <.001 | 20.79% | .222 | .362 |
| Chronic liver disease | 23 | 5666 | 2124 | 3542 | MH | OR | Random | 1.513 | 1.143–2.003 | .004 | 0.0% | .499 | .325 |
| Chronic kidney disease | 24 | 7313 | 2452 | 4861 | MH | OR | Random | 1.787 | 1.213–2.634 | .003 | 29.83% | .085 | .538 |
| Coronary heart disease | 16 | 3626 | 928 | 2698 | MH | OR | Random | 2.637 | 1.416–4.912 | .002 | 64.35% | <.001 | .775 |
| Hyperlipidemia | 4 | 653 | 304 | 349 | MH | OR | Random | 0.931 | 0.635–1.366 | .715 | 0.0% | 0.751 | .930 |
| COPD | 39 | 9344 | 3165 | 6179 | MH | OR | Random | 1.977 | 1.457–2.682 | <.001 | 23.94% | .093 | .025 |
| Asthma | 10 | 4077 | 1504 | 2573 | MH | OR | Random | 1.223 | 0.874–1.711 | .241 | 0.0% | .875 | .352 |
| Endocrine disease | 6 | 839 | 417 | 422 | MH | OR | Random | 1.081 | 0.670–1.743 | .750 | 0.0% | .483 | .540 |
| Tuberculosis | 5 | 959 | 454 | 505 | MH | OR | Random | 1.125 | 0.402–3.149 | .822 | 7.04% | .367 | .606 |
| Immunosuppression | 11 | 3560 | 1422 | 2138 | MH | OR | Random | 1.494 | 0.895–2.494 | .125 | 0.0% | .931 | .247 |
| Malignancy | 30 | 7911 | 2771 | 5140 | MH | OR | Random | 1.447 | 1.118–1.871 | .005 | 0.0% | .997 | .030 |
| E. Laboratory findings | |||||||||||||
| WBCs (×109/L) | 44 | 10913 | 3020 | 7893 | IV | SMD | Random | 0.325 | 0.174–0.476 | <.001 | 88.64% | <.001 | .286 |
| Neutrophils count (×109/L) | 30 | 7072 | 2024 | 5048 | IV | SMD | Random | 0.589 | 0.372–0.807 | <.001 | 91.31% | <.001 | .115 |
| Lymphocytes count (×109/L) | 45 | 10169 | 2979 | 7190 | IV | SMD | Random | −0.533 | −0.659 to −0.408 | <.001 | 82.21% | <.001 | .108 |
| NLR (×109/L) | 7 | 1242 | 235 | 1007 | IV | SMD | Random | 1.064 | 0.476–1.653 | <.001 | 92.18% | <.001 | .294 |
| Monocytes count (×109/L) | 9 | 1566 | 452 | 1114 | IV | SMD | Random | −0.217 | −0.334 to −0.100 | <.001 | 0.0% | .462 | .282 |
| Platelets count, (×109/L) | 34 | 8624 | 2545 | 6079 | IV | SMD | Random | −0.143 | −0.274 to −0.013 | .031 | 80.10% | <.001 | .926 |
| Hemoglobin (g/L) | 24 | 6406 | 1437 | 4969 | IV | SMD | Random | −0.156 | −0.254 to −0.059 | .002 | 45.88% | .008 | .748 |
| ALT (U/L) | 32 | 6240 | 2259 | 3981 | IV | SMD | Random | 0.228 | 0.112 to 0.343 | <.001 | 69.18% | <.001 | .432 |
| AST (U/L) | 29 | 5756 | 2149 | 3607 | IV | SMD | Random | 0.473 | 0.290–0.657 | <.001 | 86.92% | <.001 | .183 |
| Albumin (g/L) | 18 | 3829 | 1519 | 2310 | IV | SMD | Random | −0.532 | −0.756 to −0.308 | <.001 | 86.44% | <.001 | .775 |
| Total bilirubin (μmol/L) | 17 | 3408 | 1375 | 2033 | IV | SMD | Random | 0.234 | 0.098–0.370 | .001 | 54.24% | .004 | .318 |
| ALP (U/L) | 4 | 1540 | 1002 | 538 | IV | SMD | Random | 0.076 | −0.034 to 0.187 | .177 | 0.0% | .630 | .553 |
| Creatinine (μmol/L) | 29 | 4358 | 1211 | 3147 | IV | SMD | Random | 0.295 | 0.121–0.470 | .001 | 80.94% | <.001 | .353 |
| BUN (mmol/L) | 15 | 2183 | 589 | 1594 | IV | SMD | Random | 0.449 | 0.138–0.760 | .005 | 87.67% | <.001 | .175 |
| Sodium (mmol/L) | 12 | 2964 | 659 | 2305 | IV | SMD | Random | −0.228 | −0.436 to −0.020 | .031 | 74.78% | <.001 | .554 |
| Potassium (mmol/L) | 9 | 2548 | 555 | 1993 | IV | SMD | Random | −0.302 | −0.768 to 0.164 | .204 | 93.89% | <.001 | .993 |
| Lactate (mmol/L) | 7 | 883 | 343 | 540 | IV | SMD | Random | 0.202 | −0.113 to 0.516 | .208 | 72.35% | .001 | .007 |
| Fasting blood glucose (mmol/L) | 4 | 1123 | 190 | 933 | IV | SMD | Random | 0.423 | −0.094 to 0.941 | .109 | 88.62% | <.001 | .231 |
| Lactate dehydrogenase (U/L) | 26 | 4953 | 1697 | 3256 | IV | SMD | Random | 0.773 | 0.471–1.076 | <.001 | 93.76% | <.001 | .235 |
| Troponin (ng/L) | 13 | 2656 | 1250 | 1406 | IV | SMD | Random | 0.661 | 0.329–0.992 | <.001 | 90.84% | <.001 | .060 |
| NT‐proBNP (pg/ml) | 4 | 763 | 346 | 417 | IV | SMD | Random | 0.488 | −0.116 to 1.092 | .113 | 91.55% | <.001 | .628 |
| Creatine kinase (U/L) | 20 | 3861 | 1496 | 2365 | IV | SMD | Random | 0.260 | 0.082–0.438 | .004 | 77.93% | <.001 | .405 |
| Creatine kinase‐MB (U/L) | 10 | 1697 | 408 | 1289 | IV | SMD | Random | 0.613 | 0.077–1.148 | .025 | 93.89% | <.001 | .011 |
| Myoglobin (ng/ml) | 3 | 304 | 64 | 240 | IV | SMD | Random | 0.947 | 0.652–1.242 | <.001 | 0.0% | .411 | .477 |
| Serum amyloid A (mg/L) | 4 | 853 | 199 | 654 | IV | SMD | Random | 0.868 | 0.175–1.561 | .014 | 91.98% | <.001 | .183 |
| International Normalized Ratio | 5 | 2142 | 1064 | 1078 | IV | SMD | Random | 0.084 | −0.186 to 0.354 | .543 | 77.96% | .001 | .349 |
| Prothrombin time (s) | 15 | 2028 | 596 | 1432 | IV | SMD | Random | 0.370 | 0.201–0.539 | <.001 | 58.80% | .002 | .414 |
| APTT (s) | 15 | 3347 | 1502 | 1845 | IV | SMD | Random | 0.085 | 0.004–0.166 | .040 | 4.63% | .400 | .579 |
| d‐dimer (ng/ml) | 24 | 4694 | 1904 | 2790 | IV | SMD | Random | 0.548 | 0.345–0.751 | <.001 | 87.59% | <.001 | .280 |
| CRP (mg/L) | 33 | 7834 | 2411 | 5423 | IV | SMD | Random | 0.812 | 0.593–1.032 | <.001 | 92.63% | <.001 | .067 |
| Ferritin (ng/ml) | 10 | 2812 | 1343 | 1469 | IV | SMD | Random | 0.709 | 0.322–1.095 | <.001 | 93.82% | <.001 | .342 |
| Fibrinogen (g/L) | 8 | 923 | 295 | 628 | IV | SMD | Random | 0.913 | 0.395–1.431 | .001 | 89.50% | <.001 | .068 |
| ESR (mm/h) | 9 | 2230 | 1149 | 1081 | IV | SMD | Random | 0.491 | 0.214–0.767 | <.001 | 83.96% | <.001 | .694 |
| Procalcitonin (ng/ml) | 22 | 4591 | 1717 | 2874 | IV | SMD | Random | 0.810 | 0.522–1.097 | <.001 | 93.09% | <.001 | .098 |
| Interleukin‐6 (pg/ml) | 14 | 3653 | 1468 | 2185 | IV | SMD | Random | 1.098 | 0.754–1.443 | <.001 | 93.39% | <.001 | .399 |
| CD3+ T lymphocyte (Cells/μL) | 2 | 1229 | 207 | 1022 | IV | SMD | Random | −0.998 | −1.153 to −0.843 | <.001 | 0.0% | .919 | NA |
| CD4+ T lymphocyte (Cells/μL) | 5 | 1531 | 336 | 1195 | IV | SMD | Random | −0.864 | −0.999 to −0.729 | <.001 | 0.0% | .722 | .550 |
| CD8+ T lymphocyte (Cells/μL) | 5 | 1531 | 336 | 1195 | IV | SMD | Random | −0.931 | −1.069 to −0.793 | <.001 | 1.75% | .396 | .283 |
| F. Medications | |||||||||||||
| Oxygen therapy | 10 | 2620 | 717 | 1903 | MH | OR | Random | 1.971 | 0.797–4.874 | .142 | 89.86% | <.001 | .344 |
| High‐flow nasal cannula | 8 | 1698 | 514 | 1184 | MH | OR | Random | 0.440 | 0.114–1.699 | .234 | 94.96% | <.001 | .859 |
| Mechanical ventilation: IMV | 18 | 3815 | 1047 | 2768 | MH | OR | Random | 35.46 | 16.87–74.51 | <.001 | 43.79% | .025 | .322 |
| Mechanical ventilation: NIV | 15 | 3502 | 873 | 2629 | MH | OR | Random | 15.56 | 7.01–34.59 | <.001 | 81.96% | <.001 | .002 |
| ACE/ARB inhibitor | 5 | 992 | 386 | 606 | MH | OR | Random | 1.173 | 0.777–1.769 | .448 | 0.0% | .639 | .183 |
| Antibiotics | 19 | 6429 | 1465 | 4964 | MH | OR | Random | 1.892 | 1.276–2.804 | .002 | 69.59% | <.001 | .494 |
| Antifungal | 4 | 2035 | 400 | 1635 | MH | OR | Random | 4.015 | 2.429–6.635 | <.001 | 0.0% | .793 | .343 |
| Antiviral | 17 | 4480 | 1158 | 3322 | MH | OR | Random | 1.040 | 0.775–1.396 | .792 | 15.80% | .269 | .583 |
| Antiviral: Oseltamivir | 5 | 2954 | 694 | 2260 | MH | OR | Random | 1.092 | 0.696–1.712 | 0.703 | 80.83% | <.001 | .919 |
| Antiviral: Ganciclovir | 2 | 755 | 118 | 637 | MH | OR | Random | 1.791 | 1.056–3.038 | .031 | 0.0% | .328 | NA |
| Antiviral:Ribavirin | 4 | 1649 | 480 | 1169 | MH | OR | Random | 1.101 | 0.505–2.399 | .808 | 70.75% | .017 | .745 |
| Antiviral:Lopinavir/Ritonavir | 5 | 1403 | 516 | 887 | MH | OR | Random | 1.081 | 0.587–1.992 | .803 | 72.86% | .005 | .751 |
| Antiviral: Arbidol | 4 | 1381 | 266 | 1115 | MH | OR | Random | 0.718 | 0.327–1.578 | .410 | 69.99% | .019 | .179 |
| Nebulized α‐interferon | 9 | 2158 | 713 | 1445 | MH | OR | Random | 1.561 | 0.972–2.508 | .066 | 69.39% | .001 | .240 |
| Anticoagulants | 3 | 1757 | 1068 | 689 | MH | OR | Random | 1.490 | 0.471–4.707 | .497 | 82.98% | .003 | .532 |
| Corticosteroids | 25 | 7762 | 2367 | 5395 | MH | OR | Random | 2.814 | 1.943–4.077 | <.001 | 78.95% | <.001 | .720 |
| Intravenous immunoglobulin | 21 | 6108 | 1543 | 4565 | MH | OR | Random | 2.852 | 1.846–4.407 | <.001 | 80.86% | <.001 | .351 |
| ECMO | 13 | 2590 | 621 | 1969 | MH | OR | Random | 9.155 | 4.167–20.11 | <.001 | 0.0% | .623 | .038 |
| CRRT | 9 | 2386 | 672 | 1714 | MH | OR | Random | 15.72 | 6.321–39.09 | <.001 | 0.0% | .856 | .441 |
| NSAID | 2 | 1209 | 799 | 410 | MH | OR | Random | 1.321 | 0.613–2.846 | .478 | 53.03% | .145 | NA |
| G. Complications | |||||||||||||
| ARDS | 13 | 3734 | 932 | 2802 | MH | RR | Random | 8.161 | 4.777–13.94 | <.001 | 80.66% | <.001 | .673 |
| Acute cardiac injury | 13 | 2737 | 796 | 1941 | MH | RR | Random | 5.361 | 3.473–8.275 | <.001 | 53.64% | .011 | .766 |
| Arrhythmia | 7 | 1008 | 404 | 604 | MH | RR | Random | 3.646 | 1.081–12.30 | .037 | 84.94% | <.001 | .234 |
| Acute liver injury | 3 | 1111 | 196 | 915 | MH | RR | Random | 2.547 | 1.565–4.145 | <.001 | 41.67% | .180 | .370 |
| Acute kidney injury | 10 | 2761 | 759 | 2002 | MH | RR | Random | 5.524 | 2.836–10.76 | <.001 | 65.85% | .002 | .060 |
| H. Clinical classification | |||||||||||||
| Mild | 6 | 1026 | 299 | 727 | MH | RR | Random | 0.895 | 0.747–1.072 | .227 | 76.27% | .001 | .020 |
| Severe/critical | 38 | 7713 | 2078 | 5832 | MH | RR | Random | 0.97 | 0.66, 1.288 | .545 | 93.46% | <0.001 | .247 |
| I. Clinical outcome | |||||||||||||
| Hospitalized | 14 | 5183 | 1788 | 3395 | MH | RR | Random | 1.943 | 1.392–2.711 | <.001 | 95.30% | <.001 | .018 |
| Length of hospital stay (days) | 16 | 5370 | 1173 | 4197 | IV | MD | Random | 0.447 | −1.223 to 2.118 | .600 | 94.91% | <.001 | .328 |
| ICU admission | 18 | 5838 | 1346 | 4492 | MH | RR | Random | 2.560 | 1.622–4.041 | <.001 | 85.34% | <.001 | .289 |
| Mechanical ventilation | 7 | 1872 | 493 | 1379 | MH | OR | Random | 2.363 | 0.972–5.742 | .058 | 76.75% | <.001 | .042 |
| Length of ICU stay (days) | 3 | 427 | 166 | 261 | IV | MD | Random | 0.017 | −3.717 to 3.750 | .993 | 86.53% | .001 | .943 |
| Discharged | 14 | 5231 | 1154 | 4077 | MH | RR | Random | 0.714 | 0.604–0.844 | <.001 | 83.78% | <.001 | .029 |
| Mortality | 25 | 6786 | 1923 | 4863 | MH | RR | Random | 2.017 | 1.186–3.431 | .010 | 90.89% | <.001 | .093 |
Note: The random‐effects model was applied.
Abbreviations: ACE/ARB, angiotensin‐converting enzyme and an angiotensin receptor blocker; ALP, alkaline phosphatase; ALT, alanine aminotransferase; APTT, ativated partial thromboplastin time; ARDS, acute respiratory distress syndrome; AST, aspartate aminotransferase; BMI, body mass index; BUN, blood urea nitrogen; CD, cluster of differentiation; CI, confidence interval; CRP, C‐reactive protein; CRRT, continuous renal replacement therapy; COPD, chronic obstructive pulmonary disease; Duration of viral shedding, The time from diagnosis date to the day before first negative conversion of two consecutive negative results of RT‐PCR; ECMO, extracorporeal membrane oxygenation; eGFR, estimated glomerular filtration rate; ESR, erythrocyte sedimentation rate; GGT, Gamma‐Glutamyl transferase; I2, the ratio of true heterogeneity to total observed variation; IMV, invasive mechanical ventilation; IV, inverse variance; MD, mean difference; MH, Mantel–Haenszel; pub bias, publication bias assessed by Egger's test; NIV, noninvasive mechanical ventilation; NLR, neutrophil‐to‐Lymphocyte ratio; NSAID, nonsteroidal anti‐inflammatory drugs; NT‐proBNP, N‐terminal‐pro hormone B‐type natriuretic peptide; OR, odds ratio; PaCO2, The partial pressure of cardon dioxide; PaO2, The partial pressure of oxygen; PaO2:FiO2 ratio, the ratio of arterial oxygen partial pressure to fractional inspired oxygen; pH, a measure of hydrogen ion concentration, the acidity or alkalinity of blood; RR, relative risk; RBCs, red blood cells or erythrocytes; RT‐PCR, reverse transcription‐polymerase chain reaction; SMD, standardized mean difference; SpO2, oxygen saturation; WBCs, white blood cells or leukocytes;.
As depicted in Table 3G–I, despite lack of association with the degree of COVID‐19 severity and length of hospital stay, cases presenting with GI symptoms on admission were more subjected to complications including ARDS (RR = 8.16; 95% CI = 4.77–13.9, p < .001), acute cardiac injury (RR = 5.36; 95% CI = 3.47–8.27, p < .001), and AKI (RR = 5.52; 95% CI = 2.83–10.76, p < .001). Furthermore, GI cohorts showed a higher risk of ICU admission (RR = 2.56; 95% CI = 1.62–1.04, p < .001), and mortality (RR = 2.01; 95% CI = 1.18–3.43, p = .010).
Subgroup analysis by date of publication showed that affected cohorts in the first wave had a higher risk of being hospitalized (RR = 1.60; 95% CI = 1.15–2.22, p = .005), requiring ventilation (RR = 11.6; 95% CI = 5.08–26.9, p < .001), and ICU admission (RR = 3.0; 95% CI = 1.58–5.68, p < .001). However, patients in the second wave were less associated with hospitalization, ICU admission, mechanical ventilation, or mortality, although not reach significant levels (Figure 4). Meta‐regression analysis revealed that heterogeneity in mechanical ventilation parameters was partly related to geographical region (p = .012; Table S2).
Figure 4.
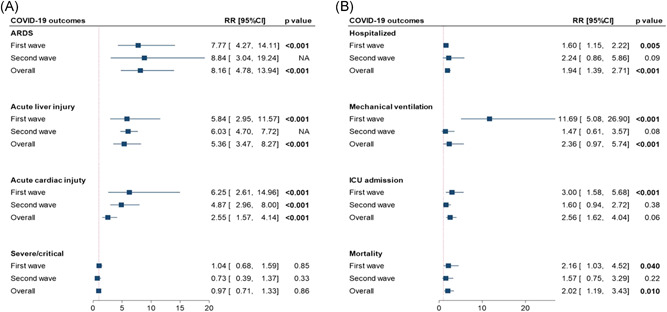
Subgroup analysis for pooled pairwise comparison analysis of coronavirus diease‐2019 outcomes by the pandemic wave. (A) Clinical outcomes. (B) Admission outcomes were compared between cohorts presented with versus without gastrointestinal manifestations. CI, confidence interval
4. DISCUSSION
SARS‐CoV‐2 has been found to infect multiple organ systems and is not exclusively a respiratory virus, as initially thought. Gastrointestinal symptoms have previously been reported to worsen outcomes in COVID‐19 patients, although it remains unclear as contradictory research also exists. 7
This relatively wide scoped meta‐analysis showed that GI symptoms were present in about one‐fifth of the study population and were associated with higher rates of adverse outcomes such as ICU admission and/or mortality. Furthermore, patients with GI symptoms were more likely to develop AKIs associated with worse outcomes in COVID‐19 patients. 143 , 144 Similarly, GI symptoms correlated with a greater risk of cardiac injury, another poor prognostic factor for hospitalized patients with COVID‐19. 145 , 146 The strong correlation between GI symptoms and the most unfavorable COVID‐19 outcomes in such a large population underscores the clinical importance of what was once considered incidental symptoms of the disease. Focused research should be conducted to understand the mechanism of how GI pathology may lead to severe and worse outcomes. With this knowledge, health care providers can more closely monitor and treat these symptoms, which may lower mortality. Of note, the fecal shedding rate of SARS‐CoV‐2 was more common than the rate of manifested GI symptoms of COVID‐19, suggesting that some patients with colonized GI tracts may be asymptomatic. While this is consistent with previous studies, the significance of this viral shedding is still unclear. 147 , 148 Future research should be conducted to evaluate the usefulness of viral stool studies in the workup of acutely ill patients with COVID‐19.
Regarding the geographical distribution, European patients had a greater GI symptoms rate than all other regions studied, which could be attributed to differences in reporting or different genetic variants between continents. Islam et al. report that the mutation rate in the SARS‐CoV‐2 genomic sequence is higher in Europe compared with Asia and North America. 149 Regarding the outcome, Asian patients were ventilated less often than non‐Asians. However, this might be due to the differences in medical practices between these geographic areas. Despite the discrepancy in ventilation rates, there were no differences in ARDS, AKI, or acute cardiac injury rates. Admission outcomes, including mortality, were likewise equal among Asian versus nonAsian patients.
Pandemics have historically come in waves with differing severities and lengths of time between them. 150 Consequentially, it is important to evaluate the success of the initial treatment interventions compared with the more recent treatment innovations; this can be done by comparing the outcomes of critically ill patients. A comparison between the early wave and subsequent wave of COVID‐19 infections was achieved by a sub‐group analysis of the enrolled studies. The second wave of cases showed more GI manifestations than first wave cases; however, this was not statistically significant. Pooled prevalence comparisons between early and late wave cases showed mixed results regarding outcome events. Early wave patients experienced greater rates of acute cardiac injury and ICU admission, and late wave patients had higher ARDS, AKI, mechanical ventilation, and mortality rates. This may be due to more patients in the second wave presenting with GI symptoms indicating severe disease. To directly compare patients with GI symptoms in each wave, a pairwise comparison analysis of patients with and without GI symptoms was performed. Second wave patients with GI symptoms were less likely to have acute cardiac injuries, be admitted to the ICU, receive mechanical ventilation, or die due to COVID‐19, compared with first wave patients with GI symptoms. This particular analytic method allowed a comparison between the more acutely ill patients showing GI symptoms, which demonstrated more accurate results than the pooled prevalence results.
Fan et al. 15 found that mortality rates in the second wave of the pandemic decreased sharply even among countries that saw a greater caseload than the first wave. In the studies analyzed for this meta‐analysis, there was an overall lower rate of complications and mortality in the GI symptom‐positive cohort of the second wave providing evidence of improved management of patients with COVID‐19, which agrees with the findings of Fan et al. 15 This meta‐analysis is further evidence of the decrease in mortality outcome that might be due to an improvement in the clinical handling of the disease. While many treatments have proven effective at improving the disease course in smaller trials, it is reassuring to see a large‐scale improvement in morbidity and mortality in severe cases. This is most likely due to the combined efforts of medical providers and public health officials in identifying severe COVID‐19 cases earlier and intervening appropriately. Also, likely contributing factors are the improvements in therapeutics, treatment algorithms, and familiarity with the disease course.
A limitation of this meta‐analysis was that it reviewed predominately retrospective studies making randomization impossible. Since not all studies had the primary goal of evaluating GI symptoms' impact on COVID‐19 outcomes, differences in the recording of symptoms between studies could be potentially present. While including studies throughout the world was beneficial for increasing the findings' generalizability, doing so might affect the data collected from differently impacted countries. This limitation was addressed by controlling analysis for a geographic area.
5. CONCLUSIONS
The findings of this meta‐analysis suggest that there is an association between gastrointestinal symptoms in patients with COVID‐19 and worse disease outcomes, especially in the first wave of infection. These symptoms were found to be common, appearing in approximately one‐fifth of studied patients. Screening patients for GI symptoms is quick and may benefit providers by offering a simple method for stratifying patient risk levels. By grouping the studies in the first wave and second wave categories, the analysis showed overall improved outcomes for patients who have more recently been treated for COVID‐19 regardless of their GI affection.
CONFLICT OF INTERESTS
The authors declare that there are no conflict of interests.
AUTHOR CONTRIBUTIONS
Rami M. Elshazli and Eman A. Toraih study design; Rami M. Elshazli, Abdelaziz Elgaml, Mohamed H. Aboutaleb, Mohamed M. Salim, Mahmoud Omar, Ruhul Munshi, Nicholas Mankowski, and Abdallah S. Attia: study identification and data extraction; Rami M. Elshazli, Mohammad H. Hussein, and Eman A. Toraih, statistical analysis; Rami M. Elshazli, Mohammad H. Hussein, Eman A. Toraih, Manal S. Fawzy, and Emad Kandil, data interpretation; Rami M. Elshazli, Adam Kline, and Eman A. Toraih, AS, Manal S. Fawzy, original draft preparation. All authors revised and approved the final version of the manuscript
Supporting information
Supporting information.
ACKNOWLEDGMENT
This work is dedicated to the soul of our beloved Professor Dr. Akram El Awady, the president and godfather of Horus University – Egypt, who passed away on February 3rd, 2021. We will miss you and love you always. Your love will light our way and your memory will be forever in our hearts. We will grasp you in our hearts till we can cuddle you again in Heaven.
Elshazli RM, Kline A, Elgaml A, et al. Gastroenterology manifestations and COVID‐19 outcomes: A meta‐analysis of 25,252 cohorts among the first and second waves. J Med Virol. 2021;93:2740–2768. 10.1002/jmv.26836
Contributor Information
Rami M. Elshazli, Email: Relshazly@horus.edu.eg.
Adam Kline, Email: akline1@tulane.edu.
Abdelaziz Elgaml, Email: Elgamel3a@mans.edu.eg.
Mohamed H. Aboutaleb, Email: maboutaleb@horus.edu.eg.
Mohamed M. Salim, Email: mmasalim@mans.edu.eg.
Ruhul Munshi, Email: munshicmc46@gmail.com.
Nicholas Mankowski, Email: nmankowski@tulane.edu.
Mohammad H. Hussein, Email: mhussein1@tulane.edu.
Abdallah S. Attia, Email: aattia@tulane.edu.
Eman A. Toraih, Email: etoraih@tulane.edu.
Ahmad Settin, Email: settin60@gmail.com.
Mary Killackey, Email: mkillack@tulane.edu.
Emad Kandil, Email: ekandil@tulane.edu.
DATA AVAILABILITY STATEMENT
The data that support the findings of this study are available in the manuscript and the supplementary materials.
REFERENCES
- 1. Wong SH, Lui RNS, Sung JJY. Covid‐19 and the digestive system. J Gastroenterol Hepatol. 2020;35(5):744‐748. [DOI] [PubMed] [Google Scholar]
- 2. Goh KJ, Kalimuddin S, Chan KS. Rapid progression to acute respiratory distress syndrome: review of current understanding of critical illness from coronavirus disease 2019 (COVID‐19) infection. Ann Acad Med Singapore. 2020;49:108‐118. [PubMed] [Google Scholar]
- 3. Terpos E, Ntanasis‐Stathopoulos I, Elalamy I, et al. Hematological findings and complications of COVID‐19. Am J Hematol. 2020;95:834‐847. [DOI] [PMC free article] [PubMed] [Google Scholar]
- 4. Pan F, Yang L, Li Y, et al. Factors associated with death outcome in patients with severe coronavirus disease‐19 (COVID‐19): a case‐control study. Int J Med Sci. 2020;17(9):1281‐1292. [DOI] [PMC free article] [PubMed] [Google Scholar]
- 5. Tian Y, Rong L, Nian W, He Y. gastrointestinal features in COVID‐19 and the possibility of faecal transmission. Aliment Pharmacol Ther. 2020;51(9):843‐851. [DOI] [PMC free article] [PubMed] [Google Scholar]
- 6. Ye Q, Wang B, Zhang T, Xu J, Shang S. The mechanism and treatment of gastrointestinal symptoms in patients with COVID‐19. Am J Physiol‐Gastrointest Liver Physiol. 2020;319(2):G245‐G252. [DOI] [PMC free article] [PubMed] [Google Scholar]
- 7. Gul F, Lo KB, Peterson J, McCullough PA, Goyal A, Rangaswami J. Meta‐analysis of outcomes of patients with COVID‐19 infection with versus without gastrointestinal symptoms. Paper presented at: Baylor University Medical Center Proceedings. 2020. [DOI] [PMC free article] [PubMed]
- 8. Lee IC, Huo T‐I, Huang Y‐H. Gastrointestinal and liver manifestations in patients with COVID‐19. J Chinese Med Assoc. 2020;83:521‐523. [DOI] [PMC free article] [PubMed] [Google Scholar]
- 9. Wang J, Li F, Wei H, Lian Z‐X, Sun R, Tian Z. Respiratory influenza virus infection induces intestinal immune injury via microbiota‐mediated Th17 cell–dependent inflammation. J Exp Med. 2014;211(12):2397‐2410. [DOI] [PMC free article] [PubMed] [Google Scholar]
- 10. Mao R, Qiu Y, He JS, et al. Manifestations and prognosis of gastrointestinal and liver involvement in patients with COVID‐19: a systematic review and meta‐analysis. Lancet Gastroenterol Hepatol. 2020;5(7):667‐678. [DOI] [PMC free article] [PubMed] [Google Scholar]
- 11. Ding S, Liang TJ. Is SARS‐CoV‐2 also an enteric pathogen with potential Fecal‐Oral transmission: a COVID‐19 virological and clinical review. Gastroenterology. 2020;159:53‐61. [DOI] [PMC free article] [PubMed] [Google Scholar]
- 12. Shamseer L, Moher D, Clarke M, et al. Preferred reporting items for systematic review and meta‐analysis protocols (PRISMA‐P) 2015: elaboration and explanation. BMJ. 2015;349:349‐g7647. [DOI] [PubMed] [Google Scholar]
- 13. Yan Y, Yang Y, Wang F, et al. Clinical characteristics and outcomes of patients with severe covid‐19 with diabetes. BMJ Open Diabetes Res Care. 2020;8(1):e001343. [DOI] [PMC free article] [PubMed] [Google Scholar]
- 14. Leung K, Wu JT, Liu D, Leung GM. First‐wave COVID‐19 transmissibility and severity in China outside Hubei after control measures, and second‐wave scenario planning: a modelling impact assessment. The Lancet. 2020;395:1382‐1393. [DOI] [PMC free article] [PubMed] [Google Scholar]
- 15. Fan G, Yang Z, Lin Q, Zhao S, Yang L, He D. Decreased case fatality rate of COVID‐19 in the second wave: a study in 53 countries or regions. Transbound Emerg Dis. 2020:tbed.13819. [DOI] [PubMed] [Google Scholar]
- 16. Higgins JPT, Thompson SG, Deeks JJ, Altman DG. Measuring inconsistency in meta‐analyses. BMJ. 2003;327(7414):557‐560. [DOI] [PMC free article] [PubMed] [Google Scholar]
- 17. Egger M, Smith GD, Schneider M, Minder C. Bias in meta‐analysis detected by a simple, graphical test. BMJ. 1997;315(7109):629‐634. [DOI] [PMC free article] [PubMed] [Google Scholar]
- 18. Li K, Wu J, Wu F, et al. The clinical and chest CT features associated with severe and critical COVID‐19 pneumonia. Invest Radiol. 2020;55(6):327‐331. [DOI] [PMC free article] [PubMed] [Google Scholar]
- 19. Aghemo A, Piovani D, Parigi TL, et al. Covid‐19 digestive system involvement and clinical outcomes in a large academic hospital in Milan, Italy. Clin Gastroenterol Hepatol. 2020;18(10):2366‐2368. [DOI] [PMC free article] [PubMed] [Google Scholar]
- 20. Ai J‐W, Zi H, Wang Y, et al. Clinical characteristics of COVID‐19 patients with gastrointestinal symptoms: an analysis of seven patients in China. Front Med. 2020;7:308. [DOI] [PMC free article] [PubMed] [Google Scholar]
- 21. Annweiler C, Sacco G, Salles N, et al. National French survey of COVID‐19 symptoms in people aged 70 and over. Clin Infect Dis. 2020. [DOI] [PMC free article] [PubMed] [Google Scholar]
- 22. Barillari MR, Bastiani L, Lechien JR, et al. A structural equation model to examine the clinical features of mild‐to‐moderate COVID‐19: A multicenter Italian study. J Med Virol. 2020;93:983‐994. [DOI] [PubMed] [Google Scholar]
- 23. Cai Q, Yang M, Liu D, et al. Experimental treatment with favipiravir for COVID‐19: an open‐label control study. Engineering. 2020;6:1192‐1198. [DOI] [PMC free article] [PubMed] [Google Scholar]
- 24. Cao C, Chen M, He L, Xie J, Chen X. Clinical features and outcomes of COVID‐19 patients with gastrointestinal symptoms. Crit Care. 2020;24(1):1‐3. [DOI] [PMC free article] [PubMed] [Google Scholar]
- 25. Cavaliere K, Levine C, Wander P, Sejpal DV, Trindade AJ. Management of upper GI bleeding in patients with COVID‐19 pneumonia. Gastrointest Endosc. 2020;92(2):454‐455. [DOI] [PMC free article] [PubMed] [Google Scholar]
- 26. Chang D, Lin M, Wei L, et al. Epidemiologic and clinical characteristics of novel coronavirus infections involving 13 patients outside Wuhan, China. JAMA. 2020;323(11):1092‐1093. [DOI] [PMC free article] [PubMed] [Google Scholar]
- 27. Chang D, Zhao P, Zhang D, et al. Persistent viral presence determines the clinical course of the disease in COVID‐19. J Allergy Clin Immunol: In Pract. 2020;8(8):2585‐2591. [DOI] [PMC free article] [PubMed] [Google Scholar]
- 28. Chen A, Agarwal A, Ravindran N, et al. Are gastrointestinal symptoms specific for coronavirus 2019 infection? A prospective case‐control study from the United States. Gastroenterology. 2020;159(3):1161‐1163e1162. [DOI] [PMC free article] [PubMed] [Google Scholar]
- 29. Chen F‐f, Zhong M, Liu Y, et al. The characteristics and outcomes of 681 severe cases with COVID‐19 in China. J Crit Care. 2020;60:32‐37. [DOI] [PMC free article] [PubMed] [Google Scholar]
- 30. Chen J, Qi T, Liu L, et al. Clinical progression of patients with COVID‐19 in Shanghai, China. J Infect. 2020;80:e1‐e6. [DOI] [PMC free article] [PubMed] [Google Scholar]
- 31. Chen L, Zhang B, Yang K, Zou Y, Zhang S. Clinical course of severe and critically ill patients with coronavirus disease 2019 (COVID‐19): a comparative study. J Infect. 2020;81:e82‐e84. [DOI] [PMC free article] [PubMed] [Google Scholar]
- 32. Chen M, An W, Xia F, et al. Clinical characteristics of re‐hospitalized patients with COVID‐19 in China. J Med Virol. 2020;92:2146‐2151. [DOI] [PMC free article] [PubMed] [Google Scholar]
- 33. Chen N, Zhou M, Dong X, et al. Epidemiological and clinical characteristics of 99 cases of 2019 novel coronavirus pneumonia in Wuhan, China: a descriptive study. The Lancet. 2020;395(10223):507‐513. [DOI] [PMC free article] [PubMed] [Google Scholar]
- 34. Chen R, Sang L, Jiang M, et al. Longitudinal hematologic and immunologic variations associated with the progression of COVID‐19 patients in China. J Allergy Clin Immunol. 2020;146:89‐100. [DOI] [PMC free article] [PubMed] [Google Scholar]
- 35. Chen X, Zhu B, Hong W, et al. Associations of clinical characteristics and treatment regimens with the duration of viral RNA shedding in patients with COVID‐19. Int J Infect Dis. 2020;98:252‐260. [DOI] [PMC free article] [PubMed] [Google Scholar]
- 36. Chen Y, Chen L, Deng Q, et al. The presence of SARS‐CoV‐2 RNA in the feces of COVID‐19 patients. J Med Virol. 2020;92:833‐840. [DOI] [PubMed] [Google Scholar]
- 37. Cholankeril G, Podboy A, Aivaliotis VI, et al. High prevalence of concurrent gastrointestinal manifestations in patients with severe acute respiratory syndrome coronavirus 2: Early experience From California. Gastroenterology. 2020;159(2):775‐777. [DOI] [PMC free article] [PubMed] [Google Scholar]
- 38. Deng W, Guang T‐w, Yang M, et al. Positive results for patients with COVID‐19 discharged form hospital in Chongqing, China. 2020. [DOI] [PMC free article] [PubMed]
- 39. Duan X, Guo X, Qiang J. A retrospective study of the initial 25 COVID‐19 patients in Luoyang, China. Jpn J Radiol. 2020;38:1‐690. [DOI] [PMC free article] [PubMed] [Google Scholar]
- 40. Effenberger M, Grabherr F, Mayr L, et al. Faecal calprotectin indicates intestinal inflammation in COVID‐19. Gut. 2020;69:1543‐1544. [DOI] [PMC free article] [PubMed] [Google Scholar]
- 41. Fang Z, Zhang Y, Hang C, Ai J, Li S, Zhang W. Comparisons of viral shedding time of SARS‐CoV‐2 of different samples in ICU and non‐ICU patients. J Infect. 2020;81(1):147‐178. [DOI] [PMC free article] [PubMed] [Google Scholar]
- 42. Ferm S, Fisher C, Pakala T, et al. Analysis of gastrointestinal and hepatic manifestations of SARS‐CoV‐2 infection in 892 patients in Queens, NY. Clin Gastroenterol Hepatol. 2020;18(10):2378‐2379. [DOI] [PMC free article] [PubMed] [Google Scholar]
- 43. Fu J, Kong J, Wang W, et al. The clinical implication of dynamic neutrophil to lymphocyte ratio and D‐dimer in COVID‐19: a retrospective study in Suzhou China. Thromb Res. 2020;192:3‐8. [DOI] [PMC free article] [PubMed] [Google Scholar]
- 44. Guan WJ, Ni ZY, Hu Y. Clinical characteristics of coronavirus disease 2019 in China. N Engl J Med. 2020;382:1708‐1720. [DOI] [PMC free article] [PubMed] [Google Scholar]
- 45. Hajifathalian K, Krisko T, Mehta A, et al. Gastrointestinal and hepatic manifestations of 2019 novel Coronavirus disease in a large cohort of infected patients from New York: clinical implications. Gastroenterology. 2020;159(3):1137‐1140. [DOI] [PMC free article] [PubMed] [Google Scholar]
- 46. Han C, Duan C, Zhang S, et al. Digestive symptoms in COVID‐19 patients with mild disease severity: clinical presentation, stool viral RNA testing, and outcomes. Am J Gastroenterol. 2020;115:916‐923. [DOI] [PMC free article] [PubMed] [Google Scholar]
- 47. Han J, Shi L, Xie Y, et al. Analysis of factors affecting the prognosis of COVID‐19 patients and viral shedding duration. Epidemiology & Infection. 2020;148:148. [DOI] [PMC free article] [PubMed] [Google Scholar]
- 48. Hong L‐X, Lin A, He Z‐B, et al. Mask wearing in pre‐symptomatic patients prevents SARS‐CoV‐2 transmission: an epidemiological analysis. Travel Med Infect Dis. 2020;36:101803. [DOI] [PMC free article] [PubMed] [Google Scholar]
- 49. Hu J, Zhang X, Zhang X, et al. COVID‐19 patients with hypertension have more severity condition, and ACEI/ARB treatment have no infulence on the clinical severity and outcome. J Infect. 2020;81:979‐997. [DOI] [PMC free article] [PubMed] [Google Scholar]
- 50. Huang C, Wang Y, Li X, et al. Clinical features of patients infected with 2019 novel coronavirus in Wuhan, China. Lancet. 2020;395(10223):497‐506. [DOI] [PMC free article] [PubMed] [Google Scholar]
- 51. Huang M, Yang Y, Shang F, et al. Clinical characteristics and predictors of disease progression in severe patients with COVID‐19 infection in Jiangsu Province, China: a descriptive study. Am J Med Sci. 2020;360:120‐128. [DOI] [PMC free article] [PubMed] [Google Scholar]
- 52. Jehi L, Ji X, Milinovich A, et al. Individualizing risk prediction for positive COVID‐19 testing: results from 11,672 patients. Chest. 2020. [DOI] [PMC free article] [PubMed] [Google Scholar]
- 53. Jin A, Yan B, Hua W, et al. Clinical characteristics of patients diagnosed with COVID‐19 in Beijing. Biosafety Health. 2020;2:104‐111. [DOI] [PMC free article] [PubMed] [Google Scholar]
- 54. Jin X, Lian J‐S, Hu J‐H, et al. Epidemiological, clinical and virological characteristics of 74 cases of coronavirus‐infected disease 2019 (COVID‐19) with gastrointestinal symptoms. Gut. 2020;69(6):1002‐1009. [DOI] [PMC free article] [PubMed] [Google Scholar]
- 55. Kaafarani HMA, El Moheb M, Hwabejire JO, et al. Gastrointestinal complications in critically ill patients with COVID‐19. Ann Surg. 2020;272:e61‐e62. [DOI] [PMC free article] [PubMed] [Google Scholar]
- 56. Lapostolle F, Schneider E, Vianu I, et al. Clinical features of 1487 COVID‐19 patients with outpatient management in the Greater Paris: the COVID‐call study. Intern Emerg Med. 2020;15:813‐817. [DOI] [PMC free article] [PubMed] [Google Scholar]
- 57. Lei Z, Cao H, Jie Y, et al. A cross‐sectional comparison of epidemiological and clinical features of patients with coronavirus disease (COVID‐19) in Wuhan and outside Wuhan, China. Travel Med Infect Dis. 2020;35:101664. [DOI] [PMC free article] [PubMed] [Google Scholar]
- 58. Leung C. Risk factors for predicting mortality in elderly patients with COVID‐19: a review of clinical data in China. Mech Ageing Dev. 2020;188:111255. [DOI] [PMC free article] [PubMed] [Google Scholar]
- 59. Li J, Gao R, Wu G, et al. Clinical characteristics of emergency surgery patients‐infected COVID‐19 pneumonia in Wuhan, China. Surgery. 2020. [DOI] [PMC free article] [PubMed] [Google Scholar]
- 60. Li J, Xu G, Yu H, Peng X, Luo Y. Clinical characteristics and outcomes of 74 patients with severe or critical COVID‐19. Am J Med Sci. 2020;360:229‐235. [DOI] [PMC free article] [PubMed] [Google Scholar]
- 61. Li W, Zhang B, Lu J, et al. The characteristics of household transmission of COVID‐19. Clin Infect Dis. 2020;71:1943‐1946. [DOI] [PMC free article] [PubMed] [Google Scholar]
- 62. Li X, Xu S, Yu M, et al. Risk factors for severity and mortality in adult COVID‐19 inpatients in Wuhan. J Allergy Clin Immunol. 2020;146:110‐118. [DOI] [PMC free article] [PubMed] [Google Scholar]
- 63. Liang Y, Xu J, Chu M, et al. Neurosensory dysfunction: a diagnostic marker of early COVID‐19. Int J Infect Dis. 2020;98:347‐352. [DOI] [PMC free article] [PubMed] [Google Scholar]
- 64. Lin L, Jiang X, Zhang Z, et al. Gastrointestinal symptoms of 95 cases with SARS‐CoV‐2 infection. Gut. 2020;69(6):997‐1001. [DOI] [PubMed] [Google Scholar]
- 65. Lin W, Xie Z, Li Y, et al. Association between detectable SARS‐COV‐2 RNA in anal swabs and disease severity in patients with coronavirus disease 2019. J Med Virol. 2020;93:794‐802. [DOI] [PMC free article] [PubMed] [Google Scholar]
- 66. Liu BM, Yang QQ, Zhao LY, Xie W, Si XY. Epidemiological characteristics of COVID‐19 patients in convalescence period. Epidemiol Infect. 2020:1‐31. [DOI] [PMC free article] [PubMed] [Google Scholar]
- 67. Liu F, Li L, Xu M, et al. Prognostic value of interleukin‐6, C‐reactive protein, and procalcitonin in patients with COVID‐19. J Clin Virol. 2020;127:104370. [DOI] [PMC free article] [PubMed] [Google Scholar]
- 68. Liu F, Long X, Ji G, et al. Clinically significant portal hypertension in cirrhosis patients with COVID‐19: clinical characteristics and outcomes. J Infect. 2020;81(2):e178‐e180. [DOI] [PMC free article] [PubMed] [Google Scholar]
- 69. Liu F, Xu A, Zhang Y, et al. Patients of COVID‐19 may benefit from sustained lopinavir‐combined regimen and the increase of eosinophil may predict the outcome of COVID‐19 progression. Int J Infect Dis. 2020;95:183‐191. [DOI] [PMC free article] [PubMed] [Google Scholar]
- 70. Liu J, Li S, Liu J, et al. Longitudinal characteristics of lymphocyte responses and cytokine profiles in the peripheral blood of SARS‐CoV‐2 infected patients. EBioMedicine. 2020;55:102763. [DOI] [PMC free article] [PubMed] [Google Scholar]
- 71. Liu K, Fang Y‐Y, Deng Y, et al. Clinical characteristics of novel coronavirus cases in tertiary hospitals in Hubei Province. Chin Med J. 2020;133:1025‐1031. [DOI] [PMC free article] [PubMed] [Google Scholar]
- 72. Liu Y, Yang Y, Zhang C, et al. Clinical and biochemical indexes from 2019‐nCoV infected patients linked to viral loads and lung injury. Sci China Life Sci. 2020;63(3):364‐374. [DOI] [PMC free article] [PubMed] [Google Scholar]
- 73. Lo IL, Lio CF, Cheong HH, et al. Evaluation of SARS‐CoV‐2 RNA shedding in clinical specimens and clinical characteristics of 10 patients with COVID‐19 in Macau. Int J Biol Sci. 2020;16(10):1698‐1707. [DOI] [PMC free article] [PubMed] [Google Scholar]
- 74. Lui G, Ling L, Lai CK, et al. Viral dynamics of SARS‐CoV‐2 across a spectrum of disease severity in COVID‐19. J Infect. 2020;81:318‐356. [DOI] [PMC free article] [PubMed] [Google Scholar]
- 75. Luo S, Zhang X, Xu H. Don't overlook digestive symptoms in patients with 2019 novel coronavirus disease (COVID‐19). Clin Gastroenterol Hepatol. 2020;18(7):1636‐1637. [DOI] [PMC free article] [PubMed] [Google Scholar]
- 76. Mao B, Liu Y, Chai Y‐H, et al. Assessing risk factors for SARS‐CoV‐2 infection in patients presenting with symptoms in Shanghai, China: a multicentre, observational cohort study. Lancet Digit Health. 2020;2:e323‐e330. [DOI] [PMC free article] [PubMed] [Google Scholar]
- 77. Mo P, Xing Y, Xiao Y, et al. Clinical characteristics of refractory COVID‐19 pneumonia in Wuhan, China. Clin Infect Dis. 2020. [DOI] [PMC free article] [PubMed] [Google Scholar]
- 78. Nobel YR, Phipps M, Zucker J, et al. Gastrointestinal symptoms and coronavirus disease 2019: a case‐control study from the United States. Gastroenterology. 2020;159(1):373‐375. [DOI] [PMC free article] [PubMed] [Google Scholar]
- 79. Noh JY, Yoon JG, Seong H, et al. Asymptomatic infection and atypical manifestations of COVID‐19: comparison of viral shedding duration. J Infect. 2020;81:816‐846. [DOI] [PMC free article] [PubMed] [Google Scholar]
- 80. Ortiz‐Brizuela E, Villanueva‐Reza M, González‐Lara MF, et al. Clinical and epidemiological characteristics of patients diagnosed with COVID‐19 in a tertiary care center in Mexico City: a prospective cohort study. Rev Invest Clin; organo del Hospital de Enfermedades de la Nutricion. 2020;72(3):165‐177. [DOI] [PubMed] [Google Scholar]
- 81. Pan L, Mu M, Yang P, et al. Clinical characteristics of COVID‐19 patients with digestive symptoms in Hubei, China: a descriptive, cross‐sectional, multicenter study. Am J Gastroenterol. 2020;115:115‐773. [DOI] [PMC free article] [PubMed] [Google Scholar]
- 82. Park S‐k, Lee C‐W, Park D‐I, et al. Detection of SARS‐CoV‐2 in fecal samples from patients with asymptomatic and mild COVID‐19 in Korea. Clin Gastroenterol Hepatol. 2020. [DOI] [PMC free article] [PubMed] [Google Scholar]
- 83. Peng S, Huang L, Zhao B, et al. Clinical course of coronavirus disease 2019 in 11 patients after thoracic surgery and challenges in diagnosis. J Thorac Cardiovasc Surg. 2020;160:585‐592.e2. [DOI] [PMC free article] [PubMed] [Google Scholar]
- 84. Poggiali E, Ramos PM, Bastoni D, Vercelli A, Magnacavallo A. Abdominal pain: a real challenge in novel COVID‐19 infection. Eur J Case Rep Int Med. 2020;7(4). [DOI] [PMC free article] [PubMed] [Google Scholar]
- 85. Qi L, Yang Y, Jiang D, et al. Factors associated with duration of viral shedding in adults with COVID‐19 outside of Wuhan, China: a retrospective cohort study. Int J Infect Dis. 2020;96:531‐537. [DOI] [PMC free article] [PubMed] [Google Scholar]
- 86. Ramachandran P, Onukogu I, Ghanta S, et al. Gastrointestinal symptoms and outcomes in hospitalized coronavirus disease 2019 patients. Dig Dis. 2020;38(5):373‐379. [DOI] [PMC free article] [PubMed] [Google Scholar]
- 87. Redd WD, Zhou JC, Hathorn KE, et al. Prevalence and characteristics of gastrointestinal symptoms in patients with SARS‐CoV‐2 infection in the United States: a multicenter cohort study. Gastroenterology. 2020;159:765‐767. [DOI] [PMC free article] [PubMed] [Google Scholar]
- 88. Remes‐Troche JM, Ramos‐de‐la‐Medina A, Manríquez‐Reyes M, Martínez‐Pérez‐Maldonado L, Lara EL, Solís‐González MA. Initial gastrointestinal manifestations in patients with severe acute respiratory syndrome coronavirus 2 infection in 112 patients from Veracruz in Southeastern Mexico. Gastroenterology. 2020;159(3):1179‐1181. [DOI] [PMC free article] [PubMed] [Google Scholar]
- 89. Rivera‐Izquierdo M, Valero‐Ubierna MC, Martínez‐Diz S, et al. Clinical factors, preventive behaviours and temporal outcomes associated with COVID‐19 infection in health professionals at a spanish hospital. Int J Environ Res Public Health. 2020;17(12):4305. [DOI] [PMC free article] [PubMed] [Google Scholar]
- 90. Shi H, Han X, Jiang N, et al. Radiological findings from 81 patients with COVID‐19 pneumonia in Wuhan, China: a descriptive study. Lancet Infect Dis. 2020;20:425‐434. [DOI] [PMC free article] [PubMed] [Google Scholar]
- 91. Sun H, Ning R, Tao Y, et al. Risk factors for mortality in 244 older adults with COVID‐19 in Wuhan, China: a retrospective study. J Am Geriatr Soc. 2020;68. [DOI] [PMC free article] [PubMed] [Google Scholar]
- 92. Tabata S, Imai K, Kawano S, et al. Clinical characteristics of COVID‐19 in 104 people with SARS‐CoV‐2 infection on the Diamond Princess cruise ship: a retrospective analysis. Lancet Infect Dis. 2020;20:1043‐1050. [DOI] [PMC free article] [PubMed] [Google Scholar]
- 93. To KKW, Tsang OTY, Leung WS, et al. Temporal profiles of viral load in posterior oropharyngeal saliva samples and serum antibody responses during infection by SARS‐CoV‐2: an observational cohort study. Lancet Infect Dis. 2020;20(5):565‐574. [DOI] [PMC free article] [PubMed] [Google Scholar]
- 94. Tomlins J, Hamilton F, Gunning S, Sheehy C, Moran E, MacGowan A. Clinical features of 95 sequential hospitalised patients with novel coronavirus 2019 disease (COVID‐19), the first UK cohort. J Infect. 2020;81:e59‐e61. [DOI] [PMC free article] [PubMed] [Google Scholar]
- 95. Wan Y, Li J, Shen L, et al. Enteric involvement in hospitalised patients with COVID‐19 outside Wuhan. Lancet Gastroenterol Hepatol. 2020;5(6):534‐535. [DOI] [PMC free article] [PubMed] [Google Scholar]
- 96. Wang D, Hu B, Hu C, et al. Clinical characteristics of 138 hospitalized patients with 2019 novel coronavirus–infected pneumonia in Wuhan, China. JAMA. 2020;323(11):1061‐1069. [DOI] [PMC free article] [PubMed] [Google Scholar]
- 97. Wang K, Kang S, Tian R, Zhang X, Wang Y. Imaging manifestations and diagnostic value of chest CT of coronavirus disease 2019 (COVID‐19) in the Xiaogan area. Clin Radiol. 2020;75:341‐347. [DOI] [PMC free article] [PubMed] [Google Scholar]
- 98. Wang R, Pan M, Zhang X, et al. Epidemiological and clinical features of 125 hospitalized patients with COVID‐19 in Fuyang, Anhui, China. Int J Infect Dis. 2020;95:421‐428. [DOI] [PMC free article] [PubMed] [Google Scholar]
- 99. Wang X, Fang J, Zhu Y, et al. Clinical characteristics of non‐critically ill patients with novel coronavirus infection (COVID‐19) in a Fangcang Hospital. Clin Microbiol Infect. 2020;26:1063‐1068. [DOI] [PMC free article] [PubMed] [Google Scholar]
- 100. Wang Z, Yang B, Li Q, Wen L, Zhang R. Clinical features of 69 cases with coronavirus disease 2019 in Wuhan, China. Clin Infect Dis. 2020;71:769‐777. [DOI] [PMC free article] [PubMed] [Google Scholar]
- 101. Wei X‐S, Wang X, Niu Y‐R, et al. Diarrhea is associated with prolonged symptoms and viral carriage in COVID‐19. Clin Gastroenterol Hepatol. 2020. [DOI] [PMC free article] [PubMed] [Google Scholar]
- 102. Wei Y‐Y, Wang R‐R, Zhang D‐W, et al. Risk factors for severe COVID‐19: Evidence from 167 hospitalized patients in Anhui, China. J Infect. 2020;81:e89‐e92. [DOI] [PMC free article] [PubMed] [Google Scholar]
- 103. Wu J, Liu J, Zhao X, et al. Clinical characteristics of imported cases of coronavirus disease 2019 (COVID‐19) in Jiangsu Province: a multicenter descriptive study. Clin Infect Dis. 2020;71:706‐712. [DOI] [PMC free article] [PubMed] [Google Scholar]
- 104. Xie J, Shi D, Bao M, et al. A predictive nomogram for predicting improved clinical outcome probability in patients with COVID‐19 in Zhejiang Province, China. Engineering. 2020. [DOI] [PMC free article] [PubMed] [Google Scholar]
- 105. Xiong Y, Sun D, Liu Y, et al. Clinical and high‐resolution CT features of the COVID‐19 infection: comparison of the initial and follow‐up changes. Invest Radiol. 2020;55:332‐339. [DOI] [PMC free article] [PubMed] [Google Scholar]
- 106. Xu K, Chen Y, Yuan J, et al. Factors associated with prolonged viral RNA shedding in patients with COVID‐19. Clin Infect Dis. 2020. [DOI] [PMC free article] [PubMed] [Google Scholar]
- 107. Xu X, Yu C, Qu J, et al. Imaging and clinical features of patients with 2019 novel coronavirus SARS‐CoV‐2. Eur J Nucl Med Mol Imaging. 2020;47:1‐6. [DOI] [PMC free article] [PubMed] [Google Scholar]
- 108. Xu X‐W, Wu X‐X, Jiang X‐G, et al. Clinical findings in a group of patients infected with the 2019 novel coronavirus (SARS‐Cov‐2) outside of Wuhan, China: retrospective case series. BMJ. 2020:368. [DOI] [PMC free article] [PubMed] [Google Scholar]
- 109. Yang W, Cao Q, Qin L, et al. Clinical characteristics and imaging manifestations of the 2019 novel coronavirus disease (COVID‐19): a multi‐center study in Wenzhou city, Zhejiang, China. J Infect. 2020;80:388‐393. [DOI] [PMC free article] [PubMed] [Google Scholar]
- 110. Yang X, Yu Y, Xu J, et al. Clinical course and outcomes of critically ill patients with SARS‐CoV‐2 pneumonia in Wuhan, China: a single‐centered, retrospective, observational study. Lancet Respir Med. 2020;8:475‐481. [DOI] [PMC free article] [PubMed] [Google Scholar]
- 111. Yang Y, Shen C, Li J, et al. Plasma IP‐10 and MCP‐3 levels are highly associated with disease severity and predict the progression of COVID‐19. J Allergy Clin Immunol. 2020;146:119‐127. [DOI] [PMC free article] [PubMed] [Google Scholar]
- 112. Yin S, Peng Y, Ren Y, et al. The implications of preliminary screening and diagnosis: clinical characteristics of 33 mild patients with SARS‐CoV‐2 infection in Hunan, China. J Clin Virol. 2020;128:104397. [DOI] [PMC free article] [PubMed] [Google Scholar]
- 113. Yoshimura Y, Sasaki H, Horiuchi H, Miyata N, Tachikawa N. Clinical characteristics of the coronavirus disease 2019 (COVID‐19) outbreak on a cruise ship. J Infect Chemother. 2020;26:1177‐1180. [DOI] [PMC free article] [PubMed] [Google Scholar]
- 114. Young BE, Ong SWX, Kalimuddin S, et al. Epidemiologic features and clinical course of patients infected with SARS‐CoV‐2 in Singapore. JAMA. 2020;323(15):1488‐1494. [DOI] [PMC free article] [PubMed] [Google Scholar]
- 115. Zayet S, Kadiane‐Oussou NJ, Lepiller Q, et al. Clinical features of COVID‐19 and influenza: a comparative study on Nord Franche‐Comte cluster. Microb Infect. 2020;22(9):481‐488. [DOI] [PMC free article] [PubMed] [Google Scholar]
- 116. Zeng QL, Li GM, Ji F, et al. Clinical course and treatment efficacy of COVID‐19 near Hubei Province, China: a multicentre, retrospective study. Transbound Emerg Dis. 2020;67:2971‐2982. [DOI] [PMC free article] [PubMed] [Google Scholar]
- 117. Zhang G, Hu C, Luo L, et al. Clinical features and short‐term outcomes of 221 patients with COVID‐19 in Wuhan, China. J Clin Virol. 2020;127:104364. [DOI] [PMC free article] [PubMed] [Google Scholar]
- 118. Zhang H, Wang L, Chen Y, et al. Outcomes of novel coronavirus disease 2019 (COVID‐19) infection in 107 patients with cancer from Wuhan, China. Cancer. 2020;126(17):4023‐4031. [DOI] [PMC free article] [PubMed] [Google Scholar]
- 119. Zhang J, Wang X, Jia X, et al. Risk factors for disease severity, unimprovement, and mortality of COVID‐19 patients in Wuhan, China. Clin Microbiol Infect. 2020;26:767‐772. [DOI] [PMC free article] [PubMed] [Google Scholar]
- 120. Zhang J, Xu D, Xie B, et al. Poor‐sleep is associated with slow recovery from lymphopenia and an increased need for ICU care in hospitalized patients with COVID‐19: a retrospective cohort study. Brain Behav Immun. 2020;88:50‐58. [DOI] [PMC free article] [PubMed] [Google Scholar]
- 121. Zhang J, Yu M, Tong S, Liu L‐Y, Tang L‐V. Predictive factors for disease progression in hospitalized patients with coronavirus disease 2019 in Wuhan, China. J Clin Virol. 2020;127:104392. [DOI] [PMC free article] [PubMed] [Google Scholar]
- 122. Zhang J, Dong X, Cao Y, et al. Clinical characteristics of 140 patients infected with SARS‐CoV‐2 in Wuhan, China. Allergy. 2020;75:1730‐1741. [DOI] [PubMed] [Google Scholar]
- 123. Zhang L, Han C, Zhang S, et al. Diarrhea and altered inflammatory cytokine pattern in severe coronavirus disease 2019: impact on disease course and in‐hospital mortality. J Gastroenterol Hepatol. 2020:jgh.15166 [DOI] [PubMed] [Google Scholar]
- 124. Zhang L, Mei Q, Li L, et al. Analysis of gastrointestinal symptoms in 80 patients with coronavirus disease 2019. Zhonghua wei Zhong Bing ji jiu yi xue. 2020;32(4):412‐416. [DOI] [PubMed] [Google Scholar]
- 125. Zhang L, Zhu F, Xie L, et al. Clinical characteristics of COVID‐19‐infected cancer patients: a retrospective case study in three hospitals within Wuhan, China. Ann Oncol. 2020;31:894‐901. [DOI] [PMC free article] [PubMed] [Google Scholar]
- 126. Zhang P, He Z, Yu G, et al. The modified NUTRIC score can be used for nutritional risk assessment as well as prognosis prediction in critically ill COVID‐19 patients. Clin Nutr. 2020. [DOI] [PMC free article] [PubMed] [Google Scholar]
- 127. Zhang X, Cai H, Hu J, et al. Epidemiological, clinical characteristics of cases of SARS‐CoV‐2 infection with abnormal imaging findings. Int J Infect Dis. 2020;94:81‐87. [DOI] [PMC free article] [PubMed] [Google Scholar]
- 128. Zuo T, Zhan H, Zhang F, et al. Alterations in fecal fungal microbiome of patients with COVID‐19 during time of hospitalization until discharge. Gastroenterology. 2020;159:1302‐1310. [DOI] [PMC free article] [PubMed] [Google Scholar]
- 129. Zhao D, Yao F, Wang L, et al. A comparative study on the clinical features of COVID‐19 pneumonia to other pneumonias. Clin Infect Dis. 2020;71:756‐761. [DOI] [PMC free article] [PubMed] [Google Scholar]
- 130. Zhao F, Yang Y, Wang Z, Li L, Liu L, Liu Y. The time sequences of respiratory and rectal viral shedding in patients with coronavirus disease 2019. Gastroenterology. 2020;159(3):1158‐1160. [DOI] [PMC free article] [PubMed] [Google Scholar]
- 131. Zhao W, Zhong Z, Xie X, Yu Q, Liu J. Relation between chest CT findings and clinical conditions of coronavirus disease (COVID‐19) pneumonia: a multicenter study. AJR Am J Roentgenol. 2020;214(5):1072‐1077. [DOI] [PubMed] [Google Scholar]
- 132. Zheng S, Fan J, Yu F, et al. Viral load dynamics and disease severity in patients infected with SARS‐CoV‐2 in Zhejiang province, China, January‐March 2020: retrospective cohort study. BMJ. 2020:369. [DOI] [PMC free article] [PubMed] [Google Scholar]
- 133. Zheng T, Yang C. Wang Hy, et al. Clinical characteristics and outcomes of COVID‐19 patients with gastrointestinal symptoms admitted to Jianghan Fangcang Shelter Hospital in Wuhan, China. J Med Virol. 2020;92:2735‐2741. [DOI] [PMC free article] [PubMed] [Google Scholar]
- 134. Zheng Y, Xiong C, Liu Y, et al. Epidemiological and clinical characteristics analysis of COVID‐19 in the surrounding areas of Wuhan, Hubei Province in 2020. Pharmacol Res. 2020;157:104821. [DOI] [PMC free article] [PubMed] [Google Scholar]
- 135. Zhong Q, Liu YY, Luo Q, et al. Spinal anaesthesia for patients with coronavirus disease 2019 and possible transmission rates in anaesthetists: retrospective, single‐centre, observational cohort study. Br J Anaesth. 2020;124:670‐675. [DOI] [PMC free article] [PubMed] [Google Scholar]
- 136. Zhou B, She J, Wang Y, Ma X. The duration of viral shedding of discharged patients with severe COVID‐19. Clin Infect Dis. 2020;71:2240‐2242. [DOI] [PMC free article] [PubMed] [Google Scholar]
- 137. Zhou F, Yu T, Du R, et al. Clinical course and risk factors for mortality of adult inpatients with COVID‐19 in Wuhan, China: a retrospective cohort study. The lancet. 2020;395:1054‐1062. [DOI] [PMC free article] [PubMed] [Google Scholar]
- 138. Zhou Z, Zhao N, Shu Y, Han S, Chen B, Shu X. Effect of gastrointestinal symptoms in patients with COVID‐19. Gastroenterology. 2020;158(8):2294‐2297. [DOI] [PMC free article] [PubMed] [Google Scholar]
- 139. Zhu H, Fu L, Jin Y, et al. Clinical features of COVID‐19 convalescent patients with re‐positive nucleic acid detection. J Clin Lab Anal. 2020;34:e23392. [DOI] [PMC free article] [PubMed] [Google Scholar]
- 140. Zhu Z, Cai T, Fan L, et al. Clinical value of immune‐inflammatory parameters to assess the severity of coronavirus disease 2019. Int J Infect Dis. 2020;95:332‐339. [DOI] [PMC free article] [PubMed] [Google Scholar]
- 141. Zou X, Fang M, Li S, et al. Characteristics of liver function in patients with SARS‐CoV‐2 and chronic HBV coinfection. Clin Gastroenterol Hepatol. 2020. [DOI] [PMC free article] [PubMed] [Google Scholar]
- 142. Cholankeril G, Podboy A, Aivaliotas V, et al. Association of digestive symptoms and hospitalization in patients with SARS‐CoV‐2 infection. medRxiv. 2020. [DOI] [PMC free article] [PubMed] [Google Scholar]
- 143. Cheng Y, Luo R, Wang K, et al. Kidney disease is associated with in‐hospital death of patients with COVID‐19. Kidney Int. 2020;97:829‐838. [DOI] [PMC free article] [PubMed] [Google Scholar]
- 144. Chan L, Jaladanki SK, Somani S, et al. AKI in hospitalized patients with COVID‐19. J Am Soc Nephrol. 2020. [DOI] [PMC free article] [PubMed] [Google Scholar]
- 145. Tian W, Jiang W, Yao J, et al. Predictors of mortality in hospitalized COVID‐19 patients: a systematic review and meta‐analysis. J Med Virol. 2020;92:1875‐1883. [DOI] [PMC free article] [PubMed] [Google Scholar]
- 146. Shi S, Qin M, Shen B, et al. Association of cardiac injury with mortality in hospitalized patients with COVID‐19 in Wuhan, China. JAMA Cardiol. 2020;5(7):802‐810. [DOI] [PMC free article] [PubMed] [Google Scholar]
- 147. Parasa S, Desai M, Thoguluva Chandrasekar V, et al. Prevalence of Gastrointestinal Symptoms and Fecal Viral Shedding in Patients With Coronavirus Disease 2019: A Systematic Review and Meta‐analysis. JAMA Network Open. 2020;3(6):e2011335. [DOI] [PMC free article] [PubMed] [Google Scholar]
- 148. Cheung KS, Hung IFN, Chan PPY, et al. Gastrointestinal manifestations of SARS‐CoV‐2 infection and virus load in fecal samples from the Hong Kong cohort and systematic review and meta‐analysis. Gastroenterology. 2020. [DOI] [PMC free article] [PubMed] [Google Scholar]
- 149. Islam OK, Al‐Emran HM, Hasan MS, Anwar A, Jahid MIK, Hossain MA. Emergence of European and North American mutant variants of SARS‐CoV‐2 in South‐East Asia. Transbound Emerg Dis. 2020:tbed.13748 [DOI] [PMC free article] [PubMed] [Google Scholar]
- 150. Jefferson T, Heneghan C. COVID‐19 epidemic 'waves'. Cebmnet. 2020:30. [Google Scholar]
Associated Data
This section collects any data citations, data availability statements, or supplementary materials included in this article.
Supplementary Materials
Supporting information.
Data Availability Statement
The data that support the findings of this study are available in the manuscript and the supplementary materials.