

Abstract
Evidence in the literature suggests that air pollution exposure affects outcomes of patients with COVID‐19. However, the extent of this effect requires further investigation. This study was designed to investigate the relationship between long‐term exposure to air pollution and the case fatality rate (CFR) of patients with COVID‐19. The data on air quality index (AQI), PM2.5, PM10, SO2, NO2, and O3 from 14 major cities in China in the past 5 years (2015–2020) were collected, and the CRF of COVID‐19 patients in these cities was calculated. First, we investigated the correlation between CFR and long‐term air quality indicators. Second, we examined the air pollutants affecting CFR and evaluated their predictive values. We found a positive correlation between the CFR and AQI (1, 3, and 5 years), PM2.5 (1, 3, and 5 years), and PM10 (1, 3, and 5 years). Further analysis indicated the more significant correlation for both AQI (3 and 5 years) and PM2.5 (1, 3, and 5 years) with CFR, and moderate predictive values for air pollution indicators such as AQI (1, 3, and 5 years) and PM2.5 (1, 3, and 5 years) for CFR. Our results indicate that long‐term exposure to severe air pollution is associated with higher CFR of COVID‐19 patients. Air pollutants such as PM2.5 may assist with the prediction of CFR for COVID‐19 patients.
Keywords: case fatality rate, COVID‐19, long‐term air pollution
Abbreviations
- AQI
air quality index
- CFR
case fatality rate
- COPD
chronic obstructive pulmonary disease
- COVID‐19
coronavirus disease 2019
- WHO
World Health Organization
1. INTRODUCTION
The novel coronavirus (COVID‐19) was first reported in Wuhan, China, in December 2019, 1 , 2 and then spread rapidly worldwide. COVID‐19 was declared a pandemic by the World Health Organization (WHO) in March 2020. 3 In China, the burden of COVID‐19 has recently been curtailed to manageable levels. However, in other countries and regions, the virus is still threatening human life, as indicated by the increasing number of confirmed cases and deaths around the world. According to the data from the WHO, the mortality rate of this epidemic varies in different countries from 0.9% to 18.4%. At present, COVID‐19 remains a significant obstacle to the recovery of the world economy and people's everyday lives and functions. Identifying the relevant factors that affect the mortality rate for COVID‐19 patients is urgently needed, which may improve the confidence and means available to physicians in the treatment of the COVID‐19 infection and reduce public health concerns regarding COVID‐19.
Previous studies have found that the morbidity and mortality of COVID‐19 patients were related to their general health or presence of comorbidities, such as gender, age, hypertension, diabetes, and obesity. 4 , 5 , 6 , 7 , 8 Air pollution can stimulate respiratory and systemic inflammatory responses, and the primary affected organ of both COVID‐19 and air pollution is the respiratory system. It has been demonstrated that air pollution increases the incidence of airway inflammation and lung diseases. 9 , 10 Recent research has indicated that short‐term exposure to air pollution increases the risk of COVID‐19 infection, 11 , 12 , 13 and the relationship between the long‐term air pollution exposure and the outcome of patients with COVID‐19 has been investigated but no consensus has been reached. 14 , 15 In this study, the objective was to investigate the effects of long‐term exposure to air pollution on the case fatality rate (CFR) of patients with COVID‐19 in 14 cities in China.
2. METHODS
2.1. Data collection
Inclusion criteria: (I) Major cities in China; (II) more than 100 confirmed cases of COVID‐19 in the city until April 28th, 2020; and (III) available air quality data of the city on the China Air Quality Online Monitoring and Analysis Platform (https://www.aqistudy.cn).
The number of confirmed cases, deaths, and discharges during the epidemic period in the city were archived from the official websites of national or urban Health Commissions (http://www.nhc.gov.cn). The CFR of COVID‐19 patients in the city was calculated as CFR = number of deaths/(number of deaths + number of discharges).
Data of air quality index (AQI), PM2.5, PM10, SO2, NO2, and O3 across the same time period for the 14 cities were collected, and the average values in the past 1‐, 3‐, and 5‐year period were calculated.
2.2. Statistical analysis
SPSS software Version 25.0 (IBM; Armonk) was used for all the statistical analyses. Shapiro–Wilk test was used to analyze whether the indicator conformed to the normal distribution. A simple scatter plot was used to illustrate the relationship between air quality indicators of 1, 3, and 5 years and the CFR. The Pearson correlation or the Spearman test was performed for normally distributed variables. The average CFR of the recorded Chinese population (excluding Hubei Province) is 0.86%. This cohort was divided into a low CFR group (CFR <0.86%; n = 6) and a high CFR group (CFR >0.86%; n = 8). All continuous variables were presented as the mean ± SD, and were compared with an independent t test for normally distributed variables. In addition, the receiver operating characteristic curve (ROC) was determined. A p value of less than .05 was considered statistically significant.
3. RESULTS
A total of 14 cities were included in this study (Figure 1 and Table 1). Of all the participants, 4247 COVID‐19 patients recovered and 47 died. The overall CFR was 1.09%. The average daily concentrations of AQI, PM2.5, PM10, SO2, NO2, and O3 in the past 5 years were 84.17 μg/m3, 47.80 μg/m3, 75.88 μg/m3, 12.36 μg/m3, 41.81 μg/m3, and 90.59 μg/m3, respectively (Table 1 and Table S1). The trend of several air pollution indicators in these 14 cities over the past 5 years is shown in Figure 2A–F.
Figure 1.
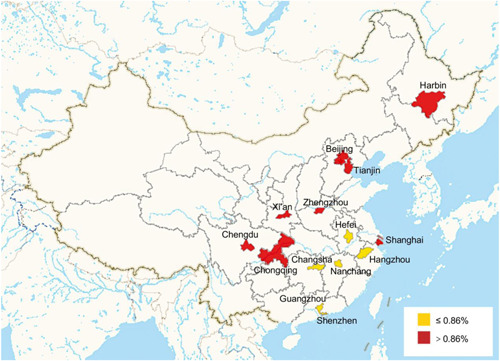
Geographic patterns of COVID‐19 CFR in the 14 cities in China till April 28th, 2020. CFR, case fatality rate
Table 1.
Descriptive statistics on COVID‐19 case fatality rate and long‐term air pollution indicators (AQI, PM2.5, NO2) in 14 representative cities of China
| cities | Total cured | Total death | Case fatality rate (%) | AQI (1 year) | AQI (3 years) | AQI (5 years) | PM2.5 (1 year) μg/m3 | PM2.5 (3 years) μg/m3 | PM2.5 (5 years) μg/m3 | NO2 (1 year) μg/m3 | NO2 (3 years) μg/m3 | NO2 (5 years) μg/m3 |
|---|---|---|---|---|---|---|---|---|---|---|---|---|
| Total | 4247 | 47 | 1.09 | 79.28 ± 23.68 | 80.60 ± 23.79 | 84.17 ± 27.03 | 39.45 ± 21.47 | 42.26 ± 22.08 | 47.80 ± 25.81 | 36.40 ± 10.96 | 39.53 ± 11.82 | 41.81 ± 12.82 |
| Hangzhou | 181 | 0 | 0.00 | 75.75 ± 48.18 | 77.61 ± 33.77 | 80.92 ± 36.52 | 32.91 ± 8.45 | 37.47 ± 13.15 | 42.87 ± 16.02 | 38.42 ± 11.87 | 40.33 ± 11.89 | 42.55 ± 11.53 |
| Nanchang | 230 | 0 | 0.00 | 70.50 ± 12.01 | 67.61 ± 12.62 | 69.92 ± 14.35 | 35.33 ± 11.71 | 33.47 ± 13.93 | 37.18 ± 14.05 | 32.08 ± 11.04 | 33.19 ± 10.30 | 32.9 ± 11.95 |
| Guangzhou | 479 | 1 | 0.21 | 73.75 ± 17.44 | 71.47 ± 13.45 | 71.12 ± 12.59 | 27.75 ± 8.96 | 30.67 ± 10.30 | 33.17 ± 9.99 | 42.5 ± 10.88 | 45.08 ± 9.73 | 46.1 ± 10.70 |
| Hefei | 173 | 1 | 0.57 | 78.67 ± 11.91 | 82.58 ± 17.71 | 85.6 ± 20.21 | 38.83 ± 13.16 | 45.03 ± 18.96 | 51.2 ± 21.41 | 39.17 ± 11.34 | 41.72 ± 11.93 | 42.55 ± 12.25 |
| Shenzhen | 445 | 3 | 0.67 | 57.42 ± 18.38 | 53.58 ± 13.76 | 53.63 ± 13.23 | 23.25 ± 8.80 | 24.39 ± 8.87 | 25.55 ± 8.66 | 24.67 ± 6.46 | 26.22 ± 5.30 | 28.65 ± 5.94 |
| Changsha | 240 | 2 | 0.83 | 78.83 ± 15.89 | 79.22 ± 19.38 | 80.6 ± 19.24 | 42.75 ± 16.16 | 45.81 ± 21.20 | 49.27 ± 20.54 | 30.58 ± 10.43 | 32.67 ± 10.72 | 24.63 ± 10.71 |
| Chongqing | 573 | 6 | 1.04 | 67.83 ± 14.19 | 71.69 ± 14.44 | 74.02 ± 14.80 | 35.33 ± 13.23 | 37.86 ± 15.53 | 43.32 ± 16.58 | 36.83 ± 6.90 | 40.03 ± 7.17 | 42.28 ± 7.38 |
| Shanghai | 581 | 7 | 1.19 | 70 ± 9.52 | 74.19 ± 13.36 | 77.4 ± 13.90 | 32.42 ± 9.97 | 34.86 ± 10.56 | 39.37 ± 13.01 | 37.92 ± 10.41 | 40.11 ± 11.41 | 41.67 ± 11.71 |
| Tianjin | 182 | 3 | 1.62 | 97.67 ± 21.46 | 97.36 ± 17.82 | 99.8 ± 22.29 | 49.67 ± 18.87 | 51.53 ± 16.29 | 58.77 ± 22.34 | 40.00 ± 12.37 | 42.69 ± 11.97 | 44.33 ± 14.23 |
| Beijing | 536 | 9 | 1.65 | 84.42 ± 17.93 | 88.53 ± 18.71 | 99.05 ± 25.98 | 40.33 ± 11.15 | 45.56 ± 12.12 | 57.25 ± 25.16 | 33.00 ± 8.79 | 37.64 ± 9.31 | 42.03 ± 12.59 |
| Chengdu | 163 | 3 | 1.81 | 74.5 ± 15.81 | 81.06 ± 18.93 | 88.35 ± 23.05 | 40.92 ± 17.74 | 44.64 ± 19.24 | 51.27 ± 23.75 | 38.30 ± 7.27 | 43.61 ± 9.33 | 47.53 ± 10.24 |
| Harbin | 195 | 4 | 2.01 | 77.33 ± 45.18 | 78.42 ± 33.77 | 82.17 ± 36.52 | 48.25 ± 43.99 | 47.14 ± 34.93 | 51.87 ± 36.87 | 32.08 ± 11.07 | 36.69 ± 8.65 | 39.32 ± 12.31 |
| Xi'an | 117 | 3 | 2.50 | 99.25 ± 29.32 | 103.64 ± 32.23 | 107.75 ± 37.50 | 54.25 ± 34.19 | 57.31 ± 34.95 | 63.07 ± 39.32 | 43.75 ± 10.72 | 49.72 ± 13.23 | 50.83 ± 13.53 |
| Zhengzhou | 152 | 5 | 3.18 | 104 ± 21.83 | 101.39 ± 25.86 | 108.12 ± 30.13 | 52 ± 28.62 | 55.89 ± 28.12 | 65.07 ± 33.26 | 40.25 ± 9.87 | 45.69 ± 11.40 | 49.93 ± 12.75 |
Note: “(1 year)” is the abbreviation of “Average in the past year”; “(3 years)” is the abbreviation of “Average in the past 3 years”; “(5 years)” is the abbreviation of “Average in the past 5 years.”
Figure 2.
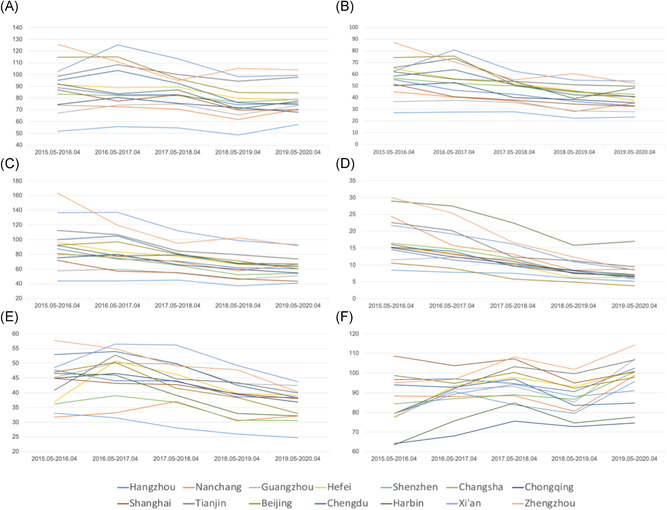
The changes of air quality indicators in these 14 cities over the past 5 years. (A) AQI; (B) PM2.5; (C) PM10; (D) SO2; (E) NO2; (F) O3. AQI, air quality index
3.1. Correlation test between CFR and long‐term air quality indicators
As shown in Figure 3 and Table 2, there was a moderate positive correlation between the CFR and AQI (1, 3, and 5 years), PM2.5 (1, 3, and 5 years), and PM10 (1, 3, and 5 years). The CFR of COVID‐19 patients increased where the levels of long‐term AQI, PM2.5, and PM10 were higher. However, the correlation between the CFR and the levels of SO2, NO2, and O3 were not statistically significant.
Figure 3.
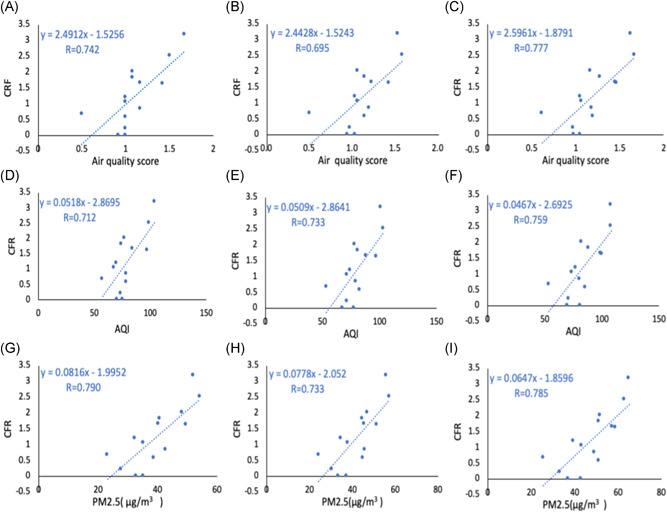
Scatterplots showing the relationships between CFR and air quality indicators. (A–C) Air quality score in the past 1, 3, and 5 years, respectively. (D–F) AQI in the past 1, 3, and 5 years, respectively. (G–I) PM2.5 in the past 1, 3, and 5 years, respectively. AQI, air quality index; CFR, case fatality rate
Table 2.
Correlation test results of various air pollution indicators and case fatality rate
| Variables | Correlation coefficient | p Value |
|---|---|---|
| AQI (1 year) | R = .712 | .004 a |
| AQI (3 years) | R = .733 | .003 a |
| AQI (5 years) | R = .759 | .002 a |
| PM2.5 (1 year, μg/m3) | R = .790 | .001 a |
| PM2.5 (3 years, μg/m3) | R = .733 | .001 a |
| PM2.5 (5 years, μg/m3) | R = .785 | .001 a |
| PM10 (1 years, μg/m3) | R = .686 | .007 a |
| PM10 (3 years, μg/m3) | R = .744 | .002 a |
| PM10 (5 years, μg/m3) | R = .686 | .007 a |
| SO2 (1 year, μg/m3) | rs =0.328 | .252 |
| SO2 (3 years, μg/m3) | R = .469 | .091 |
| SO2 (5 years, μg/m3) | R = .559 | .038 a |
| NO2 (1 year, μg/m3) | R = .280 | .332 |
| NO2 (3 years, μg/m3) | R = .471 | .089 |
| NO2 (5 years, μg/m3) | R = .523 | .055 |
| O3 (1 year, μg/m3) | R = −.074 | .800 |
| O3 (3 years, μg/m3) | R = .200 | .493 |
| O3 (5 years, μg/m3) | R = .129 | .659 |
Abbreviation: AQI, air quality index.
Indicates that this data is statistically significant; “(1 year)” is the abbreviation of “Average in the past year”; “(3 years)” is the abbreviation of “Average in the past 3 years”; “(5 years)” is the abbreviation of “Average in the past 5 years”; R is the result of Pearson correlation test; rs is the result of Spearman correlation test.
3.2. Comparison of air quality between high CFR group and low CFR group
As of April 28th, 2020, 13,962 cases were recovered in China (excluding Hubei Province), with a total of 121 deaths. This resulted in a national CFR (excluding Hubei Province) of 0.86%. Based on this number, our cohort was divided into a low CFR group (CFR ≤0.86%; n = 6) and a high CFR group (CFR >0.86%; n = 8). The list and geographical distribution of each group is shown in Figure 1.
As compared with the low CFR group, the AQI (3 and 5 years) and PM2.5 (1, 3, and 5 years) were significantly higher in the high CFR group (p < .05) (Table 3). However, there was no significant difference in the PM10, SO2, NO2, and O3 between these two groups (p > .05).
Table 3.
Independent sample t test results of various air pollution indicators between high CFR Group and low CFR group
| Variables | Low CFR group | High CFR group | t Value | p Value |
|---|---|---|---|---|
| AQI (1 year) | 72.49 ± 8.021 | 84.28 ± 14.196 | 1.832 | .092 |
| AQI (3 years) | 72.01 ± 10.530 | 87.04 ± 12.541 | 2.368 | .036* |
| AQI (5 years) | 73.63 ± 11.533 | 92.08 ± 13.442 | 2.694 | .020* |
| PM2.5 (1 year, μg/m3) | 33.47 ± 7.152 | 44.15 ± 8.030 | 2.575 | .024* |
| PM2.5 (3 years, μg/m3) | 36.14 ± 8.360 | 46.85 ± 7.966 | 2.438 | .031* |
| PM2.5 (5 years, μg/m3) | 39.87 ± 9.828 | 53.75 ± 9.085 | 2.733 | .018* |
| PM10 (1 year, μg/m3) | 56.15 ± 9.383 | 68.39 ± 17.208 | 1.565 | .144 |
| PM10 (3 years, μg/m3) | 57.81 ± 10.492 | 74.64 ± 17.454 | 2.084 | .059 |
| PM10 (5 years, μg/m3) | 66.04 ± 16.174 | 85.34 ± 20.209 | 1.855 | .088 |
| SO2 (1 year, μg/m3) | 6.68 ± 1.220 | 8.42 ± 3.842 | 1.059 | .311 |
| SO2 (3 years, μg/m3) | 8.23 ± 1.315 | 10.44 ± 4.034 | 1.280 | .225 |
| SO2 (5 years, μg/m3) | 10.46 ± 2.320 | 13.78 ± 5.013 | 1.497 | .160 |
| NO2 (1 year, μg/m3) | 34.57 ± 2.702 | 34.77 ± 1.358 | −1.143 | .275 |
| NO2 (3 years, μg/m3) | 36.54 ± 2.868 | 42.02 ± 1.529 | −1.811 | .095 |
| NO2 (5 years, μg/m3) | 36.23 ± 3.561 | 44.74 ± 1.489 | −2.205 | .065 |
| O3 (1 year, μg/m3) | 100.92 ± 3.820 | 93.41 ± 14.008 | −1.446 | .185 |
| O3 (3 years, μg/m3) | 92.66 ± 4.259 | 92.72 ± 11.835 | 0.015 | .988 |
| O3 (5 years, μg/m3) | 90.65 ± 3.574 | 90.54 ± 12.019 | −0.024 | .982 |
Abbreviations: AQI, air quality index; CFR, case fatality rate.
Indicates that this data is statistically significant; “(1 year)” is the abbreviation of “Average in the past year”; “(3 years)” is the abbreviation of “Average in the past 3 years”; “(5 years)” is the abbreviation of “Average in the past 5 years”.
3.3. Predictive values of various indicators for CFR
ROC curve was used to calculate the predictive value of air pollutants to CFR, and it showed the area under the curve of AQI (1, 3, and 5 years) and PM2.5 (1, 3, and 5 years) were 0.688, 0.81, 0.854, and 0.823, 0.833, 0.896, respectively. The cut‐off values of AQI (5 years) and PM2.5 (1, 3, and 5 years) were 86.98, 39.58, 37.67, and 51.57 µg/m3, respectively (Table 4 and Figure 4).
Table 4.
ROC curve analysis of case fatality rate
| Variables | Cut‐off value | AUC | p Value |
|---|---|---|---|
| AQI (1 year) | NA | 0.688 | .245 |
| AQI (3 years) | NA | 0.813 | .053 |
| AQI (5 years) | 86.98 | 0.854 | .028 a |
| PM2.5 (1 year, μg/m3) | 39.58 | 0.823 | .045 a |
| PM2.5 (3 years, μg/m3) | 37.67 | 0.833 | .039 a |
| PM2.5 (5 years, μg/m3) | 51.57 | 0.896 | .014 a |
Abbreviations: AQI, air quality index; ROC, receiver operating characteristic curve.
Indicates that this data is statistically significant; “(1 year)” is the abbreviation of “Average in the past year”; “(3 years)” is the abbreviation of “Average in the past 3 years”; “(5 years)” is the abbreviation of “Average in the past 5 years.”
Figure 4.
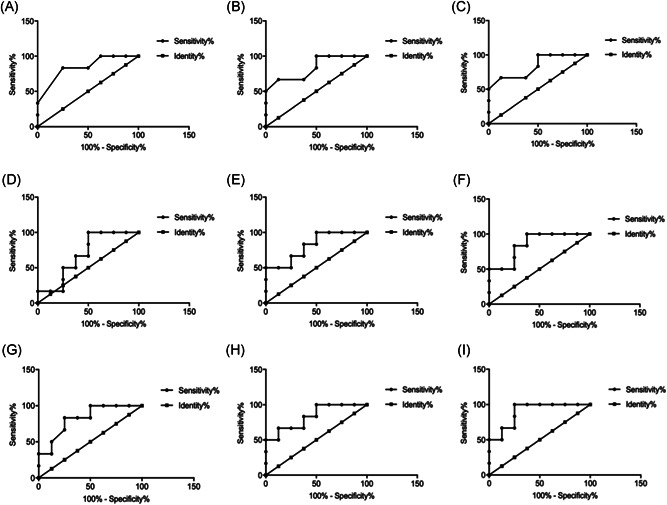
ROC curves showing the ability of air quality indicators to predict the CFR. (A–C) Air quality score in the past 1, 3, and 5 years, respectively. (D–F) AQI in the past 1, 3, and 5 years, respectively. (G–I) PM2.5 in the past 1, 3, and 5 years, respectively. AQI, air quality index; CFR, case fatality rate
4. DISCUSSION
In this multicity study, we have estimated the association between long‐term exposures to common air pollutants and COVID‐19 CFR, and have calculated the predictive values for the CFR of COVID‐19 patients in these cities. The results show that the levels of AQI, PM2.5, and PM10, but not NO2 and O3, are significantly positively correlated with the CFR. Meanwhile, the levels of AQI and PM2.5 were significantly higher in the high CFR group than those in the low CFR group. Furthermore, ROC curve analysis indicates the most predictive value for CFR is long‐term PM2.5. These findings may explain the differences in COVID‐19 outcomes between regions. Public health authorities should focus more on these vulnerable populations, who are exposed to severe long‐term air pollution.
Previous studies have shown that living environments play an important role in the transmission and outcomes of major viral diseases, namely severe acute respiratory syndrome 16 and H1N1 influenza. 17 The role of the atmospheric environment in COVID‐19 cases is not yet fully understood. 18 Frontera et al 19 have reported that the outbreak of COVID‐19 may be associated with climate and air pollutants. Other researchers have also found that air pollutants are substantially associated with an increased risk of COVID‐19. 11 , 13 , 20 , 21 , 22 Another study has investigated COVID‐19 infection in 120 cities in China, indicating that it is closely related to the short‐term exposure to PM2.5, PM10, CO, NO2, and O3. 11 However, the relationship of COVID‐19 outcomes with long‐term air pollutants is in the early stages of the investigation. The results from this study suggested the significant positive associations between the long‐term PM2.5 levels and COVID‐19 CFR. Previous studies highlight PM2.5 affecting the airways and the cardiovascular system by penetrating deep into the lung tissue and causing an immune‐mediated inflammatory response. 23 , 24 , 25 Long‐time exposure to the PM2.5 has been correlated with increased risks of chronic diseases, including COPD that can progress into lung cancer. 26 , 27 In addition, short‐term exposure to PM2.5 significantly increases the mortality from various cardiopulmonary diseases, as indicated by a nationwide analysis of 272 Chinese cities. 28 Given the close relationship between COVID‐19 and the respiratory system, PM2.5 may affect the CFR of COVID‐19 patients by eliciting the local immune or inflammatory response.
Despite the lack of observed associations between NO2 levels with severe outcomes of COVID‐19, probably due to the limited numbers of cases in our research, this pollutant may impact COVID‐19 outcomes. Dr. Ogen's research team 29 found that long‐term exposure to NO2 may be an important cause of death in COVID‐19 patients in both Italy and Spain. Liang and Shi 14 conducted a cross‐sectional nationwide study to estimate the association between the long‐term county‐levels of exposure to NO2, PM2.5, and O3 and the county‐levels of COVID‐19 case‐fatality and mortality rates in the United States; they found that long‐term exposure to NO2 may enhance the susceptibility to severe COVID‐19 outcomes.
In the 14 cities researched in this study, the levels of the most air pollutants, such as NO2, PM2.5, and PM10, gradually decreased over the past five years (Figure 3), which may be attributed to the increased awareness of environmental protection in China. However, considering that the impact of air pollutants on human health is mainly mediated by the stimulation of immune and inflammatory responses, it is expected that long‐term exposure to air pollutants may cause cumulative adverse effects. Therefore, only investigating the effects of short‐term air pollution may not adequately capture the full impact of environmental pollution on COVID‐19 prognosis.
This study has several limitations. First, specific patient comorbidities, ethnic characteristics, and social factors, such as population density and access to care, all of which may affect the CFR were not analyzed as this was a population‐level study. Second, although our study provided a reference for studying the relationship between long‐term air pollution and CFR, it was limited to China and further research with an expanded geographic scope is needed. Finally, as this was a retrospective cohort study with relatively small sample size, there is a risk for sampling error.
5. CONCLUSION
Long‐term exposure to an environment with severe air pollution is associated with increased CFR of COVID‐19 patients. Air quality indicators such as PM2.5 may have the potential to predict the CFR of COVID‐19 patients.
CONFLICT OF INTERESTS
The anthors declare that there are no conflict of interests.
AUTHOR CONTRIBUTIONS
Conception and design: Hao Wang and Xin‐yu Yang; Data analysis and interpretation: Chang‐kai Hou and Quan‐lei Liu; Collection and assembly of data: Chang‐kai Hou and Ya‐fei Qin; Manuscript writing: Chang‐kai Hou; Manuscript revision and polishing: Grace Wang; Final approval of manuscript: All authors.
PEER REVIEW
The peer review history for this article is available at http://publons.com/publon/10.1002/jmv.26807.
Supporting information
Supporting information.
ACKNOWLEDGMENTS
The authors would like to show their respect for all the hospital staff for their hard work and efforts to combat the COVID‐2019. This work was supported by grants to Hao Wang from the National Natural Science Foundation of China (No.: 82071802), Tianjin Application Basis and Cutting‐Edge Technology Research Grant (No.: 14JCZDJC35700), Li Jieshou Intestinal Barrier Research Special Fund (No.: LJS_201412), Natural Science Foundation of Tianjin (No.: 18JCZDJC35800), and supported by grants to Xin‐yu Yang from Natural Science Foundation of Tianjin (No.: 20JCZDJC00300), and Tianjin Medical University Clinical Research Program (No.: 2018kylc008).
Hou C, Qin Y, Wang G, Liu Q, Yang X, Wang H. Impact of a long‐term air pollution exposure on the case fatality rate of COVID‐19 patients—A multicity study. J Med Virol. 2021;93:2938–2946. 10.1002/jmv.26807
Contributor Information
Xin‐yu Yang, Email: yangxinyu@tmu.edu.cn.
Hao Wang, Email: hwangca272@hotmail.com.
DATA AVAILABILITY STATEMENT
Data available on request from the authors.
REFERENCES
- 1. Huang C, Wang Y, Li X, et al. Clinical features of patients infected with 2019 novel coronavirus in Wuhan, China. Lancet (London, England). 2020;395(10223):497‐506. 10.1016/s0140-6736(20)30183-5 [DOI] [PMC free article] [PubMed] [Google Scholar]
- 2. Li Q, Guan X, Wu P, et al. Early transmission dynamics in Wuhan, China, of novel coronavirus‐infected pneumonia. N Engl J Med. 2020;382(13):1199‐1207. 10.1056/NEJMoa2001316 [DOI] [PMC free article] [PubMed] [Google Scholar]
- 3. Cucinotta D, Vanelli M. WHO declares COVID‐19 a pandemic. Acta Biomed. 2020;91(1):157‐160. 10.23750/abm.v91i1.9397 [DOI] [PMC free article] [PubMed] [Google Scholar]
- 4. Li L, Huang T, Wang Y, et al. COVID‐19 patients' clinical characteristics, discharge rate, and fatality rate of meta‐analysis. J Med Virol. 2020;92:577‐583. 10.1002/jmv.25757 [DOI] [PMC free article] [PubMed] [Google Scholar]
- 5. Zhou F, Yu T, Du R, et al. Clinical course and risk factors for mortality of adult inpatients with COVID‐19 in Wuhan, China: a retrospective cohort study. Lancet (London, England). 2020;395(10229):1054‐1062. 10.1016/s0140-6736(20)30566-3 [DOI] [PMC free article] [PubMed] [Google Scholar]
- 6. Lippi G, Wong J, Henry BM. Hypertension and its severity or mortality in coronavirus disease 2019 (COVID‐19): a pooled analysis. Pol Arch Med Wewn. 2020;130(4):304‐309. 10.20452/pamw.15272 [DOI] [PubMed] [Google Scholar]
- 7. Onder G, Rezza G, Brusaferro S. Case‐fatality rate and characteristics of patients dying in relation to COVID‐19 in Italy. JAMA. 2020;323(18):1775‐1776. 10.1001/jama.2020.4683 [DOI] [PubMed] [Google Scholar]
- 8. Guan W, Ni Z, Hu Y, et al. Clinical characteristics of coronavirus disease 2019 in China. N Engl J Med. 2020;382(18):1708‐1720. 10.1056/NEJMoa2002032 [DOI] [PMC free article] [PubMed] [Google Scholar]
- 9. Pun VC, Kazemiparkouhi F, Manjourides J, Suh HH. Long‐term PM2.5 exposure and respiratory, cancer, and cardiovascular mortality in older US adults. Am J Epidemiol. 2017;186(8):961‐969. 10.1093/aje/kwx166 [DOI] [PMC free article] [PubMed] [Google Scholar]
- 10. Tian Y, Wu Y, Liu H, et al. The impact of ambient ozone pollution on pneumonia: a nationwide time‐series analysis. Environ Int. 2020;136:105498. 10.1016/j.envint.2020.105498 [DOI] [PubMed] [Google Scholar]
- 11. Zhu Y, Xie J, Huang F, Cao L. Association between short‐term exposure to air pollution and COVID‐19 infection: evidence from China. Sci Total Environ. 2020;727:138704. 10.1016/j.scitotenv.2020.138704 [DOI] [PMC free article] [PubMed] [Google Scholar]
- 12. Adhikari A, Yin J. Short‐term effects of ambient ozone, PM(2.5,) and meteorological factors on COVID‐19 confirmed cases and deaths in Queens, New York. Int J Environ Res Public Health. 2020;17(11):4047. 10.3390/ijerph17114047 [DOI] [PMC free article] [PubMed] [Google Scholar]
- 13. Zhang Z, Xue T, Jin X. Effects of meteorological conditions and air pollution on COVID‐19 transmission: evidence from 219 Chinese cities. Sci Total Environ. 2020;741:140244. 10.1016/j.scitotenv.2020.140244 [DOI] [PMC free article] [PubMed] [Google Scholar]
- 14. Liang D, Shi L, Zhao J, et al. Urban air pollution may enhance COVID‐19 case‐fatality and mortality rates in the United States. medRxiv: the preprint server for health sciences. 2020;1(3):100047. 10.1101/2020.05.04.20090746 [DOI] [PMC free article] [PubMed] [Google Scholar]
- 15. Wu X, Nethery RC, Sabath BM, Braun D, Dominici F. Exposure to air pollution and COVID‐19 mortality in the United States: a nationwide cross‐sectional study. medRxiv. 2020. 10.1101/2020.04.05.20054502 [DOI] [PMC free article] [PubMed] [Google Scholar]
- 16. Cui Y, Zhang ZF, Froines J, et al. Air pollution and case fatality of SARS in the People's Republic of China: an ecologic study. Environ Health. 2003;2(1):15. 10.1186/1476-069X-2-15 [DOI] [PMC free article] [PubMed] [Google Scholar]
- 17. Morales KF, Paget J, Spreeuwenberg P. Possible explanations for why some countries were harder hit by the pandemic influenza virus in 2009—a global mortality impact modeling study. BMC Infect Dis. 2017;17(1):642. 10.1186/s12879-017-2730-0 [DOI] [PMC free article] [PubMed] [Google Scholar]
- 18. Martelletti L, Martelletti P. Air pollution and the novel covid‐19 disease: a putative disease risk factor. SN Compr Clin Med. 2020;2:1‐5. 10.1007/s42399-020-00274-4 [DOI] [PMC free article] [PubMed] [Google Scholar]
- 19. Frontera A, Martin C, Vlachos K, Sgubin G. Regional air pollution persistence links to COVID‐19 infection zoning. J Infect. 2020;81:318‐356. 10.1016/j.jinf.2020.03.045 [DOI] [PMC free article] [PubMed] [Google Scholar]
- 20. Comunian S, Dongo D, Milani C, Palestini P. Air pollution and covid‐19: the role of particulate matter in the spread and increase of covid‐19's morbidity and mortality. Int J Environ Res Public Health. 2020;17(12):4487. 10.3390/ijerph17124487 [DOI] [PMC free article] [PubMed] [Google Scholar]
- 21. Li H, Xu XL, Dai DW, Huang ZY, Ma Z, Guan YJ. Air pollution and temperature are associated with increased COVID‐19 incidence: a time series study. Int J Infect Dis. 2020;97:278‐282. 10.1016/j.ijid.2020.05.076 [DOI] [PMC free article] [PubMed] [Google Scholar]
- 22. Fattorini D, Regoli F. Role of the chronic air pollution levels in the Covid‐19 outbreak risk in Italy. Environmental pollution (Barking, Essex: 1987). 2020;264:114732. 10.1016/j.envpol.2020.114732 [DOI] [PMC free article] [PubMed] [Google Scholar]
- 23. Zhao J, Gao Z, Tian Z, et al. The biological effects of individual‐level PM(2.5) exposure on systemic immunity and inflammatory response in traffic policemen. Occup Environ Med. 2013;70(6):426‐431. 10.1136/oemed-2012-100864 [DOI] [PubMed] [Google Scholar]
- 24. Calderón‐Garcidueñas L, Vojdani A, Blaurock‐Busch E, et al. Air pollution and children: neural and tight junction antibodies and combustion metals, the role of barrier breakdown and brain immunity in neurodegeneration. J Alzheimers Dis. 2015;43(3):1039‐1058. 10.3233/JAD-141365 [DOI] [PubMed] [Google Scholar]
- 25. Ciencewicki J, Jaspers I. Air pollution and respiratory viral infection. Inhal Toxicol. 2007;19(14):1135‐1146. 10.1080/08958370701665434 [DOI] [PubMed] [Google Scholar]
- 26. Landrigan PJ, Fuller R, Acosta NJR, et al. The Lancet Commission on pollution and health. Lancet (London, England). 2018;391(10119):462‐512. 10.1016/S0140-6736(17)32345-0 [DOI] [PubMed] [Google Scholar]
- 27. Hayes RB, Lim C, Zhang Y, et al. PM2.5 air pollution and cause‐specific cardiovascular disease mortality. Int J Epidemiol. 2020;49(1):25‐35. 10.1093/ije/dyz114 [DOI] [PMC free article] [PubMed] [Google Scholar]
- 28. Chen R, Yin P, Meng X, et al. Fine particulate air pollution and daily mortality. A Nationwide Analysis in 272 Chinese Cities. Am J Respir Crit Care Med. 2017;196(1):73‐81. 10.1164/rccm.201609-1862OC [DOI] [PubMed] [Google Scholar]
- 29. Ogen Y. Assessing nitrogen dioxide (NO2) levels as a contributing factor to coronavirus (COVID‐19) fatality. Sci Total Environ. 2020;726:138605. 10.1016/j.scitotenv.2020.138605 [DOI] [PMC free article] [PubMed] [Google Scholar]
Associated Data
This section collects any data citations, data availability statements, or supplementary materials included in this article.
Supplementary Materials
Supporting information.
Data Availability Statement
Data available on request from the authors.