

Abstract
We analyzed antibody response patterns according to the level of disease severity in patients with novel coronavirus disease 2019 (COVID‐19) in Japan. We analyzed 611 serum specimens from 231 patients with COVID‐19 (mild, 170; severe, 31; critical, 30). Immunoglobulin M (IgM) and IgG antibodies against nucleocapsid protein (N) and spike 1 protein (S1) were detected by enzyme‐linked immunosorbent assays. The peaks of fitting curves for the optical density (OD) values of IgM and IgG antibodies against N appeared simultaneously, while those against S1 were delayed compared with N. The OD values of IgM against N and IgG against both N and S1 were significantly higher in the severe and critical cases than in the mild cases at 11 days after symptom onset. The seroconversion rates of IgG were higher than those of IgM against both N and S1 during the clinical course based on the optimal cut‐off values defined in this study. The seroconversion rates of IgG and IgM against N and S1 were higher in the severe and critical cases than in the mild cases. Our findings show that a stronger antibody response occurred in COVID‐19 patients with greater disease severity and there were low seroconversion rates of antibodies against N and S1 in the mild cases.
Keywords: antibody, COVID‐19, ELISA, Japan, SARS‐CoV‐2
1. INTRODUCTION
Novel coronavirus disease 2019 (COVID‐19), which is caused by severe acute respiratory syndrome coronavirus 2 (SARS‐CoV‐2) infection, was initially reported in December 2019 in Wuhan, China, 1 and it has since become an ongoing pandemic worldwide. 2
Patients with COVID‐19 are predominantly asymptomatic or have mild symptoms, but approximately 20% of patients develop severe disease. 3 The worldwide scientific community is still searching for the mechanism of disease pathogenesis to identify an effective treatment. Recently, several reports have suggested that the antibody response against SARS‐CoV‐2 may be associated with disease severity. 4 , 5 , 6 , 7 , 8 , 9 , 10 Identifying the antibody response patterns of target populations and the differences in these patterns between patients according to disease severity will help to clarify the pathogenicity and humoral immunity for SARS‐CoV‐2. The main antigens of SARS‐CoV‐2 are the internal nucleocapsid protein (N) and external spike protein (S), which consists of two subunits (S1 and S2). In particular, S1 contains a receptor‐binding domain (RBD) that is responsible for binding to the angiotensin‐converting enzyme 2 receptor on host cells at the initiation of infection 11 ; thus, antibodies targeting S1 and RBD are expected to inhibit angiotensin‐converting enzyme 2/RBD binding and have neutralization activity. 8 , 12 , 13 , 14 , 15
Differences in antibody response patterns against each antigen between patients with different levels of disease severity have been reported based on limited samples collected from specific countries 9 , 12 ; however, it is unclear whether these response patterns can be similarly applied to different populations. Here, we describe the differences of the antibody response patterns for N and S1 and isotypes among 611 serum specimens collected from 231 Japanese patients with COVID‐19 with different levels of disease severity.
2. METHODS
2.1. Patients with COVID‐19 and serum specimens
A total of 611 serum specimens were analyzed from 231 patients with laboratory‐confirmed COVID‐19 who were referred to and hospitalized at Saitama Medical University Hospital and Self‐Defense Forces Central Hospital in Japan from February 11 to May 23, 2020. Briefly, the patients' age ranged from 18 to 93 years (median, 49 years; interquartile range [IQR], 38–66 years), and 138 patients (59.7%) were male and 93 (40.3%) were female. According to their presentation during hospitalization, the symptomatic cases were subdivided into three groups at the end of hospitalization. For the purposes of statistical analysis, the classification of disease severity was modified from the Guidelines on the Diagnosis and Treatment of the Novel Coronavirus issued by the Japanese Ministry of Health, Labour and Welfare, and four disease severities were integrated into three categories. Severe symptomatic cases were defined as patients showing clinical symptoms of pneumonia (percutaneous oxygen saturation <93% and need for oxygen therapy). Critical cases were defined as showing a need for oxygen therapy using a high‐flow nasal cannula and noninvasive positive pressure ventilation in a high or intensive care unit or invasive mechanical ventilation. The remaining symptomatic cases were classified as mild cases. Among the 231 patients, 170 (74.0%), 31 (13.4%), and 30 (13.0%) were classified as having mild, severe, and critical COVID‐19 at the end of the hospitalization period, respectively. The age distribution according to disease severity is shown in Figure S1. Briefly, the median age was 43 years (IQR, 36–56.5) for the mild cases, 63 years (IQR, 50–73) for the severe cases, and 60 years (IQR, 55–71) for the critical cases. All patients were examined for SARS‐CoV‐2 by quantitative reverse‐transcription polymerase chain reaction (RT‐qPCR) using pharyngeal and nasopharyngeal swabs collected at public health institutes and hospitals in accordance with the nationally recommended method in Japan. 16 In brief, the gene encoding the N protein of SARS‐CoV‐2 was amplified by RT‐qPCR using the following sets of primers and probes—N‐1 set: N_Sarbeco_F1, N_Sarbeco_R1, and N_Sarbeco_P1; N‐2 set: NIID_2019‐nCOV_N_F2, NIID_2019‐nCOV_N_R2, and NIID_2019‐nCOV_N_P2. 16 Serum samples were collected into serum‐separating tubes on admission and during hospitalization. Briefly, the median number of collected serum specimens for all 231 patients was 2 (IQR, 1–3) samples, with 2 (IQR, 1–2) samples for the 170 mild cases, 3 (IQR, 2–4) samples for the 31 severe cases, and 3 samples (IQR, 2–6) for the 30 critical cases. All serum samples were stored at −80°C before use in enzyme‐linked immunosorbent assays (ELISAs).
2.2. Negative samples from patients without COVID‐19
To determine the optimal cut‐off value for each ELISA, we used 150 serum samples collected from 150 patients at Saitama Medical University Hospital, Japan, from April to October 2019, before SARS‐CoV‐2 was first reported in China. All serum samples were stored at −80°C before use in ELISAs.
2.3. Detection of antibodies against SARS‐CoV‐2 by ELISAs
To measure antibody titers against N and S1, a QuaResearch COVID‐19 Human IgM IgG ELISA Kit (Nucleocapsid Protein) (RCOEL961N; Cellspect Co. Ltd.) and QuaResearch COVID‐19 Human IgM IgG ELISA Kit (Spike Protein‐S1) (RCOEL961S1; Cellspect Co. Ltd.) were used, respectively. These kits are based on the indirect ELISA method, and each kit comes with different immobilized antigenic proteins. The plate of the COVID‐19 Human IgM IgG ELISA Kit (Nucleocapsid Protein) contains immobilized recombinant N protein (1–419 AA) of SARS‐CoV‐2 expressed in Escherichia coli. The plate of the COVID‐19 Human IgM IgG ELISA Kit (Spike Protein‐S1) contains immobilized recombinant S1 protein (S1, 251–660 AA) of SARS‐CoV‐2 expressed in E. coli. Serum samples were diluted 1:1000 in 1% bovine serum albumin/phosphate‐buffered saline with Tween‐20 (PBST) for ELISAs with N and S1 proteins. After incubation at room temperature for 1 h, specific antibodies were detected with horseradish peroxidase‐conjugated anti‐human IgM or IgG at room temperature for 1 h. The enzymatic reaction was developed with TMB (3,3′,5,5′‐tetramethylbenzidine) substrate at room temperature for 10 min. The reaction was stopped using 1 M HCl, and the plates were read at 450 nm with an automated ELISA system (QRC5LB925; Cellspect Co. Ltd.) in accordance with the manufacturer's measurement protocol.
2.4. Definitions
The timing of seroconversion was defined as when the serum specimen showed an optical density (OD) value for each ELISA above the determined cut‐off OD value. The day of symptom onset was defined as Day 1.
2.5. Ethics statement
This study was reviewed and approved by the Institutional Review Board of Saitama Medical University (approval number: 1917), Institutional Review Board of Saitama Medical University Hospital (approval numbers: 20064.01 and 20001), and Institutional Review Board of the Self‐Defense Forces Central Hospital (approval number: 01‐011).
2.6. Statistical analysis
All serum samples were evaluated by ELISA in triplicate and the average OD value for these measurements was defined as the test result. Continuous variables were expressed as the mean and SD or median and IQR, and compared using the t test or Wilcoxon rank‐sum test for parametric or nonparametric data, respectively. The optimum cut‐off OD value for each ELISA was set to ensure >98.0% specificity by using the minimum OD value obtained from 150 negative samples from patients without COVID‐19. All statistical analyses were conducted using R (v 4.0.2; R Foundation for Statistical Computing; http://www.R-project.org/).
3. RESULTS
3.1. Kinetics of the antibody response according to disease severity
The kinetics of the antibody response against each antigen according to disease severity are shown in Figure 1. For IgM‐N, low peaks of the fitting curves were observed in the severe and critical cases, but not in the mild cases (Figure 1A). The peaks were observed approximately 15 days after symptom onset in the severe and critical cases (Figure 1A). The fitting curves for IgM‐S1 stayed at a low level in all three groups (Figure 1B). The peaks of the fitting curves for IgG‐N were observed approximately 18 days after symptom onset in the severe and critical cases and 25 days in the mild cases. The peaks were higher in the severe and critical cases than in the mild cases. The peaks of the fitting curves for IgG‐S1 were delayed compared with those for IgG‐N (Figure 1C,D); the peaks were observed approximately 28 days after symptom onset in the mild and critical cases and 40 days in the severe cases. The peak values were higher in the order of critical, severe, and mild cases (Figure 1D).
Figure 1.
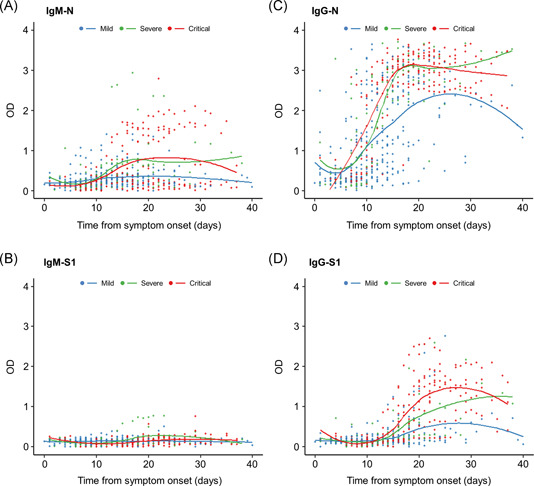
Kinetics of the IgM and IgG antibody responses according to disease severity. (A) IgM‐N, (B) IgM‐S1, (C) IgG‐N, and (D) IgG‐S1. Plots show time to sample collection from symptom onset and OD values for ELISAs. Blue plots and line, mild cases; green plots and line, severe cases; and red plots and line, critical cases. ELISA, enzyme‐linked immunosorbent assay; Ig, immunoglobulin; N, nucleocapsid protein; OD, optical density; S1, spike 1 protein
Within 10 days after symptom onset, the OD values for IgM‐N were lower in the critical cases than in the mild cases, and then the OD values increased rapidly in the critical cases (critical vs. mild; p = .017) (Figure 2A). There were significant differences in the OD values for IgM‐N between the severe and mild cases and between the critical and mild cases at 11–21 days after onset (severe vs. mild, p < .001; critical vs. mild, p = .020) (Figure 2A). The OD values for IgM‐S1 were higher in the mild cases than in the severe and critical cases within 10 days after onset (critical vs. mild; p = .007) (Figure 2B). At 11–21 days after onset, the OD values for IgM‐S1 were still significantly higher in the mild cases than in the critical cases (critical vs. mild; p = .007) (Figure 2B), and this difference disappeared at 22 days after onset (critical vs. mild; p = .065) (Figure 2B). There were significant differences in the OD values for IgG‐N (severe vs. mild, p < .001; critical vs. mild, p < .001; critical vs. severe, p = .012) and IgG‐S1 (severe vs. mild, p = .004; critical vs. mild, p < .001; critical vs. severe, p = .002) among the three groups at 11–21 days after onset, and the difference between the severe and critical cases disappeared at 22 days after onset (critical vs. severe, p = .069) (Figure 2C,D).
Figure 2.
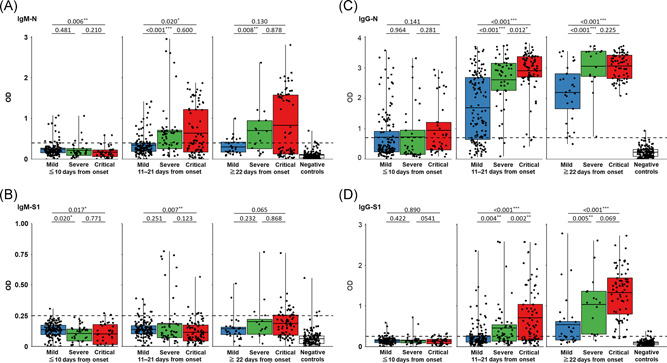
Comparison between disease severity and the antibody response for each ELISA. (A) IgM‐N, (B) IgM‐S1, (C) IgG‐N, and (D) IgG‐S1 in serum specimens collected at different time points from symptom onset. Blue box, mild cases; green box, severe cases; red box, critical cases; and white box, negative controls. Black plots indicate the OD value of each serum specimen. Black horizontal lines indicate the optimal cut‐off values for each ELISA based on the results of 150 negative controls. The correlation coefficient was calculated using Wilcoxon's rank‐sum test. ELISA, enzyme‐linked immunosorbent assay; Ig, immunoglobulin; N, nucleocapsid protein; OD, optical density; S1, spike 1 protein. *p < .05, **p < .01, and ***p < .001
3.2. Two antibody response patterns in the severe and critical cases
A strong IgM‐N response pattern (OD > 1.5) was observed in only the severe and critical cases during the clinical course (Figures 1A and 2A). A strong IgM‐N pattern (OD > 1.5) was observed in 6.5% (2/31) of the severe cases and in 35.0% (7/30) of the critical cases. The two types of longitudinal antibody response among samples from individual patients in the severe and critical cases are shown in Figure 3: a strong IgM‐N pattern (Figure 3A–C) and a weak IgM‐N pattern (Figure 3D–F). In the strong IgM response pattern, IgM‐N and IgG‐N increased simultaneously. In both response patterns, the OD values of IgG‐N increased earlier than those of IgG‐S1 during the clinical course.
Figure 3.
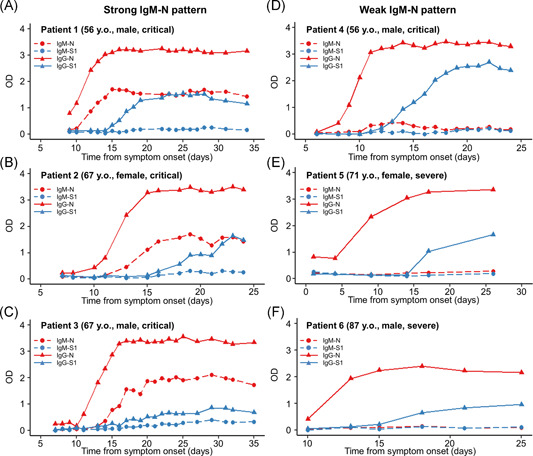
Antibody response patterns in severe and critical cases in six representative patients. The representative cases selected were serially collected samples from early symptom onset to convalescence in each group. Strong IgM‐N patterns (A–C) and weak IgM‐N patterns (D–F). Red, N protein; blue, S1 protein; dashed line and circle plots, IgM antibody assay; and solid line and triangle plots, IgG antibody. Ig, immunoglobulin; N, nucleocapsid protein; OD, optical density; S1, spike 1 protein
3.3. Seroconversion rate of antibodies in patients with COVID‐19 in Japan
The seroconversion rates of each ELISA at the optimal cut‐off value in the clinical course of these patients with COVID‐19 are shown in Figure 4. Based on the results for 150 negative samples from patients without COVID‐19, the optimal OD cut‐off values were determined as 0.4 and 0.25 for IgM‐N and IgM‐S1, respectively, and 0.7 and 0.26 for IgG‐N and IgG‐S1, respectively (Figure 2A–D). Among all patients, the seroconversion rate at 22 days after onset was 44.0% for IgM‐N, 98.0% for IgG‐N, 28.0% for IgM‐S, and 72.0% for IgG‐S (Figure 4A,E), and the seroconversion rate of IgG was significantly higher than that of IgM against both N and S1 within 10 days (IgM‐N vs. IgG‐N, p < .001; IgM‐S vs. IgG‐S, p = .010), at 11–21 days (IgM‐N vs. IgG‐N, p < .001; IgM‐S vs. IgG‐S, p < .001), and at 22 days after onset (IgM‐N vs. IgG‐N, p < .001; IgM‐S vs. IgG‐S, p < .001) (Figure 4A,E). In each disease severity group, the seroconversion rate of IgG was also higher than that of IgM against both N and S1 during the clinical course (Figures 4B–D and 4F–H). At 22 days after onset, the seroconversion rate was significantly higher in the severe and critical cases than in the mild cases for IgM‐S1 (severe, 44.4% and critical, 44.4% vs. mild, 8.7%; p < .05) and IgG‐S1 (severe, 88.9% and critical, 94.4% vs. mild, 47.8%; p < .05) (Figure 4F–H), while there was no significant difference in the seroconversion rate for IgM‐N (severe, 61.1% and critical, 44.4% vs. mild, 30.4%; p > .05) and IgG‐N (severe, 100% and critical, 100% vs. mild, 95.7%; p > .05) (Figure 4B–D).
Figure 4.
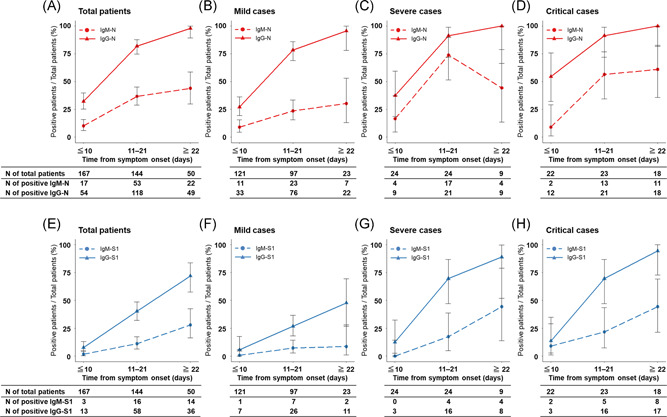
Seroconversion rate of ELISAs in patients with COVID‐19 according to disease severity during the clinical course. Antibodies against N protein (A–D) and S1 protein (E–H). Red, N protein; blue, S1 protein; dashed line, IgM antibody assay; and solid line, IgG antibody. COVID‐19, novel coronavirus disease 2019; ELISA, enzyme‐linked immunosorbent assay; Ig, immunoglobulin; N, nucleocapsid protein; S, spike 1 protein
4. DISCUSSION
Here, we presented analytical results for antibody response patterns according to disease severity in patients with COVID‐19 in Japan. The sensitivity, specificity, and cut‐off value of ELISA can vary depending on the test conditions and target population. In addition, the product details for the ELISAs used in this study, including the cut‐off value, sensitivity, and specificity, are unavailable. Therefore, we determined the cut‐off values ourselves by using 150 serum samples from non‐COVID‐19 patients to detect seroconversion in our target population. We showed several important features of the antibody response patterns in these patients. First, IgM‐N and IgG‐N increased at the same time, and the peak OD values for IgM‐N and IgG‐N appeared simultaneously. In addition, we showed that the seroconversion rate of IgG antibodies was higher than that of IgM antibodies, even in the early phase after symptom onset (<10 days). In viral infections such as dengue virus that can cause reinfection, IgM becomes detectable earlier than IgG after the first viral infection. In the second infection, IgG is detectable earlier than or around the same time as IgM, and the titer of IgG increases rapidly after infection, while the titer of IgM becomes lower than during the first viral infection. 17 Sun et al. 4 and Wang et al. 10 reported the same antibody response patterns as described here in Chinese patients with COVID‐19, and suggested they were a second infection pattern and affected by potential cross‐reactivity of the humoral response between SARS‐CoV‐2 and other human coronaviruses (HCoVs) such as HCoV‐229E, HCoV‐OC43, HCoV‐NL63, and HCoV‐HKU1. Unfortunately, seroprevalence data for seasonal HCoVs in the Japanese population are not available. The identification of the seroprevalence rate of other HCoVs in Japan and a comparison of the past‐infection patterns of other HCoVs in COVID‐19 patients would help to clarify their effect on the antibody response pattern against SARS‐CoV‐2.
Second, stronger IgM‐N, IgG‐N, and IgG‐S1 responses were observed in the severe and critical cases than in the mild cases of COVID‐19. Two theories have been suggested regarding the presence 4 , 7 , 10 or absence 18 of differences in antibody production levels according to disease severity. Our findings support the hypothesis that stronger antibody production occurs in severe cases. In a study showing that there was no association between antibody production and disease severity, a chemiluminescent microparticle immunoassay, which is a qualitative method, was used for antibody detection. 18 Differences in the methods used to detect antibodies may have caused discrepancies in antibody levels according to disease severity. Several viral infections, such as the dengue virus, Ebola virus, and SARS‐CoV, can cause antibody‐dependent enhancement (ADE), which is the phenomenon by which antibodies paradoxically provide a means of enhancing virus entry and replication. A high viral load can amplify the secretion of cytokines by virus‐infected cells and T cells and cause a cytokine storm, which consequently leads to increased viral pathogenicity and disease severity. 7 , 19 , 20 As in other viral infections, researchers have assumed that ADE may be one of the factors responsible for disease exacerbation in COVID‐19. 7 , 21 Interestingly, a strong IgM‐N response was observed in only the severe and critical cases. In patients infected with the Ebola virus, IgM antibodies against viral antigens are mainly associated with ADE, and ADE may facilitate the rapid spread of the virus in the host during the early phase of infection. 20 Further studies are warranted to determine whether the excess production of antibodies is only induced by severe disease or if it is partly responsible for disease exacerbation in patients with COVID‐19.
Third, a low seroconversion rate and weak response for IgG‐S1 were observed in the mild cases. In our study, seroconversion of IgG‐S1 antibody was observed in 47.8% of the mild cases, while it was detected in approximately 90% of the severe and critical cases. Several reports have also shown correlations between IgG‐S1, RBD, and neutralizing antibody levels with disease severity, and relatively low antibody levels are observed in mild cases. 22 , 23 It is assumed that SARS‐CoV‐2 infection is well controlled by the innate immune response and cellular immunity in mild cases. Additionally, Long et al. 24 and Ibarrondo et al. 25 showed the time course of a decrease in neutralizing antibodies at 2–3 months after initial infection in mild and asymptomatic cases. Taken together, patients who are asymptomatic and mild cases may have low levels of antibodies and a short period of humoral immunity. On the contrary, the levels of IgG‐S1, RBD, and neutralizing antibodies necessary to protect against reinfection have not been well evaluated. Moreover, even if there are no measurable levels of specific antibodies in the serum, memory B cells and T cells, which protect against reinfection, could be produced by SARS‐CoV‐2 infection and maintained for a long period of time. 26 What levels of specific antibodies are needed and whether memory B cells and T cells protect against reinfection should be examined in further epidemiological studies.
This study has some limitations. First, we used only commercial ELISAs to detect the antibodies; thus, it is possible that the antibody response patterns are assay‐specific. There is a possibility that the absence of seroconversion in several patients was caused by the test conditions and antigens used in the ELISAs in this study. Second, cross‐reactivity between SARS‐CoV‐2 and seasonal HCoVs in COVID‐19 was suspected, but it was not examined in this study. Third, the day of symptom onset was determined according to self‐reported symptoms. Given that the symptoms of COVID‐19 are nonspecific, this may have produced the variability in the OD values at the same time points from symptom onset among the patients. Further large‐scale investigations are required to verify the antibody response patterns by using several different serological methods.
5. CONCLUSION
The findings of this study showed a stronger antibody response in Japanese patients with more severe COVID‐19 and a low seroconversion rate of IgG‐S1 in mild cases after infection.
CONFLICT OF INTERESTS
The authors declare that there are no conflict of interests.
AUTHOR CONTRIBUTIONS
Study conception and design: Takuya Maeda and Kazuo Imai. Clinical data collection and data analysis: Kazuo Imai, Sakiko Tabata, Mayu Nagura‐Ikeda, and Kazuyasu Miyoshi. Experiment and data analysis: Yutaro Kitagawa, Katsumi Kubota, and Masaru Matsuoka. Manuscript drafting and editing: Kazuo Imai, Takuya Maeda, and Kaku Tamura. Manuscript revision: Jun Sakai, Noriomi Ishibashi, Norihito Tarumoto, Toshimitsu Ito, Katsumi Kubota, and Toshimitsu Ito. Study supervision: Shinichi Takeuchi and Shigefumi Maesaki. All authors have read and approved the final manuscript.
PEER REVIEW
The peer review history for this article is available at https://publons.com/publon/10.1002/jmv.26899
Supporting information
Supplementary information.
Supplementary information.
ACKNOWLEDGMENTS
We thank the clinical laboratory technicians at the Self‐Defense Forces Central Hospital for sample collection, and all members of the COVID‐19 Task Force at the Self‐Defense Forces Central Hospital and participating members drawn from other institutes of the Japan Self‐Defense Force.
Imai K, Kitagawa Y, Tabata S, et al. Antibody response patterns in COVID‐19 patients with different levels of disease severity in Japan. J Med Virol. 2021;93:3211–3218. 10.1002/jmv.26899
DATA AVAILABILITY STATEMENT
The data that support the findings of this study are available from the corresponding author upon reasonable request.
REFERENCES
- 1. Huang C, Wang Y, Li X, et al. Clinical features of patients infected with 2019 novel coronavirus in Wuhan, China. The Lancet. 2020;395:497‐506. [DOI] [PMC free article] [PubMed] [Google Scholar]
- 2. World Health Organization . https://www.who.int/emergencies/diseases/novel-coronavirus-2019
- 3. Wu Z, McGoogan JM. Characteristics of and important lessons from the coronavirus disease 2019 (COVID‐19) outbreak in China: summary of a report of 72 314 cases from the Chinese Center for Disease Control and Prevention. JAMA. 2020;323:1239‐1242. [DOI] [PubMed] [Google Scholar]
- 4. Sun B, Feng Y, Mo X, et al. Kinetics of SARS‐CoV‐2 specific IgM and IgG responses in COVID‐19 patients. Emerg Microbes Infect. 2020;9:940‐948. [DOI] [PMC free article] [PubMed] [Google Scholar]
- 5. Kissler SM, Tedijanto C, Goldstein E, Grad YH, Lipsitch M. Projecting the transmission dynamics of SARS‐CoV‐2 through the postpandemic period. Science. 2020;368:860‐868. [DOI] [PMC free article] [PubMed] [Google Scholar]
- 6. Shen L, Wang C, Zhao J, et al. Delayed specific IgM antibody responses observed among COVID‐19 patients with severe progression. Emerg Microbes Infect. 2020;9:1096‐1101. [DOI] [PMC free article] [PubMed] [Google Scholar]
- 7. Huang AT, Garcia‐Carreras B, Hitchings MDT, et al. A systematic review of antibody mediated immunity to coronaviruses: antibody kinetics, correlates of protection, and association of antibody responses with severity of disease. medRxiv. 2020. 10.1101/2020.04.14.20065771:2020.04.14.20065771 [DOI] [PMC free article] [PubMed] [Google Scholar]
- 8. Ju B, Zhang Q, Ge J, et al. Human neutralizing antibodies elicited by SARS‐CoV‐2 infection. Nature. 2020;584:115‐119. 10.1038/s41586-020-2380-z [DOI] [PubMed] [Google Scholar]
- 9. Brochot E, Demey B, Touze A, et al. Anti‐Spike, anti‐Nucleocapsid and neutralizing antibodies in SARS‐CoV‐2 inpatients and asymptomatic carriers. medRxiv. 2020. 10.1101/2020.05.12.20098236:2020.05.12.20098236 [DOI] [PMC free article] [PubMed] [Google Scholar]
- 10. Wang Y, Zhang L, Sang L, et al. Kinetics of viral load and antibody response in relation to COVID‐19 severity. J Clin Invest. 2020;130:5235‐5244. 10.1172/jci138759 [DOI] [PMC free article] [PubMed] [Google Scholar]
- 11. Walls AC, Park YJ, Tortorici MA, Wall A, McGuire AT, Veesler D. Structure, function, and antigenicity of the SARS‐CoV‐2 Spike glycoprotein. Cell. 2020;181:281‐292 [DOI] [PMC free article] [PubMed] [Google Scholar]
- 12. Okba NMA, Müller MA, Li W, et al. Severe acute respiratory syndrome coronavirus 2‐specific antibody responses in coronavirus disease 2019 patients. Emerg Infect Dis. 2020;26:1478‐1488. [DOI] [PMC free article] [PubMed] [Google Scholar]
- 13. Premkumar L, Segovia‐Chumbez B, Jadi R, et al. The receptor binding domain of the viral spike protein is an immunodominant and highly specific target of antibodies in SARS‐CoV‐2 patients. Sci Immunol. 2020;11:eabc8413. [DOI] [PMC free article] [PubMed] [Google Scholar]
- 14. Amanat F, Stadlbauer D, Strohmeier S, et al. A serological assay to detect SARS‐CoV‐2 seroconversion in humans. Nature Med. 2020;26:1033‐1036. 10.1038/s41591-020-0913-5 [DOI] [PMC free article] [PubMed] [Google Scholar]
- 15. Chen X, Li R, Pan Z, et al. Human monoclonal antibodies block the binding of SARS‐CoV‐2 spike protein to angiotensin converting enzyme 2 receptor. Cell Mol Immunol. 2020;17:647‐649. [DOI] [PMC free article] [PubMed] [Google Scholar]
- 16. Shirato K, Nao N, Katano H, et al. Development of genetic diagnostic methods for novel coronavirus 2019 (nCoV‐2019) in Japan. Jpn J Infect Dis. 2020;73:304‐307. 10.7883/yoken.JJID.2020.061 [DOI] [PubMed] [Google Scholar]
- 17. Peeling RW, Artsob H, Pelegrino JL, et al. Evaluation of diagnostic tests: dengue. Nat Rev Microbiol. 2010;8:S30‐S38. [DOI] [PubMed] [Google Scholar]
- 18. Phipps WS, SoRelle JA, Li Q‐Z, et al. SARS‐CoV‐2 antibody responses do not predict COVID‐19 disease severity. Am J Clin Pathol. 2020;154:459‐465. [DOI] [PMC free article] [PubMed] [Google Scholar]
- 19. Katzelnick LC, Gresh L, Halloran ME, et al. Antibody‐dependent enhancement of severe dengue disease in humans. Science. 2017;358:929‐932. [DOI] [PMC free article] [PubMed] [Google Scholar]
- 20. Takada A, Ebihara H, Feldmann H, Geisbert TW, Kawaoka Y. Epitopes required for antibody‐dependent enhancement of Ebola virus infection. J Infect Dis. 2007;196(suppl 2):S347‐S356. [DOI] [PubMed] [Google Scholar]
- 21. French MA, Moodley Y. The role of SARS‐CoV‐2 antibodies in COVID‐19: healing in most, harm at times. Respirology. 2020;25:680‐682. [DOI] [PMC free article] [PubMed] [Google Scholar]
- 22. Liu L, To KK‐W, Chan K‐H, et al. High neutralizing antibody titer in intensive care unit patients with COVID‐19. Emerg Microbes Infect. 2020;9:1664‐1670. [DOI] [PMC free article] [PubMed] [Google Scholar]
- 23. Wu F, Wang A, Liu M, et al. Neutralizing antibody responses to SARS‐CoV‐2 in a COVID‐19 recovered patient cohort and their implications. medRxiv. 2020. 10.1101/2020.03.30.20047365:2020.03.30.20047365 [DOI] [Google Scholar]
- 24. Long Q‐X, Tang X‐J, Shi Q‐L, et al. Clinical and immunological assessment of asymptomatic SARS‐CoV‐2 infections. Nature Med. 2020;26:1200‐1204. 10.1038/s41591-020-0965-6 [DOI] [PubMed] [Google Scholar]
- 25. Ibarrondo FJ, Fulcher JA, Goodman‐Meza D, et al. Rapid decay of anti–SARS‐CoV‐2 antibodies in persons with mild Covid‐19. N Engl J Med. 2020;10:1085‐1087. 10.1056/NEJMc2025179 [DOI] [PMC free article] [PubMed] [Google Scholar]
- 26. Cox RJ, Brokstad KA. Not just antibodies: B cells and T cells mediate immunity to COVID‐19. Nat Rev Immunol. 2020;20:581‐582. [DOI] [PMC free article] [PubMed] [Google Scholar]
Associated Data
This section collects any data citations, data availability statements, or supplementary materials included in this article.
Supplementary Materials
Supplementary information.
Supplementary information.
Data Availability Statement
The data that support the findings of this study are available from the corresponding author upon reasonable request.