

Abstract
Arterial stiffness is an effective predictor of atherosclerosis. Measurement of pulse-wave velocity (PWV) is a gold-standard approach to study arterial stiffness. This study aims to examine arterial stiffness and heart functions via echocardiography at an early stage of atherosclerosis. A model of atherosclerosis in ApoE-knockout (ApoE-/-) mice fed on high-fat diet (HFD) was used, with normal chow diet (ND) as a control. Stiffness of aortic arch and carotid arteries and left ventricular (LV) systolic/diastolic functions were measured by echocardiography. The plasma cholesterol levels and atherosclerotic plaque areas in the aortas were measured. The PWV values of aortic arch and carotid arteries were compared at 2, 4, 6 and 8 weeks with different diets. Compared with ND mice, PWV values in aortic arch and carotid arteries were significantly increased in HFD mice after 8 weeks (Aortic arch: 516.65 ± 216.89 cm/s vs. 192.53 ± 71.71 cm/s; Carotid arteries: 514.26 ± 211.01 cm/s vs. 188.03 ± 75.14 cm/s, respectively; both P < 0.01) accompanied by the decrease in LV systolic/diastolic functions. These were well correlated with the increase in plasma cholesterol levels. Echo-based PWV measurement in the aortic arch was found more sensitive to predict atherosclerosis than in the carotid arteries in ApoE-/- mice. Measuring aortic arch PWV via echocardiography could represent a new diagnostic strategy for early detection of atherosclerosis.
Keywords: Arterial stiffness, atherosclerosis, pulse wave velocity, echocardiography
Introduction
Atherosclerosis is a chronic inflammatory disorder that is the leading cause of cardiovascular disease (CVD) resulting in a high rate of mortality in the population [1-3]. The main pathological progression in atherosclerosis is characterized by lipid deposition in some arterial fragments which gradually develop into an atherosclerotic plaque, leading to partial or total occlusion of the affected arteries, and ultimately causing vascular death [4]. Although a growing number of statin drugs have been administered in clinical practice, CVD remains to be a leading cause of mortality worldwide [5,6], suggesting that early diagnosis of atherosclerosis is critically important.
Arterial stiffness, one of the earliest detectable manifestations of pathological structural and functional changes within the vessel wall, has been shown to be an emerging risk factor of CVD and was significantly correlated with atherosclerosis [7,8]. Measurement of pulse-wave velocity (PWV) is a gold-standard method to evaluate arterial stiffness, which was well validated in large populations as a strong predictor of adverse cardiovascular outcomes [9,10]. Previous studies suggested that increase of aortic stiffness, assessed by PWV, was shown to be associated with increased incidence of cardiovascular events [11,12]. Although it has been shown that vascular stiffening caused by early atherosclerosis is in-homogeneously distributed over the length of a large vessel [13], the global PWV measurement between the carotid and femoral arteries has been still widely used in clinical practice [14-17]. Therefore, a comparison of PWV from the different parts of arteries is required urgently to determine which parts are more sensitive to predict the early atherosclerosis and ultimately to improve the long-term prognosis in patients of CVD.
A model using apolipoprotein E-deficient (ApoE-/-) mice with high-fat diet (HFD) is commonly used to study atherosclerosis, since the atherosclerotic lesions they developed are similar to those observed in humans [18-20]. Recently, more and more approaches including oscillometric technique or flow/area method based on MRI have been used to measure PWV in experimental atherosclerosis [21,22]. Although PWV in each part of arteries is able to be measured using different techniques, few studies focus on the early detection of arterial stiffness before the left ventricular (LV) dysfunctions occurred.
A previous study reported an intriguing observation using high-resolution ultrasound to measure PWV of the aortic arch in a mouse model of the Marfan syndrome [23]. They demonstrated that echo-based measurement of PWV in the aortic arch has the potential for in vivo longitudinal monitoring of the aorta in mice. Here we examined whether this method could be used for early detection of atherosclerosis by measuring PWV of aortic arch and carotid arteries in mice. Meantime, LV systolic/diastolic functions, plasma cholesterol levels, atherosclerotic lesions areas and elastic fiber fragmentation in the aortic arch were measured as well [24,25]. The aim of the present study is to demonstrate whether echo-based PWV measurement could be a novel diagnostic strategy for early detection of atherosclerosis.
Materials and methods
A mouse model of atherosclerosis
Male ApoE-/- mice (8-week old) were fed on either normal chow diet (ND) or HFD (n = 15 per group) for 8 weeks. The atherosclerosis phenotypes were examined by Oil red O staining and plasma cholesterol levels. All the animal experimental procedures were approved by the Ethics and Animal Care Committee of the University of Illinois at Chicago.
Echocardiography
The mice were anesthetized using inhaled isoflurane via a facemask and then subjected to transthoracic echocardiography using a Vevo 2100 (VisualSonics Inc., Toronto, ON, Canada) equipped with a MS550 transducer (22-55 MHz).
The ascending and descending aortic peak velocities were obtained from the pulse wave (PW) Doppler-mode aortic arch view. On the same image plane, the aortic arch PWV was measured, as shown below: 1) the time (T1) was measured from the onset of the QRS complex to the onset of the ascending aortic Doppler waveform in the ascending aorta (aortic annulus); 2) the time (T2) was measured from the onset of the QRS complex to the onset of the descending aortic Doppler waveform as distal as possible in the descending aorta (Figure 1C); 3) the aortic arch distance (D1) was measured between the 2 sample volume positions along the central axis of the aortic arch (Figure 1A); 4) the values of T1 and T2 were averaged over 10 cardiac cycles; 5) aortic arch PWV was determined as PWV = D1/[T2 - T1 (cm/s)]. The similar method was used to measure carotid arterial stiffness: 1) the time T3 and T4 were measured in proximal internal carotid artery or distal internal carotid artery (Figure 2A), respectively; 2) the distance (D2) in the carotid artery between the 2 sample volume positions was measured as well (Figure 2B); 3) carotid arterial PWV was calculated as PWV = D2/[T4 - T3 (cm/s)].
Figure 1.

Measurement of aortic arch PWV, peak velocity and aortic root dimension in mice. Representative B-mode view of aortic arch distance (A) and aortic root dimension (B) from the different groups are shown (scale bar = 1 mm). (C) Pulse wave Doppler tracing of the ascending (lower panel) and descending aorta (upper panel). T1 was measured from the onset of the QRS complex to the onset of the ascending aortic Doppler waveform and T2 was measured from the onset of the QRS complex to the onset of the descending aortic Doppler waveform. D1 was measured between the 2 sample volume positions along the central axis of the aortic arch. Aortic arch PWV was determined as PWV = D1/[T2 - T1 (cm/s)]. (D) Aortic arch PWV was significantly increased in the high-fat diet (HFD) group compared with the normal chow diet (ND) group. Ascending aortic peak velocity (E) and descending aortic peak velocity (F) of ApoE-/- mice from two diet groups are shown. Diameters of the (G) aortic annulus [L1], (H) sinus of Valsalva [L2] and (I) sinotubular junction [L3] were significantly increased in HFD group versus ND group. n = 15 per group. *P < 0.05, **P < 0.01.
Figure 2.
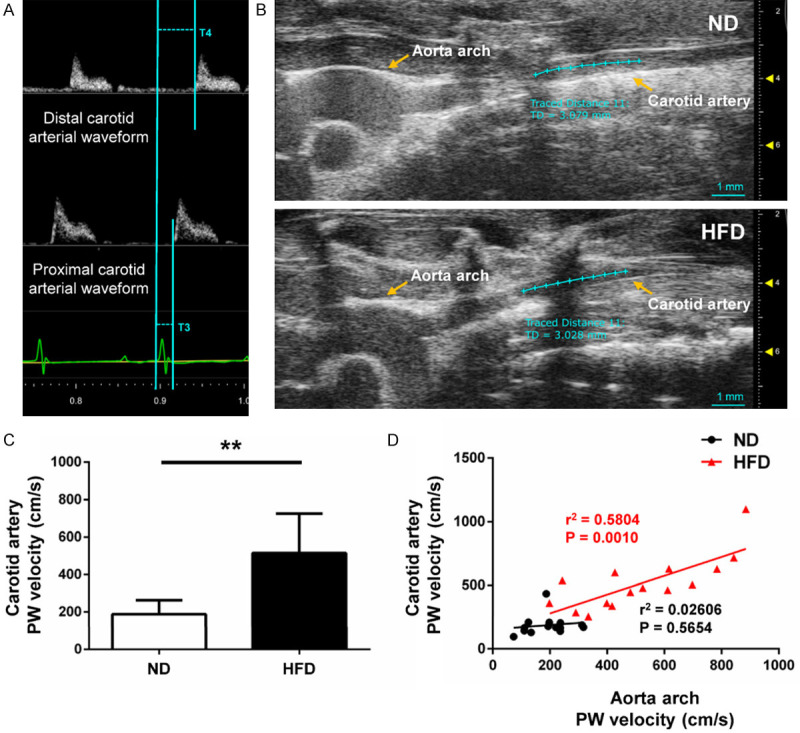
Measurement of carotid artery PWV. A. Pulse wave Doppler tracing of the carotid artery. T3 was measured from the onset of the QRS complex to the onset of the proximal internal carotid arterial Doppler waveform and T4 was measured from the onset of the QRS complex to the onset of the distal internal carotid arterial Doppler waveform. D2 was measured between the 2 sample volume positions along the central axis of the carotid artery. The carotid artery PWV was calculated as PWV = D2/[T4 - T3 (cm/s)]. B. B-mode view of carotid arteries from the different groups. C. Carotid arterial PWV was significantly increased in HFD group versus ND group. D. Correlations between carotid artery PWV and aortic arch PWV of HFD and ND mice, respectively. Carotid artery PWV in HFD mice was directly proportional to aortic arch PWV (R-squared = 0.5804, P = 0.0010), but not in ND mice (R-squared = 0.02606, P = 0.5654). n = 15 per group. *P < 0.05, **P < 0.01.
LV diastolic functions were examined from apical 4-chamber views. Mitral flow velocity including both peak early (E) and atrial (A) velocities, and isovolumic relaxation time (IVRT) were acquired in Doppler-mode echocardiograms (Figure 3A). Mitral annulus early diastolic (e) and atrial (a) velocities were measured in Tissue Doppler-mode echocardiograms (Figure 3B). The ratio of E/A, e/a and E/e were calculated, respectively. All the parameters described above were averaged over 3 cardiac cycles.
Figure 3.

Left ventricular diastolic function of ND and HFD mice. Representative images of mitral inflow velocity (A) and mitral annulus velocity (B) are shown. (C) MV E velocity, (D) MV A velocity, (E) E/A ratio, (F) TD e, (G) TD a, (H) e/a ratio, (I) E/e ratio, and (J) IVRT were measured from ND and HFD mice, respectively. MV, mitral valve; TD, tissue Doppler; IVRT, isovolumic relaxation time. n = 10 per group. *P < 0.05, **P < 0.01.
LV systolic functions were acquired in M-mode echocardiograms from the LV parasternal short-axis view, which was recorded at the level of two papillary muscles (Figure 4A). LV ejection fraction (EF), cardiac output (CO), stroke volume (SV), and fractional shortening (FS) normalized by body weight were calculated, respectively.
Figure 4.
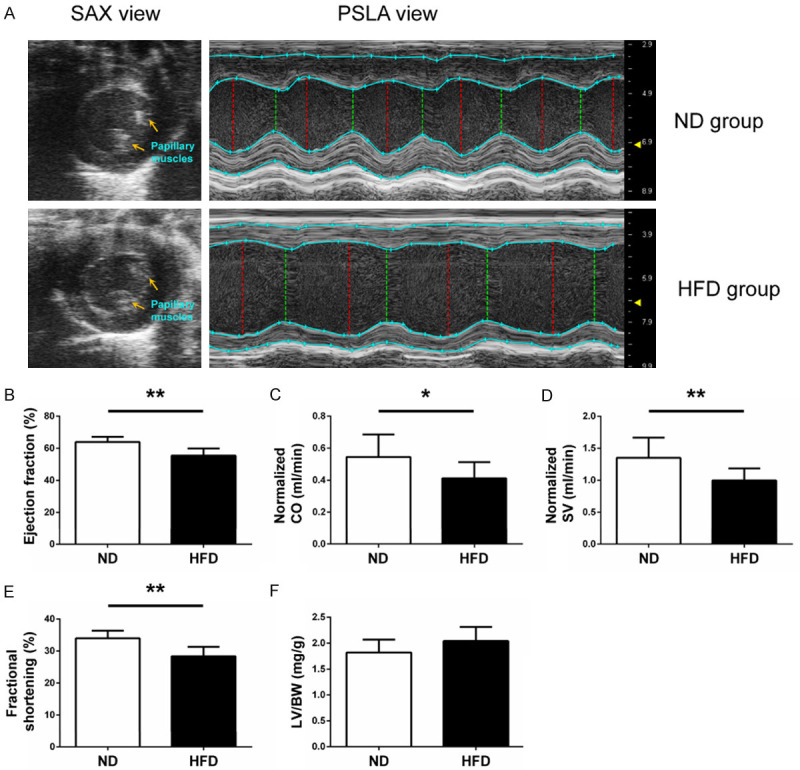
Left ventricular systolic function of ND and HFD mice. (A) Representative images for measuring left ventricular systolic function at the left ventricular parasternal short-axis view from the different groups are shown. (B) Ejection fraction, (C) normalized CO, (D) normalized SV and (E) fractional shortening were measured from ND and HFD mice, respectively. (F) The ratio of left ventricular weight to body weight was examined. CO, cardiac output; SV, stroke volume; LV, left ventricular; BW, body weight. n = 10 per group. *P < 0.05, **P < 0.01.
To investigate the sensitivity of echo-based PWV in the atherogenesis of mice, PWV in aortic arch and carotid arteries, E/A ratio, e/a ratio, EF and CO were measured every 2 weeks continuously starting from 8 weeks of age in ApoE-/- mice for 8 weeks (Figure 6A, n = 5 per group). All the measurements and calculations were performed as above.
Figure 6.
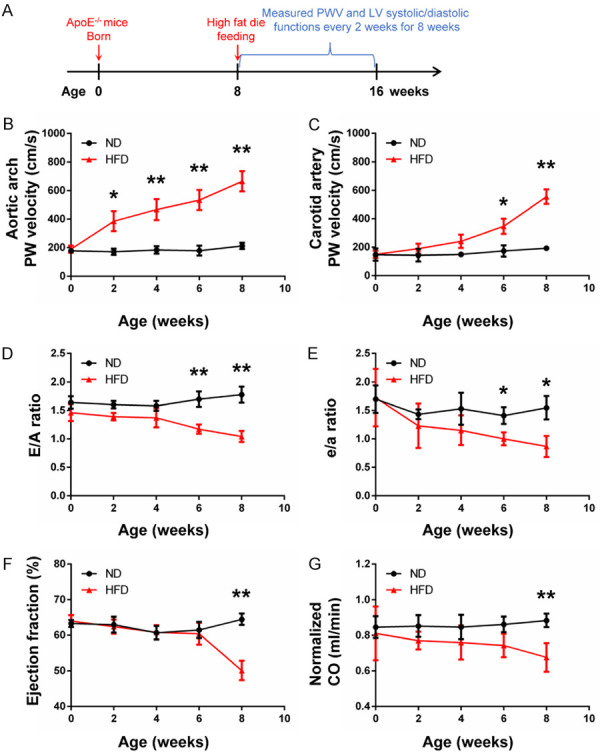
Early detection of PWV and LV systolic/diastolic functions by echocardiography. (A) The flow chat shows the high fat diet feeding starting at 8 weeks of age in mice. (B and C) Aortic arch PWV was significantly increased in HFD mice versus ND mice at week 2 and continued to increase in HFD mice during the 8 weeks, while carotid artery PWV was increased at week 6. E/A ratio (D) and e/a ratio (E) were significantly decreased in HFD mice versus ND mice at week 6, indicating the left ventricular diastolic dysfunction occurred after being fed on high-fat diet for 6 weeks. EF (F) and CO (G) were significantly decreased in HFD mice versus ND mice at week 8, suggesting the left ventricular systolic dysfunction occurred after being fed on high-fat diet for 8 weeks. n = 5 per group. *P < 0.05, **P < 0.01.
Histology of mouse aortas and heart tissues
The aortas of mice in both HFD and ND groups were stained with Oil Red O (n = 5 per group) or Elastic-Van Gieson staining (n = 5 per group) after 8 weeks. To investigate whether HFD will establish atherosclerotic plaque in aortas at an early stage, 10 male ApoE-/- mice (8-week old) were sacrificed for Oil red O staining (Sigma-Aldrich, St. Louis, MO, USA) after being fed with ND or HFD for 2 weeks, respectively (n = 5 per group). Aortic arch and descending aortas were dissected and fixed with 10% buffered formalin for 48 hours, subsequently immersed in 70% ethanol overnight at 4°C, then embedded in paraffin, and sectioned into 5-μm slides. Areas stained red were considered atherosclerotic lesions and the extent of atherosclerosis was determined as the ratio of the positive red areas to the whole aorta areas with ImageJ software (National Institutes of Health, Bethesda, USA), expressed as lesion area (%) = circle positive red area/total aorta area ×100%. Elastic and collagen fibers of aortas were stained by use of Verhoeff-Van Gieson Elastic Stain kit (Sigma-Aldrich, St. Louis, MO, USA) according to the manufacturer’s instructions. To quantify elastin fragmentation, we counted the number of observed elastin breaks using ImageJ software in each cross-section of the aorta.
The hearts were also removed, washed in the PBS, and fixed in 10% formalin for 48 hours. A weight ratio of the LV divided by the body weight [(LV/BW) %] was measured to determine the extent of LV hypertrophy (n = 10 per group).
Measurement of plasma cholesterol levels
Blood was taken from the mouse LV and collected in tubes coated with EDTA followed by centrifugation at 5,000 rpm for 10 min (n = 10 per group). The plasma concentrations of total cholesterol, low-density lipoprotein cholesterol (LDL-C) and high-density lipoprotein cholesterol (HDL-C) detection were quantified by a Beckman Coulter AU480 Analyzer (Calif, USA) in accordance with the manufacturer’s instructions.
Statistical analysis
All the experiments were repeated at least three times. Results were represented as the mean ± standard deviation (SD). Statistical analysis was performed using Student’s t-test and two-way ANOVA followed by the SPSS 22.0 (IBM Corporation, Armonk, USA). Simple correlations between the plasma total cholesterol, LDL-C, HDL-C, carotid artery PWV and aortic arch PWV were evaluated with Ordinary least-squares regression test. P < 0.05 was considered statistically significant.
Results
Stiffness of aortic arch and carotid arteries
To investigate the arterial stiffness among the two groups of mice, the PWV of aortic arch and carotid arteries was measured by echocardiography. The mice in the HFD group exhibited a higher PWV of aortic arch (516.65 ± 216.89 cm/s vs. 192.53 ± 71.71 cm/s, P < 0.01; Figure 1D) and descending aortic peak velocity (P < 0.01; Figure 1F) than those in the ND group, while no significant change in the ascending aortic peak velocity (P = 0.7976; Figure 1E) was observed between the ND and HFD groups. The values of Aortic annulus, Sinus of Valsalva and Sinotubular junction were significantly increased in HFD mice versus ND mice (both P < 0.01; Figure 1G-I), which was consistent with the changes observed in PWV of aortic arch.
As shown in Figure 2C, the PWV of carotid arteries was significantly increased in the HFD group compared with the ND group (514.26 ± 211.01 cm/s vs. 188.03 ± 75.14 cm/s, P < 0.01; Figure 2C). The regression test (Figure 2D) showed the positive correlations between the PWV of aortic arch and carotid arteries in HFD mice (R-squared = 0.5804, P = 0.0010), but not in ND mice (R-squared = 0.02606, P = 0.5654). The estimated regression lines are y = 0.7412*x + 131.3 in the HFD group and y = 0.1692*x + 155.5 in the ND group.
LV systolic and diastolic functions
Compared with the mice in ND group, mitral valve E velocity (P < 0.05; Figure 3C) and E/A ratio (P < 0.01; Figure 3E) were significantly decreased in the HFD group, while mitral valve A velocity did not have significant change (P = 0.3289; Figure 3D). According to the tissue doppler test, mitral annulus e (P < 0.05; Figure 3F) and e/a (P < 0.01; Figure 3H) were decreased in HFD group versus ND group. No significant difference in mitral annulus a was detected among the two groups (P = 0.1345; Figure 3G). In addition, the values of E/e and IVRT were significantly increased in the HFD group compared with the ND group (both P < 0.01; Figure 3I and 3J). Our results indicate that LV diastolic functions in ApoE-/- mice were significantly impaired when fed with HFD for 8 weeks, which was consistent with the changes of arterial stiffness as observed by echocardiography.
As shown in Figure 4B and 4E, EF% and FS% were significantly decreased in HFD mice versus ND mice (both P < 0.01). After normalization by body weight, the mice in the HFD group also showed a lower CO (P < 0.05; Figure 4C) and SV (P < 0.01; Figure 4D) compared with the ND group. However, no significant differences were found in the ratios of left ventricular weight to body weight between the HFD and ND groups (P = 0.0701; Figure 4F).
Histologic data of the aortas and heart tissues and the detection of cholesterol levels
As shown in Figure 5A, atherosclerotic plaque was found in the aortic arch from HFD mice, but was not found in ND mice. The lesion areas based on Oil Red O staining in aortas showed no difference between the HFD and ND groups after 2 weeks (7.75 ± 1.98% vs. 7.48 ± 1.77%, P = 0.8246; Figure 5B and 5D), but a significantly increase in the HFD group as compared with the ND group after 8 weeks (19.53 ± 3.69% vs. 11.19 ± 0.98%, P < 0.01; Figure 5B and 5D). The Elastic-Van Gieson staining demonstrated changes of aortic arch in the architecture of the elastic fibers (elastolysis or rupture of the elastic fibers) in the HFD group, compared with the mice in the ND group (number of fragmentations = 4.40 ± 0.55 vs. 1.20 ± 0.45, P < 0.01; Figure 5C and 5E). We also found that the levels of total cholesterol and LDL-C were significantly increased in the HFD group versus ND group (P < 0.01; Figure 5F and 5G), while the HDL-C decreased (P < 0.01; Figure 5H). As shown in Figure 5F-H, aortic arch PWV was directly proportional to total cholesterol in ND (R-squared = 0.6820, P = 0.0032) and HFD mice (R-squared = 0.6546, P = 0.0046), LDL-C in HFD mice (R-squared = 0.6323, P = 0.0059), and HDL-C in ND mice (R-squared = 0.4372, P = 0.0373), but was not proportional to LDL-C in ND mice (R-squared = 0.1548, P = 0.2606) and HDL-C in HFD mice (R-squared = 0.2131, P = 0.1793).
Figure 5.
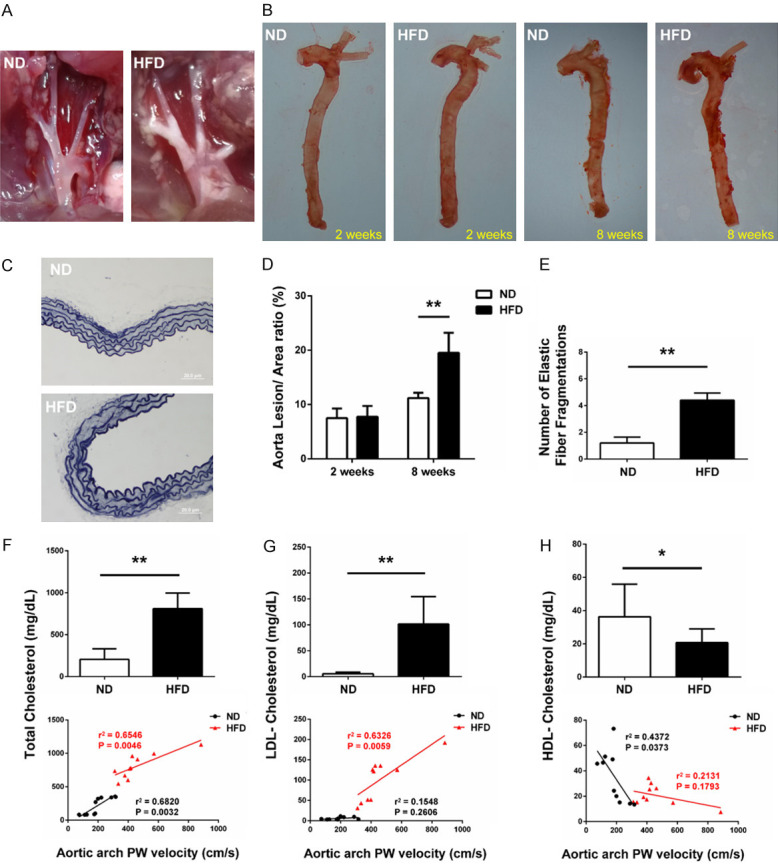
Histological analysis of ND and HFD mice. (A) Representative views of aortic arch from the two groups of mice. Atherosclerotic plaque was found in the aortic arch from HFD mice, while plaque was not found in the aortic arch from ND mice. (B) Atherosclerotic lesions in Oil red O stained whole aorta from ND and HFD mice. (C) Representative histological images stained with Van Gieson’s staining from the different groups are shown. Quantification of (D) lesion areas based on Oil-red O staining and (E) elastin fragmentations based on Van Gieson staining in aortas from ND and HFD mice are shown. n = 5 per group. Plasma levels of (F) total cholesterol, (G) LDL-C and (H) HDL-C from ND and HFD mice were determined. Aortic arch PWV was directly proportional to total cholesterol in ND (R-squared = 0.6820, P = 0.0032) and HFD mice (R-squared = 0.6546, P = 0.0046), LDL-C in HFD mice (R-squared = 0.6323, P = 0.0059), and HDL-C in ND mice (R-squared = 0.4372, P = 0.0373), while was not proportional to LDL-C in ND mice (R-squared = 0.1548, P = 0.2606) and HDL-C in HFD mice (R-squared = 0.2131, P = 0.1793). LDL-C, low-density lipoprotein cholesterol; HDL-C, high-density lipoprotein cholesterol. n = 10 per group. *P < 0.05, **P < 0.01.
Sensitivity detection of echo-based PWV measurement
To investigate the sensitivity of the echo-based PWV measurement in experimental atherosclerosis mice, aortic arch and carotid artery PWV, and LV systolic/diastolic functions were continuously tracked for 8 weeks among the two groups of mice (Figure 6A). As shown in Figure 6B, aortic arch PWV was significantly increased after being fed on HFD for 2 weeks (P < 0.05), while the increase of carotid artery PWV occurred after 6 weeks in HFD mice (P < 0.05; Figure 6C). At week 6, the E/A ratio (P < 0.01; Figure 6D) and e/a ratio (P < 0.05; Figure 6E) were significantly decreased in the HFD group as compared with the ND group, indicating the diastolic dysfunction occurred after being fed on HFD for 6 weeks. At week 8, the reduction of EF (P < 0.01; Figure 6F) and CO (P < 0.01; Figure 6G) further confirmed that the heart systolic functions in HFD group of mice were significantly decreased by atherosclerosis after 8 weeks.
Discussion
In this study, an established method via echocardiography was employed to measure the stiffness of aortic arch and carotid arteries in ApoE-/- mice after being fed with ND or HFD for 8 weeks. We found the significant elevation of PWV values in aortic arch and carotid arteries, accompanied by the LV systolic/diastolic dysfunction in HFD mice as compared with ND mice. Furthermore, aortic arch PWV values were significantly increased after being fed with HFD for 2 weeks, which preceded atherosclerotic plaque formation. In addition, the increase of PWV values in the aortic arch preceded the changes in the carotid arteries and was positively correlated with their increased plasma cholesterol levels. This is the first report showing that aortic arch PWV measurement could be a potential diagnostic strategy for early detection of atherosclerosis.
As a polymorphic protein, ApoE is the important ligand of primary apolipoprotein to eliminate receptor mediation in lipid metabolism [26,27]. From the pathologic point of view, accumulated cholesterol in vascular walls stimulates foam cell development and migration of inflammatory cells and vascular smooth muscle cells are affected with more elastin fatigue fracture, collagen deposition and cross-linking, which finally leads to arterial stiffening [28,29]. Previous studies demonstrated that, after being fed with HFD, the levels of total cholesterol and LDL-C in ApoE-/- mice increase significantly [30]. In this study, compared with the mice in the ND group, the levels of total cholesterol and LDL-C were significantly increased, which was accompanied by a decrease of HDL-C levels in the HFD group. The regression analysis further confirmed that aortic arch PWV detection could effectively predict the changes of plasma cholesterol levels in mice (Figure 5F-H). In the HFD group, we also found an increase of elastic fiber fragmentation in aortas as compared to the ND group (Figure 5C and 5E). This may serve as one of the underlying mechanisms to stimulate arterial stiffening. After differentiated into foam cells to form early plaques, the deposition of lipids and LDL on the extracellular matrix, and especially on elastin, makes it more prone to elastin degradation [31]. Our results indicate that HFD may increase the arterial stiffness via degrading the elastic fibers in the aortas of ApoE-/- mice.
Arterial stiffness is one of the earliest indicators of changes in vascular wall structure that leads to a series of hemodynamic changes including the increase of wave reflections and LV afterload, resulting in the ventricular dysfunction and remodeling, ultimately causing severe heart failure and death [32,33]. Although the diagnosis of atherosclerosis at an early stage may reduce the incidence of clinical events in patients [5,34], it is still difficult to distinguish between lesion initiation and progression. Although a growing number of studies have demonstrated the changes of plasma cholesterol levels and atherosclerotic plaques in the arteries [35-38], few studies focus on the early detection of atherosclerosis phenotypes. In fact, foam cell lesions in ApoE-/- mice were developed after 8 weeks and advanced lesions (fibrous plaques) could be observed after 15 weeks [39]. To examine the changes and progression of atherosclerosis phenotypes, we measured the plague lesion areas in ApoE-/- mice after being fed with ND or HFD for 2 weeks or 8 weeks. Compared with the ND group, the lesion areas were significantly increased in the HFD group at week 8, while no significant difference was found at week 2 between the HFD and ND groups (Figure 5B and 5D), indicating that atherosclerotic plaque formation did not occur after 2 weeks of HFD treatment.
A previous study demonstrated that the increase of arterial stiffness can be observed earlier in carotid arteries than in the aortas in patients with hypercholesterolemia [40]. However, they have not examined the aortic arch but the global PWV of the aorta between the carotid and femoral arteries. According to the previous study, the severity of plaque development differs along the aortic tree in ApoE-/- mice after fed with HFD [35]. In this study, we mainly focused on a short fragment of the aorta arch including the aortic roots and a part of thoracic aorta, which serves as the site with a predilection for lesion development [20]. We observed that echo-based aortic arch PWV values were significantly increased in ApoE-/- mice after being fed with HFD for 2 weeks, when no significant changes in the carotid artery PWV values were observed between the HFD and ND groups (Figure 6B and 6C). At week 6, echo-based carotid artery PWV was increased in HFD mice versus ND mice, accompanied with the decrement of LV diastolic functions (Figure 6C-E). Our data indicates that echo-based PWV measurement in the aortic arch may be more sensitive to predict the atherosclerosis than in the carotid arteries in ApoE-/- mice.
As the first genetically modified murine model developed to study atherosclerosis, ApoE-/- mice has been widely used in examining arterial stiffness and atherosclerosis phenotypes in recent years, while the detection time was inconsistent in many studies. Gotschy A et al. reported the MRI-based PWV in ApoE-/- mice was increased after being fed with high cholesterol diet for 16 weeks [13]. Another study using MRI-based detection showed that local PWV was evaluated in ApoE-/- mice at the age of 18 weeks [41]. Herold V et al. reported the elevation of mean PWV values in ApoE-/- mice at the age of 8 months [21]. They have not examined PWV at the early stage of atherosclerosis. Therefore, to investigate the changes at an early stage, we measured the arterial stiffness using this echo-based diagnostic strategy in 8-week old ApoE-/- mice after being fed with ND or HFD for 2 weeks. The results proved that echo-based aortic arch PWV measurement could provide early information about the local progression of atherosclerosis before macroscopic alterations of the vessel wall occur (Figures 5B, 5D and 6B). Notably, this finding also precedes most changes being observed in other studies. From the point of this view, our study may provide a new perspective to other researchers who are focusing on early detection and treatment of atherosclerosis.
The limitation to our study is that we have not used other techniques such as MRI to further confirm the PWV in our mice. Although a repeated measurement over ten cardiac cycles was applied to improve the accuracy of evaluation according to the previous studies [23,42], the extremely rapid transit time due to the high heart rate in mice makes it difficult to completely eliminate interference during the measurement. Thus, using different techniques to examine the arterial stiffness at the same time and comparing the sensitivity among those methods in ApoE-/- mice at an early stage of atherosclerosis may warrant our further studies.
In conclusion, we demonstrated that stiffness of aortic arch and carotid arteries measured by echocardiography was significantly increased during the progression of atherosclerosis in our mouse model. Echo-based aortic arch PWV measurement may serve as a novel diagnostic strategy for early detection of atherosclerosis.
Acknowledgements
We are highly appreciated for the suggestions from Dr. Monica Lee and for the support from Maricela Castellon and Felecia Marottoli.
Disclosure of conflict of interest
None.
References
- 1.Spence JD, Pilote L. Importance of sex and gender in atherosclerosis and cardiovascular disease. Atherosclerosis. 2015;241:208–210. doi: 10.1016/j.atherosclerosis.2015.04.806. [DOI] [PubMed] [Google Scholar]
- 2.Libby P, Bornfeldt KE, Tall AR. Atherosclerosis: successes, surprises, and future challenges. Circ Res. 2016;118:531–534. doi: 10.1161/CIRCRESAHA.116.308334. [DOI] [PMC free article] [PubMed] [Google Scholar]
- 3.Virani SS, Alonso A, Benjamin EJ, Bittencourt MS, Callaway CW, Carson AP, Chamberlain AM, Chang AR, Cheng S, Delling FN, Djousse L, Elkind MSV, Ferguson JF, Fornage M, Khan SS, Kissela BM, Knutson KL, Kwan TW, Lackland DT, Lewis TT, Lichtman JH, Longenecker CT, Loop MS, Lutsey PL, Martin SS, Matsushita K, Moran AE, Mussolino ME, Perak AM, Rosamond WD, Roth GA, Sampson UKA, Satou GM, Schroeder EB, Shah SH, Shay CM, Spartano NL, Stokes A, Tirschwell DL, VanWagner LB, Tsao CW American Heart Association Council on Epidemiology and Prevention Statistics Committee and Stroke Statistics Subcommittee. Heart disease and stroke statistics-2020 update: a report from the american heart association. Circulation. 2020;141:e139–e596. doi: 10.1161/CIR.0000000000000757. [DOI] [PubMed] [Google Scholar]
- 4.Zhu Y, Xian X, Wang Z, Bi Y, Chen Q, Han X, Tang D, Chen R. Research progress on the relationship between atherosclerosis and inflammation. Biomolecules. 2018;8:80. doi: 10.3390/biom8030080. [DOI] [PMC free article] [PubMed] [Google Scholar]
- 5.Benjamin EJ, Muntner P, Alonso A, Bittencourt MS, Callaway CW, Carson AP, Chamberlain AM, Chang AR, Cheng S, Das SR, Delling FN, Djousse L, Elkind MSV, Ferguson JF, Fornage M, Jordan LC, Khan SS, Kissela BM, Knutson KL, Kwan TW, Lackland DT, Lewis TT, Lichtman JH, Longenecker CT, Loop MS, Lutsey PL, Martin SS, Matsushita K, Moran AE, Mussolino ME, O’Flaherty M, Pandey A, Perak AM, Rosamond WD, Roth GA, Sampson UKA, Satou GM, Schroeder EB, Shah SH, Spartano NL, Stokes A, Tirschwell DL, Tsao CW, Turakhia MP, VanWagner LB, Wilkins JT, Wong SS, Virani SS American Heart Association Council on Epidemiology and Prevention Statistics Committee and Stroke Statistics Subcommittee. Heart disease and stroke statistics-2019 update: a report from the American Heart Association. Circulation. 2019;139:e56–e528. doi: 10.1161/CIR.0000000000000659. [DOI] [PubMed] [Google Scholar]
- 6.Herrington W, Lacey B, Sherliker P, Armitage J, Lewington S. Epidemiology of atherosclerosis and the potential to reduce the global burden of atherothrombotic disease. Circ Res. 2016;118:535–546. doi: 10.1161/CIRCRESAHA.115.307611. [DOI] [PubMed] [Google Scholar]
- 7.Cavalcante JL, Lima JA, Redheuil A, Al-Mallah MH. Aortic stiffness: current understanding and future directions. J Am Coll Cardiol. 2011;57:1511–1522. doi: 10.1016/j.jacc.2010.12.017. [DOI] [PubMed] [Google Scholar]
- 8.Hansen L, Taylor WR. Is increased arterial stiffness a cause or consequence of atherosclerosis? Atherosclerosis. 2016;249:226–227. doi: 10.1016/j.atherosclerosis.2016.04.014. [DOI] [PMC free article] [PubMed] [Google Scholar]
- 9.Said MA, Eppinga RN, Lipsic E, Verweij N, van der Harst P. Relationship of arterial stiffness index and pulse pressure with cardiovascular disease and mortality. J Am Heart Assoc. 2018;7:e007621. doi: 10.1161/JAHA.117.007621. [DOI] [PMC free article] [PubMed] [Google Scholar]
- 10.Okamoto M, Nakamura F, Musha T, Kobayashi Y. Association between novel arterial stiffness indices and risk factors of cardiovascular disease. BMC Cardiovasc Disord. 2016;16:211. doi: 10.1186/s12872-016-0389-x. [DOI] [PMC free article] [PubMed] [Google Scholar]
- 11.Ben-Shlomo Y, Spears M, Boustred C, May M, Anderson SG, Benjamin EJ, Boutouyrie P, Cameron J, Chen CH, Cruickshank JK, Hwang SJ, Lakatta EG, Laurent S, Maldonado J, Mitchell GF, Najjar SS, Newman AB, Ohishi M, Pannier B, Pereira T, Vasan RS, Shokawa T, Sutton-Tyrell K, Verbeke F, Wang KL, Webb DJ, Willum Hansen T, Zoungas S, McEniery CM, Cockcroft JR, Wilkinson IB. Aortic pulse wave velocity improves cardiovascular event prediction: an individual participant meta-analysis of prospective observational data from 17,635 subjects. J Am Coll Cardiol. 2014;63:636–646. doi: 10.1016/j.jacc.2013.09.063. [DOI] [PMC free article] [PubMed] [Google Scholar]
- 12.Mitchell GF, Hwang SJ, Vasan RS, Larson MG, Pencina MJ, Hamburg NM, Vita JA, Levy D, Benjamin EJ. Arterial stiffness and cardiovascular events: the Framingham Heart Study. Circulation. 2010;121:505–511. doi: 10.1161/CIRCULATIONAHA.109.886655. [DOI] [PMC free article] [PubMed] [Google Scholar]
- 13.Gotschy A, Bauer WR, Winter P, Nordbeck P, Rommel E, Jakob PM, Herold V. Local versus global aortic pulse wave velocity in early atherosclerosis: an animal study in ApoE-/--mice using ultrahigh field MRI. PLoS One. 2017;12:e0171603. doi: 10.1371/journal.pone.0171603. [DOI] [PMC free article] [PubMed] [Google Scholar]
- 14.Yu WC, Chuang SY, Lin YP, Chen CH. Brachial-ankle vs carotid-femoral pulse wave velocity as a determinant of cardiovascular structure and function. J Hum Hypertens. 2008;22:24–31. doi: 10.1038/sj.jhh.1002259. [DOI] [PubMed] [Google Scholar]
- 15.Laurent S, Cockcroft J, Van Bortel L, Boutouyrie P, Giannattasio C, Hayoz D, Pannier B, Vlachopoulos C, Wilkinson I, Struijker-Boudier H. Expert consensus document on arterial stiffness: methodological issues and clinical applications. Eur Heart J. 2006;27:2588–2605. doi: 10.1093/eurheartj/ehl254. [DOI] [PubMed] [Google Scholar]
- 16.Van Bortel LM, Laurent S, Boutouyrie P, Chowienczyk P, Cruickshank JK, De Backer T, Filipovsky J, Huybrechts S, Mattace-Raso FU, Protogerou AD, Schillaci G, Segers P, Vermeersch S, Weber T. Expert consensus document on the measurement of aortic stiffness in daily practice using carotid-femoral pulse wave velocity. J Hypertens. 2012;30:445–448. doi: 10.1097/HJH.0b013e32834fa8b0. [DOI] [PubMed] [Google Scholar]
- 17.Fernandes-Silva MM, Shah AM, Claggett B, Cheng S, Tanaka H, Silvestre OM, Nadruz W, Borlaug BA, Solomon SD. Adiposity, body composition and ventricular-arterial stiffness in the elderly: the atherosclerosis risk in communities study. Eur J Heart Fail. 2018;20:1191–1201. doi: 10.1002/ejhf.1188. [DOI] [PMC free article] [PubMed] [Google Scholar]
- 18.Meir KS, Leitersdorf E. Atherosclerosis in the apolipoprotein-E-deficient mouse: a decade of progress. Arterioscler Thromb Vasc Biol. 2004;24:1006–1014. doi: 10.1161/01.ATV.0000128849.12617.f4. [DOI] [PubMed] [Google Scholar]
- 19.Emini Veseli B, Perrotta P, De Meyer GRA, Roth L, Van der Donckt C, Martinet W, De Meyer GRY. Animal models of atherosclerosis. Eur J Pharmacol. 2017;816:3–13. doi: 10.1016/j.ejphar.2017.05.010. [DOI] [PubMed] [Google Scholar]
- 20.He K, Wang J, Shi H, Yu Q, Zhang X, Guo M, Sun H, Lin X, Wu Y, Wang L, Wang Y, Xian X, Liu G. An interspecies study of lipid profiles and atherosclerosis in familial hypercholesterolemia animal models with low-density lipoprotein receptor deficiency. Am J Transl Res. 2019;11:3116–3127. [PMC free article] [PubMed] [Google Scholar]
- 21.Herold V, Herz S, Winter P, Gutjahr FT, Andelovic K, Bauer WR, Jakob PM. Assessment of local pulse wave velocity distribution in mice using k-t BLAST PC-CMR with semi-automatic area segmentation. J Cardiovasc Magn Reson. 2017;19:77. doi: 10.1186/s12968-017-0382-2. [DOI] [PMC free article] [PubMed] [Google Scholar]
- 22.Herold V, Parczyk M, Morchel P, Ziener CH, Klug G, Bauer WR, Rommel E, Jakob PM. In vivo measurement of local aortic pulse-wave velocity in mice with MR microscopy at 17.6 Tesla. Magn Reson Med. 2009;61:1293–1299. doi: 10.1002/mrm.21957. [DOI] [PubMed] [Google Scholar]
- 23.Lee L, Cui JZ, Cua M, Esfandiarei M, Sheng X, Chui WA, Xu MH, Sarunic MV, Beg MF, van Breemen C, Sandor GG, Tibbits GF. Aortic and cardiac structure and function using high-resolution echocardiography and optical coherence tomography in a mouse model of marfan syndrome. PLoS One. 2016;11:e0164778. doi: 10.1371/journal.pone.0164778. [DOI] [PMC free article] [PubMed] [Google Scholar]
- 24.Cheng Y, Qiao L, Jiang Z, Dong X, Feng H, Gui Q, Lu Y, Liang Y. Significant reduction in the LDL cholesterol increases the risk of intracerebral hemorrhage: a systematic review and meta-analysis of 33 randomized controlled trials. Am J Transl Res. 2020;12:463–477. [PMC free article] [PubMed] [Google Scholar]
- 25.Ference BA, Graham I, Tokgozoglu L, Catapano AL. Impact of lipids on cardiovascular health: JACC health promotion series. J Am Coll Cardiol. 2018;72:1141–1156. doi: 10.1016/j.jacc.2018.06.046. [DOI] [PubMed] [Google Scholar]
- 26.Rebeck GW. The role of APOE on lipid homeostasis and inflammation in normal brains. J Lipid Res. 2017;58:1493–1499. doi: 10.1194/jlr.R075408. [DOI] [PMC free article] [PubMed] [Google Scholar]
- 27.Getz GS, Reardon CA. ApoE knockout and knockin mice: the history of their contribution to the understanding of atherogenesis. J Lipid Res. 2016;57:758–766. doi: 10.1194/jlr.R067249. [DOI] [PMC free article] [PubMed] [Google Scholar]
- 28.Bar A, Targosz-Korecka M, Suraj J, Proniewski B, Jasztal A, Marczyk B, Sternak M, Przybyło M, Kurpińska A, Walczak M, Kostogrys RB, Szymonski M, Chlopicki S. Degradation of glycocalyx and multiple manifestations of endothelial dysfunction coincide in the early phase of endothelial dysfunction before atherosclerotic plaque development in apolipoprotein E/Low-density lipoprotein receptor-deficient mice. J Am Heart Assoc. 2019;8:e011171. doi: 10.1161/JAHA.118.011171. [DOI] [PMC free article] [PubMed] [Google Scholar]
- 29.Wu MY, Li CJ, Hou MF, Chu PY. New insights into the role of inflammation in the pathogenesis of atherosclerosis. Int J Mol Sci. 2017;18:2034. doi: 10.3390/ijms18102034. [DOI] [PMC free article] [PubMed] [Google Scholar]
- 30.Johnson J, Carson K, Williams H, Karanam S, Newby A, Angelini G, George S, Jackson C. Plaque rupture after short periods of fat feeding in the apolipoprotein E-knockout mouse: model characterization and effects of pravastatin treatment. Circulation. 2005;111:1422–1430. doi: 10.1161/01.CIR.0000158435.98035.8D. [DOI] [PubMed] [Google Scholar]
- 31.Maurice P, Blaise S, Gayral S, Debelle L, Laffargue M, Hornebeck W, Duca L. Elastin fragmentation and atherosclerosis progression: the elastokine concept. Trends Cardiovasc Med. 2013;23:211–221. doi: 10.1016/j.tcm.2012.12.004. [DOI] [PubMed] [Google Scholar]
- 32.Spartano NL, Augustine JA, Lefferts WK, Hughes WE, Heffernan KS. Arterial stiffness as a noninvasive tissue biomarker of cardiac target organ damage. Current Biomarker Findings. 2014;2014:23–34. [Google Scholar]
- 33.Palombo C, Kozakova M. Arterial stiffness, atherosclerosis and cardiovascular risk: pathophysiologic mechanisms and emerging clinical indications. Vascul Pharmacol. 2016;77:1–7. doi: 10.1016/j.vph.2015.11.083. [DOI] [PubMed] [Google Scholar]
- 34.Joseph P, Leong D, McKee M, Anand SS, Schwalm JD, Teo K, Mente A, Yusuf S. Reducing the global burden of cardiovascular disease, part 1: the epidemiology and risk factors. Circ Res. 2017;121:677–694. doi: 10.1161/CIRCRESAHA.117.308903. [DOI] [PubMed] [Google Scholar]
- 35.Cilla M, Pérez MM, Peña E, Martínez MA. Effect of diet and age on arterial stiffening due to atherosclerosis in ApoE(-/-) mice. Ann Biomed Eng. 2016;44:2202–2217. doi: 10.1007/s10439-015-1486-1. [DOI] [PubMed] [Google Scholar]
- 36.Gu L, Gong Y, Zhao C, Wang Y, Tian Q, Lei G, Liang Y, Zhao W, Tan S. Lunasin improves the LDL-C lowering efficacy of simvastatin via inhibiting pcsk9 expression in hepatocytes and ApoE(-/-) mice. Molecules. 2019;24:4140. doi: 10.3390/molecules24224140. [DOI] [PMC free article] [PubMed] [Google Scholar]
- 37.Guo K, Hu L, Xi D, Zhao J, Liu J, Luo T, Ma Y, Lai W, Guo Z. PSRC1 overexpression attenuates atherosclerosis progression in apoE(-/-) mice by modulating cholesterol transportation and inflammation. J Mol Cell Cardiol. 2018;116:69–80. doi: 10.1016/j.yjmcc.2018.01.013. [DOI] [PubMed] [Google Scholar]
- 38.Virtue A, Johnson C, Lopez-Pastraña J, Shao Y, Fu H, Li X, Li YF, Yin Y, Mai J, Rizzo V, Tordoff M, Bagi Z, Shan H, Jiang X, Wang H, Yang XF. MicroRNA-155 deficiency leads to decreased atherosclerosis, increased white adipose tissue obesity, and non-alcoholic fatty liver disease: a novel mouse model of obesity paradox. J Biol Chem. 2017;292:1267–1287. doi: 10.1074/jbc.M116.739839. [DOI] [PMC free article] [PubMed] [Google Scholar]
- 39.Mushenkova NV, Summerhill VI, Silaeva YY, Deykin AV, Orekhov AN. Modelling of atherosclerosis in genetically modified animals. Am J Transl Res. 2019;11:4614–4633. [PMC free article] [PubMed] [Google Scholar]
- 40.Ershova AI, Meshkov AN, Rozhkova TA, Kalinina MV, Deev AD, Rogoza AN, Balakhonova TV, Boytsov SA. Carotid and aortic stiffness in patients with heterozygous familial hypercholesterolemia. PLoS One. 2016;11:e0158964. doi: 10.1371/journal.pone.0158964. [DOI] [PMC free article] [PubMed] [Google Scholar]
- 41.Gotschy A, Bauer E, Schrodt C, Lykowsky G, Ye YX, Rommel E, Jakob PM, Bauer WR, Herold V. Local arterial stiffening assessed by MRI precedes atherosclerotic plaque formation. Circ Cardiovasc Imaging. 2013;6:916–923. doi: 10.1161/CIRCIMAGING.113.000611. [DOI] [PubMed] [Google Scholar]
- 42.Bradley TJ, Potts JE, Potts MT, DeSouza AM, Sandor GG. Echocardiographic doppler assessment of the biophysical properties of the aorta in pediatric patients with the marfan syndrome. Am J Cardiol. 2005;96:1317–1321. doi: 10.1016/j.amjcard.2005.06.080. [DOI] [PubMed] [Google Scholar]