Abstract
COVID‐19 has impacted the world in many ways, including loss of lives, economic downturn and social isolation. COVID‐19 was emerged due to the SARS‐CoV‐2 that is highly infectious pandemic. Every country tried to control the COVID‐19 spread by imposing different types of lockdowns. Therefore, there is an urgent need to forecast the daily confirmed infected cases and deaths in different types of lockdown to select the most appropriate lockdown strategies to control the intensity of this pandemic and reduce the burden in hospitals. Currently are imposed three types of lockdown (partial, herd, complete) in different countries. In this study, three countries from every type of lockdown were studied by applying time‐series and machine learning models, named as random forests, K‐nearest neighbors, SVM, decision trees (DTs), polynomial regression, Holt winter, ARIMA, and SARIMA to forecast daily confirm infected cases and deaths due to COVID‐19. The models' accuracy and effectiveness were evaluated by error based on three performance criteria. Actually, a single forecasting model could not capture all data sets' trends due to the varying nature of data sets and lockdown types. Three top‐ranked models were used to predict the confirmed infected cases and deaths, the outperformed models were also adopted for the out‐of‐sample prediction and obtained very close results to the actual values of cumulative infected cases and deaths due to COVID‐19. This study has proposed the auspicious models for forecasting and the best lockdown strategy to mitigate the causalities of COVID‐19.
Keywords: COVID‐19, healthcare, lockdown, lungs infection, machine learning models, public health, time series
Optimized data set model is proposed to predict 10 thinspace
days ahead of lung infection and death cases due to COVID‐19. The model predicted results very close to the actual values. The best policy to control infection and death cases was the Herd lockdown strategy.
1. INTRODUCTION
Lung infection due to the coronavirus outbreak at the end of 2019 has affected more than 57 million people around the globe, with more than 1.36 million deaths. The main source of this virus was Wuhan of China's Hubei province and it spread so dynamically throughout the world that WHO declared it pandemic short after. Infectious disease transmission is a complex transmission process that takes place from human to human. In addition to different symptoms of this infection, it has highly destructive effects on the lungs, causing a break in the respirate system that may lead to death (Khan et al., 2021). Indeed, every country tried to handle this pandemic through different strategies such as partial or complete lockdown to stop the spread‐out of this virus or herd immunity from creating sufficient resistance among the people to cover this infection through the body immune system. Hence, there is a need to develop predictive models to analyze and assess the mechanism for propagating infectious diseases that can accurately predict future patterns of infectious diseases for humanity's welfare. These models' basic objective is to classify the behavior of affected cases to minimize the harm caused by a coronavirus (Rehman, Sadad, Saba, Hussain, & Tariq, 2021b).
Machine learning techniques play a significant role in infection detection and prediction (Perveen et al., 2020; Yousaf et al., 2020). The trained‐techniques can process big data at high speed to find infection cases and trends to warn the decision‐makers (Sadad, Munir, Saba, & Hussain, 2018; Saba, Haseeb. et al., 2020; Saba, Mohamed, et al., 2020; Ullah et al., 2019). In their review study, Long and Ehrenfeld (2020) claimed that prediction through artificial intelligence methods might reduce the effects of this pandemic crisis. Accordingly, several automatic classifications of infection detections and forecasting models are reported in the literature with different scope (Saba, Bokhari, Sharif, Yasmin, & Raza, 2018; Saba, Khan, et al., 2019; Mashood Nasir, et al., 2020).
The forecasting methods could be divided into statistical, machine learning (ML), and deep learning methods (Mughal, Muhammad, Sharif, Rehman, & Saba, 2018; Mughal, Sharif, Muhammad, & Saba, 2018; Phetchanchai, Selamat, Saba, & Rehman, 2010; Saba, Rehman, & AlGhamdi, 2017). The machine learning solution recently proposed was using the Random Forest Infection Scale (iSARF), to detect the infection size and affected lung areas. MLP and adaptive network‐based fuzzy inference (ANFIS) are used in the estimation and forecasting of dynamic variance behaviors. It was proposed to take the verified cases and estimate the numbers of infected persons in the country with the hybrid approach to vector control by Support Vector Regression (SVR) and ARIMA (Al‐Ameen et al., 2015; Sadad et al., 2021). Also, Parbat and Chakraborty (2020) used the RBF kernel model for forecasting everyday cases, recovered conditions, and death.
Indeed, deep learning approaches play a crucial role in detecting infection and forecasting large outbreak data trends that helped avoid coronavirus spread through early alarming (Rehman, Saba, Ayesha & Tariq, 2021c). COVID‐19 deals with time‐series data and the use of sequential models to resolve its complex existence has been generally supported. Bandyopadhyay and Dutta (2020) proposed to test the predictions with confirmed, negative, and death‐case COVID‐19 RNN and long short‐term memory (LSTM) network. Huang, Chen, Ma, and Kuo (2020) used the model for estimating the total reported cases of COVID‐19 using DL‐based convolutionary neural network (CNN). However, the main issue with the deep learning approaches is their training requirement of huge labeled data, which is hard to manage for a particular community. It could not be generalized due to the different nature of infection around the globe.
Regarding this context, this research's main achievement is to explore and compare the predictive capacity of time series analysis and machine learning models to predict daily cumulative Confirmed Infected Cases (CIC) and deaths under different types of lockdown.
The main contributions of the research are listed below:
Determined infected and death cases due to Covid19
Concluded which type of lockdown was much more effective than others and the best‐predicted results under which strategy.
Predicted possible arrangements and revision of the lockdown policy in certain cases.
Further, this paper is composed of sections such that Section 2 provides a brief description of data sets publically available. Section 3 presents material and methods. Performance evaluation criteria are discussed in Section 4 and the results and discussion in Section 5; finally, research concluded in Section 6.
2. DATA SETS DESCRIPTION
The standard data sets are important to train the classifiers and compare the results in state‐of‐the‐art reported techniques (Lung, Salam, Rehman, Rahim, & Saba, 2014; Rad, Rahim, Rehman, & Saba, 2016). To save the maximum population from COVID‐19 in the country, countries implemented various policies. They imposed different lockdown types (like the partial, herd, and complete) to reduce people's social activities and movements for creating social distancing. In this study, three countries from each type of lockdown were considered for the prediction of incidences. They collected time‐series data sets of cumulative confirmed cases and cumulative deaths due to COVID‐19 were collected from https://github.com/CSSEGISandData for nine countries, including India, Iran, Hubei (China), Iceland, Sweden, Netherland, Russia, Bulgaria, and Greece, for the period of January 22, 2020, to September 30, 2020. Figure 1 highlighted the selected nine countries and the type of lockdown in those countries. To compare the cases in a standardized way, the cumulative confirmed cases per million and deaths per million of each considered country were plotted in Figures 2 and 3. But all the analyses were performed using cumulative CIC and deaths.
FIGURE 1.
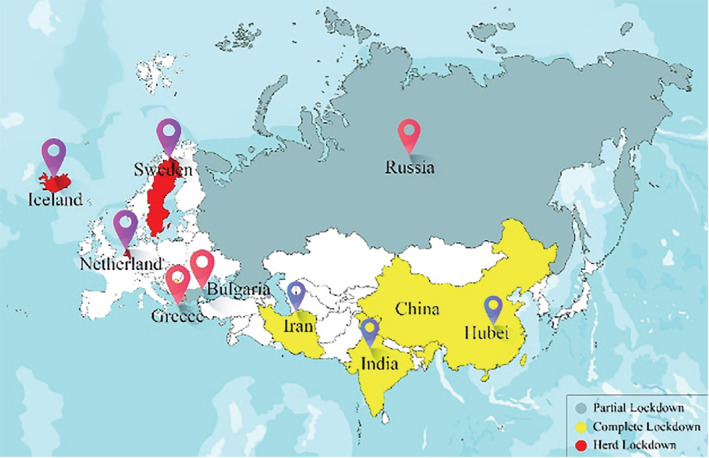
Nine selected countries, each three from the partial, herd, and complete lockdown
FIGURE 2.
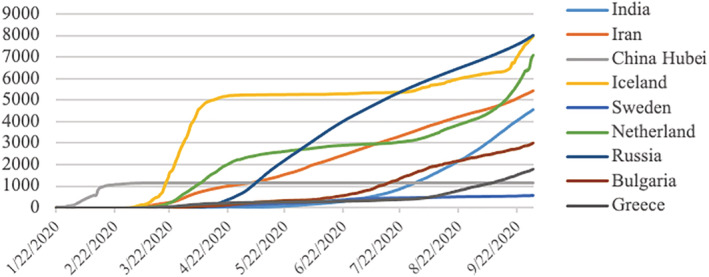
Day by day number of cumulative confirmed cases per million population in each of the nine countries
FIGURE 3.
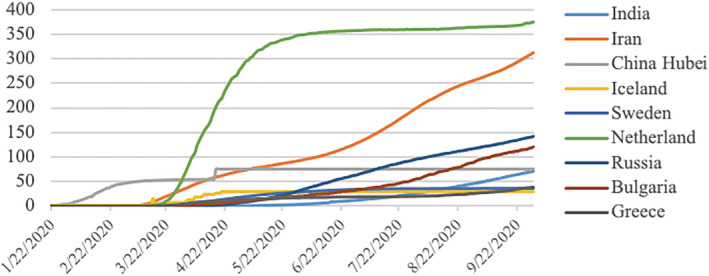
Day by day number of cumulative deaths per million population in each of the nine countries
3. MATERIALS AND METHODS
Machine learning and time‐series techniques are proven to effectively predict and control several issues like infection diseases, floods, earthquakes, and so forth (Nodehi et al., 2014; Rehman, 2020). This section presents a description of the machine learning models applied in this study to predict the daily cumulative CIC and deaths due to COVID‐19. The framework of the study is presented in Figure 4.
FIGURE 4.
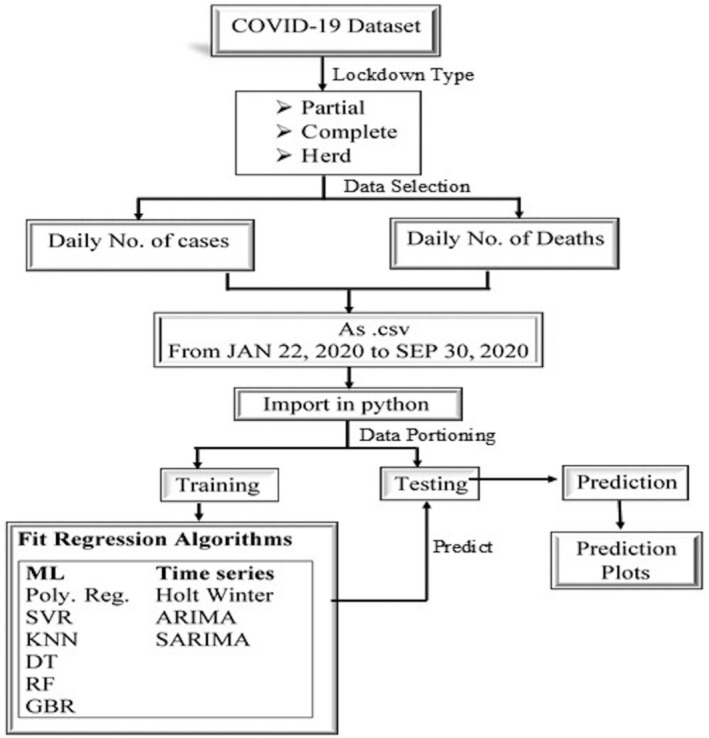
Flowchart to forecast the daily cumulative infected and death cases due to COVID‐19
3.1. Random forests
The random forest (RF) is supervised, robust, tree based machine learning technique; useful for classification and regression purposes (Rehman et al., 2020). It is a beneficial technique for predicting speed, suitability for big dimensional problems, useful for handling the missing data and outliers. It looks like the forest building approach, which helps to find out the unbiased estimates. RF solves complex problems and find out accurate results by using precise learning algorithms and functions. This model still maintains its accuracy despite data is less and has missing values (Breiman, 2001). It Choose the multiple DTs to find the ultimate output and best solution path to a problem; this method is called bootstrap aggregation, also called bagging (Rehman et al., 2021a). The purpose of combining bagging with random feature selection to reduce the correlation between trees without reducing variance too much (Kuznetsova, Westenberg, Buchin, Dinkla, & van den Elzen, 2014). RF also uses the bootstrapping method that randomly draws multiple samples from the original data set to improve a prediction's accuracy. Ribeiro, Da Silva, Mariani, and dos Santos Coelho (2020) used the RF to forecast confirmed cases of COVID‐19 in Brazil.
3.2. K‐nearest neighbors
The K‐nearest Neighbors (KNN) technique is a nonparametric method that is useful for regression and classification purposes (Jamal, Hazim Alkawaz, Rehman, & Saba, 2017). It is an occurrence‐based learner model. In the time‐series analysis, the KNN explores the k nearest past comparable values (named nearest neighbors) by Euclidean distance in the given data set (like nearest past COVID‐19 values). The KNN is provided the smallest similarity measure between the past and new cases. In the present study, by considering the KNN the CIC and deaths are forecasted, as da Silva, Ribeiro, Mariani, and dos Santos Coelho (2020) also forecasted the COVID‐19 cases by the KNN.
3.3. Support vector regression
The support vector machine (SVM) is a machine learning technique used for regression and classification purposes and time‐series data prediction. It has excellent generalization ability and also appropriate for even small data (Khan et al., 2019). The support vector regression (SVR) works by following the same SVM principle with a continuous dependent variable instead of categorical. SVR uses the kernels that convert the data from low dimension to high dimension to classify classes easily. The planes that separate the classes into higher dimension are called hyperplanes (Nobel, 2006). The SVR training algorithms are mostly offline, but online algorithms are mostly used to automatically track system model time‐varying changes and time lagging characteristics Rehman (2021). The online SVR algorithms have drawbacks like when the margin support vector is empty and the training speed is plodding. The training time for computing data depends on the kernel function. The popular four kernels are the linear, radial basis, polynomial, and sigmoid. Linear kernel use for linear separable distribution, polynomial for polynomial separable distribution, radial for circularly separable, and sigmoid for special distribution. Parbat and Chakraborty (2020) also predicted the confirmed, recovered, and death cases by employing the SVR model.
3.4. ARIMA (p, d, q)
ARIMA stands for the auto‐regressive integrated moving average, used for modeling and forecasting in time series analysis. It deals with the non‐stationary time series data by making it stationary. In ARIMA (p, d, q), the order p represents the number of lag variables of the time‐series that appear on the independent side, d shows the order of difference that is required to make the non‐stationary series stationary, and q is the order for moving average also appear as independent variables. The p and q values vary until we get the most suitable ARIMA model for modeling and prediction. In many studies, the ARIMA model employed and obtained better forecasting of COVID‐19 confirmed, recovered, and death cases for many countries.
3.5. SARIMA (p, d, q)(P, D, Q) S
The seasonal autoregressive integrated moving average (SARIMA) model is the ARIMA model's seasonal extension (Szeto, Ghosh, Basu, & Mahony, 2009). The order (p, d, q) is the same as in the ARIMA model. Still, the order P represents the number of seasonal lag values, D presents seasonal difference to series stationery. Q is the order for lag values of seasonal moving average and s is for the seasonal pattern. The comparative studies justified that the SARIMA models perform better than a simple ARIMA, if seasonality present in the data (Chung & Rosalion, 2001). The seasonal pattern in the data series has been observed by autocorrelation function (ACF) and partial ACF (PACF) in time series for the analysis with SARIMA (Szeto et al., 2009).
3.6. Decision trees
DTs are supervised learning methods used for both classification and regression purposes (Saba, 2021). They predicted the dependent variable's values by learning simple decision rules inferred from the data featured (Khan et al., 2020). A DTs algorithm starts from the root node and goes through multiple internal or split nodes until reaching the leaf. Data points go internal nodes if the binary tree goes to the right internal node; otherwise, left until these points shall end up on appropriate leaves. When the learning process is completed, we can test the algorithm on test data with unknown features (Waheed, Alkawaz, Rehman, Almazyad, & Saba, 2016). Chi‐squared Automatic Interaction Detection, Classification and Regression Trees, C4.5, and C5.0 are the most common tree methods which are used (Tso & Yau, 2007). DTs produce a model whose results are may represent interpretable rules or logic statements. It provides obvious information on the significant factors for classification and/or prediction.
3.7. Holt winter model
The Holt winter model was introduced by Chatfield and Yar (1988) and is used for forecasting the values based on own past values of the series. It is beneficial for short‐term data prediction and contains the three components: level, trend, and seasonal. It has additive and multiplicative forms, and the difference between the additive and multiplicative models is dependent on the nature of the seasonal component. If the variation is almost stable through series is called an additive model and if variations change proportionally to the level of the series is called the multiplicative model.
3.8. Polynomial regression
The regression‐based on the relationship between the dependent variable (y t ) and up to the rth degree of the independent variable (x t ) is called polynomial regression. It fits a temporarily nonlinear relationship between the observations of x t and the corresponding conditional‐mean of the y t observations, denoted as E(y t | x t ). It has been used for nonlinear phenomena like the distribution of isotopes in lake sediments, a growth rate of tissues, and progression of disease epidemic (Sun, Liu, Zhou, & Li, 2014).
3.9. Gradients boosting regressor
Gradients boosting regressor (GBR) is a machine learning algorithm adopted for prediction and/or classification. It uses the gradients boosting decent approach for problem minimization and to obtain a prediction model in the form of an ensemble of the weak prediction model. It contains three elements, which are loss function, a weak learner, and an additive model. The loss function needs to be optimized, the weak learner uses for making the prediction values and the additive model is used to add a weak learner to minimize the loss function. It uses the DTs with a fixed size as weak learners. Decision trees can handle a mixed type of data and have the ability to model complex functions. GBR has some advantages like high predictive power, supports the different loss functions, and robustness to outliers in output space.
4. PERFORMANCE EVALUATION‐METRIC
The comprehensive investigation was achieved in Python by assessed the three well‐recognized errors, such as mean absolute percentage error (MAPE), mean absolute error (MAE), and root mean square (RMSE). The computing expression for these evaluation‐metric are as given below
where n is the number of observations, A j and P j are the jth actual observed and predicted values, respectively.
5. RESULTS AND DISCUSSION
The performance of six machine learning and three time‐series methods was evaluated to predict the cumulative CIC and deaths discussed in the methods and materials section. The predictive modeling purpose was to better predict COVID‐19 cases in selected countries concerning lockdown types. The daily time‐series data sets of COVID‐19 were split into training and testing sample sets with a ratio of 95%:05%, respectively, as Li and Chan (2017) and Azuaje (2003) obtained much better results by this ratio. The concept of the partition of the data sets into training and testing sample sets is presented in Figure 5. Every considered technique was applied in the training sample data set and obtained the best‐fitted model. Finally, validated the best‐fitted model in the testing sample data set and the results are tabulated. Nine models have been used to get the best forecasting model, ranging from simple to complex and from time‐series to machine‐learning. The COVID‐19 cumulative CIC and deaths were forecasted for the nine countries and three different lockdown types. In total, we have produced forecasts 54 times for daily data but graphically presented three best models per country for CIC and deaths, those identified best model on the base of the smaller MAPE, MAE and RMSE.
FIGURE 5.
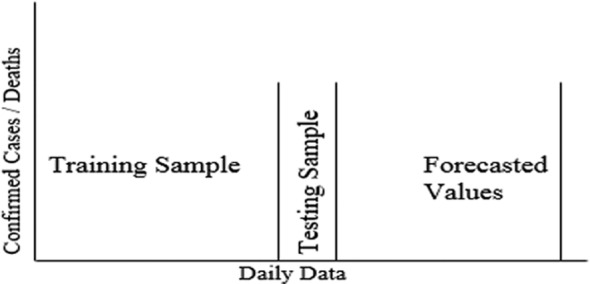
The forecasting models are the optimal choice to deal with past data and predict new values based on past data. This paper implemented the PR, SVR, DT, GBR, RF, KNN, Holt Winter, ARIMA, and SARIMA models on COVID‐19 data from January 22, 2020 to September 30, 2020 predict the COVID‐19 trend in selected countries. All models were mature on training data sets. By applying the matured models on tested data sets, we obtained the MAPE, MAE, and RMSE values shown in Tables 1, 2, 3 of all countries concerning daily cumulative CIC and deaths of all lockdown types. The best optimal model is select regarding the MAPE, MAE, and RMSE criteria; closer to zero are the main criteria to prefer one model over another with the lowest prediction error for one country to others. The Holt's winter, ARIMA, and SARIMA models have achieved the optimal models regarding the MAPE, MAE, and RMSE criteria of all partial lockdown countries concerning forecast daily cumulative CIC and deaths the base of past data and make them bold.
TABLE 1.
Forecasting accuracy measures for the cumulative confirmed cases and deaths in the countries where partial lockdown was imposed
| Country | Bulgaria | Greece | Russia | ||||||
|---|---|---|---|---|---|---|---|---|---|
| Models | MAPE | MAE | RMSE | MAPE | MAE | RMSE | MAPE | MAE | RMSE |
| Daily cumulative number of confirmed cases | |||||||||
| PR | 15.82 | 3,166.78 | 3,746.56 | 15.4 | 2,651.9 | 3,072.3 | 0.94 | 10,767.6 | 11,687.8 |
| SVR | 33.94 | 6,680.51 | 6,743.44 | 8.45 | 1,414 | 1,447.4 | 5.91 | 67,351.6 | 74,295.3 |
| DT | 5.32 | 1,066.69 | 1,260.38 | 12.6 | 2,152.6 | 2,453.6 | 3.94 | 44,993.5 | 51,984.9 |
| GBR | 5.36 | 1,073.51 | 1,266.16 | 12.6 | 2,157.9 | 2,458.2 | 3.98 | 45,449.1 | 52,379.7 |
| RF | 5.69 | 1,137.62 | 1,320.95 | 13.5 | 2,305.5 | 2,588.8 | 4.17 | 47,625.9 | 54,279.3 |
| KNN | 5.72 | 1,143.69 | 1,326.18 | 13.7 | 2,332.1 | 2,612.5 | 4.19 | 47,827 | 54,455.8 |
| Holt winter | 0.85 | 171.40 | 223.02 | 2.98 | 509.82 | 573.4 | 0.51 | 5,940.53 | 7,962.28 |
| ARIMA | 1.06 | 215.20 | 297.55 | 0.43 | 71.2 | 82.98 | 0.33 | 3,906.5 | 5,547.78 |
| SARIMA | 0.86 | 175.45 | 253.65 | 0.34 | 55.44 | 69.12 | 0.37 | 4,299.09 | 6,094.87 |
| Daily cumulative number of deaths | |||||||||
| PR | 1.16 | 9.36 | 13.53 | 1.91 | 7.08 | 8.18 | 2.1 | 423.86 | 483.27 |
| SVR | 23.57 | 185.48 | 188.88 | 2.91 | 10.9 | 12.5 | 51.4 | 10,224.3 | 10,314.9 |
| DT | 4.31 | 34.38 | 40.77 | 9.81 | 36.6 | 42.2 | 4.25 | 855.23 | 973.59 |
| GBR | 4.35 | 34.66 | 41.01 | 9.85 | 36.7 | 42.3 | 4.29 | 862.96 | 980.39 |
| RF | 4.78 | 38.03 | 43.89 | 10.7 | 39.7 | 44.9 | 4.56 | 917.51 | 1,028.73 |
| KNN | 4.95 | 39.38 | 45.07 | 11.1 | 41.1 | 46.2 | 4.61 | 926.73 | 1,036.96 |
| Holt winter | 0.39 | 3.12 | 3.99 | 0.56 | 2.08 | 2.62 | 0.41 | 82.7 | 91.38 |
| ARIMA | 1.94 | 15.29 | 16.19 | 1.50 | 5.58 | 6.34 | 0.10 | 21.84 | 27.75 |
| SARIMA | 1.41 | 11.13 | 12.22 | 1.87 | 6.96 | 7.99 | 0.06 | 13.76 | 15.76 |
Three model values were bolded due to those provided best results than other.
TABLE 2.
Forecasting accuracy measures for the cumulative confirmed cases and deaths in the countries where complete lockdown was imposed
| Country | Hubei (China) | Iran | India | ||||||
|---|---|---|---|---|---|---|---|---|---|
| Models | MAPE | MAE | RMSE | MAPE | MAE | RMSE | MAPE | MAE | RMSE |
| Daily cumulative number of confirmed cases | |||||||||
| PR | 32.32 | 22,854.48 | 25,854.48 | 5.78 | 25,669.04 | 29,622.75 | 2.55 | 154,437.44 | 193,090.93 |
| SVR | 0.02 | 10.80 | 10.89 | 17.34 | 75,997.33 | 77,097.60 | 81.43 | 4,736,407.58 | 4,743,009.46 |
| DT | 0.00 | 0.00 | 0.00 | 5.21 | 23,112.84 | 26,477.11 | 10.08 | 601,536.69 | 677,737.28 |
| GBR | 0.007 | 0.27 | 0.52 | 5.26 | 23,316.20 | 26,654.81 | 10.10 | 602,666.34 | 678,740.12 |
| RF | 0.00 | 0.00 | 0.00 | 5.51 | 24,420.93 | 27,626.36 | 10.85 | 646,264.90 | 717,732.36 |
| KNN | 0.00 | 0.00 | 0.00 | 5.53 | 24,520.34 | 27,714.27 | 10.91 | 649,748.69 | 720,870.85 |
| Holt winter | 0.0002 | 0.018 | 0.019 | 0.29 | 1,329.28 | 1,640.21 | 0.44 | 26,939.18 | 33,528.18 |
| ARIMA | 0.40 | 273.73 | 335.69 | 0.75 | 3,355.12 | 4,079.23 | 1.61 | 97,391.75 | 119,710.00 |
| SARIMA | 0.01 | 10.8 | 0.007 | 0.81 | 3,638.89 | 4,365.41 | 1.32 | 79,729.27 | 98,717.20 |
| Daily cumulative number of deaths | |||||||||
| PR | 37.40 | 1,687.79 | 1981.23 | 4.88 | 1,245.73 | 1,534.01 | 0.93 | 868.14 | 908.25 |
| SVR | 0.06 | 2.81 | 2.81 | 34.55 | 8,675.00 | 8,740.14 | 6.78 | 6,325.34 | 6,625.19 |
| DT | 0.00 | 0.00 | 0.00 | 4.84 | 1,230.38 | 1,412.56 | 8.31 | 7,825.23 | 8,810.17 |
| GBR | 0.007 | 0.03 | 0.03 | 4.88 | 1,240.93 | 1,421.76 | 8.33 | 7,852.31 | 8,834.23 |
| RF | 0.00 | 0.00 | 0.00 | 5.15 | 1,309.80 | 1,482.25 | 8.90 | 8,372.49 | 9,299.65 |
| KNN | 0.00 | 0.00 | 0.00 | 5.19 | 1,318.38 | 1,489.84 | 8.94 | 8,412.23 | 9,335.44 |
| Holt winter | 0.00002 | 0.00009 | 0.00009 | 0.24 | 60.78 | 65.94 | 0.40 | 387.29 | 504.58 |
| ARIMA | 2.87 | 129.65 | 148.38 | 0.12 | 30.28 | 33.31 | 0.55 | 531.91 | 699.18 |
| SARIMA | 0.00007 | 0.0006 | 0.0007 | 0.09 | 22.65 | 25.87 | 0.47 | 452.77 | 602.94 |
Three model values were bolded due to those provided best results than other.
TABLE 3.
Forecasting accuracy measures for the cumulative confirmed cases and deaths in the countries where herd lockdown was imposed
| Country | Iceland | Netherland | Sweden | ||||||
|---|---|---|---|---|---|---|---|---|---|
| Models | MAPE | MAE | RMSE | MAPE | MAE | RMSE | MAPE | MAE | RMSE |
| Daily cumulative number of confirmed cases | |||||||||
| PR | 27.69 | 715.54 | 830.54 | 9.56 | 10,285.79 | 11,743.07 | 7.39 | 6,742.31 | 8,223.87 |
| SVR | 6.71 | 173.88 | 203.87 | 9.45 | 10,195.53 | 11,608.08 | 47.96 | 43,296.94 | 43,666.40 |
| DT | 11.40 | 293.92 | 332.64 | 14.26 | 15,463.84 | 18,014.32 | 2.44 | 2,226.53 | 2,701.35 |
| GBR | 11.43 | 294.69 | 333.32 | 14.30 | 15,504.66 | 18,049.37 | 2.47 | 2,259.54 | 2,728.62 |
| RF | 11.66 | 300.41 | 338.39 | 15.00 | 16,219.56 | 18,667.07 | 2.59 | 2,366.83 | 2,818.11 |
| KNN | 11.74 | 302.42 | 340.18 | 15.11 | 16,340.34 | 18,772.11 | 2.61 | 2,381.53 | 2,830.46 |
| Holt winter | 7.89 | 202.74 | 225.68 | 3.89 | 4,265.77 | 5,347.75 | 0.82 | 741.17 | 855.84 |
| ARIMA | 7.40 | 190.30 | 212.45 | 3.49 | 3,845.05 | 4,967.90 | 0.71 | 650.78 | 813.43 |
| SARIMA | 7.49 | 192.93 | 216.84 | 2.07 | 2,297.04 | 3,144.86 | 0.39 | 354.67 | 456.47 |
| Daily cumulative number of deaths | |||||||||
| PR | 24.29 | 2.42 | 2.78 | 27.86 | 1769.76 | 2060.50 | 17.09 | 1,005.51 | 1,178.89 |
| SVR | 20.23 | 2.02 | 2.03 | 34.08 | 2,157.51 | 2,171.72 | 58.15 | 3,417.77 | 3,445.04 |
| DT | 0.00 | 0.00 | 0.00 | 0.93 | 59.53 | 75.31 | 0.20 | 11.92 | 14.98 |
| GBR | 0.001 | 0.0001 | 0.0001 | 0.95 | 60.99 | 76.47 | 0.23 | 13.89 | 16.59 |
| RF | 0.00 | 0.00 | 0.00 | 0.96 | 61.52 | 76.89 | 0.24 | 14.10 | 16.77 |
| KNN | 0.00 | 0.00 | 0.00 | 0.98 | 62.53 | 77.70 | 0.236 | 13.92 | 16.62 |
| Holt winter | 0.00 | 0.002 | 0.0003 | 0.65 | 41.78 | 54.87 | 0.63 | 37.06 | 41.79 |
| ARIMA | 1.20 | 0.12 | 0.13 | 0.60 | 38.59 | 51.96 | 0.57 | 33.83 | 40.15 |
| SARIMA | 2.7 | 0.27 | 0.30 | 0.53 | 34.03 | 47.01 | 0.42 | 24.93 | 27.59 |
Three model values were bolded due to those provided best results than other.
Every data set is modeled and predicted by the nine considered models, but we are only discussing the three best‐fitted models. As the Holt's winter, ARIMA (3,2,2), and SARIMA (0,2,1)(1,0,1)7 were selected as best models for forecasting the amount of daily cumulative CIC and deaths based on past data in Bulgaria. Their MAPE values for Bulgaria CIC and deaths were (0.85, 1.06, 0.86) and (0.39, 1.94, 1.41), MAE values were (171.40, 215.20, 175.45) and (3.12, 15.29, 11.13) and RMSE values were (223.02, 297.55, 253.65) and (3.99, 16.19, 12.22), respectively. Holt's winter was selected as the best technique for forecasting the number of daily cumulative CIC and Bulgaria deaths with the indices' least values.
The Holt's winter, ARIMA (3, 2, 2) and SARIMA (0,2,1)(1,0,1)7 models have declared the best models for forecasting the amount of daily CIC and deaths in Greece. Their MAPE values of for Greece daily CIC and deaths were (2.98, 0.43, 0.34) and (0.56, 1.50, 1.87), MAE values were (509.82, 71.2, 55.44) and (2.08, 5.58, 6.96) and RMSE values were (573.4, 82.98, 69.12) and (2.62, 6.34, 7.99), respectively. Overall, the best model of the confirmed cases was the SARIMA (0,2,1)(1,0,1)7 and Holt's winter for the number of deaths prediction for Greece with the partial lockdown. Holt's winter, ARIMA, and SARIMA were ranked the top three models to forecast the amount of daily confirmed infected cases and deaths. However, the confirmed infected cases of COVID‐19 and deaths were accurately modeled by ARIMA (3, 2, 2) and SARIMA (1,2,2)(0,0,2)7, respectively. These models produced the least values of MAPE, MAE, and RMSE (0.33, 3,906.5, 5,547.78) and (0.06, 13.76, 15.76), respectively. The prediction of these best models is presented graphically in Figure 6 for the daily number of cumulative CIC and deaths due to COVID‐19 in Bulgaria, Greece, and Russia, where partial lockdown was imposed.
FIGURE 6.
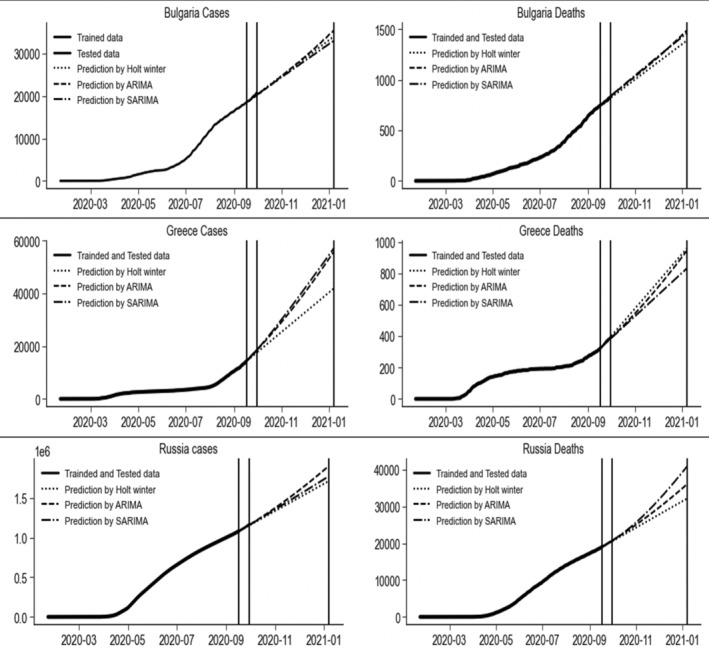
Prediction with three best models of the daily number of cumulative confirmed infected cases and deaths due to COVID‐19 in Bulgaria, Greece, and Russia, where partial lockdown was imposed
The strategy of complete lockdown was imposed in Hubei (China), Iran, and India. The data sets of these countries were modeled by the nine techniques and the results reported in Table 2. The best three models for the Hubei (China) data sets, according to the MAPE, MAE, and RMSE were DTs, RF, and KNN models. These models completely captured the data trend and predicted 100% accurate results of the daily number of CIC and deaths based on past data. The Holt's winter and SARIMA (1,2,1)(1,0,1)7 were the optimal models for forecasting the amount of daily CIC and deaths in Iran. For the Indian data sets, Holt's winter models were considered the best models for forecasting daily CIC and deaths. The future prediction of these countries is sketched in Figure 7 by the best three models.
FIGURE 7.
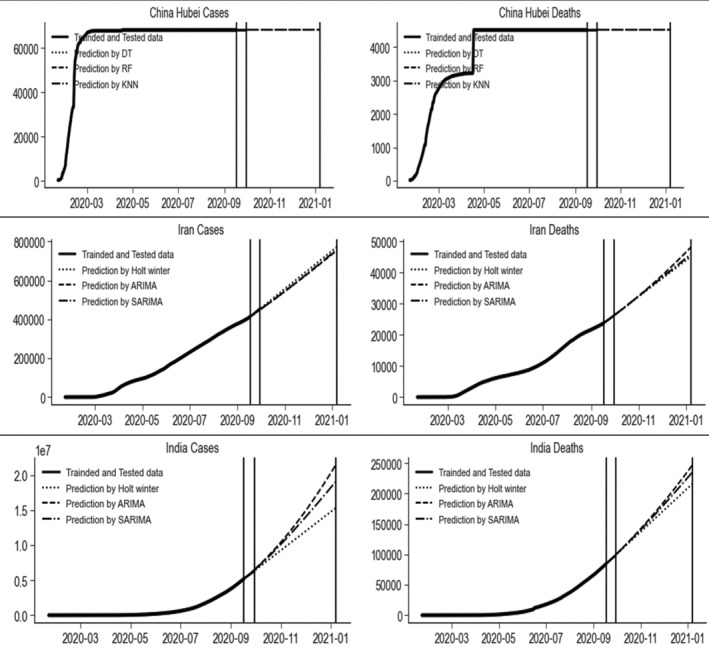
Prediction with three best models of the daily number of cumulative confirmed infected cases and deaths due to COVID‐19 in Hubei (China), Iran, and India, where complete lockdown imposed
Different models produced optimal results for both CIC and deaths for different countries' data sets in the Herd lockdown type. The best values of the three models were bolded in Table 3. In the top three models, the SVR, ARIMA, and SARIMA models are considered best for Iceland confirmed cases. As the MAPE, MAE and RMSE for daily confirmed cases of SVR, ARIMA (3, 2, 2) and SARIMA (2, 2, 2) (0, 0, 1)7 were (6.71, 7.40, 7.49), (173.88, 190.30, 192.93) and (203.87, 212.45, 216.84), respectively. The DTs, RF, and KNN models were accurately modeled the number of deaths with zero error. In Netherland, Holt's winter and ARIMA (3, 2, 2) were selected best models for forecasting the amount of daily CIC and deaths. Whereas, SARIMA (2, 2, 2) (1, 0, 1)7 and SARIMA (1, 2, 2) (2, 0, 0)7 were the best models for forecasting the amount of daily CIC and deaths, respectively. The MAPE values of for Netherland daily CIC and deaths for the best models were (3.89, 3.49, 2.07) and (0.65, 0.60, 0.53), MAE values were (4,265.77, 3,845.05, 2,297.04) and (41.78, 38.59, 34.03) and RMSE were (5,347.75, 4,967.90, 3,144.86) and (54.87, 51.96, 47.01), respectively. The Holt's winter, ARIMA (3, 2, 2) and SARIMA (0, 2, 2) (1, 0, 1)7 were select best models for forecasting the amount of daily confirmed cases in Sweden whereas DT, GBR, and KNN for deaths. The MAPE, MAE and RMSE for daily confirmed cases of Holt's winter, ARIMA (3, 2, 2) and SARIMA (0, 2, 2) (1, 0, 1)7 were (0.82, 0.71, 0.39), (741.17, 650.78, 354.67) and (855.84, 813.43, 456.47), respectively. The MAPE, MAE and RMSE for Sweden deaths for DT, GBR and KNN were (0.20, 0.23, 0.236), (11.92, 13.89, 13.92) and (14.98, 16.59, 16.62), respectively. The prediction by these models and these countries where herd lockdown strategy was imposed was presented graphically in Figure 8.
FIGURE 8.
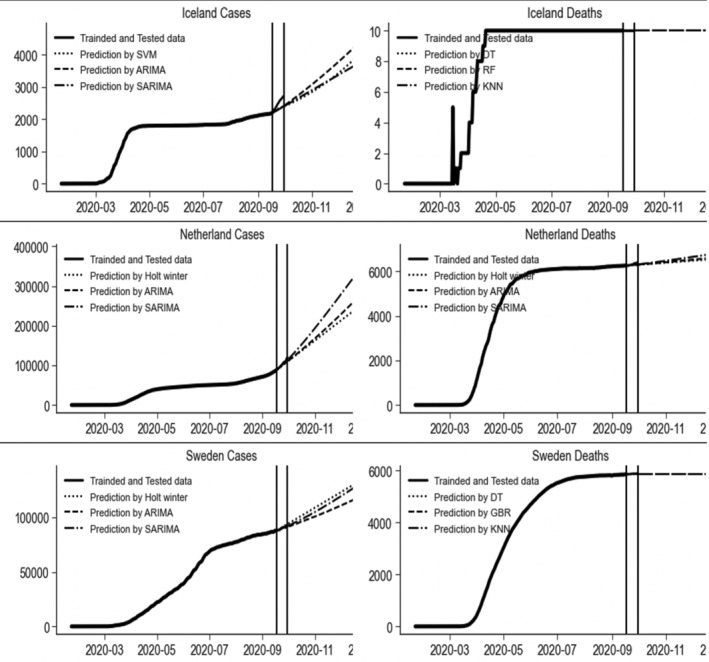
Prediction with three best models of the daily number of cumulative confirmed infected cases and deaths due to COVID‐19 in Iceland, Netherland, and Sweden, where herd lockdown imposed
5.1. Multistep ahead forecasting
The accurate models capable of predicting cumulative CIC and deaths efficiently and the proposed models were also used for out‐of‐sample forecasting to further illustrate the models' efficiency. The out‐of‐sample forecasting results were figured for multistep head from October 1, 2020, to October 10, 2020, compared with the actual values of CIC and deaths as presented in Table 4. The comparison indicated that the proposed models fulfilled all the evaluation criteria.
TABLE 4.
The averages and standard deviations of the out‐of‐sample forecasted values from October 1, 2020 to October 10, 2020, with the best selected model for each country
| Lockdown types | Country | Model | Average forecasted values (October 1 to October 10) | Average actual values (October 1 to October 10) | SD of forecasted values (October 1 to October 10) | SD of actual values (October 1 to October 10) | |
|---|---|---|---|---|---|---|---|
| Daily number of confirmed cases | |||||||
| Partial | Bulgaria | Holt winter | 21,068.21 | 22,364.2 | 419.565 | 1,154.95 | |
| Greece | SARIMA | 20,403.24 | 20,454.8 | 1,050.33 | 1,072.37 | ||
| Russia | ARIMA | 1,192,959 | 1,226,702 | 19,193.6 | 33,236.9 | ||
| Complete | Hubei | DT, RF, KNN | 68,139. | 68,139.0 | 0.00000 | 0.00000 | |
| Iran | Holt winter | 471,780.2 | 478,174.1 | 9,701.03 | 11,976.1 | ||
| India | Holt winter | 6,874,084 | 6,725,805 | 272,790 | 219,685 | ||
| Herd | Iceland | SVR | 2,465.534 | 3,070.4 | 37.7329 | 240.709 | |
| Netherland | SARIMA | 125,992.2 | 143,655 | 7,024.40 | 14,957.7 | ||
| Sweden | SARIMA | 93,869.75 | 95,800.3 | 1,116.77 | 1883.34 | ||
| Daily number of confirmed deaths | |||||||
| Partial | Bulgaria | Holt winter | 851.5456 | 859.5 | 17.2964 | 22.6629 | |
| Greece | Holt winter | 426.1323 | 416.3 | 17.4140 | 14.6215 | ||
| Russia | SARIMA | 21,381.99 | 21,528.6 | 425.639 | 506.402 | ||
| Complete | Hubei | DT, RF, KNN | 4,512 | 4,512 | 0.00000 | 0.00000 | |
| Iran | SARIMA | 27,296.69 | 27,319.8 | 578.550 | 660.548 | ||
| India | Holt winter | 106,064.8 | 104,097.2 | 3,558.89 | 2,864.92 | ||
| Herd | Iceland | DT, RF, KNN | 10 | 10 | 0.00000 | 0.00000 | |
| Netherland | SARIMA | 6,341.134 | 6,484.6 | 14.2624 | 51.8977 | ||
| Sweden | DT | 5,864 | 5,892.8 | 0.000 | 3.64539 | ||
6. CONCLUSION
In this paper, time‐series models named Holt's Winter, ARIMA, SARIMA and machine learning approach named RFs, KNN, SVR, DTs, polynomial regression and GBR approach were employed in the task of modeling. Ten‐days‐ahead forecasting of COVID‐19 performed for cumulative CIC and deaths in Bulgaria, Greece, Russia, Hubei (China), Iran, India, Iceland, Netherland and Sweden under different lockdown policies. The MAPE, MAE, and RMSE criteria were used to evaluate the performance of the compared approaches. It is impossible to recommend a single approach to model and forecasting for all data sets in respect of obtained results. As the different data sets exhibited different trends depending upon size, nature and type of lockdown. The optimized model for each data set was used to forecast 10‐day‐ahead cases and obtained the results very close to the actual values. Further, it is observed that the herd lockdown strategy is the best policy to control COVID‐19 cases and deaths.
ETHICAL APPROVAL
No experiments are conducted on animals or humans.
CONFLICT OF INTEREST
Authors declare that they have no competing interests.
ACKNOWLEDGMENT
This work was supported by the research project “Total lockdown or herd immunity or fusion of both: use of machine learning‐based applications to assess the impact of different policies during COVID‐19 pandemic‐case studies of benchmark countries; Prince Sultan University, Riyadh Saudi Arabia [COVID19‐CCIS‐2020{52}]”. The authors are thankful for the support.
Saba T, Abunadi I, Shahzad MN, Khan AR. Machine learning techniques to detect and forecast the daily total COVID‐19 infected and deaths cases under different lockdown types. Microsc Res Tech. 2021;84:1462–1474. 10.1002/jemt.23702
Review Editor: Alberto Diaspro
Funding information Prince Sultan University, Grant/Award Number: COVID19‐CCIS‐2020[52]
DATA AVAILABILITY STATEMENT
The data that support the findings of this study are openly available in [CSSEGISandData] at [https://github.com/CSSEGISandData?tab=repositories]
REFERENCES
- Al‐Ameen, Z. , Sulong, G. , Rehman, A. , Al‐Dhelaan, A. , Saba, T. , & Al‐Rodhaan, M. (2015). An innovative technique for contrast enhancement of computed tomography images using normalized gamma‐corrected contrast‐limited adaptive histogram equalization. EURASIP Journal on Advances in Signal Processing, 2015, 32. 10.1186/s13634-015-0214-1 [DOI] [Google Scholar]
- Azuaje, F. (2003). Genomic data sampling and its effect on classification performance assessment. BMC Bioinformatics, 4, 5. [DOI] [PMC free article] [PubMed] [Google Scholar]
- Bandyopadhyay, S. K. , & Dutta, S. (2020). Machine learning approach for confirmation of COVID‐19 cases: Positive, negative, death and release. medRxiv.
- Breiman, L. (2001). Random forests. Machine Learning, 45, 5–32. [Google Scholar]
- Chatfield, C. , & Yar, M. (1988). Holt‐winters forecasting: Some practical issues. Journal of the Royal Statistical Society Series D (The Statistician), 37, 129–140. [Google Scholar]
- Chung, E. , & Rosalion, N. (2001). Short term traffic flow prediction. Proceeding: 24th Australian Transportation Research Forum, Australia: Hobart, Tasmania.
- da Silva, R.G., Ribeiro, M.H.D.M., Mariani, V.C. & dos Santos Coelho, L. (2020). Forecasting Brazilian and American COVID‐19 cases based on artificial intelligence coupled with climatic exogenous variables. Chaos, Solitons & Fractals, 139, 1–13. [DOI] [PMC free article] [PubMed] [Google Scholar]
- Huang, C. J. , Chen, Y. H. , Ma, Y. , & Kuo, P. H. (2020). Multiple‐input deep convolutional neural network model for COVID‐19 forecasting in China. MedRxiv. 1–16. 10.1101/2020.03.23.20041608 [DOI] [Google Scholar]
- Jamal, A. , Hazim Alkawaz, M. , Rehman, A. , & Saba, T. (2017). Retinal imaging analysis based on vessel detection. Microscopy Research and Technique, 80(17), 799–811. [DOI] [PubMed] [Google Scholar]
- Khan, S. A. , Nazir, M. , Khan, M. A. , Saba, T. , Javed, K. , Rehman, A. , … Awais, M. (2019). Lungs nodule detection framework from computed tomography images using support vector machine. Microscopy Research and Technique, 82(8), 1256–1266. [DOI] [PubMed] [Google Scholar]
- Khan, M. A. , Sharif, M. , Akram, T. , Raza, M. , Saba, T. , & Rehman, A. (2020). Hand‐crafted and deep convolutional neural network features fusion and selection strategy: An application to intelligent human action recognition. Applied Soft Computing, 87, 105986. 10.1016/j.asoc.2019.105986 [DOI] [Google Scholar]
- Khan, M. A. , Kadry, S. , Zhang, Y. D. , Akram, T. , Sharif, M. , Rehman, A. , & Saba, T. (2021). Prediction of COVID‐19 ‐ pneumonia based on selected deep features and one class kernel extreme learning machine. Computers & Electrical Engineering, 90, 106960. [DOI] [PMC free article] [PubMed] [Google Scholar]
- Kuznetsova, N. , Westenberg, M. , Buchin, K. , Dinkla, K. , & van den Elzen, S. J. (2014). Random Forest Visualization (pp. 37–45), Eindhoven Netherlands: Eindhoven University of Technology. https://wiley.eproofing.in/Proof.aspx?token=f08237b578834b6f8ccf15a96187dd35060754639#com1 [Google Scholar]
- Li, Q. , & Chan, M. F. (2017). Predictive time‐series modeling using artificial neural networks for Linac beam symmetry: An empirical study. Annals of the New York Academy of Sciences, 1387, 84–94. [DOI] [PMC free article] [PubMed] [Google Scholar]
- Long, J.B., & Ehrenfeld, J.M. (2020). The role of augmented intelligence (ai) in detecting and preventing the spread of novel coronavirus. J Med Syst 44, 59. 10.1007/s10916-020-1536-6 [DOI] [PMC free article] [PubMed] [Google Scholar]
- Lung, J. W. J. , Salam, M. S. H. , Rehman, A. , Rahim, M. S. M. , & Saba, T. (2014). Fuzzy phoneme classification using multi‐speaker vocal tract length normalization. IETE Technical Review, 31(2), 128–136. 10.1080/02564602.2014.892669 [DOI] [Google Scholar]
- Mashood Nasir, I., Attique Khan, M., Alhaisoni, M., Saba, T., Rehman, A., & Iqbal, T. (2020). A hybrid deep learning architecture for the classification of superhero fashion products: an application for medical‐tech classification. Computer Modeling in Engineering & Sciences, 124(3), 1017–1033. [Google Scholar]
- Mughal, B. , Muhammad, N. , Sharif, M. , Rehman, A. , & Saba, T. (2018). Removal of pectoral muscle based on topographic map and shape‐shifting silhouette. BMC Cancer, 18(1), 1–14. [DOI] [PMC free article] [PubMed] [Google Scholar]
- Mughal, B. , Sharif, M. , Muhammad, N. , & Saba, T. (2018). A novel classification scheme to decline the mortality rate among women due to breast tumor. Microscopy Research and Technique, 81(2), 171–180. [DOI] [PubMed] [Google Scholar]
- Nodehi, A. , Sulong, G. , Al‐Rodhaan, M. , Al‐Dhelaan, A. , Rehman, A. , & Saba, T. (2014). Intelligent fuzzy approach for fast fractal image compression. EURASIP Journal on Advances in Signal Processing, 2014(1), 112. 10.1186/1687-6180-2014-112 [DOI] [Google Scholar]
- Parbat, D. , & Chakraborty, M. (2020). A python based support vector regression model for prediction of COVID19 cases in India. Chaos, Solitons & Fractals, 138, 109942. [DOI] [PMC free article] [PubMed] [Google Scholar]
- Perveen, S. , Shahbaz, M. , Saba, T. , Keshavjee, K. , Rehman, A. , & Guergachi, A. (2020). Handling irregularly sampled longitudinal data and prognostic modeling of diabetes using machine learning technique. IEEE Access, 8, 21875–21885. [Google Scholar]
- Phetchanchai, C. , Selamat, A. , Saba, T. , & Rehman, A. (2010). Index financial time series based on zigzag‐perceptually important points. Journal of Computer Science, 6(12), 1389–1395. 10.3844/jcssp.2010.1389.1395 [DOI] [Google Scholar]
- Rad, A. E. , Rahim, M. S. M. , Rehman, A. , & Saba, T. (2016). Digital dental X‐ray database for caries screening. 3D Research, 7(2), 1–5. 10.1007/s13319-016-0096-5 [DOI] [Google Scholar]
- Rehman, A. , Abbas, N. , Saba, T. , Mahmood, T. , & Kolivand, H. (2018). Rouleaux red blood cells splitting in microscopic thin blood smear images via local maxima, circles drawing, and mapping with original RBCs. Microscopic Research and Technique, 81(7), 737–744. 10.1002/jemt.23030 [DOI] [PubMed] [Google Scholar]
- Rehman, A. , Khan, M. A. , Mehmood, Z. , Saba, T. , Sardaraz, M. , & Rashid, M. (2020). Microscopic melanoma detection and classification: A framework of pixel‐based fusion and multilevel features reduction. Microscopy Research and Technique, 83(4), 410–423. 10.1002/jemt.23429 [DOI] [PubMed] [Google Scholar]
- Rehman, A. (2020. November). Ulcer Recognition based on 6‐Layers Deep Convolutional Neural Network. In Proceedings of the 2020 9th International Conference on Software and Information Engineering (ICSIE) (pp. 97–101). Cairo Egypt.
- Rehman, A. (2021). Light microscopic iris classification using ensemble multi‐class support vector machine, Microscopic research & Technique, 10.1002/jemt.23659 [DOI] [PubMed]
- Rehman, A. , Khan, M. A. , Saba, T. , Mehmood, Z. , Tariq, U. , & Ayesha, N. (2021a). Microscopic brain tumor detection and classification using 3D CNN and feature selection architecture. Microscopy Research and Technique, 84(1), 133–149. 10.1002/jemt.23597 [DOI] [PubMed] [Google Scholar]
- Rehman, A., Sadad, T. Saba, T., Hussain A., & Tariq, U. (2021b) Real‐Time diagnosis system of COVID‐19 using x‐ray images and deep learning, IEEE IT Professional, 10.1109/MITP.2020.3042379 [DOI] [PMC free article] [PubMed]
- Rehman, A. Saba, T., Ayesha N., Tariq, U. (2021c) Deep learning‐based COVID‐19 Detection using CT and X‐ray Images: Current Analytics and Comparisons, IEEE IT Professional, 10.1109/MITP.2020.3036820 [DOI] [PMC free article] [PubMed]
- Ribeiro, M. H. D. M. , da Silva, R. G. , Mariani, V. C. , & dos Santos Coelho, L. (2020). Short‐term forecasting COVID‐19 cumulative confirmed cases: Perspectives for Brazil. Chaos, Solitons & Fractals. 135, 1–10. [DOI] [PMC free article] [PubMed] [Google Scholar]
- Saba, T. (2021). Computer vision for microscopic skin cancer diagnosis using handcrafted and non‐handcrafted features. Microscopy Research and Technique. 10.1002/jemt.23686 [DOI] [PubMed]
- Saba, T. , Mohamed, A. S. , El‐Affendi, M. , Amin, J. , & Sharif, M. (2020). Brain tumor detection using fusion of hand crafted and deep learning features. Cognitive Systems Research, 59, 221–230. [Google Scholar]
- Saba, T. , Bokhari, S. T. F. , Sharif, M. , Yasmin, M. , & Raza, M. (2018). Fundus image classification methods for the detection of glaucoma: A review. Microscopy Research and Technique, 81(10), 1105–1121. [DOI] [PubMed] [Google Scholar]
- Saba, T. , Haseeb, K. , Ahmed, I. , & Rehman, A. (2020). Secure and energy‐efficient framework using internet of medical things for e‐healthcare. Journal of Infection and Public Health, 13(10), 1567–1575. [DOI] [PMC free article] [PubMed] [Google Scholar]
- Saba, T. , Khan, S. U. , Islam, N. , Abbas, N. , Rehman, A. , Javaid, N. , & Anjum, A. (2019). Cloud‐based decision support system for the detection and classification of malignant cells in breast cancer using breast cytology images. Microscopy Research and Technique, 82(6), 775–785. [DOI] [PubMed] [Google Scholar]
- Sadad, T. , Munir, A. , Saba, T. , & Hussain, A. (2018). Fuzzy C‐means and region growing based classification of tumor from mammograms using hybrid texture feature. Journal of Computational Science, 29, 34–45. [Google Scholar]
- Sadad, T., Rehman, A., Munir, A., Saba, T., Tariq, U., Ayesha, N., & Abbasi, R. (2021). Brain tumor detection and multi‐classification using advanced deep learning techniques. Microscopy Research and Technique, 10.1002/jemt.23688 [DOI] [PubMed]
- Sun, B. , Liu, H. , Zhou, S. , & Li, W. (2014). Evaluating the performance of polynomial regression method with different parameters during color characterization. Mathematical Problems in Engineering, 1–8. [Google Scholar]
- Szeto, W. Y. , Ghosh, B. , Basu, B. , & Mahony, M. O. (2009). Multivariate traffic forecasting technique using cell transmission model and SARIMA model. Journal of Transportation Engineering, 135, 658–667. [Google Scholar]
- Tso, G. K. , & Yau, K. K. (2007). Predicting electricity energy consumption: A comparison of regression analysis, decision tree and neural networks. Energy, 32, 1761–1768. [Google Scholar]
- Ullah, H. , Saba, T. , Islam, N. , Abbas, N. , Rehman, A. , Mehmood, Z. , & Anjum, A. (2019). An ensemble classification of exudates in color fundus images using an evolutionary algorithm based optimal features selection. Microscopy Research and Technique, 82(4), 361–372. [DOI] [PubMed] [Google Scholar]
- Waheed, S. R. , Alkawaz, M. H. , Rehman, A. , Almazyad, A. S. , & Saba, T. (2016). Multifocus watermarking approach based on discrete cosine transform. Microscopy Research and Technique, 79(5), 431–437. 10.1002/jemt.22646 [DOI] [PubMed] [Google Scholar]
- Yousaf, K. , Mehmood, Z. , Awan, I. A. , Saba, T. , Alharbey, R. , Qadah, T. , & Alrige, M. A. (2020). A comprehensive study of mobile‐health based assistive technology for the healthcare of dementia and Alzheimer's disease (AD). Health Care Management Science, 23, 287–309. [DOI] [PubMed] [Google Scholar]
Associated Data
This section collects any data citations, data availability statements, or supplementary materials included in this article.
Data Availability Statement
The data that support the findings of this study are openly available in [CSSEGISandData] at [https://github.com/CSSEGISandData?tab=repositories]


