

ABSTRACT
Objectives
Physicians’ gestalt is central in the diagnostic pipeline of suspected COVID‐19, due to the absence of a single tool allowing conclusive rule in or rule out. The aim of this study was to estimate the diagnostic test characteristics of physician's gestalt for COVID‐19 in the emergency department (ED), based on clinical findings or on a combination of clinical findings and bedside imaging results.
Methods
From April 1 to April 30, 2020, patients with suspected COVID‐19 were prospectively enrolled in two EDs. Physicians prospectively dichotomized patients in COVID‐19 likely or unlikely twice: after medical evaluation of clinical features (clinical gestalt [CG]) and after evaluation of clinical features and results of lung ultrasound or chest x‐ray (clinical and bedside imaging–integrated gestalt [CBIIG]). The final diagnosis was adjudicated after independent review of 30‐day follow‐up data.
Results
Among 838 ED enrolled patients, 193 (23%) were finally diagnosed with COVID‐19. The area under the curve (AUC), sensitivity, and specificity of CG and CBIIG for COVID‐19 were 80.8% and 91.6% (p < 0.01), 82.9% and 91.4% (p = 0.01), and 78.6% and 91.8% (p < 0.01), respectively. CBIIG had similar AUC and sensitivity to reverse transcription–polymerase chain reaction (RT‐PCR) for SARS‐CoV‐2 on the first nasopharyngeal swab per se (93.5%, p = 0.24; and 87%, p = 0.17, respectively). CBIIG plus RT‐PCR had a sensitivity of 98.4% for COVID‐19 (p < 0.01 vs. RT‐PCR alone) compared to 95.9% for CG plus RT‐PCR (p = 0.05).
Conclusions
In suspected COVID‐19, CG and CBIIG have fair diagnostic accuracy, in line with physicians’ gestalt for other acute conditions. Negative RT‐PCR plus low probability based on CBIIG can rule out COVID‐19 with a relatively low number of false‐negative cases.
Keywords: COVID‐19, diagnosis, emergency department, gestalt, lung ultrasound chest x‐ray
INTRODUCTION
A single test for conclusive diagnosis of coronavirus disease 19 (COVID‐19) is currently unavailable. Patient's medical history, signs, symptoms, physical examination, and routine laboratory findings per se are largely inaccurate. 1 Reverse transcription–polymerase chain reaction (RT‐PCR) for severe acute respiratory syndrome coronavirus‐2 (SARS‐CoV‐2) on a nasopharyngeal swab, representing the key microbiological tool, can give false‐negative results with the need of repeating the test after days. 1 , 2 , 3 , 4 Bedside diagnostic imaging tests, represented by lung ultrasound (LUS) and chest x‐ray (CXR), share some advantages such as low cost, large availability, rapid bedside performance, and adaptability to local facilities (e.g., triage, low, high intensity, isolation ED areas, and hospital wards). However, both LUS and CXR are unsuitable per se for conclusive diagnosis. 5 , 6 , 7 , 8
In this challenging scenario, physicians’ gestalt is the pivot player orchestrating and integrating the other diagnostic tools. The aim of this study was to formally evaluate the diagnostic testing characteristics of physicians’ gestalt for COVID‐19, within a standard ED diagnostic pipeline.
METHODS
Study design and setting
This was an observational, prospective bicentric diagnostic study approved by the ethical committees of the involved hospitals. Informed consent was obtained from study patients.
Selection of participants
Consecutive patients presenting to the EDs of two Italian university hospitals (one in northern and one in central Italy) were enrolled from April 1 to April 30, 2020. Inclusion criteria were: 1) age ≥ 18 years; 2) presence of any sign or symptom for COVID‐19 (declared or found at ED triage) among cough, fever (temperature > 37.5°C), pharyngodynia, dyspnea, oxygen saturation ≤ 94% in room air, respiratory rate ≥ 20 breaths/min, need of additional oxygen or ventilation, close contact with a suspected or confirmed COVID‐19 case; and 3) first ED evaluation during the study period. Exclusion criteria were: 1) known diagnosis of COVID‐19, 2) patient's loss at follow‐up after ED discharge with a negative RT‐PCR test result, and 3) patient's refusal to participate in the study.
Management of enrolled patients
Since February 2020, patients with predefined risk factors for COVID‐19 detected by a pretriage nurse using standardized assessment were assigned to a dedicated ED area. Study patients were evaluated by one or more ED physicians (staff or in training physicians). Before the study was started, participating physicians were exposed to COVID‐19 cases for more than 30 days. All physicians were instructed regarding COVID‐19 signs and symptoms and LUS and CXR signs. RT‐PCR for SARS‐CoV‐2 on a nasopharyngeal swab was performed in all cases of suspected COVID‐19. The results of RT‐PCR were available on average within 6 hours from the request. Bedside diagnostic imaging (LUS and CXR) was performed at the discretion of the physicians, with CXR representing the standard reference imaging modality per local protocol.
Bedside imaging
Lung ultrasound was performed by the physician after his clinical evaluation, with the aim of detecting unilateral or bilateral interstitial syndrome, consolidations, and pleural effusion. All the above‐mentioned findings were defined and diagnosed according to international recommendations on point‐of‐care LUS. 9 All physicians performing LUS had completed an ultrasound training course accredited by the Italian Society of Emergency Medicine or a similar hospital course and had performed at least 40 LUS examinations before starting the study. 10 CXR was performed by a radiology technician at the patient's bedside and interpreted by physicians. If both LUS and CXR were executed, LUS was performed before CXR.
Physicians’ gestalt
The physicians were asked to dichotomize patients in COVID‐19 likely or unlikely twice during the index visit. The first gestalt adjudication (clinical gestalt [CG]) was made immediately after a medical visit encompassing full medical history, vital sign assessment (body temperature, blood pressure, heart rate, oxygen saturation, respiratory rate), physical examination, electrocardiogram, and blood gas analysis (at the physician's discretion). The second gestalt adjudication, indicated as clinical and bedside imaging–integrated gestalt (CBIIG), was made after availability of bedside imaging with LUS or CXR. In a subgroup of patients, independent gestalt adjudication by a second physician was used to evaluate interobserver agreement.
Case adjudication
Final case adjudication was performed by two expert physicians who independently assessed all patients’ data, including RT‐PCR test results on any respiratory specimen (including bronchoalveolar lavage), medical charts of ED visit(s) and hospital admission(s), laboratory test results, all imaging data (comprehensive of computed tomography) obtained within 30 days from the index visit, and results of 30‐day follow‐up. The 30‐day follow‐up data collection included: 1) results of a structured telephone interview performed by physicians specialized in emergency medicine, evaluating subsequent medical diagnoses and RT‐PCR tests, potential COVID‐19 transmission to contacts after the ED presentation, new ED visit(s), and hospital admission(s) and 2) local hospital database search for additional ED visit(s) and hospital admission(s). Adjudication was dichotomic: COVID‐19 present or absent (alternative diagnosis). COVID‐19 was always considered present in patients with a positive RT‐PCR test result obtained within 5 days from ED presentation. In the other patients, the final diagnosis was established considering all follow‐up data. Presence of suggestive symptoms plus chest imaging of acute interstitial lung disease, in the absence of an alternative diagnosis, was considered diagnostic of COVID‐19. In case of discordant adjudication among the two experts, a third expert adjudicated the final diagnosis.
Data analysis
We aimed at including enough patients to provide accurate estimates of the physician's gestalt for COVID‐19. In the absence of previous data, the study was powered to test the null hypothesis that the diagnostic accuracy of the physicians gestalt for COVID‐19 is 80%, as previously reported for pneumonia, and exceeds 70%, assuming a prevalence of 25% of COVID‐19 among suspected patients. 11 Using a type I error of 0.025 (α‐level, two‐sided) and type II error (β‐level) of 0.1, we estimated that at least 468 needed patients to be included.
Descriptive results are presented as median and interquartile range (IQR) for continuous data or as number and percentage for ordinal data, as appropriate. The diagnostic accuracy was calculated using sensitivity, specificity, positive and negative predictive values, positive and negative likelihood ratios (LR+ and LR–), and area under the receiver operating characteristics curve (AUC).
Differences in diagnostic accuracy values were compared with the McNemar test for paired data. Different AUC values were compared with a nonparametric approach with generalized U‐statistics. 12 A Fagan nomogram was used to visualize the effect of diagnostic evaluation on posttest disease probability. Interobserver agreement was evaluated with Cohen's kappa. 13 A p‐value of <0.05 indicated statistical significance. All p‐values were two‐sided. The statistical analysis was performed with Stata statistical package, version 13.1 (StataCorp, College Station, TX, USA).
RESULTS
Study patients
During the study period, 857 patients with suspected COVID‐19 were evaluated in the participating EDs; 19 (2.2%) patients were excluded, with 10 (1.2%) patients lost at follow‐up, and 838 patients were included in the subsequent analyses (Figure 1). The median age was 70 years (IQR = 32.9 years), and 418 (49.9%) patients were women. Within 193 (23%) patients with adjudicated COVID‐19, 168 had a positive RT‐PCR test result on the nasopharyngeal swab collected in the ED, 22 had a negative initial RT‐PCR test and a subsequent positive RT‐PCR test within 5 days, and three had clinically adjudicated COVID‐19. In seven patients, the final diagnosis was established by a third reviewer, due to disagreement among the other two reviewers. The clinical characteristics of enrolled patients, hospital admission, and 30‐day mortality are reported in Tables 1 and 2. The diagnostic accuracy of single signs, symptoms, and medical history findings for COVID‐19 are presented in Data Supplement S1, Table S1 (available as supporting information in the online version of this paper, which is available at http://onlinelibrary.wiley.com/doi/10.1111/acem.14232/full). The highest sensitivity was found for fever (77.2%, specificity 58.6%), and the highest specificity, for anosmia (98.8%, sensitivity 6.3%).
FIGURE 1.
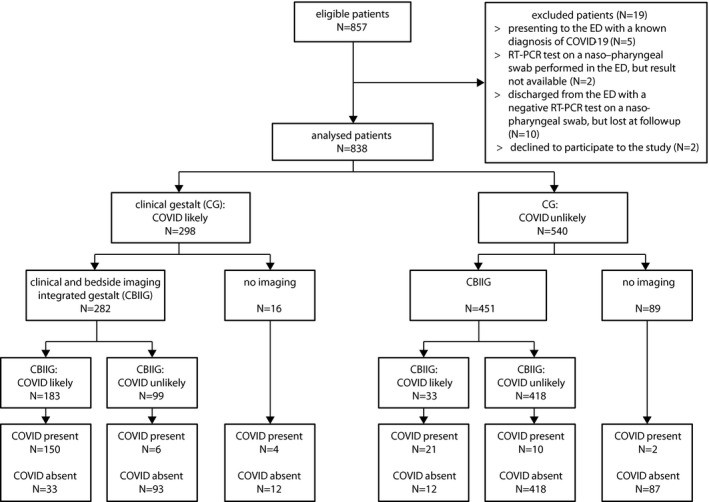
Flow diagram of the study. % values refer to N = 838 analyzed patients. CBIIG, clinical and bedside imaging–integrated gestalt; RT‐PCR, reverse transcription–polymerase chain reaction
TABLE 1.
Clinical features of study patients
|
Total (N = 838) |
COVID‐19 (n = 193) |
Alternative diagnosis (n = 645) |
p‐value | |
|---|---|---|---|---|
| Demographics | ||||
| Age (years), median (IQR) | 70 (32.8) | 69 (33.1) | 70 (33) | 0.68 |
| Gender female | 418 (49.9) | 92 (47.7) | 326 (50.5) | 0.52 |
| Presenting signs/symptoms | ||||
| Fever | 395 (47.1) | 148 (76.7) | 247 (38.3) | <0.01 |
| Cough | 224 (26.7) | 82 (42.5) | 142 (22) | <0.01 |
| Pharyngodynia | 48 (5.7) | 6 (3.1) | 42 (6.5) | 0.07 |
| Dyspnea | 331 (39.5) | 94 (48.7) | 237 (36.7) | <0.01 |
| Anosmia | 19 (2.3) | 12 (6.2) | 7 (1) | <0.01 |
| Ageusia | 26 (3.1) | 16 (8.3) | 10 (1.5) | <0.01 |
| Fatigue | 114 (13.6) | 32 (16.6) | 82 (12.7) | 0.17 |
| Diarrhea | 93 (11.1) | 23 (11.9) | 70 (10.8) | 0.67 |
| Symptom duration (days), median (IQR) | 3 (6) | 4 (5) | 3 (5) | 0.01 |
| Vital signs | ||||
| Systolic blood pressure (mmHg), median (IQR) | 130 (30) | 130 (21) | 130 (30) | 1 |
| Diastolic blood pressure (mmHg), median (IQR) | 78 (15) | 75 (14) | 78 (15) | 0.01 |
| Pulse rate (beats/min) | 86 (25) | 88 (20) | 85 (27) | 0.15 |
| Temperature (°C) | 36.3 (1) | 36.6 (1.4) | 36.3 (0.7) | <0.01 |
| Respiratory rate (breaths/min) | 18 (8) | 20 (7) | 18 (4) | <0.01 |
| Need of oxygen supplementation or ventilation | 234 (27.9) | 71 (36.8) | 163 (25.3) | <0.01 |
| Clinical findings | ||||
| ECG performed, No. of pts | 760 (90.7) | 154 (79.8) | 606 (94) | <0.01 |
| ECG signs of ischemia | 30 (3.6) | 8 (4.1) | 22 (3.4) | 0.64 |
| Atrial fibrillation | 59 (7) | 13 (6.7) | 46 (7.1) | 0.84 |
| Blood gas analysis, (No. of pts) | 604 (72.1) | 172 (89.1) | 432 (67) | <0.01 |
| pH | 7.44 (0.1) | 7.46 (0.1) | 7.44 (0.1) | 0.01 |
| Horowitz (PaO2/FiO2) | 304.8 (190.5) | 195.2 (173.3) | 333.3 (153) | <0.01 |
| Lactate level | 1.1 (0.9) | 1.1 (1) | 1.1 (0.9) | 1 |
| Medical history | ||||
| Hypertension | 388 (46.3) | 90 (46.6) | 298 (45.7) | 0.96 |
| Diabetes | 137 (16.3) | 36 (18.6) | 101 (15.6) | 0.32 |
| Coronary artery disease | 121 (14.1) | 35 (18.3) | 86 (13.3) | 0.08 |
| Asthma | 34 (4.1) | 9 (4.7) | 25 (3.9) | 0.62 |
| COPD or other chronic pulmonary disease | 82 (9.8) | 18 (9.3) | 64 (9.9) | 0.8 |
| Chronic renal failure | 50 (6) | 12 (6.2) | 38 (5.9) | 0.88 |
| Active cancer | 131 (15.6) | 24 (12.4) | 107 (16.7) | 0.15 |
| Smoking habit | 69 (8.2) | 10 (5.2) | 59 (9.1) | 0.08 |
Categorical variables are presented as absolute number and percent value (in parentheses).
Abbreviation: COPD, chronic obstructive pulmonary disease; IQR, interquartile range.
TABLE 2.
Hospital admission and 30‐day mortality of enrolled patients classified by final diagnosis
|
Total (N = 838) |
COVID‐19 (n = 193) |
Alternative diagnoses (n = 645) |
p‐value | |
|---|---|---|---|---|
| Hospital admission | 489 (58.3) | 160 (82.9) | 329 (51) | <.01 |
| ED mortality (index visit) | 10 (1.2) | 5 (2.5) | 5 (0.8) | .06 |
| 30‐day mortality | 72 (8.6) | 37 (19.2) | 35 (5.4) | <.01 |
Values are reported as absolute number and percent value (in parentheses).
Bedside imaging
Bedside imaging was obtained for 733 (87.5%) patients: 292 (34.8%) CXR only and 441 (52.6%) CXR and LUS. LUS and CXR findings and associated diagnostic performances are shown in Table 3. The presence of any LUS sign had an AUC of 45% (95% confidence interval [CI] = 40.5% to 49.7%), a sensitivity of 89.7% (95% CI = 83.6% to 94.1%), a specificity of 24.5% (95% CI = 19.9% to 29.6%), a LR+ and a LR– of 1.19 (95% CI = 1.09 to 1.29) and 0.42 (95% CI = 0.25 to 0.7), for diagnosis of COVID‐19. The presence of any CXR sign had an AUC of 66.9% (95% CI = 63.3% to 70.3%), a sensitivity of 62.6% (95% CI = 55.2% to 69.5%), a specificity of 68.3% (95% CI = 64.2% to 72.2%), and a LR+ and a LR– of 1.97 (95% CI = 1.67 to 2.33) and 0.55 (95% CI = 0.45 to 0.67), for diagnosis of COVID‐19.
TABLE 3.
Bedside imaging test results
| COVID‐19 | Alternative diagnosis | Sensitivity % (95% CI) | Specificity % (95% CI) | AUC % (95% CI) | ||
|---|---|---|---|---|---|---|
| LUS | 464 (%) | 146 (%) | 318 (%) | — | — | — |
| Unilateral interstitial syndrome | 197 (42.5) | 106 (72.6) | 91 (28.6) | 72.6 (64.6–79.7.1) | 71.4 (66.1–76.3) | 71.8 (67.4–75.8) |
| Bilateral interstitial syndrome | 151 (32.5) | 97 (66.4) | 54 (17) | 66.4 (58.2–74) | 83 (78.4–87) | 77.8 (73.7–81.5) |
| Unilateral consolidation(s) | 87 (18.8) | 55 (37.7) | 32 (10.1) | 37.7 (29.8–46.1) | 89.9 (86.1–93) | 73.5 (69.2–77.5) |
| Bilateral consolidations | 57 (12.3) | 39 (26.7) | 18 (5.1) | 26.7 (19.7–34.7) | 94.3 (91.2–96.6) | 73.1 (68.8–77.1) |
| Unilateral pleural effusion | 156 (33.6) | 85 (58.2) | 71 (22.3) | 58.2 (48.8–66.3) | 77.7 (72.7–82.1) | 71.6 (67.2–75.6) |
| Bilateral pleural effusion | 52 (11.2) | 8 (5.5) | 44 (13.8) | 5.5 (2.4–10.5) | 86.2 (81.9–89.8) | 60.8 (56.2–65.2) |
| Any LUS sign present | 371 (80) | 131 (89.7) | 240 (75.5) | 89.7 (83.6–94.1) | 24.5 (19.9–29.6) | 45 (45.4–49.7) |
| CXR | 733 (%) | 187 (%) | 546 (%) | — | — | — |
| Monolateral consolidation(s) or ground glass opacity | 93 (12.7) | 41 (21.9) | 52 (9.5) | 21.9 (16.2–28.6) | 90.5 (87.7–92.8) | 73 (69.6–76.2) |
| Bilateral consolidations or ground glass opacity | 199 (27.1) | 77 (41.2) | 122 (22.3) | 41.2 (34.1–48.6) | 77.7 (73.9–81.1) | 68.3 (64.9–71.7) |
| Any CXR sign present | 290 (39.6) | 117 (62.6) | 173 (31.7) | 62.6 (55.2–69.5) | 68.3 (64.2–72.2) | 66.9 (63.3–70.3) |
Abbreviation: LUS, lung ultrasound.
Physicians’ gestalt
Physician's gestalt assessment was obtained from 38 staff physicians in 594 (70.9%) cases and from 22 in‐training physicians in 244 (29.1%) cases. The diagnostic test characteristics of CG and CBIIG are presented in Table 4. When comparing AUCs, CG was significantly more accurate than bedside imaging alone (p < 0.01) and less accurate than RT‐PCR (p < 0.01). CBIIG outperformed CG (p < 0.01) and had similar accuracy to RT‐PCR (p = 0.23), for AUC. CG and CBIIG had sensitivities of 82.9% and 91.6% (p = 0.01) and a specificities of 78.6% and 91.8% (p < 0.01), respectively. The diagnostic test characteristics of CBIIG based on CXR only, or CXR plus LUS, was similar (Table S2).
TABLE 4.
Diagnostic test characteristics associated with the diagnostic pipeline flow for suspected COVID‐19
| Clinical and imaging informed assessment | RT‐PCR informed assessment | |||||
|---|---|---|---|---|---|---|
| CG (n = 838) | Bedside imaging a (n = 733) | CBIIG (n = 733) | RT‐PCR b (n = 838) | RT‐PCR + CG (n = 838) | RT‐PCR + CBIIG (n = 733) | |
| True positive | 160 | 161 | 171 | 168 | 185 | 184 |
| False positive | 138 | 300 | 45 | 0 | 138 | 45 |
| True negative | 507 | 246 | 501 | 645 | 507 | 501 |
| False negative | 33 | 26 | 16 | 25 | 8 | 3 |
| AUC, % (95% CI) | 80.8 (77.7–83.9) | 65.6 (62.3–68.8) | 91.6 (89.3–93.9) | 93.5 (91.1–95.9) | 87.2 (85.1–89.4) | 95.1 (93.6–96.5) |
| Sensitivity, % (95% CI) | 82.9 (76.8–87.9) | 86.1 (80.3–90.7) | 91.4 (86.5–95) | 87 (81.5–91.4) | 95.9 (92–98.2) | 98.4 (95.4–99.7) |
| Specificity, % (95% CI) | 78.6 (75.2–81.7) | 45.1 (40.8–49.3) | 91.8 (89.1–93.9) | 100 | 78.6 (75.2–81.7) | 91.8 (89.1–93.9) |
| PPV, % (95% CI) | 53.7 (47.8–59.5) | 34.9 (30.6–39.5) | 79.2 (73.1–84.4) | 100 | 57.3 (51.7–62.7) | 80.3 (74.6–85.3) |
| NPV, % (95% CI) | 93.9 (91.5–95.8) | 90.4 (86.3–93.7) | 96.9 (95–98.2) | 96.3 (94.5–97.6) | 98.4 (97–99.3) | 99.4 (98.3–99.9) |
| LR+ (95% CI) | 3.87 (3.3–4.55) | 1.6 (1.42–1.72) | 11.1 (8.36–14.7) | — | 4.48 (3.85–5.21) | 11.9 (9.02.15.8) |
| LR– (95% CI) | 0.22 (0.16–0.30) | 0.31 (0.21–0.45) | 0.09 (0.06–0.15) | 0.13 (0.09–019) | 0.05 (0.03–0.10) | 0.02 (0.01–0.05) |
CBIIG, clinical and bedside imaging–integrated gestalt; CG, clinical gestalt; NPV, negative predictive value; PPV, positive predictive value.
Diagnostic criterion: any LUS or CXR sign present.
Performed on the first nasopharyngeal swab obtained in the ED.
The diagnostic test characteristics of CG and CBIIG were similar between staff physicians and in training physicians (Table S3). In a subgroup of 311 patients with independent assessment by two physicians, the CBIIG showed good agreement (Cohen's kappa = 0.63 [95% CI = 0.55 to 0.7]).
Aiming at diagnostic rule out of COVID‐19, the sensitivity of CBIIG (91.4%) was similar to the sensitivity of RT‐PCR alone (87%, p = 0.17). A maximum sensitivity of 98.4% was obtained with CBIIG plus RT‐PCR (p < 0.01 vs. RT‐PCR alone; p = 0.05 vs. CG plus RT‐PCR, 95.9%). In Figure 2, a Fagan nomogram represents the effect of RT‐PCR plus CG or CBIIG on the posttest probability of COVID‐19.
FIGURE 2.
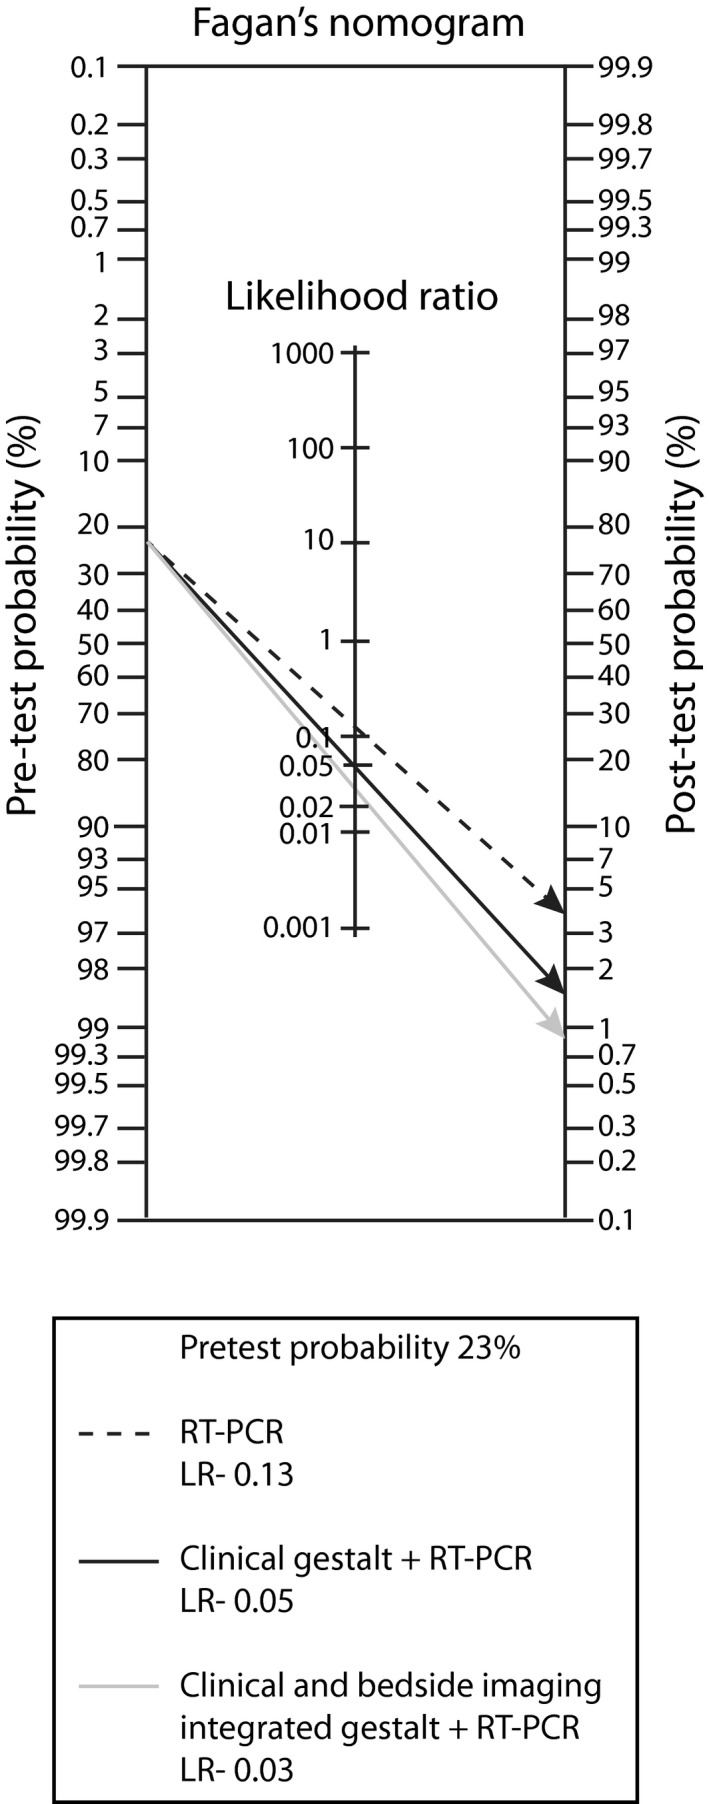
Fagan's nomogram showing the effect of RT‐PCR plus CG, and RT‐PCR plus CBIIG, on the posttest probability of COVID‐19. CBIIG, clinical and bedside imaging–integrated gestalt; CG, clinical gestalt; LR–, negative likelihood ratio; RT‐PCR, reverse transcription–polymerase chain reaction
DISCUSSION
In this study, CG showed fair diagnostic accuracy for COVID‐19. The estimate was in line with CG reported for other acute diseases, such as pneumonia (80%), acute coronary syndromes (75%), decompensated acute heart failure (86%), and pulmonary embolism (81%). 11 , 14 , 15 , 16 Integration of clinical data with bedside imaging test results further increased the diagnostic accuracy of the physician's gestalt. Of note, the overall diagnostic accuracy and sensitivity of CBIIG was similar to that of RT‐PCR for SARS‐CoV‐2 on a nasopharyngeal swab. Interphysician diagnostic agreement was also good, and the diagnostic accuracy of physician's gestalt was similar in young or senior physicians, suggesting external validity.
In this study, CG was more accurate than bedside imaging per se, for diagnosis of COVID‐19. Findings on bedside imaging are in line with previous studies. For CXR, the reported sensitivity for COVID‐19 ranges from 33% to 60%, and the specificity, from 78% to 86%. 17 , 18 , 19 , 20 , 21 , 22 For LUS, results have been heterogeneous. In a small retrospective study enrolling 43 patients, the sensitivity of LUS was 88.9% and specificity was 56.3%. 23
The current results validate previous findings that physicians’ gestalt can be used to reproducibly stratify patients in COVID‐19 likely or unlikely. 24 This judgment is unsuitable for conclusive rule in or out of COVID‐19, but provides meaningful information, especially if bedside imaging is incorporated. Furthermore, in our study, a diagnostic strategy associating CBIIG with a single RT‐PCR test performed in the ED showed a sensitivity of 98%, appropriately ruling out COVID‐19 in more than two‐thirds of suspected patients. Such integrated strategy, providing efficient and sensitive rule out, outperforms single RT‐PCR testing alone and even two serial RT‐PCR tests (78% and 86%, respectively, in the study by Ren et al.). 25 , 26 A similar sensitivity (97%) has been reported by integrating RT‐PCR with chest computed tomography, which, however, is unsuitable as a screening approach. 27 , 28 , 29 , 30 In the above‐mentioned studies, the final diagnosis was established considering serial RT‐PCR test results or combination of RT‐PCR tests with chest CT results or all clinical, laboratory, and diagnostic imaging follow‐up data. 25 , 26 , 27 , 28
LIMITATIONS
First, the study evaluated only ED patients with predefined signs/symptoms, whereas patients with other unspecific, atypical, or mild clinical manifestations were excluded. This may lead to selection bias, potentially causing overestimation of the diagnostic accuracy for physicians’ gestalt. Second, in the absence of a well‐established criterion standard for conclusive diagnosis of COVID‐19, we pragmatically applied a 30‐day follow‐up approach where adjudication was based on expert evaluation of additional RT‐PCR test results and all clinical data (hospitalization and subsequent visits). 31 Yet, it is possible that some cases of COVID‐19 have been missed (e.g., unspecific/mild/atypical forms), potentially skewing results toward increased diagnostic accuracy. Third, since diagnostic imaging bedside tests were not mandatory and were not performed in all recruited patients, milder and atypical cases were less likely to receive imaging, thus producing some degree of differential verification bias. Fourth, the study was conducted during the first COVID‐19 wave in Italy, in a period of strict national lockdown. In this phase, total ED visits substantially declined, visits for alternative diagnoses (e.g., non–COVID‐19 lung diseases, decompensated heart failure) underwent major reduction, and COVID‐19 was a key ED diagnosis. Therefore, the diagnostic accuracy of CG and bedside imaging may change in a context of lower COVID‐19 prevalence, usual ED overcrowding, and wider case mix. Finally, few patients lost at follow‐up were excluded from further analyses, thus potentially introducing a small selection bias.
CONCLUSIONS
Physician's gestalt, especially when informed by both clinical and bedside imaging data, is key for the ED diagnostic pipeline of suspected COVID‐19. When associated with reverse transcription–polymerase chain reaction, clinical and bedside imaging–integrated gestalt allows sensitive rule out, outperforming reverse transcription–polymerase chain reaction testing alone and potentially matching alternative strategies such as multiple reverse transcription–polymerase chain reaction testing or reverse transcription–polymerase chain reaction plus chest computed tomography.
CONFLICT OF INTEREST
The authors have no potential conflicts to disclose.
Supporting information
Data Supplement S1. Supplementary tables.
List of the “ED COVID‐19” Investigators
Elisabetta Catinia, Simona Gualtieria, Barbara Casanovaa, Eleonora De Villaa, Gabriele Cerinia, Enrico Luminia, Manfredi Gaglianoa, Antonio Annovia, Sara Mucaja, Marco Albanesib, Edoardo Caviglib, Chiara Moronib, Vittorio Mieleb, Fillippo Lagic, Alessandra Fanellid, Gian Maria Rossolinid, Lucia Turcoe, Matteo Tomaiuoloe, Diana Paolinie, Barbara Toniettie, Maria Tizzanif, Stefania M Locatellif, Giulio Porrinof, Isabel Losanof, Dario Leonef, Gilberto Calzolarif, Matteo Versang, Fabio Sterif, Arianna Arditof, Marialessia Capuanog, Maria Gelardig, Giulia Silvestrig, Stefania Tuttog, Maria Avolioh, Rosanna Cavalloh,i, Alice Bartaluccif, Cristina Paglierif, Federico Baldassag, Paolo Baronf, Giordano Bianchif, Valeria Bussof, Andrea Conternof, Paola Del Rizzof, Paolo Fascio Pecettof, Francesca Giachinof, Andrea Iannacconef, Patrizia Ferreraf, Franco Riccardinif, Claudia Sacchif, Michela Sozzif, Silvia Totarof, Pasqualina Viscontif, Francesca Risig, Francesca Basileg, Denise Baricocchig, Alessia Beauxg, Beaux Valentinag, Paolo Bimag, Irene Carag, Liliana Chichizolag, Francesca Dellavalleg, Giulia Labarileg, Marco Ottinog, Ilaria Piag, Virginia Scategnig, Astrid Surrag
Institutions of the “ED COVID‐19” Investigators
aDepartment of Emergency Medicine, bDepartment of Radiology, cDepartment of Infective Diseases, dDepartments of General Laboratory and Microbiology, eDepartment of Health and Management, Careggi University Hospital, Firenze, Italy; fMedicina d’Urgenza, Department of General and Specialized Medicine, A.O.U. Città della Salute e della Scienza di Torino, Molinette Hospital, Torino, Italy; gResidency Program in Emergency Medicine, University of Torino, Torino, Italy; hClinical Microbiology, AOU Città della Salute e della Scienza di Torino, Molinette Hospital, Turin, Italy; iDepartment of Medical Sciences, University of Torino, Torino, Italy.
Institutions at which the work was performed
-
‐
Careggi University Hospital, Firenze, Italy.
-
‐
A.O.U. Città della Salute e della Scienza di Torino, Molinette Hospital, Torino, Italy.
See Appendix for the List of the “ED COVID‐19” Investigators
Supervising Editor: D. Mark Courtney
Contributor Information
Peiman Nazerian, Email: pnazerian@hotmail.com.
ED COVID‐19 Investigators:
Elisabetta Catini, Simona Gualtieri, Barbara Casanova, Eleonora De Villa, Gabriele Cerini, Enrico Lumini, Manfredi Gagliano, Antonio Annovi, Sara Mucaj, Marco Albanesi, Edoardo Cavigli, Chiara Moroni, Vittorio Miele, Fillippo Lagi, Alessandra Fanelli, Gian Maria Rossolini, Lucia Turco, Matteo Tomaiuolo, Diana Paolini, Barbara Tonietti, Maria Tizzani, Stefania M Locatelli, Giulio Porrino, Isabel Losano, Dario Leone, Gilberto Calzolari, Matteo Versan, Fabio Steri, Arianna Ardito, Marialessia Capuano, Maria Gelardi, Giulia Silvestri, Stefania Tutto, Maria Avolio, Rosanna Cavallo, Alice Bartalucci, Cristina Paglieri, Federico Baldassa, Paolo Baron, Giordano Bianchi, Valeria Busso, Andrea Conterno, Paola Del Rizzo, Paolo Fascio Pecetto, Francesca Giachino, Andrea Iannacone, Patrizia Ferrera, Franco Riccardini, Claudia Sacchi, Michela Sozzi, Silvia Totaro, Pasqualina Visconti, Francesca Risi, Francesca Basile, Denise Baricocchi, Alessia Beaux, Beaux Valentina, Paolo Bima, Irene Cara, Liliana Chichizola, Francesca Dellavalle, Giulia Labarile, Marco Ottimo, Ilaria Pia, Virginia Scategni, and Astrid Surra
REFERENCES
- 1. Carpenter CR, Mudd PA, West CP, Wilber E, Wilber ST. Diagnosing COVID‐19 in the emergency department: a scoping review of clinical examinations, laboratory tests, imaging accuracy, and biases. Acad Emerg Med. 2020;27(8):653‐670. [DOI] [PMC free article] [PubMed] [Google Scholar]
- 2. Woloshin S, Patel N, Kesselheim AS. False negative tests for SARS‐CoV‐2 infection ‐ challenges and implications. N Engl J Med. 2020;383(6):e38. [DOI] [PubMed] [Google Scholar]
- 3. Arevalo‐Rodriguez I, Buitrago‐Garcia D, Simancas‐Racines D, et al. False‐negative results of initial RT‐PCR assays for COVID‐19: a systematic review. PLoS One 2020;15(12):e0242958. [DOI] [PMC free article] [PubMed] [Google Scholar]
- 4. West CP, Montori VM, Sampathkumar P. COVID‐19 testing: the threat of false‐negative results. Mayo Clin Proc. 2020;95:1127‐1129. [DOI] [PMC free article] [PubMed] [Google Scholar]
- 5. Hussain A, Via G, Melniker L, et al. Multi‐organ point‐of‐care ultrasound for COVID‐19 (PoCUS4COVID): international expert consensus. Crit Care. 2020;24(1):702. [DOI] [PMC free article] [PubMed] [Google Scholar]
- 6. Schmid B, Feuerstein D, Lang CN, et al. Lung ultrasound in the emergency department ‐ a valuable tool in the management of patients presenting with respiratory symptoms during the SARS‐CoV‐2 pandemic. BMC Emerg Med. 2020;20(1):96. [DOI] [PMC free article] [PubMed] [Google Scholar]
- 7. Cozzi D, Albanesi M, Cavigli E, et al. Chest X‐ray in new coronavirus disease 2019 (COVID‐19) infection: findings and correlation with clinical outcome. Radiol Med 2020;125(8):730‐737. [DOI] [PMC free article] [PubMed] [Google Scholar]
- 8. Ippolito D, Pecorelli A, Maino C, et al. Diagnostic impact of bedside chest X‐ray features of 2019 novel coronavirus in the routine admission at the emergency department: case series from Lombardy region. Eur J Radiol. 2020;129:109092. [DOI] [PMC free article] [PubMed] [Google Scholar]
- 9. Volpicelli G, Elbarbary M, Blaivas M, et al. International evidence‐based recommendations for point‐of‐care lung ultrasound. Intensive Care Med. 2012;38:577‐591. [DOI] [PubMed] [Google Scholar]
- 10. Italian Society of Emergency Medicine website . http://www.simeu.it/download/articoli/famiglie/249/Regolamento.Formazione.SIMEU.14Mar2015.pdf, Accessed March 14, 2015.
- 11. Dale AP, Marchello C, Ebell MH. Clinical gestalt to diagnose pneumonia, sinusitis, and pharyngitis: a meta‐analysis. Br J Gen Pract. 2019;69(684):e444‐e453. [DOI] [PMC free article] [PubMed] [Google Scholar]
- 12. DeLong ER, DeLong DM, Clarke‐Pearson DL. Comparing the areas under two or more correlated receiver operating characteristic curves: a nonparametric approach. Biometrics. 1988;44(3):837‐845. [PubMed] [Google Scholar]
- 13. Landis JR, Koch GG. The measurement of observer agreement for categorical data. Biometrics. 1977;33(1):159‐174. [PubMed] [Google Scholar]
- 14. Oliver G, Reynard C, Morris N, Body R. Can emergency physician gestalt “rule in” or “rule out” acute coronary syndrome: validation in a multicenter prospective diagnostic cohort study. Acad Emerg Med. 2020;27:24‐30. [DOI] [PubMed] [Google Scholar]
- 15. Roncalli J, Picard F, Delarche N, et al. Predictive criteria for acute heart failure in emergency department patients with acute dyspnea: the PREDICA study. Eur J Emerg Med. 2019;26:400‐404. [DOI] [PubMed] [Google Scholar]
- 16. Penaloza A, Verschuren F, Meyer G, et al. Comparison of the unstructured clinician gestalt, the Wells score, and the revised Geneva score to estimate pretest probability for suspected pulmonary embolism. Ann Emerg Med. 2013;62:117‐124.e2. [DOI] [PubMed] [Google Scholar]
- 17. Chen SG, Chen JY, Yang YP, Chien CS, Wang ML, Lin LT. Use of radiographic features in COVID‐19 diagnosis: challenges and perspectives. J Chin Med Assoc. 2020;83(7):644‐647. [DOI] [PMC free article] [PubMed] [Google Scholar]
- 18. Wong HY, Lam HY, Fong AT, et al. Frequency and distribution of chest radiographic findings in COVID‐19 positive patients. Radiology. 2020;296(2):E72‐E78. [DOI] [PMC free article] [PubMed] [Google Scholar]
- 19. Guan CS, Lv ZB, Yan S, et al. Imaging features of coronavirus disease 2019 (COVID‐19): evaluation on thin‐section CT. Acad Radiol 2020;27:609‐613. [DOI] [PMC free article] [PubMed] [Google Scholar]
- 20. Kim ES, Chin BS, Kang CK, et al. Clinical course and outcomes of patients with severe acute respiratory syndrome coronavirus 2 infection: a preliminary report of the first 28 patients from the Korean Cohort Study on COVID‐19. J Korean Med Sci. 2020;35:e142. [DOI] [PMC free article] [PubMed] [Google Scholar]
- 21. Ng MY, Lee EY, Yang F, et al. Imaging profile of the COVID‐19 infection: radiologic findings and literature review. Radiol Cardiothorac Imaging. 2020;2:e200034. [DOI] [PMC free article] [PubMed] [Google Scholar]
- 22. Castiglioni I, Ippolito D, Interlenghi M, et al. Artificial intelligence applied on chest X‐ray can aid in the diagnosis of COVID‐19 infection: a first experience from Lombardy, Italy. MedRxiv. 2020;04:20040907. [Google Scholar]
- 23. Pare JR, Camelo I, Mayo KC, et al. Point‐of‐care lung ultrasound is more sensitive than chest radiograph for evaluation of COVID‐19. West J Emerg Med. 2020;21:771‐778. [DOI] [PMC free article] [PubMed] [Google Scholar]
- 24. Peyrony O, Marbeuf‐Gueye C, Truong V, et al. Accuracy of emergency department clinical findings for diagnosis of coronavirus disease 2019. Ann Emerg Med. 2020;76:405‐412. [DOI] [PMC free article] [PubMed] [Google Scholar]
- 25. Wang X, Tan Li, Wang Xu, et al. Comparison of nasopharyngeal and oropharyngeal swabs for SARS‐CoV‐2 detection in 353 patients received tests with both specimens simultaneously. Int J Infect Dis. 2020;94:107‐109. [DOI] [PMC free article] [PubMed] [Google Scholar]
- 26. Ren X, Liu Y, Chen H, et al. Application and optimization of RT‐PCR in diagnosis of SARS‐CoV‐2 infection. medRxiv 2020. doi: 10.1101/2020.02.25.20027755
- 27. Fang Y, Zhang H, Xie J, et al. Sensitivity of chest CT for COVID‐19: comparison to RT‐PCR. Radiology. 2020;296(2):E115‐E117. [DOI] [PMC free article] [PubMed] [Google Scholar]
- 28. Long C, Xu H, Shen Q, et al. Diagnosis of the coronavirus disease (COVID‐19): RT‐PCR or CT? Eur J Radiol. 2020;126:108961. [DOI] [PMC free article] [PubMed] [Google Scholar]
- 29. Nair A, Rodrigues JC, Hare S, et al. A British Society of Thoracic Imaging statement: considerations in designing local imaging diagnostic algorithms for the COVID‐19 pandemic. Clin Radiol. 2020;75:329‐334. [DOI] [PMC free article] [PubMed] [Google Scholar]
- 30. Tavare AN, Braddy A, Brill S, et al. Managing high clinical suspicion COVID‐19 inpatients with negative RT‐PCR: a pragmatic and limited role for thoracic CT. Thorax. 2020;75(7):537‐538. [DOI] [PMC free article] [PubMed] [Google Scholar]
- 31. Umemneku Chikere CM, Wilson K, Graziadio S, Vale L, Allen AJ. Diagnostic test evaluation methodology: a systematic review of methods employed to evaluate diagnostic tests in the absence of gold standard ‐ An update. PLoS One. 2019;14(10):e0223832. [DOI] [PMC free article] [PubMed] [Google Scholar]
Associated Data
This section collects any data citations, data availability statements, or supplementary materials included in this article.
Supplementary Materials
Data Supplement S1. Supplementary tables.