

Abstract
ACE inhibitors (ACEis) and angiotensin receptor blockers (ARBs) are standard‐of‐care treatments for hypertension and diabetes, common comorbidities among hospitalized patients with coronavirus disease 2019 (COVID‐19). Their use in the setting of COVID‐19 has been heavily debated due to potential interactions with ACE2, an enzyme that links the pro‐inflammatory and anti‐inflammatory arms of the renin angiotensin system, but also the entryway by which severe acute respiratory syndrome‐coronavirus 2 (SARS‐CoV‐2) invades cells. ACE2 expression is altered by age, hypertension, diabetes, and the virus itself. This study integrated available information about the renin angiotensin aldosterone system (RAAS) and effects of SARS‐CoV‐2 and its comorbidities on ACE2 into a mechanistic mathematical model and aimed to quantitatively predict effects of ACEi/ARBs on the RAAS pro‐inflammatory/anti‐inflammatory balance. RAAS blockade prior to SARS‐CoV‐2 infection is predicted to increase the mas‐AT1 receptor occupancy ratio up to 20‐fold, indicating that in patients already taking an ACEi/ARB before infection, the anti‐inflammatory arm is already elevated while the pro‐inflammatory arm is suppressed. Predicted pro‐inflammatory shifts in the mas‐AT1 ratio due to ACE2 downregulation by SARS‐CoV‐2 were small relative to anti‐inflammatory shifts induced by ACEi/ARB. Predicted effects of changes in ACE2 expression with comorbidities of diabetes, hypertension, or aging on mas‐AT1 occupancy ratio were also relatively small. Last, predicted changes in the angiotensin (Ang(1‐7)) production rate with ACEi/ARB therapy, comorbidities, or infection were all small relative to exogenous Ang(1‐7) infusion rates shown experimentally to protect against acute lung injury, suggesting that any changes in the ACE2‐Ang(1‐7)‐mas arm may not be large enough to play a major role in COVID‐19 pathophysiology.
Study Highlights.
WHAT IS THE CURRENT KNOWLEDGE ON THE TOPIC?
☑ ACE2 plays an important role in severe acute respiratory syndrome‐coronavirus 2 (SARS‐CoV‐2) infection. The use of ACE inhibitors (ACEis) and angiotensin receptor blockers (ARBs) are the current standard of care for conditions such as hypertension—usually comorbidities of coronavirus disease 2019 (COVID‐19).
WHAT QUESTION DID THIS STUDY ADDRESS?
☑ We wanted to quantify the interplay among renin angiotensin aldosterone system (RAAS) therapies, SARS‐COV‐2 infection, and chronic diseases or aging on the balance between the inflammatory (AT1) and anti‐inflammatory (mas) arms of the RAAS.
WHAT DOES THIS STUDY ADD TO OUR KNOWLEDGE?
☑ We understand that the effect of RAAS therapy on the mas/AT1 ratio and anti‐inflammatory arm of the RAAS much higher than that of changing ACE2 expression. Changes in ACE expression are predicted to be more important than ACE2 in determining the baseline inflammatory/pro‐inflammatory balance of the RAAS.
HOW MIGHT THIS CHANGE CLINICAL PHARMACOLOGY OR TRANSLATIONAL SCIENCE?
☑ The anti‐inflammatory arm of the RAAS is already more dominant in those already taking ACEis/ARBs prior to infection.
Hypertension and diabetes are common comorbidities among hospitalized patients with coronavirus disease 2019 (COVID‐19). 1 ACE inhibitors (ACEis) and angiotensin receptor blockers (ARBs) are standard of care treatment for these comorbidities, because they reduce cardiovascular events, kidney injury, and other vascular complications of these diseases. 2 , 3 There has been a good deal of debate around the use of these drugs in patients with COVID‐19. On one hand, it has been speculated that these therapies may increase susceptibility or severity of COVID‐19, but conversely, it has also been speculated that they may protect against excess inflammation following COVID‐19 infection. 4 The limited clinical data currently available do not seem to support evidence of harm. 5 , 6 , 7 The American College of Cardiology, Heart Failure Association of America, and American Heart Association have issued a joint statement urging continued use of ACEis or ARBs as standard of care, while also urging additional research into any potential interactions with COVID‐19 infection. 8 However, the speculation and uncertainty among patients and healthcare providers regarding the most commonly used antihypertensive drug classes in the United States could have significant public health consequences. 9
The debate around protective or harmful mechanisms of ACEis/ARBs arise from speculation about their interactions with ACE2, the membrane‐bound protein by which the severe acute respiratory syndrome‐coronavirus 2 (SARS‐CoV‐2) virus invades the body. 10 ACE2 plays a normal physiological role as an enzyme in the renin angiotensin aldosterone system (RAAS; Figure 1a ). The classic arm of the RAAS, in which angiotensin I (AngI) is converted to AngII by ACE and then binds to the AT1 receptor, promotes vasoconstriction, sodium retention, and inflammation. AngII binding to the AT2 receptor appears to counter some of these effects. 11 A second arm opposes the effects of AT1. In this arm, AngI and AngII are converted to Ang(1‐7) by neprilysin and ACE2, respectively. Ang(1‐7) suppresses inflammation by binding to the mas receptor (a G‐protein coupled receptor of Ang(1‐7) associated with anti‐inflammatory effects of the RAAS). 12
Figure 1.
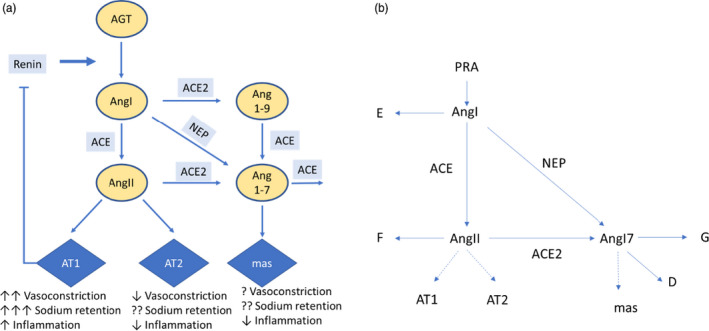
The renin‐angiotensin system and (a) Schematic representation of renin‐angiotensin system (RAAS) mathematical model. Equations for each rate reaction are given in Table S2 . The RAAS system illustrated in schematically in a can be represented mathematically as a set of processes summarized in (b), and the reaction rates A–G are given in Table S2 . Each enzyme reaction in this system is assumed to follow Michaelis‐Menten kinetics (Eq. 1) with a Michaelis constant K m defined by Eq. 2. [Colour figure can be viewed at wileyonlinelibrary.com]
It has been hypothesized that ACEis/ARBs could increase risk or severity of COVID‐19 by increasing ACE2 expression and thus providing more routes for viral entry. 13 However, ACE2 has not been established as a rate‐limiting step for viral entry. In addition, a recent review of experimental studies found little consistency among studies reporting changes in ACE2 expression with ACEi/ARB treatment. 14 Some studies found increased ACE2 expression/activity with ACEi or ARB treatment, whereas a plurality showed little to no effect, and a few even showed decreased expression.
On the other hand, it has also been hypothesized that ACEis/ARBs could mitigate the severity of COVID‐19 by suppressing inflammation. Although much is unknown about the pathophysiology of COVID‐19, the degree of severity appears to depend on the strength of the host’s inflammatory response triggered by the infection. 15 Suppression of the classic AngI‐AngII‐AT1 pathway may shift the balance toward the anti‐inflammatory Ang(1‐7)‐mas arm of the RAAS. Infusion of Ang(1‐7) has been shown to reduce acute lung injury and inflammation in animal models of acute respiratory distress syndrome, 16 whereas downregulation of pulmonary ACE2 is associated with increased lung injury severity. 17 , 18 , 19
Part of the challenge in understanding the effect of ACEis and ARBs on the inflammatory balance in COVID‐19 is that ACE2 expression is altered by other factors. Hypertension, diabetes, and aging have all been shown to alter ACE2 expression. 20 , 21 , 22 , 23 The SARS‐CoV‐2 virus itself also induces ACE2 shedding and downregulation after cellular entry, and ACE2 expression is also downregulated by the SARS‐CoV‐2 virus itself, which may play a role in the excessive inflammatory response in some patients. 24 SARS viruses have a higher affinity to ACE2 and shed ACE2 with higher efficiency than other coronaviruses, and the structure of SARS‐CoV‐2 suggests that it binds with higher affinity than other SARS viruses. 25 This may contribute to both its increased transmissibility and then subsequently to increased disease severity.
The speculated suppression of the inflammation with ACEis and ARBs in COVID‐19 is based on qualitative directional effects on the RAAS components, and the integrative consequences of infection, aging, chronic disease, aging, and therapies on the effectors of this system (AT1, AT2, and mas binding) have not been quantified. The goals of this study were (i) to use a mechanistic mathematical model of the RAAS to quantify the interplay among RAAS therapies, SARS‐CoV‐2 infection, and chronic diseases or aging on the balance between the inflammatory (AT1) and anti‐inflammatory (mas) arms of the RAAS, and (ii) identify and evaluate the key uncertainties and knowledge gaps in our ability to quantify these effects.
METHODS
Model definition
The RAAS illustrated schematically in Figure 1a can be represented mathematically as a set of processes summarized in Figure 1b , and the reaction rates A‐G are given in Supplementary Table S2 . Each enzyme reaction in this system is assumed to follow Michaelis‐Menten kinetics (Eq. 1) with a Michaelis rate constant K m defined by Eq. 2:
| (1) |
where [E] and [S] represent enzyme and substrate concentrations respectively, [ES] represents concentration of the enzyme‐substrate complex, and [P] is the product formed.
| (2) |
The enzyme activity V, or rate of product formation, is given by:
| (3) |
where Kcat is the catalytic rate constant.
The catalytic efficiency is defined as:
| (4) |
For conversion of angiotensinogen (AGT) to AngI by renin, AGT is normally available in excess, and renin is the rate‐limiting components. Thus, the rate of formation of AngI is given by plasma renin activity (PRA) and for simplicity, AGT is not considered in the model. For all other enzyme‐substrate pairs in Figure 1 , Km, K cat, and Effsubstrate,enzyme have been measured in ref. 26 (Table 1 ).
Table 1.
Model parameters
| Parameter | Definition | Value | Units | Source | Species |
|---|---|---|---|---|---|
| EffACE,AngI | Catalytic efficiency of ACE conversion of AngI to AngII | 648 | /pM/hr | 26 | In vitro (human cDNA transfected in CHO cells) |
| EffACE2,AngII | Catalytic efficiency of ACE2 conversion of AngII to Ang(1‐7) | 7,920 | /pM/hr | 26, 27 | In vitro (human cDNA transfected in CHO cells) |
| EffACE,Ang(1‐7) | Catalytic efficiency of ACE conversion of Ang(1‐7) to other peptides | 1,260 | /pM/hr | 26 | In vitro (human cDNA transfected in CHO cells) |
| EffNEP,AngI | Catalytic efficiency of NEP conversion of AngI to Ang(1‐7) | 2,232 | /pM/hr | 26 | In vitro (human cDNA transfected in CHO cells) |
| Kd,AT1 | AT1 receptor dissociation constant | 552 | pmol/L | 44 | Primate (in vitro COS‐7) |
| Kd,AT2 | AT2 receptor dissociation constant | 552 | pmol/L | Assumed | |
| Kd,mas | Mas receptor dissociation constant | 930 | pmol/L | 45 | Mice |
| hrenin | Renin half‐life | 0.1733 | hour | Human | |
| PRA(0) | Baseline Plasma Renin Activity | 3587 | pmol/L/h | 35 | Human |
| AngI(0) | Baseline Angiotensin I plasma concentration | 10.5 | pmol/L | 35 | Human |
| AngII(0) | Baseline Angiotensin II plasma concentration | 6.6 | pmol/L | 35 | Human |
| Ang(1‐7)(0) | Baseline Angiotensin (1‐7) plasma concentration | 3 | pmol/L | 35 | Human |
| brenin | Fitting exponent for AT1 feedback on renin | 0.8 | ‐ | Estimated 28 | Human |
| RatioACE‐NEP | Ratio of ACE expression to NEP expression | 9 | ‐ | Fitting to 34 | Rats |
| RatioACE‐ACE2 | Ratio of ACE expression to NEP expression | 32 | ‐ | Fitting to 34 | Rat |
Ang, angiotensin; CHO, Chinese hamster ovary.
This article is being made freely available through PubMed Central as part of the COVID-19 public health emergency response. It can be used for unrestricted research re-use and analysis in any form or by any means with acknowledgement of the original source, for the duration of the public health emergency.
For all enzyme‐substrate pairs, K m is on the order of micromoles, whereas normal substrate concentrations [S] is on the order of picomoles (Table 1 ). Because K m >> [S], then according to Eq. 2, [E] must be much greater than [ES], so that [E] is approximately equal to the total enzyme concentration [E]t. This also means that even if substrate concentrations change several fold, [E] will remain approximately constant. Therefore, enzyme activities for each enzyme substrate pair (Eq. 3) can be written as:
| (5) |
As a simplification, the pathway from AngI to Ang(1‐9) to Ang(1‐7) was not included in this model. This is justified because the catalytic efficiency for AngI‐ACE2 is an order of magnitude lower than AngI‐ACE and AngI‐NEP, and the catalytic efficiency of Ang(1‐9)‐ACE is also an order of magnitude lower than AngI‐NEP or AngII‐ACE2. 26 , 27 Therefore, very little Ang(1‐7) is expected to formed from the AngI‐Ang(1‐9) arm of the pathway, relative to the AngI‐NEP and AngII‐ACE2 pathways. Any AngI conversion to Ang(1‐9) is lumped in with other routes of AngI degradation.
Rate equations for each peptide are then given by Eqs. (6), (7), (8):
| (6) |
| (7) |
| (8) |
Fractional receptor occupancy for AT1, AT2, and mas are given by:
| (9) |
| (10) |
| (11) |
where K d is the dissociation constant for each receptor‐ligand pair, given in Table 1 . This form assumes that clearance of AngII and Ang(1‐7) by binding to receptors is small, and is encapsulated in the degradation terms F and G, respectively.
As described previously, 28 , 29 plasma renin concentration (PRC) is given by:
| (12) |
Where SECrenin and hrenin are the renin secretion rate and half‐life, respectively. Binding of Ang II to the AT1 receptor produces a highly nonlinear feedback on renin secretion, given by:
| (13) |
Where fAT10 is the equilibrium fractional AT1 receptor occupancy, and b ,renin is a fitting constant. PRA can be related to PRC by the conversion factor 0.06 (ng/mL/hour)/(pg/mL).
Parameter estimation and model constraints
A subset of model parameters is known with some degree of certainty from clinical or experimental measurements (Table 1 ). Concentration ranges for renin, AngI, AngII, and Ang(1‐7) in humans have been measured clinically. Catalytic efficiencies for each enzyme substrate pair as well as receptor binding affinities have been measured experimentally. 26 The half‐life of renin is known, and nominal renin secretion rate SECrenin,0 can thus be determined from Eq. 12.
This leaves another subset of six unknown: [ACE], [ACE2], and [NEP], KAngI, KAngII, and KAng17. Some studies have measured ACE and ACE2 concentrations, but with widely varying results. Expression varies across tissues, so obtaining a value that represents total ACE and ACE2 expression is difficult. Neprilysin and ACE2 are membrane‐bound proteins, and circulating levels may only reflect ectodomain shedding of these enzymes, not tissue levels. 30 , 31 Plasma levels are not easily measurable and may not reflect tissue levels. However, if the relative ratio of ACE to NEP and ACE to ACE2 expression are known, then, as shown later, then these remaining model parameters can be determined from equilibrium conditions.
Determining ACE‐NEP and ACE‐ACE2 ratios
Enzyme levels vary across tissues, across disease states, and across species. 32 , 33 Nevertheless, we aimed to estimate a reasonable starting value for these ratios by fitting the model to experimental measurements by Yamamoto and colleagues. 34 In their experiments, vehicle, an ACEi, a neprilysin inhibitor, or both an ACEi and neprilysin inhibitor were administered to 16‐week‐old male Wistar‐Kyoto and spontaneously hypertensive rats. Twenty minutes later, a 2 nmol bolus injection of radiolabeled AngI was administered, and concentration of radiolabeled AngI, AngII, and Ang(1‐7) every 15–30 seconds over the next 3 minutes. Only data from Wistar‐Kyoto rats were used in this analysis. To simulate this study, all peptide concentrations were initially set to zero. Because only radiolabeled peptides were measured, neither renin production or renin activity were reflected in the available data, and thus PRA was set to zero. ACE inhibition and NEP inhibition were modeled as a constant fractional reduction in their respective enzyme concentration. The study protocol was simulated, and enzyme concentrations ([ACE], [ACE2], and [NEP]), peptide degradation rate constants (K AngI, K AngII, K Ang17), and ACEi and NEPi fractional inhibition were estimated by fitting the digitized data using a least squares method.
Because the experimental study was conducted in rats, it may not be reasonable to assume that the absolute concentrations and rate constants translate to humans. However, we assume that the estimated ratio of [ACE] to [ACE2] and [ACE] to [NEP] may translate, and these ratios were used in all further simulations.
Based on the estimated ACE to ACE2 and ACE to NEP ratios, remaining parameters were determined from steady‐state conditions when steady‐state concentrations of renin, AngI, AngII, and Ang(1‐7) are known, as described in the Supplementary Material.
Model evaluation
To further qualify the model, we evaluated its ability to reproduce observed changes in plasma AngI, AngII, and Ang(1‐7) concentrations in response to an ACEi in a previously published human clinical trial. 35 In this double‐blind, placebo‐controlled crossover study, 17 healthy men were treated with enalapril or placebo for 2 weeks. During the first week, they were given a low‐sodium diet, and during the second week they were given a high sodium diet. Plasma AngI, AngII, and Ang(1‐7) were measured at the end of each week.
To simulate this study, baseline concentrations of AngI, AngII, and Ang(1‐7) were set to the average of the reported values during the placebo high salt and low salt periods. Catalytic efficiencies were specified according to ref. 26 and the ratio of ACE to NEP and ACE to ACE2 were initially set to the values estimated by fitting ref. 34 as described above. Parameters governing renin secretion and AT1 feedback on renin were specified as previously described. 28 The study protocol was then simulated. To represent the effects of different Na+ intakes, the rate of renin secretion (SECrenin0) was adjusted to give the observed differences in AngI between the high and low salt groups during the placebo period.
As shown in Supplementary Figure S3 , the simulation predicted the increase in AngI and Ang(1‐7) and decrease AngII following ACEi well. This provides validation that the model reasonably describes the behavior of the RAAS in humans.
Simulations
Effect of changes in ACE2 receptor expression on mas, AT1, and their ratio, before and after ACEi or ARB therapy
A literature review was conducted to understand the range of changes in ACE2 expression due to aging, diabetes, or hypertension that have been observed experimentally or clinically. Based on this review, a range of ACE2 concentrations from 0 to 2.5 times normal was determined to be a reasonable operating range. Changes in mas and AT fractional occupancy, as well as their ratios, were simulated over this range of ACE2 values, before and after addition of an ACEi or an ARB. We have previously estimated that ACE inhibition with common ACEis is 90–95%. For ARBs, inhibition of AT1 ranged from 88 to 97%, depending on the drug and dose. 28 In this study, a value of 93% inhibition was used for both.
Response to SARS‐CoV‐2 infection
SARS‐CoV‐2 infection was simulated as a 95% decrease in ACE2, representing a “worst‐case” scenario for ACE2 downregulation. Because all enzymes of the RAAS have some natural variability and may be affected by disease states, the effects of SARS‐CoV‐2 infection was simulated in 200 “virtual subjects” created by sampling ACE2, ACE, NEP, and renin secretion from a log‐normal distribution with means given in Table 1 . The parameter distributions and resulting distribution in RAAS peptides are characterized in Figure S1 and S2 .
Sensitivity analysis
A sensitivity analysis using a Latin Hypercube Sampling technique was conducted to determine the parameters most influential in predicting change in AT1, AT2, and mas receptor occupancies with varying ACE2 levels and with RAAS therapy. 36 Latin Hypercube Sampling is a method that generates values for a set of parameters, each with a specified distribution. Most input parameters were informed by literature data (see Table 2 ), but parameters whose distributions were not specified were either defined so that 90% of sampled values fell between the range of minimum and maximum values found in literature, or the coefficient of variation was equal to 0.25. Two hundred fifty parameter sets were generated to represent 250 virtual patients. Because the relationship between some inputs and outputs are nonmonotonic or nonlinear, partial rank correlation coefficients were calculated at steady‐state to quantify how variation in the input parameters contributes to changes in receptors’ occupancies. Parameters with the highest sensitivity were investigated further to understand how that parameter’s uncertainty influenced the predicted changes in mas‐AT1 receptor occupancy ratio.
Table 2.
Literature‐reported effects of diabetes, hypertension, aging, and SARS‐CoV‐2 infection on ACE2
| Condition | Species | Tissue | Study | Measurement | Observed change |
|---|---|---|---|---|---|
| Diabetes | Human | Lung | Not available | ||
| Serum | 46 | ACE2 activity | Increased 5–18% | ||
| Serum | 21 | ACE2 activity | Increased 20% | ||
| Kidney | 47 | ACE2 mRNA and protein | Decreased 56–60% | ||
| 48 | ACE2 mRNA | No change | |||
| 49 | ACE2 protein | Increased (semiquantitative, small sample size) | |||
| Rodents | Lung | 32 | ACE2 activity | No significant change | |
| Lung | 32 | ACE2 protein | Increased 25–40% | ||
| Kidney | 32 | ACE2 protein | Decreased 40–65% | ||
| 20 | ACE2 activity and protein | Increased 2‐fold | |||
| 20 | ACE2 mRNA | Decreased 60% | |||
| Cardiac | 20 | ACE2 activity | No change | ||
| Kidney | 50 | ACE2 protein | Increased 2.5‐fold | ||
| Hypertension | Human | Lung | Not available | ||
| Serum | 21 | ACE2 activity | Increased 20% | ||
| Rodents | Kidney | 51 | ACE2 protein and mRNA | 40–65% decrease | |
| Age | Human | Lung | Not available | ||
| Serum | 52 | ACE2 protein | Increased during teen years (max age in study: 24) | ||
| Nasal | 53 | ACE2 gene expression | Lower in children, no difference between younger and older adults, maximum age in study: 60 | ||
| Rodents | Lung | 22 | ACE2 protein | Decrease 67–78% in older rats | |
| Aorta | 23 | ACE2 protein | Decreased 50–75% in older mice | ||
| SARS‐CoV‐2 | In vitro | Vero E6 cells | 37 | ACE2 shedding | Increased 5X (increased indicates decreases membrane availability) |
| Mice | Lung | 18 | ACE2 protein | Nearly undetectable with western blot after infection | |
SARS‐Cov‐2, severe acute respiratory syndrome‐coronavirus 2.
This article is being made freely available through PubMed Central as part of the COVID-19 public health emergency response. It can be used for unrestricted research re-use and analysis in any form or by any means with acknowledgement of the original source, for the duration of the public health emergency.
RESULTS AND DISCUSSION
Model fitting and validation
Supplementary Figure S4 shows the optimized model fit to Yamamoto et al. 34 All parameters were able to be estimated with precision (see Supplementary Table S1 ). The concentration of ACE was estimated to be an order of magnitude larger than the concentrations of NEP and ACE2, with ACE‐NEP and ACE‐ACE2 ratios of 9 and 32, respectively. These ratios were used in all further simulations. Also of note, KAngI was estimated to be orders of magnitude less than EffACE‐AngI[ACE] or EffNEP‐AngII[NEP] (0.001 vs. 397 and 150, respectively). This indicates that nearly all AngI was converted through ACE or NEP, and the reaction rate E in Figure 1b and Eq. 6 is negligible. Therefore, E was considered zero for the rest of this analysis.
As shown in Supplementary Figure S4 , the simulation predicted well the increase in AngI and Ang(1‐7) and decrease in AngII following ACE inhibition observed in ref. 35. This provides validation that the model reasonably describes the RAAS in humans.
Literature review of effects of diabetes, hypertension, aging, and SARS‐CoV‐2 infection on ACE2
Table 2 summarizes studies that have reported changes in ACE2 protein expression, activity, or mRNA in diabetes, hypertension, with age, or after SARS‐CoV‐2 infection. Unfortunately, no studies of ACE2 changes in human lung tissue were found. In diabetes, small increases in human serum ACE2 were reported. However, it is unclear how changes in serum ACE2 relate to changes in functional membrane‐bound ACE2. In diabetes, studies in human kidneys and in rodent lungs, kidneys, and cardiac tissue all showed either a decrease or no change in ACE2 mRNA. However, reported changes in ACE2 protein and activity varied widely, from a 60% decrease to a 2.5‐fold increase. Fewer studies were found investigating ACE2 in hypertension. One study found a 20% increase in human serum ACE2 activity, whereas another found a 40–65% decrease in kidney ACE2 protein and mRNA. With aging, two studies found that ACE2 increased during teen years. The only study including adult humans found no difference between young and old adults. Two rodent studies found that ACE2 decreased 67–78% and 50–75% in the lungs and aorta, respectively.
Taken together, these studies do suggest that ACE2 expression can change with disease and aging, decreasing as much as 80% and increasing as much as 2.5‐fold. However, the existence and direction of this change is not consistent across studies. Thus, rather than modeling a specific effect of diabetes, hypertension, or aging on ACE2, we sought to understand the effect of a range of changes in ACE2 on the balance between mas and AT1 receptor occupancy.
Two studies have demonstrated that ACE2 is downregulated by earlier SARS coronaviruses, although studies have not yet been published for SARS‐CoV‐2. Kuba et al. 24 found that ACE2 was decreased to levels similar to ACE2 knockouts in Western blot infected mice lungs, whereas Glowacka et al. 37 found that ACE2 shedding was increased 5 times, indicating that membrane ACE2 availability was decreased. Based on these findings, SARS‐CoV‐2 infection was simulated as a 95% decrease in ACE2 expression.
Relationship between ACE2 concentration and mas‐AT1 balance, with and without ACEi/ARB therapy
Figure 2 (green curves) shows the effects of upregulation or downregulation of ACE2 expression. At normal ACE2 levels, AT1 and AT2 receptor occupancy are predicted to be nearly twice mas receptor occupancy (9% vs. 5%). A 2.5‐fold increase in ACE2 increases the mas/AT1 ratio 66%, while decreasing ACE2 expression down to zero decreases the mas/AT1 ratio 46%. These changes are driven primarily by changes in mas occupancy, with weaker changes in AT1. AT2 occupancy decreases 14% as ACE2 varies from 0 to 2.5 times normal.
Figure 2.

Simulated effects of changes in ACE2 concentration, with and without ARB or ACEi treatment on (a) mas‐AT1 receptor occupancy ratio, (b) mas receptor occupancy, (c) AT1 receptor occupancy, and (d) AT2 receptor occupancy. Gray dashed line is the “normal” ACE2 level. All values are standardized by their value at normal ACE2 in the absence of ARB/ACEi therapy. ACEi, ACE inhibitor; ARB, angiotensin receptor blocker.
Relative to the receptor occupancy changes with ACE2 described above, inhibition of ACE has a much larger effect on mas, AT1, and AT2 receptor occupancy (Figure 2 , blue curves). At normal ACE2 levels, ACEi increases mas receptor occupancy from 5% to 18%, while decreasing both AT1 and AT2 receptor occupancy from 9% to 3%. This results in a much larger 7‐fold change in the mas‐AT1 receptor binding ratio, compared with the effect of changing ACE2. In the presence of an ACEi, a 2.5‐fold increase in ACE2 increases the mas‐AT1 ratio to 132% of the ACEi‐normal ACE2 level, and 6.4 times the no‐treatment‐normal‐ACE2 level.
ARB therapy is also predicted to have a much larger effect on mas, AT1, and AT2 receptor occupancy than changes with ACE2 concentration (Figure 2 , red curves). At normal ACE2 levels, ARB therapy increases mas receptor occupancy from 5% to 17%, while decreasing AT1 from 9% to 2%, resulting in a 14‐fold increase in mas‐AT1 receptor binding ratio, compared with the effect of change ACE2. At normal ACE2 levels, ARB therapy did not increase mas receptor occupancy quite as much as ACEi, but did increase AT2 receptor occupancy much more than ACEi.
In the presence of an ARB, the effects of changes in ACE2 on mas receptor occupancy are even more dramatic than with ACEi. Still, an increase or decrease in ACE2 concentration does further increase or decrease the mas‐AT1 ratio. In the presence of an ARB, a 2.5‐fold increase in ACE2 concentration from normal levels increases the mas‐AT1‐ratio 54%.
The primary conclusion of this analysis is that ACEi/ARB therapy has a much more dramatic effect on shifting the balance of the RAAS from the pro‐inflammatory AT1 to the anti‐inflammatory mas arm, relative to any physiologically relevant changes in ACE2 expression.
Parameter sensitivity
We next sought to evaluate the sensitivity of this conclusion to assumptions of model parameter values. Figure 3 illustrates the sensitivity of the key model outputs (i.e., changes in AT1, AT2, and mas receptor occupancy), to each model parameter. Figure 3a considers the sensitivity when ACE2 expression is changed in the absence of treatment, whereas Figure 3b,c consider the sensitivity when ACEi or ARB treatment are added at normal ACE2 levels. For all three cases, initial Ang(1‐7) and AngII concentrations emerged sensitive parameters. However, these parameters are fairly well‐constrained by available clinical and experimental data. Unsurprisingly, all responses to therapy were sensitive to the drug’s fractional target inhibition. We have shown previously that while fractional inhibitions with ARBs and ACEi may vary slightly across drug and dose, they are generally well‐constrained to be within the range of 90–98%. 28 , 29 The change in AT2 and mas receptor occupancy with an ARB was also sensitive to brenin, the strength of negative feedback of AT1 on PRA, which we have also found to be well‐constrained between 0.6 and 0.9 (Gebremichael et al.31 2019; Hallow et al.33 2014). Among parameters with more limited information available for constraining them, Kd, mas (the binding affinity of Ang(1‐7) for the mas receptor) was important for all three cases, while EffACE2,AngII (catalytic efficiency of ACE2 for converting AngII to Ang(1‐7) was sensitive for changes in AT1 and AT2 with ACE2, but not with ACEi or ARB therapy.
Figure 3.
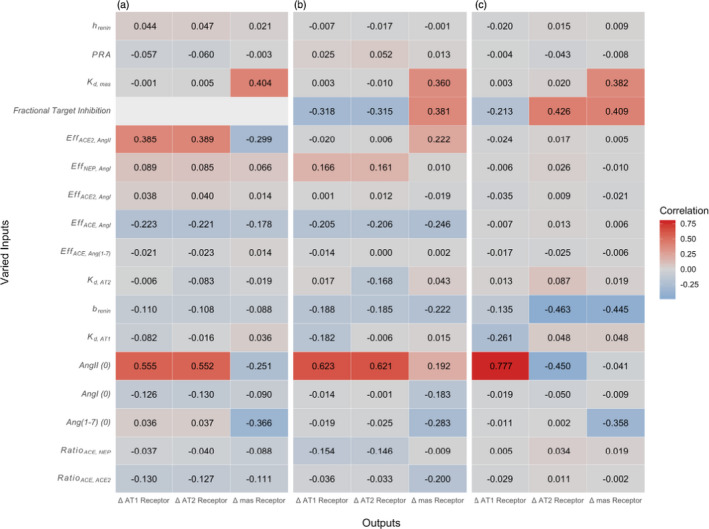
Parameter sensitivity of changes in receptor occupancy with (a) a change in ACE2 with no therapy, (b) initiation of ACE inhibition, and (c) initiation of ARB inhibition. Brightest colors indicate highest correlation between parameter and receptor occupancy. [Colour figure can be viewed at wileyonlinelibrary.com]
To further examine the impact of each of the parameters identified as sensitive, we repeated the earlier simulations of changes in mas‐AT1 occupancy, but this time using extreme values of the sensitive parameter (0.05 – 5X). Supplementary Figure S5 shows the effect of uncertainty in Kd,mas, chosen for illustration because its value is informed by very limited experimental data (one in vitro study, Santos et al. 2003). Although the magnitude of this parameter does have some influence on the magnitude of predicted changes in mas‐AT1‐ratio, the effects are not sufficient to alter the conclusions of this study. In other words, even if the value we used is several‐fold different from the true value, our conclusions would not differ. Thus, the sensitivity analysis provides confidence that the predictions and conclusions of this study robust to uncertainty in parameter values.
Effects of ACE2 downregulation by SARS
As shown in Figure 4 , the predicted effects of 95% ACE2 downregulation induced by SARS on AT1, mas, and the mas‐AT1 ratio are small relative to the effects of ACEi and ARB therapy. Both ACEis and ARBs increase mas while decreasing AT1, thus dramatically increasing the ratio of two. although ACE and ARBs are predicted to have similar effects on the mas‐AT1 ratio, ACEis are predicted to increase mas to a greater extent, whereas ARBs are predicted to suppress AT1 further.
Figure 4.
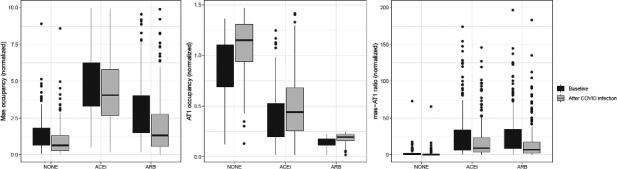
Simulated effect of ACE2 downregulation by severe acute respiratory syndrome‐coronavirus 2 (SARS‐CoV‐2) infection on (a) mas occupancy, (b) AT1 occupancy, and (c) mas‐AT1 ratio, in a population of virtual patients with variable ACE, ACE2, NEP, and renin expression. Points represent simulations outside the interquartile range. Viral downregulation of ACE2 is predicted to decrease mas and increase AT1 binding, but the magnitude of the effect is small relative to the opposing effects of background therapy with ACEis and ARBs, which elevate mas and decrease AT1 occupancy. ACEis, ACE inhibitors; ARBs, angiotensin receptor blockers; COVID‐19, coronavirus disease 2019.
Supplementary Figure S6 explores the effect of variability in four RAAS enzymes (ACE, ACE2, NEP, and renin) on the mas‐AT1‐ratio. Mas‐AT1 ratio is positively correlated with ACE, negatively correlated with NEP, and is not correlated ACE2 or renin. ACE and NEP are correlated with appear to affect the baseline mas‐AT1 ratio (prior to infection) much more than ACE2 or renin. This is true both before and after treatment with ARBs and ACEis. There is no obvious effect of enzyme expressions on the magnitude of change in mas‐AT1 ratio with infection.
This suggests that changes in ACE2 expression due to comorbidities, like diabetes, hypertension, or aging, may be less important than the effects of these comorbidities on other enzymes in the RAAS, particularly ACE and NEP. As described early, we estimated that ACE expression is 10 and 30 times higher than NEP and ACE2 expression. ACE expression has been shown to change with disease. 20 , 38 Thus, even though ACE2 is the enzyme involved in SARS‐CoV‐2 infection of the cell, ACE expression levels may be more important in determining the relative pro‐inflammatory or anti‐inflammatory balance of a subject prior to infection.
A secondary important observation is that although ARBs and ACEis produce similar changes in mas occupancy, ARBs increase AT2 occupancy while ACEis decrease it. These drug‐induced changes in AT2 occupancy are also large relative to the effect of ACE2 changes. Because AT2 is associated with reduced inflammation, it is possible the ARBs may further protect from inflammation relative to ACEis. However, there are limited data available to inform the clinical relevance of changes in AT2 occupancy.
Implications of changes in the mas‐AT1 balance for acute lung injury in COVID‐19
Although we can predict the change in mas receptor occupancy, directly relating the magnitude of change to the potential for protection or exacerbation of lung injury is more challenging. However, Ang(1‐7) infusion studies have shown a dose‐dependent protective effect against experimental lung injury. 16 , 39 , 40 Thus, benchmarking predicted rates of Ang(1‐7) formation against the rates of Ang(1‐7) infusion in these studies may provide a quantitative indication of whether the simulated changes are likely to be large enough to impact lung inflammation and injury.
Changes in mas receptor occupancy occur due to changes in the rate of Ang(1‐7) formation from AngI and AngII, either due a change in enzyme expression (i.e., by SARS‐CoV‐2) or in the rate of formation of the enzyme substrates, AngI and AngII (i.e., by ACEis and ARBs). Figure 5 shows the simulated Ang(1‐7) production rates, before and after infection, with and without ACEi or ARB therapy, relative to the Ang(1‐7) infusion rates used in experimental studies. Although the Ang(1‐7) production rate was increased by therapy and decreased by the virus, in all cases, the changes were much smaller than the rates necessary to produce benefits in experimental lung injury, and were similar to a rate which was found by Zambelli et al. to produce no benefits. 16
Figure 5.

Simulated changes in Ang(1‐7) production rate (bars) with ACEi or ARB treatment, and with infection‐induced ACE2 downregulation, are small relative to rates of Ang(1‐7) infusion rates found to elicit protection from lung injury in experimental models (dashed lines 16 , 39 , 40 ). ACEi, ACE inhibitor; Ang, angiotensin; ARB, angiotensin receptor blocker; COVID‐19, coronavirus disease 2019.
This suggests that although ACEis or ARBs may shift the balance toward the anti‐inflammatory arm of the RAAS, this effect may not be sufficient to produce a therapeutic effect. This may explain why several observational studies have found no difference in outcomes between subjects with COVID‐19 who are or are not on RAAS therapies. 41
ACEi/ARBs have been proposed to potentially increase ACE2. However, this is not supported by a recent systematic review of published studies, which showed varying and inconsistent effects of ACEis/ARBs on ACE2 expression. 14 In addition, a recent meta‐analysis of cohort and case‐control studies found no difference in severe or lethal COVID‐19 between untreated subjects and those receiving an ACEi inhibitor or an ARB. 41 Taken together with these reviews and analyses, this study provides further support for the continuation of ACEi/ARB treatment in patients for whom they are indicated.
Still, interactions among ACEis/ARBs, ACE2, and SAR‐CoV‐2 are complex, and may be dependent on factors that may vary across individuals, including the ACE/ACE2 ratio, viral load, and the body’s immune response, among others. In addition, higher levels of circulating/soluble ACE2 levels may neutralize some SARS‐CoV‐2 virus, which could reduce availability to bind to membrane‐bound ACE2. Thus, these potential interactions deserve further investigation.
Key uncertainties, knowledge gaps, and limitations
One objective of this study was to evaluate the key uncertainties and knowledge gaps in quantifying the effects of ACEis/ARBs in COVID‐19. Some parameters, such as plasma renin activity, AngI, AngII, and Ang(1‐7) have well‐defined clinical ranges. Renin half‐life has been measured in multiple studies, whereas the values for enzyme catalytic efficiencies and receptor binding affinities were based on single in vitro studies. Expression of ACE, ACE2, and neprilysin vary across tissue and cell types, and across species, and thus are much more difficult to quantify. Thus, it was necessary to determine these enzyme concentrations using mathematical constraints and estimating their ratios by fitting experimental data for peptides that are more easily measurable. Thus, there is the highest degree of certainty in values for AngI, AngII, Ang(1‐7), and PRA, whereas uncertainty is greatest for the ACE‐ACE2 and ACE‐NEP ratios. Although there is uncertainty around these enzyme ratios, sensitivity analysis showed that predictions of changes in AT1, AT2, and mas receptor occupancy are robust to inaccuracies in parameter values. Thus, the conclusions of this analysis are unlikely to be impacted if the values used for these ratios are not accurate.
In addition to parameter uncertainty, several limitations should be considered. Model parameters were constrained based on plasma levels of RAAS peptides, and local tissue differences and tissue RAAS were not considered. Our simulations are able to predict changes in mas‐AT1 ratio, but does not have the capability to predict the impact of changes in this ratio on COVID‐19 pathophysiology. A generic ARB and ACEi were modeled, and we did not consider differences within drug classes or with different doses. Interindividual variability in RAAS parameters was not considered. Last, the AngI‐Ang(1‐9) was not explicitly modeled, but is lumped in other forms of AngI degradation. This is justifiable because very little Ang(1‐7) is expected to be formed from Ang(1‐9).
The model did not account for potential negative cooperativity between the two binding sites of ACE. Negative cooperativity between these binding sites would mean that ACE reactions follow hill rather than Michaelis‐Menten kinetics. Adding a Hill coefficient with a value of 0.5 (negative cooperativity) had a small numeric effect (< 12%) on predicted receptor occupancies, but did not impact the conclusions of the study.
This analysis did not address the potential impact of therapy‐induced changes in AT1 and AT2 receptor expression. Limited available data show weak and inconsistent effects of ACEis on AT1 expression, but consistently show that ARBs reduce AT1 expression. 42 , 43 For AT2, data for defining both the binding affinity as well as therapy‐induced changes in expression and the clinical consequences of changes in AT2 activity and expression are even more limited.
CONCLUSION
Given the ongoing debate surrounding the use of ACEis and ARBs in the setting of COVID‐19, this study aimed to integrate available information about the RAAS, effects of SARS‐CoV‐2 infection, and its comorbidities on the RAAS to provide quantitative predictions of the effects of ACEis and ARBs on the pro‐inflammatory/anti‐inflammatory balance of the RAAS. There are several key conclusions from this analysis. First, our simulations indicate that ACEi/ARB treatment prior to SARS‐CoV‐2 infection increases the ratio of mas to AT1 receptor occupancy many fold. Thus, in patients already taking an ACEi/ARB before infection, the anti‐inflammatory arm of the RAAS would already be much more dominant. Second, effects of changes in ACE2 expression with comorbidities of diabetes, hypertension, or aging on the mas‐AT1 receptor ratio are relatively small, compared with the effects of ACEis/ARBs. Changes in ACE expression are predicted to be more important than ACE2 in determining the baseline inflammatory/pro‐inflammatory balance of the RAAS. Third, pro‐inflammatory shifts in the mas‐AT1 ratio due to ACE2 downregulation by SARS‐CoV‐2 infection are predicted to be small relative to anti‐inflammatory shifts induced by ACEi/ARB. Last, predicted changes in the Ang(1‐7) production rate with ACEi/ARB therapy, comorbidities, or infection were all small relative to the exogenous Ang(1‐7) infusion rates shown experimentally to protect against acute lung injury, suggests that changes in the ACE2‐Ang(1‐7)‐mas arm may not be large enough to play a major role in COVID‐19 pathophysiology.
Funding
K.M.H. has received research funding from AstraZeneca, Pfizer, and Merck within the last 36 months.
Conflict of Interest
The authors declared no competing interests for this work.
Author Contributions
K.M.H. and I.D. wrote the manuscript. K.M.H. designed the research. K.M.H. and I.D. performed the research, and analyzed the data.
Supporting information
Supplementary Material
Acknowledgments
The authors gratefully acknowledge the contributions of Arthur Lo, Anna Georgieva, Gabriel Helmlinger, and Jeni Beh in the development of the RAAS model.
References
- 1. Huang, C. et al. Clinical features of patients infected with 2019 novel coronavirus in Wuhan, China. Lancet 395, 497–506 (2020). [DOI] [PMC free article] [PubMed] [Google Scholar]
- 2. Passarella, P. , Kiseleva, T.A. , Valeeva, F.V. & Gosmanov, A.R. Hypertension management in diabetes: 2018 update. Diabetes Spectr. 31, 218–224 (2018). [DOI] [PMC free article] [PubMed] [Google Scholar]
- 3. Whelton, P.K. et al. 2017 ACC/AHA/AAPA/ABC/ACPM/AGS/APhA/ASH/ASPC/NMA/PCNA Guideline for the Prevention, Detection, Evaluation, and Management of High Blood Pressure in Adults: Executive Summary: a report of the American College of Cardiology/American Heart Association Task Force on Clinical Practice Guidelines. Circulation 138, e426–e483 (2018). [DOI] [PubMed] [Google Scholar]
- 4. Guo, J. , Huang, Z. , Lin, L. & Lv, J. Coronavirus disease 2019 (COVID‐19) and cardiovascular disease: a viewpoint on the potential influence of angiotensin‐converting enzyme inhibitors/angiotensin receptor blockers on onset and severity of severe acute respiratory syndrome coronavirus 2 infection. J. Am. Heart Assoc. 9, e016219 (2020). [DOI] [PMC free article] [PubMed] [Google Scholar]
- 5. de Abajo, F.J. et al. Use of renin‐angiotensin‐aldosterone system inhibitors and risk of COVID‐19 requiring admission to hospital: a case‐population study. Lancet 395, 1705–1714 (2020). [DOI] [PMC free article] [PubMed] [Google Scholar]
- 6. Son, M. , Seo, J. & Yang, S. Association between renin‐angiotensin‐aldosterone system inhibitors and COVID‐19 infection in South Korea. Hypertension 76, 742–749 (2020). [DOI] [PubMed] [Google Scholar]
- 7. Trifirò, G. et al. Renin‐angiotensin‐aldosterone system inhibitors and risk of death in patients hospitalised with COVID‐19: a retrospective Italian cohort study of 43,000 patients. Drug Saf. 43, 1297–1308 (2020). [DOI] [PMC free article] [PubMed] [Google Scholar]
- 8. Bozkurt, B. , Kovacs, R. & Harrington, B. Joint HFSA/ACC/AHA statement addresses concerns Re: using RAAS antagonists in COVID‐19. J. Cardiac Fail. 26, 370 (2020). [DOI] [PMC free article] [PubMed] [Google Scholar]
- 9. Derington, C.G. et al. Trends in antihypertensive medication monotherapy and combination use among US adults, National Health and Nutrition Examination Survey 2005–2016. Hypertension 75, 973–981 (2020). [DOI] [PMC free article] [PubMed] [Google Scholar]
- 10. Verdecchia, P. , Cavallini, C. , Spanevello, A. & Angeli, F. The pivotal link between ACE2 deficiency and SARS‐CoV‐2 infection. Eur. J. Intern. Med. 76, 14–20 (2020). [DOI] [PMC free article] [PubMed] [Google Scholar]
- 11. Dandona, P. , Dhindsa, S. , Ghanim, H. & Chaudhuri, A. Angiotensin II and inflammation: the effect of angiotensin‐converting enzyme inhibition and angiotensin II receptor blockade. J. Hum. Hypertens. 21, 20–27 (2007). [DOI] [PubMed] [Google Scholar]
- 12. Simões e Silva, A.C. , Silveira, K.D. , Ferreira, A.J. & Teixeira, M.M . ACE2, angiotensin‐(1‐7) and Mas receptor axis in inflammation and fibrosis. Br. J. Pharmacol. 169, 477–492 (2013). [DOI] [PMC free article] [PubMed] [Google Scholar]
- 13. Fang, L. , Karakiulakis, G. & Roth, M. Are patients with hypertension and diabetes mellitus at increased risk for COVID‐19 infection? Lancet Resp. Med. 8, e21 (2020). [DOI] [PMC free article] [PubMed] [Google Scholar]
- 14. Sriram, K. & Insel, P.A. Risks of ACE inhibitor and ARB usage in COVID‐19: evaluating the evidence. Clin. Pharmacol. Ther. 108, 236–241 (2020). [DOI] [PMC free article] [PubMed] [Google Scholar]
- 15. Tay, M.Z. , Poh, C.M. , Rénia, L. , MacAry, P.A. & Ng, L.F.P. The trinity of COVID‐19: immunity, inflammation and intervention. Nat. Rev. Immunol. 20, 363–374 (2020). [DOI] [PMC free article] [PubMed] [Google Scholar]
- 16. Zambelli, V. et al. Angiotensin‐(1–7) improves oxygenation, while reducing cellular infiltrate and fibrosis in experimental acute respiratory distress syndrome. Intens. Care Med. Exp. 3, 44 (2015). [DOI] [PMC free article] [PubMed] [Google Scholar]
- 17. Imai, Y. , Kuba, K. & Penninger, J.M. The discovery of angiotensin‐converting enzyme 2 and its role in acute lung injury in mice. Exp. Physiol. 93, 543–548 (2008). [DOI] [PMC free article] [PubMed] [Google Scholar]
- 18. Imai, Y. et al. Angiotensin‐converting enzyme 2 protects from severe acute lung failure. Nature 436, 112–116 (2005). [DOI] [PMC free article] [PubMed] [Google Scholar]
- 19. Gaddam, R.R. , Chambers, S. & Bhatia, M. ACE and ACE2 in inflammation: a tale of two enzymes. Inflamm. Allergy Drug Targets 13, 224–234 (2014). [DOI] [PubMed] [Google Scholar]
- 20. Wysocki, J. et al. ACE and ACE2 activity in diabetic mice. Diabetes 55, 2132–2139 (2006). [DOI] [PubMed] [Google Scholar]
- 21. Anguiano, L. et al. Circulating angiotensin‐converting enzyme 2 activity in patients with chronic kidney disease without previous history of cardiovascular disease. Nephrol. Dial. Transplant. 30, 1176–1185 (2015). [DOI] [PMC free article] [PubMed] [Google Scholar]
- 22. Xie, X. , Chen, J. , Wang, X. , Zhang, F. & Liu, Y. Age‐ and gender‐related difference of ACE2 expression in rat lung. Life Sci. 78, 2166–2171 (2006). [DOI] [PMC free article] [PubMed] [Google Scholar]
- 23. Yoon, H.E. et al. Age‐associated changes in the vascular renin‐angiotensin system in mice. Oxid. Med. Cell Longev. 2016, 6731093 (2016). [DOI] [PMC free article] [PubMed] [Google Scholar]
- 24. Kuba, K. et al. A crucial role of angiotensin converting enzyme 2 (ACE2) in SARS coronavirus‐induced lung injury. Nat. Med. 11, 875–879 (2005). [DOI] [PMC free article] [PubMed] [Google Scholar]
- 25. Wrapp, D. et al. Cryo‐EM structure of the 2019‐nCoV spike in the prefusion conformation. Science 367, 1260–1263 (2020). [DOI] [PMC free article] [PubMed] [Google Scholar]
- 26. Rice, G.I. , Thomas, D.A. , Grant, P.J. , Turner, A.J. & Hooper, N.M. Evaluation of angiotensin‐converting enzyme (ACE), its homologue ACE2 and neprilysin in angiotensin peptide metabolism. Biochem. J. 383, 45–51 (2004). [DOI] [PMC free article] [PubMed] [Google Scholar]
- 27. Vickers, C. et al. Hydrolysis of biological peptides by human angiotensin‐converting enzyme‐related carboxypeptidase. J. Biol. Chem. 277, 14838–14843 (2002). [DOI] [PubMed] [Google Scholar]
- 28. Gebremichael, Y. , Lahu, G. , Vakilynejad, M. & Hallow, K.M. Benchmarking renin suppression and blood pressure reduction of direct renin inhibitor imarikiren through quantitative systems pharmacology modeling. J. Pharmacokinet. Pharmacodyn. 46, 15–25 (2019). [DOI] [PubMed] [Google Scholar]
- 29. Hallow, K.M. et al. A model‐based approach to investigating the pathophysiological mechanisms of hypertension and response to antihypertensive therapies: extending the Guyton model. Am. J. Physiol. Regul. Integr. Comp. Physiol. 306, R647–R662 (2014). [DOI] [PubMed] [Google Scholar]
- 30. Bayes‐Genis, A. , Barallat, J. & Richards, A.M. A test in context: neprilysin: function, inhibition, and biomarker. J. Am. Coll. Cardiol. 68, 639–653 (2016). [DOI] [PubMed] [Google Scholar]
- 31. Hamming, I. , Timens, W. , Bulthuis, M.L. , Lely, A.T. , Navis, G. & van Goor, H. Tissue distribution of ACE2 protein, the functional receptor for SARS coronavirus. A first step in understanding SARS pathogenesis. J. Pathol. 203, 631–637 (2004). [DOI] [PMC free article] [PubMed] [Google Scholar]
- 32. Roca‐Ho, H. , Riera, M. , Palau, V. , Pascual, J. & Soler, M.J. Characterization of ACE and ACE2 expression within different organs of the NOD mouse. Int. J. Mol. Sci. 18, 563 (2017). [DOI] [PMC free article] [PubMed] [Google Scholar]
- 33. Yamaleyeva, L.M. , Gilliam‐Davis, S. , Almeida, I. , Brosnihan, K.B. , Lindsey, S.H. & Chappell, M.C. Differential regulation of circulating and renal ACE2 and ACE in hypertensive mRen2.Lewis rats with early‐onset diabetes. Am. J. Physiol. Renal Physiol. 302, F1374–F1384 (2012). [DOI] [PMC free article] [PubMed] [Google Scholar]
- 34. Yamamoto, K. , Chappell, M.C. , Brosnihan, K.B. & Ferrario, C.M . In vivo metabolism of angiotensin I by neutral endopeptidase (EC 3.4.24.11) in spontaneously hypertensive rats. Hypertension 19, 692–696 (1992). [DOI] [PubMed] [Google Scholar]
- 35. Kocks, M.J. , Lely, A.T. , Boomsma, F. , de Jong, P.E. & Navis, G. Sodium status and angiotensin‐converting enzyme inhibition: effects on plasma angiotensin‐(1–7) in healthy man. J. Hypertens. 23, 597–602 (2005). [DOI] [PubMed] [Google Scholar]
- 36. McKay, M.D. , Beckman, R.J. & Conover, W.J. Comparison of three methods for selecting values of input variables in the analysis of output from a computer code. Technometrics 21, 239–245 (1979). [Google Scholar]
- 37. Glowacka, I. et al. Differential downregulation of ACE2 by the spike proteins of severe acute respiratory syndrome coronavirus and human coronavirus NL63. J. Virol. 84, 1198–1205 (2010). [DOI] [PMC free article] [PubMed] [Google Scholar]
- 38. Tikellis, C. , Wookey, P.J. , Candido, R. , Andrikopoulos, S. , Thomas, M.C. & Cooper, M.E. Improved islet morphology after blockade of the renin‐ angiotensin system in the ZDF rat. Diabetes 53, 989–997 (2004). [DOI] [PubMed] [Google Scholar]
- 39. Klein, N. et al. Angiotensin‐(1–7) protects from experimental acute lung injury. Crit. Care Med. 41, e334–e343 (2013). [DOI] [PubMed] [Google Scholar]
- 40. Supé, S. , Kohse, F. , Gembardt, F. , Kuebler, W.M. & Walther, T. Therapeutic time window for angiotensin‐(1–7) in acute lung injury. Br. J. Pharmacol. 173, 1618–1628 (2016). [DOI] [PMC free article] [PubMed] [Google Scholar]
- 41. Flacco, M.E. et al. Treatment with ACE inhibitors or ARBs and risk of severe/lethal COVID‐19: a meta‐analysis. Heart 106, 1519–1524 (2020). [DOI] [PMC free article] [PubMed] [Google Scholar]
- 42. Sechi, L.A. et al. Tissue‐specific regulation of type 1 angiotensin II receptor mRNA levels in the rat. Hypertension 28, 403–408 (1996). [DOI] [PubMed] [Google Scholar]
- 43. Bastien, N.R. , Servant, M.J. , Gutkowska, J. , Meloche, S. & Lambert, C. Downregulation of cardiac AT1‐receptor expression and angiotensin II concentrations after long‐term blockade of the renin‐angiotensin system in cardiomyopathic hamsters. J. Cardiovasc. Pharmacol. 34, 402–406 (1999). [DOI] [PubMed] [Google Scholar]
- 44. Bhuiyan, M.A. , Hossain, M. , Ishiguro, M. , Nakamura, T. & Nagatomo, T. Engineered mutation of some important amino acids in angiotensin II type 1 (AT1) receptor increases the binding affinity of AT1‐receptor antagonists. J. Pharmacol. Sci. 113, 57–65 (2010). [DOI] [PubMed] [Google Scholar]
- 45. Santos, R.A.S. et al. Angiotensin‐(1–7) is an endogenous ligand for the G protein‐coupled receptor Mas. Proc. Natl. Acad. Sci. 100, 8258–8263 (2003). [DOI] [PMC free article] [PubMed] [Google Scholar]
- 46. Soro‐Paavonen, A. et al. Circulating ACE2 activity is increased in patients with type 1 diabetes and vascular complications. J. Hypertens. 30, 375–383 (2012). [DOI] [PubMed] [Google Scholar]
- 47. Reich, H.N. , Oudit, G.Y. , Penninger, J.M. , Scholey, J.W. & Herzenberg, A.M. Decreased glomerular and tubular expression of ACE2 in patients with type 2 diabetes and kidney disease. Kidney Int. 74, 1610–1616 (2008). [DOI] [PubMed] [Google Scholar]
- 48. Konoshita, T. et al. Tissue gene expression of renin‐angiotensin system in human type 2 diabetic nephropathy. Diabetes Care 29, 848–852 (2006). [DOI] [PubMed] [Google Scholar]
- 49. Lely, A. , Hamming, I. , van Goor, H. & Navis, G. Renal ACE2 expression in human kidney disease. J. Pathol. 204, 587–593 (2004). [DOI] [PubMed] [Google Scholar]
- 50. Ye, M. , Wysocki, J. , Naaz, P. , Salabat, M.R. , LaPointe, M.S. & Batlle, D. Increased ACE 2 and decreased ACE protein in renal tubules from diabetic mice: a renoprotective combination? Hypertension 43, 1120–1125 (2004). [DOI] [PubMed] [Google Scholar]
- 51. Crackower, M.A. et al. Angiotensin‐converting enzyme 2 is an essential regulator of heart function. Nature 417, 822–828 (2002). [DOI] [PubMed] [Google Scholar]
- 52. Swärd, P. , Edsfeldt, A. , Reepalu, A. , Jehpsson, L. , Rosengren, B.E. & Karlsson, M.K. Age and sex differences in soluble ACE2 may give insights for COVID‐19. Critical Care (London England) 24, 221 (2020). [DOI] [PMC free article] [PubMed] [Google Scholar]
- 53. Bunyavanich, S. , Do, A. & Vicencio, A. Nasal gene expression of angiotensin‐converting enzyme 2 in children and adults. JAMA 323, 2427–2429 (2020). [DOI] [PMC free article] [PubMed] [Google Scholar]
Associated Data
This section collects any data citations, data availability statements, or supplementary materials included in this article.
Supplementary Materials
Supplementary Material