

Abstract
Objectives
Lung ultrasound (LUS) can accurately diagnose several pulmonary diseases, including pneumothorax, effusion, and pneumonia. LUS may be useful in the diagnosis and management of COVID‐19.
Methods
This study was conducted at two United States hospitals from 3/21/2020 to 6/01/2020. Our inclusion criteria included hospitalized adults with COVID‐19 (based on symptomatology and a confirmatory RT‐PCR for SARS‐CoV‐2) who received a LUS. Providers used a 12‐zone LUS scanning protocol. The images were interpreted by the researchers based on a pre‐developed consensus document. Patients were stratified by clinical deterioration (defined as either ICU admission, invasive mechanical ventilation, or death within 28 days from the initial symptom onset) and time from symptom onset to their scan.
Results
N = 22 patients (N = 36 scans) were included. Eleven (50%) patients experienced clinical deterioration. Among N = 36 scans, only 3 (8%) were classified as normal. The remaining scans demonstrated B‐lines (89%), consolidations (56%), pleural thickening (47%), and pleural effusion (11%). Scans from patients with clinical deterioration demonstrated higher percentages of bilateral consolidations (50 versus 15%; P = .033), anterior consolidations (47 versus 11%; P = .047), lateral consolidations (71 versus 29%; P = .030), pleural thickening (69 versus 30%; P = .045), but not B‐lines (100 versus 80%; P = .11). Abnormal findings had similar prevalences between scans collected 0–6 days and 14–28 days from symptom onset.
Discussion
Certain LUS findings may be common in hospitalized COVID‐19 patients, especially for those that experience clinical deterioration. These findings may occur anytime throughout the first 28 days of illness. Future efforts should investigate the predictive utility of these findings on clinical outcomes.
Keywords: COVID‐19, ICU, outcomes, POCUS, SARS‐CoV‐2, ultrasound
Abbreviations
- AAL
anterior axillary line
- CT
computed tomography
- IRR
interrater reliability
- LUS
Lung ultrasound
- PACS
picture archiving and communication system
- PAL
posterior axillary line
- PCR
polymerase chain reaction
- POCUS
point‐of‐care ultrasound
- PSM
parasternal margin
- SL
scapular line
Point‐of‐care ultrasound (POCUS) has the potential to transform healthcare delivery in the era of COVID‐19 with its diagnostic and therapeutic expediency. 1 It can be performed by clinicians already at the bedside, which permits an immediate and augmented assessment of a patient. 2
POCUS devices, particularly handheld devices, are often cheaper than traditional radiological equipment such as X‐ray or computed tomography (CT) machines, which makes POCUS ideal for surge scenarios and other resource‐limited settings. 3 Since providers using POCUS are concomitantly at the bedside assessing patients, POCUS may reduce personal protective equipment usage by radiological technicians or the need to decontaminate larger radiological equipment. 4
Despite the potential for POCUS to improve clinical care and increasing reports on the sonographic manifestations of COVID‐19, 5 , 6 the predictive utility of POCUS on clinical outcomes has yet to be determined. However, lung ultrasound (LUS) has already been shown to accurately diagnose a variety of disease states such as pneumothorax, pleural effusions, pneumonia, and interstitial lung disease. 2 , 7 Common pathological findings with LUS include B‐lines, consolidations, and pleural effusions (Figure 1). B‐lines are vertically oriented hyperechoic artifacts that arise from the pleura. They are caused by thickened interlobular septa due to alveolar‐interstitial disorders such as pneumonia, cardiogenic edema, acute respiratory distress syndrome, or abnormal collagen deposition (eg, idiopathic pulmonary fibrosis). 8 , 9 Consolidations manifest as dense, echogenic lung parenchyma with occasional air bronchograms (Figure 1). Consolidations may affect more distal airways first (resulting in sub‐pleural consolidations) and eventually result in lobar collapse with more substantial involvement (eg, translobar consolidation; Figure 1). 8 , 9 Effusions manifest as dark, hypoechoic bands and may accompany consolidations (Figure 1). It is not well known which LUS findings are common in COVID‐19 and if these findings have meaningful diagnostic or prognostic utility.
Figure 1.
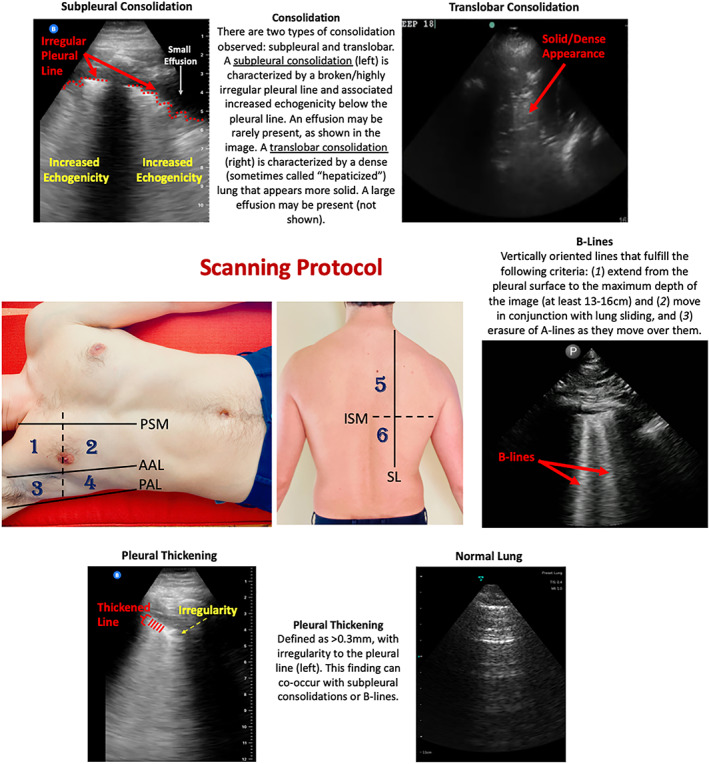
Scanning Protocol and Lung Ultrasound Findings in COVID‐19 Patients. This study utilized a 12‐zone protocol. 4 On each hemithorax, there are 6 zones. The exam begins on the patient's right side. Zones 1–2 (anterior zones) are between the parasternal margin (PSM) and the anterior axillary line (AAL) and are best obtained in the mid‐clavicular line. Zones 3–4 (lateral zones) are between the anterior axillary line (AAL) and posterior axillary line (PAL) and are best obtained in the mid‐axillary line. The nipple line serves as a bisecting area between these zones. Zones 5–6 (posterior zones) are medial to the scapular line (SL) and are bisected by the inferior scapular margin (ISM). The zone areas are repeated on the contralateral hemithorax (starting with zone 7). If a 12‐zone protocol could not be obtained, then an eight‐zone protocol (which excludes zones 5–6) was obtained. This figure contains an overview of the observed ultrasound findings based on previously described terminology. 4 , 5 , 6
In this small pilot study, we characterize LUS findings of patients admitted to our hospitals with COVID‐19 and stratify these findings by time, location, and illness severity.
Methods
Participants and Setting
This was a prospective cohort study conducted at two medical centers in the United States from 3/21/2020 to 6/01/2020. Our inclusion criteria included hospitalized adults with COVID‐19 (based on symptomatology 10 plus a confirmatory nasopharyngeal PCR for SARS‐CoV‐2) who received a lung ultrasound (LUS) during their hospitalization. Patients who did not receive a LUS were excluded. This study was approved by the Stanford University and the University of California, San Francisco IRBs. A waiver of consent was obtained by both institutions.
Scanning Protocol and Interpretation
All patients included in this study were scanned during their initial evaluation on admission or subsequent hospital days. Provider discretion determined whether to perform an initial or follow‐up POCUS examination for each patient. For example, if a provider determined that a patient was clinically stable and there was no reason to perform a repeat LUS, then the examination was deferred to avoid unnecessary provider exposure. Providers were instructed to use a 12‐zone scanning protocol for pulmonary views (Figure 1) and save 6 second clips of each lung zone. 11 If a 12‐zone protocol could not be performed due to the patient's condition (eg, the posterior lung zones were not accessible due to intubation), then a modified 8‐zone protocol capturing the anterior and lateral lung fields was performed. 11 , 12 This study utilized several POCUS devices, including Butterfly IQ™, Vave™, Lumify™, and Sonosite™, which represent the commercially available portable machines at our institutions. All devices were set to the “lung” preset for scanning. All collected images were saved to a local picture archiving and communication system (PACS) that is used for research purposes.
All POCUS scans were obtained by three of the study authors (YD, AK, and JK). These authors are credentialed in POCUS for patient care at their respective institutions. YD previously completed an Emergency Ultrasound Fellowship. JK is the director of POCUS for the Stanford Department of Medicine. AK is an instructor for the Society of Hospital Medicine POCUS Certification Program.
Three of the researchers (YD, AK, and JK) interpreted the saved images based on a consensus document developed by the study authors and previously accepted definitions of LUS findings (Appendix). 11 , 13 , 14 The researchers (YD, AK, and JK) completed a 1‐hour calibration session on LUS interpretation based on the consensus document prior to image interpretation. In this calibration session, the researchers were shown clips of LUS findings and discussed their interpretation of the images. Following the calibration session, a researcher (YD, AK, or JK) would enter their interpretation of the images they personally collected into an electronic research database (REDCap). A second researcher would then independently review the scan and enter their interpretation on a second form. The researchers would then meet to compare their interpretation forms. If there was disagreement of interpretation, the two researchers would attempt to reach a consensus. If no consensus could be reached, then the item in question was not entered into the database. For this analysis, interrater reliability (IRR) analysis was not performed. However, previous investigations have demonstrated moderate to excellent IRR for LUS across different experience levels or probe types. 15 , 16 , 17 We have also demonstrated that LUS for COVID‐19 has moderate to substantial IRR. 18 This analysis was conducted at patients hospitalized at our institutions with COVID‐19, but they were not included in this analysis to minimize repeated interpretations of the same scans.
Analysis
This analysis stratified LUS findings by (A) their frequency and location of appearance, (B) their timing from symptom onset, and (C) patient illness severity. The locations for each finding were stratified based on anterior, lateral, and posterior lung zones, as shown in Figure 1. In addition, LUS findings were stratified by time from symptom onset to the LUS scan. The time periods were analyzed in the following intervals: early (0–6 days), middle (7–13 days), and late (14–28 days; Figure 2). Finally, patients were stratified by the presence of clinical deterioration (defined as either ICU admission, invasive mechanical ventilation, or death within 28 days from the initial symptom onset) versus not. Clinical outcomes were assessed via retrospective chart reviews. Summary statistics and the frequency for each finding were calculated. Fisher's Exact Tests were performed to compare the frequencies of findings. Wilcoxon Rank Sum testing was used to compare medians for certain findings. All statistical analyses were performed using R (Vienna, Austria).
Figure 2.
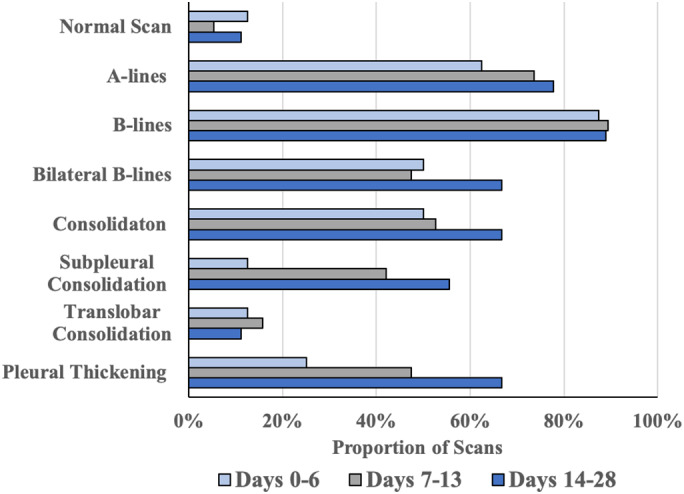
Distribution of Lung Ultrasound Findings by Time. Lung findings were stratified by days from symptom onset to the ultrasound scan in the following manner: early (0–6 days, n = 8), middle (7–13 days, n = 19), and late (14–28 days, n = 9). The portion of scans that contained the above findings is displayed on the horizontal axis. Based on Fisher Exact Analysis, there was no significant change in the frequency of any finding across the time periods. There was also no significant difference in frequency when comparing the early or late scans for any given finding.
Results
Patients
A total of N = 22 eligible patients were included in our study (Table 1). N = 15 patients were scanned at Stanford University and N = 7 patients were scanned at ValleyCare Hospital. Approximately 6 of the 22 patients received multiple scans, resulting in N = 36 total scans that were included in the analysis (Table 1). N = 18 scans (50%) were 12‐point LUS examinations and N = 18 scans (50%) were 8‐point LUS examinations (Table 1). Eleven (50%) patients experienced clinical deterioration (Table 1).
Table 1.
Ultrasound Findings Among Patients Hospitalized With COVID‐19
| All Patients | Clinical Deterioration | No Clinical Deterioration | P‐value | |
|---|---|---|---|---|
| No. of patients | 22 | 11 | 11 | |
| Median age [IQR] | 47 [33–72] | 43 [32–69] | 55 [33–87] | .19 |
| BMI [IQR] | 29 [27–35] | 33 [27–36] | 28 [26–35] | .61 |
| Male (%) | 12 (55%) | 8 (72%) | 6 (55%) | .39 |
| Days from symptom onset to scan [IQR] | 10 [6–13] | 12 [7–23] | 9 [6–12] | .21 |
| Admitted to ICU | 11 | — | ||
| Received mechanical ventilation | 6 | — | ||
| Death | 1 | — | ||
| Number of scans performed | 36 | 16 | 20 | |
| Anterior lung zone scans | 33 | 15 | 18 | |
| Lateral lung zone scans | 31 | 14 | 17 | |
| Posterior lung zone scans | 18 | 7 | 11 | |
| Normal scan | 3 (8%) | 0 (0%) | 3 (15%) | .24 |
| B‐lines | 32 (89%) | 16 (100%) | 16 (80%) | .11 |
| ≥3 B‐Lines in any zone | 32 (89%) | 14 (88%) | 18 (90%) | 1.00 |
| Bilateral B‐lines | 19 (53%) | 10 (63%) | 9 (45%) | .34 |
| Anterior zone B‐lines | 23 (70%) | 13 (87%) | 10 (56%) | .07 |
| Lateral zone B‐lines | 23 (74%) | 9 (64%) | 14 (82%) | .41 |
| Posterior zone B‐lines | 12 (67%) | 5 (71%) | 7 (63.6%) | 1.00 |
| Zones per scan with B‐lines | 4 [1–8] | 6 [3–8] | 3.5 [1–8] | .37 |
| Consolidation | 20 (56%) | 11 (69%) | 9 (45%) | .19 |
| Translobar consolidation | 5 (25%) | 3 (19%) | 2 (10%) | .63 |
| Subpleural consolidation | 14 (70%) | 7 (44%) | 7 (35%) | .73 |
| Bilateral consolidation | 11 (31%) | 8 (50%) | 3 (15%) | .034 * |
| Anterior consolidation | 9 (27%) | 7 (47%) | 2 (11%) | .047 * |
| Lateral consolidation | 15 (48%) | 10 (71%) | 5 (29%) | .032 * |
| Posterior consolidation | 9 (50%) | 3 (43%) | 6 (55%) | 1.00 |
| Pleural effusion | 4 (11%) | 4 (25%) | 0 (0%) | .031 * |
| Pleural thickening | 17 (47%) | 11 (69%) | 6 (30%) | .043 * |
Patients were further stratified by clinical deterioration (defined as any occurrence of ICU admission, invasive mechanical ventilation, or death within 28 days from initial symptoms onset). Proportions are based on the number of scans for a given lung zone. Median and IQR are displayed where appropriate. BMI, Body Mass Index; IQR, interquartile range.
P <.05.
Ultrasound Findings by Frequency and Location
Among the 36 lung scans collected, only 3 (8%) were classified as normal (Table 1). The remaining scans had the following abnormalities: presence of B‐lines (n = 32, 89%), consolidations (n = 20, 56%), pleural thickening (n = 17, 47%), and pleural effusion (n = 4, 11%; Table 1). Out of 20 scans with consolidations, 14 (70%) were subpleural and 5 (25%) were translobar. A‐lines were present in 26 (72%) of patients, although they were observed in the majority of the collected lung zones in only n = 5 (14%) of patients.
When stratified by location, B‐lines occurred frequently in all lung zones (Anterior: 70%, Lateral: 74%, and Posterior: 67%). In contrast, consolidations (any subtype) differed by lung zone (Anterior: 27%, Lateral: 48%, Posterior 50%). Table 1 displays the commonly observed LUS findings by their location of appearance.
Ultrasound Findings by Time
Ultrasound findings were stratified by time from symptom onset to the scan based on the following time periods: early (0–6 days, n = 8), middle (7–13 days, n = 19), and late (14–28 days, n = 9). B‐lines, consolidations (any subtype), and pleural thickening did not significantly differ in frequency over these time periods (Figure 2). When the early (0–6 days) and late (14–28 days) periods were directly compared, there was also no significant difference in the frequency of these findings. Notably, B‐lines were found in >80% of scans across all time periods (Figure 2).
Ultrasound Findings with Clinical Deterioration
Scans collected from patients who experienced clinical deterioration versus not demonstrated higher percentages of bilateral consolidation (50 versus 15%; P = .033), anterior consolidation (47 versus 11%; P = .047), lateral consolidation (71 versus 29%; P = .031), pleural effusions (69 versus 30%; P = .031), and pleural thickening (69 versus 30%; P = .043; Table 1). B‐lines did not significantly differ between patients who experienced clinical deterioration versus not, regardless of location, count (eg, 3 or more per field), or number of involved zones (Table 1).
Discussion
In this pilot study, we characterize lung ultrasound findings for patients admitted to the hospital with COVID‐19, and further stratify these findings by location, time, and patients who experienced clinical deterioration (ICU admission, mechanical ventilation, or death). Common findings included B‐lines, consolidation (including subpleural consolidations), and pleural thickening. Effusions were rare, which is consistent with CT studies from COVID‐19 patients. 19 Several LUS findings were more commonly encountered in patients who were critically ill (anterior/lateral/bilateral consolidations, effusions, and pleural thickening). The frequency of these findings did not differ over time, suggesting that their presence, regardless of when they are detected, may be associated with a worsened clinical outcome such as ICU admission.
LUS may be used for the early detection of COVID‐19, 20 and there is growing interest in whether the sonographic or radiographic findings of COVID‐19 are predictive of clinical outcomes, as this could impact patient triage or resource utilization. 4 Computed tomography is as accurate as a nasopharyngeal polymerase chain reaction (PCR) for the diagnosis of COVID‐19, 21 and predicts the likelihood of mechanical ventilation or death. 22 , 23 , 24 However, radiological studies are resource intensive: time must be spent decontaminating the machines and the lack of real‐time interpretation delays informed clinical decision‐making. In our sample, only N = 2 patients received a CT scan as part of their triage or subsequent hospitalization, which may be reflective of these constraints. While POCUS may represent an expedient and cost‐effective modality for the clinical evaluation for COVID‐19, it is unclear if POCUS findings can predict clinical outcomes with COVID‐19. Previously described manifestations of COVID‐19 include B‐lines, subpleural consolidations, pleural thickening and a low frequency of pleural effusions. 4 , 20 These findings correlate with findings observed with COVID‐19 with computed tomography, including peripheral nodularity and ground‐glass consolidations (Appendix). 25 , 26
Which findings may be of the most clinical importance? Previous descriptions of LUS findings with COVID‐19 have described the abundance of B‐lines. 6 Bilateral B‐line involvement may be associated with critical illness, 27 although other authors have demonstrated B‐lines may be common throughout the early and late stages of COVID‐19 regardless of illness severity. 28 In this analysis, B‐lines were common for both patients who did and did not experience clinical deterioration. They frequently appeared in all lung zones, and they persisted throughout the 28‐day scanning period. In contrast, anterior/lateral/bilateral consolidations and pleural thickening occurred more frequently in patients who experienced clinical deterioration. Given the frequency of these findings did not significantly vary between the early or late stages of illness in our analysis, their absolute presence may be important indicators of impending clinical deterioration. As investigators begin to create LUS scoring systems that are based on specific findings to help identify patients at risk for deterioration, 29 our results suggest that the location of LUS findings (eg, anterior or lateral involvement) may be important markers when assessing sonographic severity.
There are several limitations to this study. Certain patient conditions, such as intubation or patient mobility, affected the provider from acquiring all 12 zones, particularly the posterior zones. Therefore, not all patients received a 12‐zone scan, which limits the generalizability of the findings' frequencies by location. Although the providers completed a 1‐hour calibration session and used a consensus document to guide their interpretation, the interrater reliability of COVID‐19 LUS findings remains less established. However, LUS has previously been shown to have moderate to substantial interobserver agreement. 15 , 16 , 17 Patients were scanned based on provider discretion, but it is possible that patients with certain features on X‐ray or CT were more likely to receive a LUS. Finally, our population included only patients hospitalized for COVID‐19 and the findings may not be generalizable to outpatient or triage settings.
In conclusion, we found that previously described LUS manifestations of COVID‐19 (ie, B‐lines, consolidation, and pleural thickening) are common over the first 28 days of illness and may not dramatically change during this period, at least among hospitalized patients. The location of certain findings (ie, anterior, lateral, or bilateral consolidation), as well as the presence of more rare findings (pleural effusion), may be more common in critically ill patients. Since these findings appeared throughout our 28‐day scanning period among hospitalized patients, their presence at any time may be important harbingers of clinical deterioration. As this study was preliminary in nature, future efforts should investigate the predictive utility of consolidations, pleural thickening and effusions for clinical deterioration at triage and compare them to traditional radiological studies such as X‐rays or CTs. Finally, ongoing research efforts that attempt to create LUS severity scores should incorporate the location of these findings to promote more impactful evaluations.
Supporting information
Appendix Figure 1 POCUS Assessments for COVID‐19. CT, computed tomography; ARDS, acute respiratory distress syndrome.
Appendix Table 1. Demographic Features. IQR, interquartile range; ICU, intensive care unit; COPD, chronic obstructive pulmonary disease; ILD, interstitial lung disease.
Appendix S1: Supporting Information
References
- 1. Moore CL, Copel JA. Point‐of‐care ultrasonography. N Engl J Med 2011; 364:749–757. [DOI] [PubMed] [Google Scholar]
- 2. Kumar A, Liu G, Chi J, Kugler J. The role of technology in the bedside encounter. Med Clin North Am 2018; 102:443–451. [DOI] [PubMed] [Google Scholar]
- 3. Glomb N, D'Amico B, Rus M, Chen C. Point‐of‐care ultrasound in resource‐limited settings. Clin Pediatr Emerg Med 2015; 16:256–261. [Google Scholar]
- 4. Fox S, Dugar S. Point‐of‐care ultrasound and COVID‐19. Cleve Clin J Med 2020. [Online Ahead of Print]. 10.3949/ccjm.87a.ccc019. [DOI] [PubMed] [Google Scholar]
- 5. Bonadia N, Carnicelli A, Piano A, et al. Lung ultrasound findings are associated with mortality and need of intensive care admission in COVID‐19 patients evaluated in the Emergency Department. Ultrasound Med Biol 2020; 46:2927–2937. https://www.ncbi.nlm.nih.gov/pmc/articles/PMC7362856/. [DOI] [PMC free article] [PubMed] [Google Scholar]
- 6. Peng Q‐Y, Wang X‐T, Zhang L‐N. Chinese Critical Care Ultrasound Study Group (CCUSG). Findings of lung ultrasonography of novel corona virus pneumonia during the 2019‐2020 epidemic. Intensive Care Med 2020; 46:849–850. [DOI] [PMC free article] [PubMed] [Google Scholar]
- 7. Porcel JM. Time to embrace POCUS as part of the bedside diagnosis of respiratory diseases. Respirology 2020; 25:466–467. [DOI] [PubMed] [Google Scholar]
- 8. Mathews BK, Koenig S, Kurian L, et al. Clinical progress note: point‐of‐care ultrasound applications in COVID‐19. J Hosp Med 2020; 15:353–355. [DOI] [PMC free article] [PubMed] [Google Scholar]
- 9. Lucas BP, Tierney DM, Jensen TP, et al. Credentialing of hospitalists in ultrasound‐guided bedside procedures: a position statement of the Society of Hospital Medicine. J Hosp Med 2018; 13:117–125. [DOI] [PubMed] [Google Scholar]
- 10. CDC . Coronavirus Disease 2019 (COVID‐19) [Internet]. Centers for Disease Control and Prevention. https://www.cdc.gov/coronavirus/2019-nCoV/hcp/clinical-criteria.html. cited April 29, 2020. 2020.
- 11. Doerschug KC, Schmidt GA. Intensive care ultrasound: III. Lung and pleural ultrasound for the intensivist. Ann Am Thorac Soc 2013; 10:708–712. [DOI] [PubMed] [Google Scholar]
- 12. Lichtenstein DA. Lung ultrasound in the critically ill. Ann Intensive Care 2014; 4:1. [DOI] [PMC free article] [PubMed] [Google Scholar]
- 13. Reuss J. Sonography of the pleura. Ultraschall Med 2010; 31:8–22.quiz 23–5. [DOI] [PubMed] [Google Scholar]
- 14. Lobo V, Weingrow D, Perera P, Williams SR, Gharahbaghian L. Thoracic ultrasonography. Crit Care Clin 2014; 30:93–117.v–vi. [DOI] [PubMed] [Google Scholar]
- 15. Gomond‐Le Goff C, Vivalda L, Foligno S, Loi B, Yousef N, De Luca D. Effect of different probes and expertise on the interpretation reliability of point‐of‐care lung ultrasound. Chest 2020; 157:924–931. [DOI] [PubMed] [Google Scholar]
- 16. Chiem AT, Chan CH, Ander DS, Kobylivker AN, Manson WC. Comparison of expert and novice sonographers' performance in focused lung ultrasonography in dyspnea (FLUID) to diagnose patients with acute heart failure syndrome. Acad Emerg Med 2015; 22:564–573. [DOI] [PMC free article] [PubMed] [Google Scholar]
- 17. Vieira JR, de Castro MR, de Guimarães TP, et al. Evaluation of pulmonary B lines by different intensive care physicians using bedside ultrasonography: a reliability study. Rev Bras Ter Intensiva 2019; 31:354–360. [DOI] [PMC free article] [PubMed] [Google Scholar]
- 18. Kumar A, Weng Y, Graglia S, et al. Interobserver agreement of lung ultrasound findings of COVID‐19 [internet]. Infectious diseases (except HIV/AIDS). medRxiv 2020; https://www.medrxiv.org/content/10.1101/2020.08.16.20176156v1.abstract
- 19. Bernheim A, Mei X, Huang M, et al. Chest CT findings in coronavirus Disease‐19 (COVID‐19): relationship to duration of infection. Radiology 2020; 295:200463. [DOI] [PMC free article] [PubMed] [Google Scholar]
- 20. Sorlini C, Femia M, Nattino G, et al. The role of lung ultrasound as a frontline diagnostic tool in the era of COVID‐19 outbreak. Intern Emerg Med 2020; 22:1–8. 10.1007/s11739-020-02524-8. [DOI] [PMC free article] [PubMed] [Google Scholar]
- 21. Fang Y, Zhang H, Xie J, et al. Sensitivity of chest CT for COVID‐19: comparison to RT‐PCR. Radiology 2020; 296:E115–E117. [DOI] [PMC free article] [PubMed] [Google Scholar]
- 22. Chon Y, Kim JY, Suh YJ, et al. Adverse initial CT findings associated with poor prognosis of coronavirus disease. J Korean Med Sci 2020; 35:e316. [DOI] [PMC free article] [PubMed] [Google Scholar]
- 23. Liang W, Liang H, Ou L, et al. Development and validation of a clinical risk score to predict the occurrence of critical illness in hospitalized patients with COVID‐19. JAMA Intern Med 2020; 180:1081–1089. 10.1001/jamainternmed.2020.2033. [DOI] [PMC free article] [PubMed] [Google Scholar]
- 24. Leonardi A, Scipione R, Alfieri G, et al. Role of computed tomography in predicting critical disease in patients with covid‐19 pneumonia: a retrospective study using a semiautomatic quantitative method. Eur J Radiol 2020; 130:109202. [DOI] [PMC free article] [PubMed] [Google Scholar]
- 25. Ottaviani S, Franc M, Ebstein E, et al. Lung ultrasonography in patients with COVID‐19: comparison with CT. Clin Radiol 2020; 75:877.e1–877.e6. 10.1016/j.crad.2020.07.024. [DOI] [PMC free article] [PubMed] [Google Scholar]
- 26. Fiala MJ. Ultrasound in COVID‐19: a timeline of ultrasound findings in relation to CT. Clin Radiol 2020; 75:553–554. [DOI] [PMC free article] [PubMed] [Google Scholar]
- 27. Peyrony O, Marbeuf‐Gueye C, Truong V, et al. Accuracy of emergency department clinical findings for diagnosis of coronavirus disease 2019. Ann Emerg Med 2020; 76:405–412. 10.1016/j.annemergmed.2020.05.022. [DOI] [PMC free article] [PubMed] [Google Scholar]
- 28. Zhang Y, Xue H, Wang M, He N, Lv Z, Cui L. Lung ultrasound findings in patients with coronavirus disease (COVID‐19). AJR Am J Roentgenol 2020; 216:80–84. [DOI] [PubMed] [Google Scholar]
- 29. Lu X, Zhang M, Qian A, Tang L, Xu S. Lung ultrasound score in establishing the timing of intubation in COVID‐19 interstitial pneumonia: a preliminary retrospective observational study. PLoS One. 2020; 15:e0238679. [DOI] [PMC free article] [PubMed] [Google Scholar] [Retracted]
Associated Data
This section collects any data citations, data availability statements, or supplementary materials included in this article.
Supplementary Materials
Appendix Figure 1 POCUS Assessments for COVID‐19. CT, computed tomography; ARDS, acute respiratory distress syndrome.
Appendix Table 1. Demographic Features. IQR, interquartile range; ICU, intensive care unit; COPD, chronic obstructive pulmonary disease; ILD, interstitial lung disease.
Appendix S1: Supporting Information