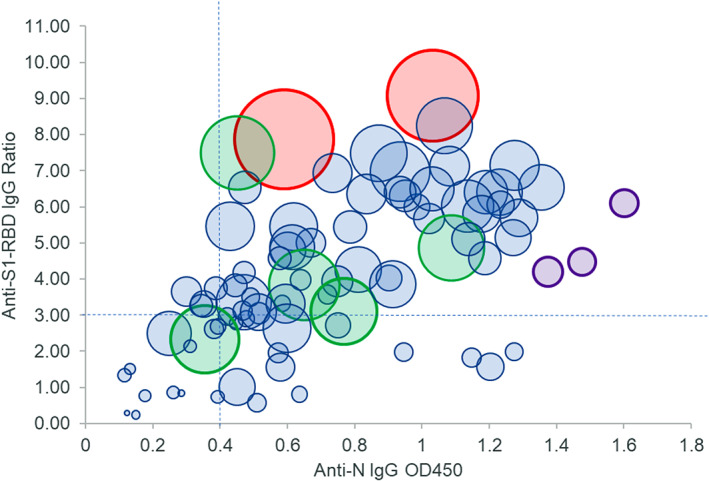
FIGURE 2.

Comparison of anti‐N IgG (OD450, x‐axis), anti‐S1‐RBD IgG (ratio, y‐axis), and FRNT50 reciprocal titer (relative size of bubble, larger bubbles correspond to higher titers). Eighty‐five samples were compared for correlation among anti‐N, anti‐S1‐RBD, and neutralizing antibody titers. Two samples with the highest FRNT50 titers (red circles) also had the highest S1‐RBD ratios and moderately high levels of anti‐N1. Three samples with the highest anti‐N OD450 values had FRNT50 values of approximately 200 (purple circles), while five samples (green circles) had FRNT50 values of approximately 1000 but had varying levels of anti‐N and anti‐S1‐RBD. Dashed lines indicate cutoff values for OD450 and ratios above which 90% of FRNT50 values were 80 or greater [Color figure can be viewed at wileyonlinelibrary.com]
