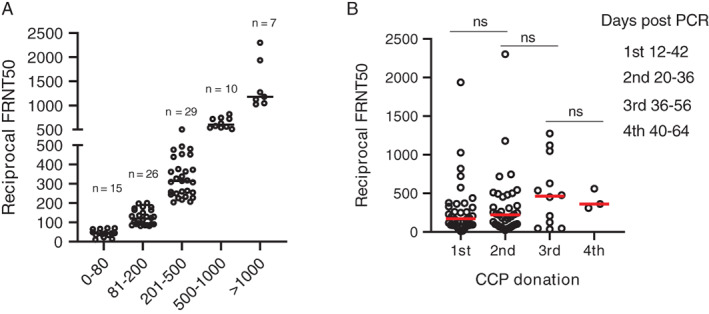
FIGURE 3.

FRNT50 titers in CCP donors (A) and FRNT50 titers grouped by sequential CCP donations (B). Eighty‐seven samples were analyzed for FRNT50 titers. Data are grouped by FRNT50 titer and the number of samples in each group is indicated (A). FRNT50 titers correlated with CCP collection time point. The difference between groups was considered significant (P < .05) using Welchʼs test for unequal variances. ns, not significant [Color figure can be viewed at wileyonlinelibrary.com]
