Abstract
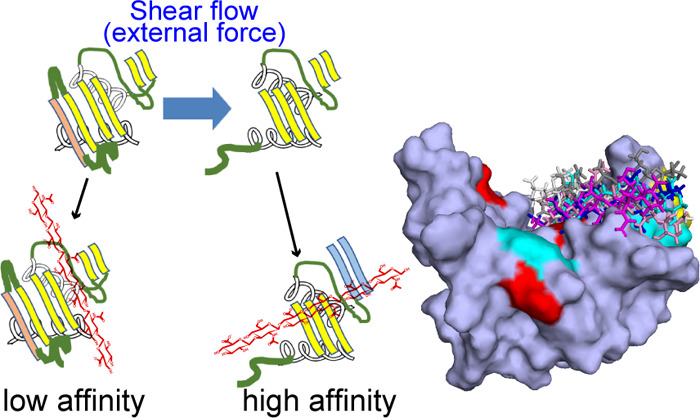
CD44 protein exists on surfaces of a variety of human cells, acts as a receptor for the hyaluronan (HA) molecule, and mediates cell adhesion via the HA binding in leukocyte trafficking, cell rolling, and so on. The molecular structures of both CD44 and HA are well known, and the previous work shows that the external-mechanical force induces the partially disordered (PD) conformation from the ordered (O) conformation of CD44. The PD conformation has the higher HA affinity compared to the O conformation. However, the details of force-sensing mechanics have remained unclear. This study provides new insights into allosteric regulation of HA binding by conformational shift from the O to the PD conformation of the CD44 HA binding domain by using the classical molecular dynamics simulations. The O conformation was more favorable than the PD conformation under the equilibrium state, and the O conformation showed weak HA-binding affinity. Our simulation suggests that the PD conformation induced by the external force can refold to a compact structure similar to the O conformation keeping the bound HA. This new conformation showed a higher affinity than the O and PD conformations. Our results show that the unfolding of a remote disordered region from the ligand binding site by the external force allosterically regulates the HA affinity. This study promotes understanding not only the mechanism of CD44-mediated cell rolling but also the allosteric regulation induced by the external mechanical force.
Introduction
CD44 is a type-I transmembrane protein and exists on surfaces of a variety of human cells including leukocytes, endothelial cells, and fibroblasts.1 CD44 acts as a receptor for the hyaluronan (HA) molecule and mediates cell adhesion via the HA binding in leukocyte trafficking, cell rolling, and so on.2 In addition, the extracellular portion of CD44 comprises the N-terminal HA binding domain (HABD), which has been reported to be highly homologous to the HA binding regions of the known HA receptors, such as versican, aggrecan, and TSG-6.3 The human CD44 HABD is composed of the N-terminal 158 amino-acid residues (residues 21–178) as shown in Figure 1.4 The C-terminal of the extracellular HABD domain is linked to the cell membrane by the stalk domain.5
Figure 1.
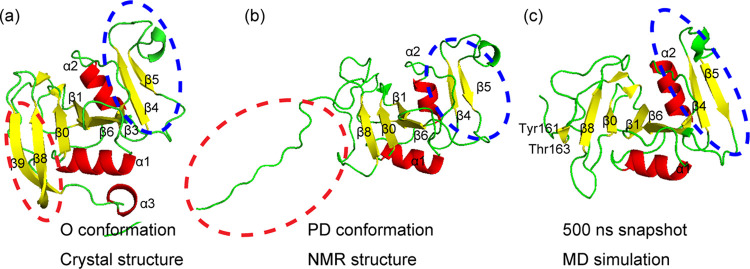
Structures of O and PD conformations of CD44 HABD. (a) X-ray structure (PDB ID: 1UUH) of the O conformation and (b) structure (PDB ID: 2I83) assigned by NMR analysis of the PD conformation.4 (c) PD refold conformation at 500 ns of MD simulation. The red dashed circles denote the partially disordered region on the conformational shift from O to PD, and the blue dashed circles denote the conformational change at the remote region during the conformational shift from O to PD and the refolding of PD conformation. The figures of (a) and (b) were reprinted with permission from ref (4). Copyright 2006 Elsevier.
The HA molecule is one of the extracellular glycosaminoglycans, and a high-molecular weight copolymer composed of N-acetylglucosamine (GlcNAc) and glucuronic acid (GlcUA).6,7 The HA molecule is attached to the surface of mesenchymal cells via HA-binding proteins. The HA molecule does not bind covalently to the proteins,8 but the negatively charged carboxylate groups of HA bind to the positively charged amino-acid residues on the HABD surface.2 The concentration of HA in the blood stream is usually low; however, the concentration increases at the wound site.9
Banerji et al. reported the presence of two conformations (type A and type B) for the murine CD44 HABD in the HA bound state from the crystal structure of the murine CD44 HABD with the HA octamer.10 The difference between the types A and B exists in the conformation of the β1/α1 loop, which is closer to the HA molecule in the HA bound state of type B. The conformation of type B was considered as the HA bound state. Thirteen residues (Arg41, Tyr42, Cys77, Arg78, Tyr79, Ile88, Asn94, Ile96, Cys97, Ala98, Ala99, His101 (Tyr101 in the human CD44 HABD), and Tyr105) were found to make prominent contacts with the HA molecule (see Table 1).
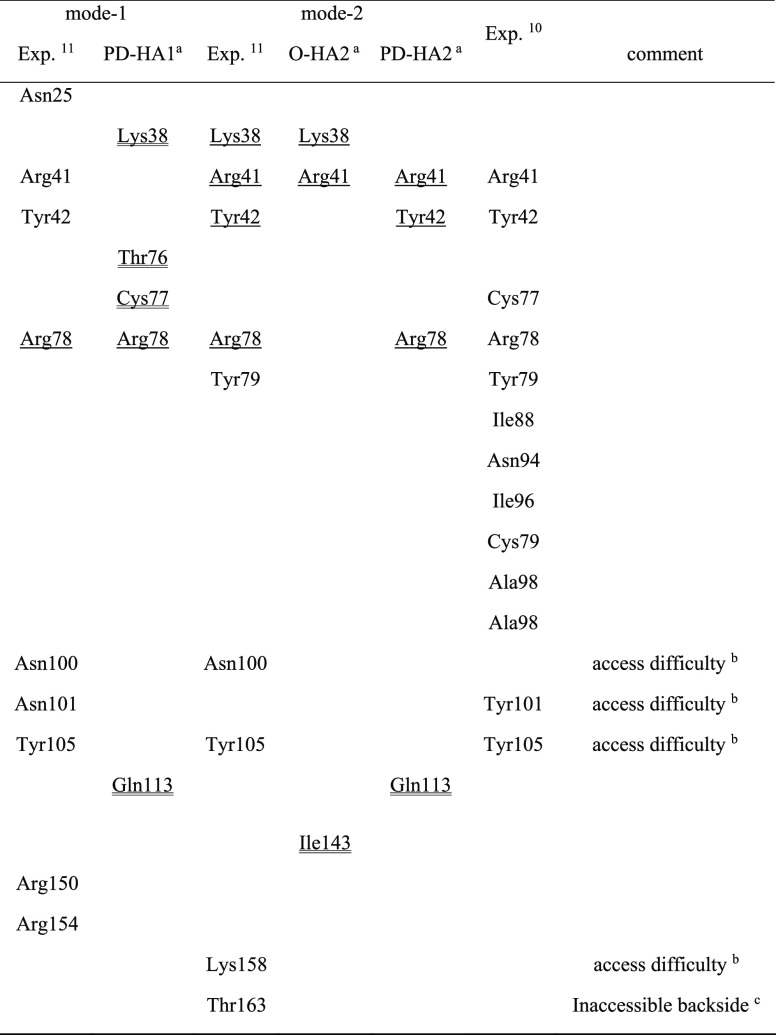
Table 1. Amino-Acid Residues Found to Have the Contact with the HA Molecule in the Mode-1 and Mode-2 of HA-CD44 HABD Complexes.
O-HA1, PD-HA1, and PD-HA2 are calculated models for the HA-CD44 HABD complexes in the present study.
The HA hexamer is too short to reach these amino-acid residues.
Thr163 is located at the backside of the proteins.
The amino-acid residues that were found to have contact with HA in both the present and the other experimental studies are shown with the single underlines. The amino-acid residues that were found to have contact with HA in the present study but had no contact found in the other experimental studies are shown with the double underlines.
The crystal structure of the human CD44 HABD in the HA unbound state has been determined,11,12 and the structure of the HA bound state has been determined by NMR techniques.4,11 The importance on the HA binding of basic Arg and Lys residues of the CD44 HABD has been reported, and especially, Arg41 is found to be critical for the HA binding in mutagenesis experiments.2 However, there is no geometrical information of HA itself on the surface of the CD44 HABD in the HA bound state.
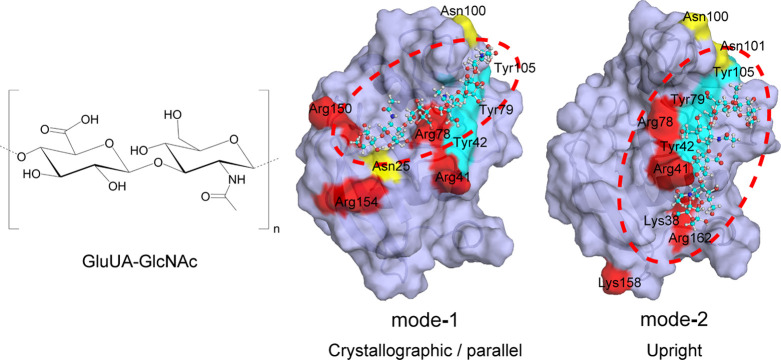
Two HA binding pockets for the human CD44 HABD were suggested from the NMR experimental data, which showed that the HA binding poses are classified into two modes (mode-1 and mode-2) as shown in Figure 2.11 In mode-1, the interacting residues lie on the protein surface beginning from Asn100/Asn101 to Arg150/Arg154, and the important amino-acid residues for the HA binding are Asn25, Arg41, Tyr42, Arg78, Asn100, Asn101, Tyr105, Arg150, and Arg154.11 Binding mode-1 was similar to that in the TSG-6 link module, which was the HA receptor and has high homology to the CD44 HABD. In mode-2, Lys38, Arg41, Tyr42, Arg78, Tyr79, Asn100, Asn105, Tyr105, Lys158, and Arg162 were suggested to be essential (see Table 1).11
Figure 2.
HA molecule and two binding modes, mode-1 and mode-2, of HA on the CD44 HABD surface. Red, yellow, and blue colors on molecular surface denote positively charged (Arg and Lys), amidic (Asn), and aromatic (Tyr) residues, respectively, which were supposed to be important for the interaction with HA in each binding mode. The blue, white, red, and navy balls denote carbon, hydrogen, oxygen, and nitrogen atoms, respectively, in the HA molecule. The figures of the center and right were reprinted with permission from ref (11). Copyright 2004 Elsevier
Takeda et al. have determined the structure of the CD44 HABD with the HA hexamer in solution, in which the C-terminal region becomes unfolded, as shown by the red dashed circle in Figure 1b.4 The C-terminal region of the CD44 HABD in the HA bound state is different from that in the HA unbound state as shown in Figure 1a,b. The CD44 HABD in the HA unbound state is composed of three α helices (α1−α3) and nine β strands (β1−β9) as shown in Figure 1a, while the C-terminal β9 strand and α3 helix become unfolded, and the β8 strand changes its conformation with respect to the β0 strand in the HA bound state as shown in Figure 1b.4 Ogino et al. defined that the unfolding C-terminal in the HA bound state (residues 153–178) is a disordered region, and they refer to the conformations of the HABD in the HA unbound and bound states as the ordered (O) and partially disordered (PD) conformations, respectively.13 They also reported that the O and PD conformations showed low and high HA affinities, respectively, and the mutagenesis experiments and the cell rolling experimental data revealed that the equilibrium between the two conformations is essential for HA-mediated cell rolling under shear flow.13
The mechanism of CD44-HA binding has been investigated by using molecular dynamics (MD) simulations.5,14−16 Favreau et al. concluded that Arg41 is essential for the HA binding to human CD44 and the conformational change from the O to PD does not affect the HA affinity switching from the B- to A- form, where the conformation of Arg41 changes in the HA binding to human CD44.14 Their results suggested that Arg154, Lys158, and Arg162 are also important for the HA binding. Vuorio et al. investigated CD44-HA binding by using three different HA binding modes and concluded that the switching from the B- to A-form of Arg41 is important to regulate the HA affinity to CD44. Arg41 was found important to stabilize the HA-CD44 complex in all three binding modes, but also Arg78 contributes to the HA binding.16
In this MD simulations work, we investigated the HA binding to both O and PD conformations and also examined the mode-1 and mode-2 HA binding poses. Both of HA bound and unbound PD conformations converged to the refolded conformations as shown in Figure 1c. Not only the partially disordered region but also the remote HA binding region, β4 and β5 strands changed the conformations during the refolding of the PD conformation as shown in Figure 1b,c. We think that the refolded conformation (Figure 1c) is the evidence of the transition from the PD to O conformation reported by the previous experimental results.4,13,17,18 In addition, we found the increase in HA binding affinity in the refolded PD conformation. The HA molecule interacts strongly with some amino-acid residues such as Lys38 and Arg41 in the O conformation, while the HA molecule interacts with a wide range of amino-acid residues, including Arg78, in the PD conformation. The HA binding in the O conformation assists to break the salt bridge between Glu38–Tyr161, which attaches the C-terminal disordered region to the core region and induces the conformational shift from the PD to O conformations.
Results and Discussion
Structures of the O Conformation and Its HA Complexes
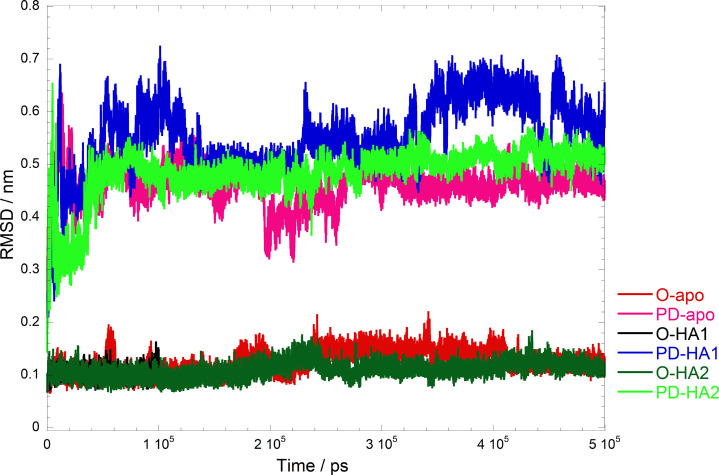
We examined the structural stabilities of the O-HA1 model, O-HA2, and O-apo models by using the MD simulations, and the RMSDs of Cα atoms of CD44 and those of heavy atoms of the HA molecule are summarized in Figure 4 and Figure S1, respectively. The Cα-RMSDs showed that the O-apo model was stable during the 500 ns simulation as shown in Figure 4. Because the HA molecule was separated from the protein surface around 100 ns in the O-HA1 model, we did not continue the simulation for the O-HA1 model after 100 ns. The protein structure of the O-HA2 model was stable during the 500 ns simulation as shown in Figure 4, except for the conformation of the α3 helix located at the C-terminal as shown in Figure S2. On the other hand, the HA molecule in O-HA2 became stable after 200 ns. The RMSFs and B-factors of Cα atoms in the O-apo and O-HA2 mode were similar to each other as shown in Figure S3. The fluctuations of whole structures in the O-apo and the O-HA2 models were smaller than those in the PD-apo and the PD-HA1/2 models described in the next section.
Figure 4.
Cα-RMSDs of two conformations of the CD44 HABD, O and PD, and their complexes with the HA molecule.
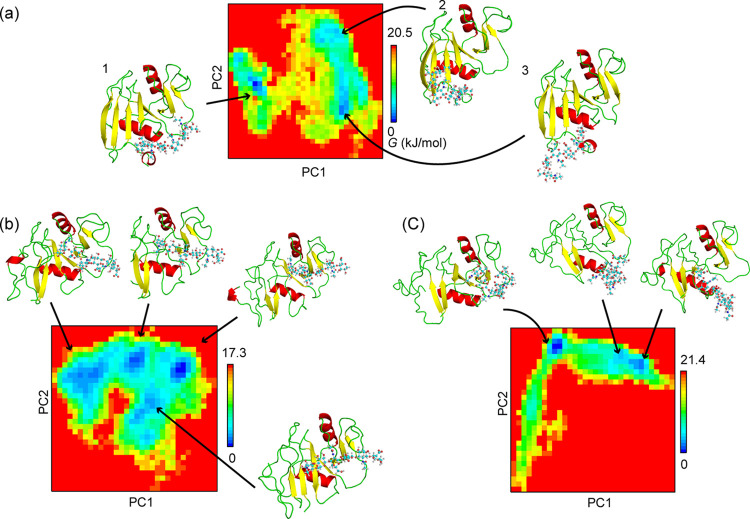
The PCA was performed for the trajectories of the O-apo and O-HA2 models, and then we chose the first and second principle components for describing the Gibbs free energy landscape as shown in Figures 5 and 6, respectively. There were four local energy minima on the free energy landscape of the O-apo model, and the energy barriers for the transformation between each stable conformation are less than 10 kJ/mol. The structures for the four energy minima were similar to each other as shown in Figure 5, except for the conformations of β4/β5 and β5/β6 loops at the four energy minima.
Figure 5.
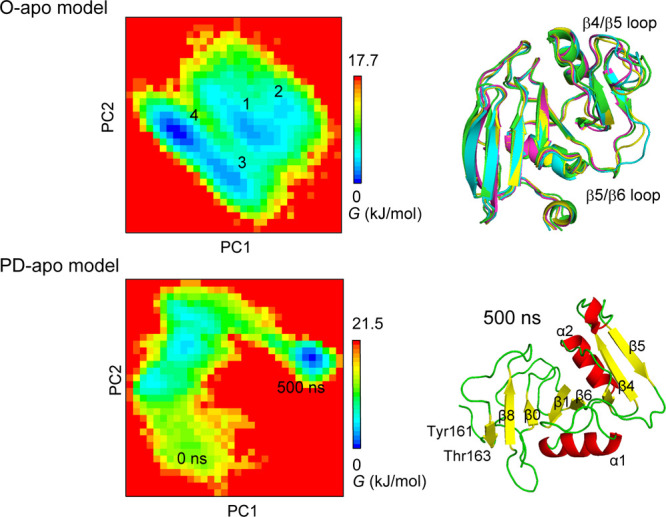
PCAs along the first and second principle components for the trajectories of O-apo and PD-apo models. Principal component analysis was performed for Cα-RMSDs formed from the 500 ns trajectory. The superimposed structures at the four energy minima (1, 2, 3, and 4) on the free energy (G) landscape of the O-apo form is shown at the upper column.
Figure 6.
PCAs along the first and second principle components for (a) O-HA2, (b) PD-HA1, and (c) PD-HA2 models during 500 ns. Cartoon and tube-and-ball models describe the conformations of the HA molecule.
The HA molecule diffused on the surface in both O-HA1 and O-HA2 models as shown in Figure S4. The HA molecule was finally separated from the surface around 100 ns in the O-HA1 model so that the PCA was not applied to the O-HA1 model. On the other hand, the HA molecule in the O-HA2 model left from the initial position at about 100 ns to move toward the β1/α1 loop including Arg41, which has been reported to be essential for the HA binding,2,10 and stayed around the β1/α1 loop from 200 ns to the end of the simulation as shown in Figures S4 and Figure 6a. There were three energy minima on the free energy landscape for the O-HA mode-2 model as shown in Figure 6a. The conformation of the CD44 HABD was not affected by the binding of the HA molecule as shown in Figure 6a while the HA molecule was moving and changing its conformation during the simulation. When the HA molecule started to move toward the β1/α1 loop, the conformation started to shift from conformations 1 to 2 on the free energy landscape as shown in Figure 6a. There was a small energy barrier, ∼20 kJ/mol, between conformations 1 and 2, while there was almost no energy barrier between conformations 2 and 3. The HA molecule was anchored by its terminal moiety to the protein surface in conformations 2 and 3, and the rest of the molecule was fluctuated in the water solvent. The COO– and OH moieties included in the terminal glucuronate subunit of the HA molecule interact with Lys 38, Asn39, and Arg41.
Majewski et al.19 examined 469 protein–ligand hydrogen bonds in 79 protein–ligand complex structures by using dynamic undocking and MD-based methods, and they showed that most protein–ligand complex structures had only one or two strong hydrogen bonds as the anchors and the other hydrogen bonds were moderate or weak. Their results showed that the carbohydrate binding sites had weak hydrogen bonds compared to the other binding sites of enzyme and nuclear receptors. Furthermore, they reported the balance order and disorder for most complexes by combining a single anchoring point with looser regions. To evaluate the binding affinity, the ligand efficiency (LE) is one of the useful measures to evaluate the molecular-size-independent affinity. LE is defined as the binding free energy (in kcal/mol) per heavy atom of the ligand. The LE values of CD44-HAs estimated by using the binding free energy in ref (21) are 0.05–0.09, and these values are much smaller than the value of 0.3 for the protein–ligand complex with a rigid conformation.20 The weak affinity of HA to CD44 suggests the possible existence of multiple binding poses of the HA molecule.
Structures of the PD Conformation and Its Complexes with the HA Molecule
As studied about the O conformation, we applied the same analysis to the PD conformation. The Cα-RMSDs of the PD-apo, PD-HA1, and PD-HA2 models were larger than those of the O-apo, O-HA1, and O-HA2 models as shown in Figure 3. The RMSDs of the HA molecule in PD-HA1 are stable during the simulation as shown in Figure S1, while those in PD-HA2 become stable around 250 ns. The fluctuations of not only the disordered region but also the distant region, such as β4/β5 and β5/β6 loops, were larger compared to those in the O conformation and its HA complex as shown in Figure S3. The HA binding on the PD conformation induced larger fluctuation around the HA binding site, β5/β6 loop, α1 helix, and α1/α2 loop.
Figure 3.
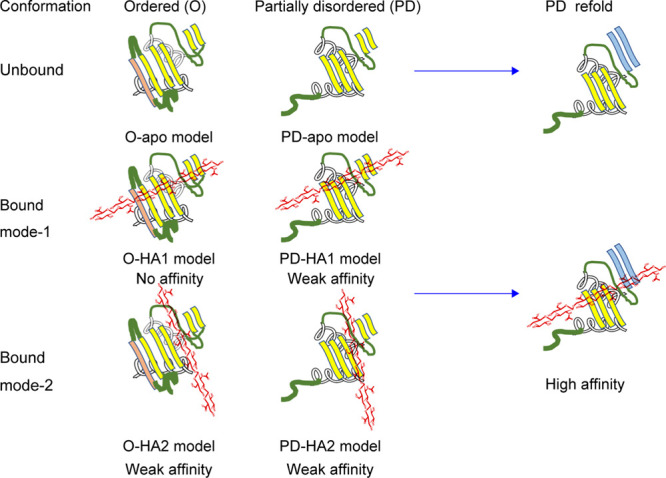
Simulation models for the apo- and HA-bound CD44 HABD. In the ordered (O) conformation, four β-strands are shown, while one of the four β-strands colored by the magenta in the O conformation disappears in the partially disordered (PD) conformation. Two β-strands colored by the blue in the PD refold conformation, which are located at the remote from the PD region, were elongated during the 500 ns simulations of PD conformations. Red lines denote the HA molecule.
The conformational change of the PD model during a 500 ns simulation is shown in Figure 4. The refolding of the disordered region occurred and rapidly converged to the similar conformation to the O conformation as shown in Figure 5. A new beta-sheet constituted by Tyr161, Gly162, and Thr163 was formed as shown in Figure 5. The distances between the center of mass (COM) of these three amino residues and the protein core region are shown in Figure S5a. Two amino-acid residues, Tyr155 and Val156, which were located at the center of β9 in the O conformation, also shorten the distances to the protein core region during the simulation as shown in Figure S5b. Ogino et al. reported from NMR and the mutagenesis experimental results that the CD44 HABD exchanges between the O and PD conformations in ether solution with and without the HA ligand.13 Furthermore, the transition from the O to PD conformation in either of the existence or absence of the HA molecule was estimated to occur in a time scale of 100 ms.13,17 A large difference between the O and PD conformations exists in the PD region of the C-terminal.4,17 Our results show that the rapid refolding of the disordered region occurs at the early stage of the transition process from the PD to O conformation as similarly reported by the previous experimental results.4,13,17,18
The length of the β0 strand located near the disordered region became shorter during the 500 ns simulation, while β4 and β5 strands grew their lengths longer, and their lengths were even longer than those in the X-ray structure of the O conformation as shown in Figures 1 and 5 and Figures S2a and S6a. The bend structure between β4 and β5 appeared with increasing the length of β4 and β5 strands. The length of β1 and β6 strands located at the HA binding site became shorter during the simulation. The β4 and β5 strands are assigned to be composed of residues 85–90 and 105–107 in the crystal structure (PDB ID: 1UUH),11 while the residues β4 and β5 strands are assigned to be composed of residues 85–90 and 103–106 in the NMR-derived structure (PDB ID: 2I83).4 In the present simulation, the β4 and β5 strands were composed of residues 85–90 and 103–107 at a 500 ns snapshot (Figure 1c). We chose model 1 from PDB ID: 2I83 as the initial structures for the PD models as shown in Figure 1b, and the β4 and β5 strands were composed of residues 87–90 and 103–106 as shown in Figure 1b. Additionally, we checked the length of the β4 and β5 strands in the 20 models included in PDB ID: 2I83 and found that the length of the β4 and β5 strands changed in a wide range. The shortest β4 and β5 strands are 88–90 and 103–105, while the longest strands are 85–90 and 103–107, respectively. The lengths of the β4 and β5 strands are fluctuating in the NMR-derived structures, while the length of the β4 and β5 strands in Figure 1c was stabilized to the length of those strands in the O conformation.
The disordered region in the PD-HA1 also converged to the refolding form as shown in Figure 6b. There were three representative structures from the PCA results as shown in Figure 6b, and those structures are similar, except for the length of the β1 strand. The length of the β1 strand located at the HA binding site became shorter compared to that in the starting structure as shown in Figure S6b. The HA molecule in the PD-HA1 did not move from the initial coordinates, and its conformation was unchanged as shown in Figure 6b.
The disordered region in the PD-HA2 model also converged to the refolding form as shown in Figure 6c. The binding of the HA molecule affected the structures of the β1, β4, β5, and β6 strands and the α1 helix around the HA binding site as shown in Figure 6c and Figure S6c. The HA molecule moved around the β1/α1 loop including the essential residue, Arg41, in the PD-HA2 model as shown in Figure 6c. The HA molecule was anchored by its own one terminal on the protein surface, while the other terminal of the HA molecule was fluctuated in the solvent as shown in Figure 6c. The positively charged residues such as Lys38, Arg41, Arg46, and Arg78 interact with the COO– and OH moieties of the HA molecule.
The intra-protein hydrogen bonds in the O conformation keep the stable folding structure. The transformation from PD to O conformations changes some part of the intra-protein hydrogen bonds followed with the deformation of the protein structure. As a result of the loss or weakening of intra-protein hydrogen bonds, the new hydrogen bonds between the PD conformation of CD44 and HA could be formed. In the PD state, the solvent water molecules could access the inter CD44-HA hydrogen bonds since the HA-binding site is a widely open structure compared to that in the O state. Majewski et al. suggested from their MD-based study that the exposure of the hydrogen bond sites to the solvent in the protein–ligand complex lowers the energy barrier for the transformation to a more stable conformation for the reconstruction of the hydrogen bond network.19 We think that the transformation from the PD initial conformation to the PD refold conformation in the PD-HA1 and PD-HA2 occurred in the same way. The PD refolded conformation that converged in our simulation might be one of an ensemble of multiple CD44-HA binding conformations. More experimental results are required to confirm the more precise contribution of the PD refolded conformation to the HA binding on CD44.
HA Affinity on the O and PD Conformations and Their Binding Modes
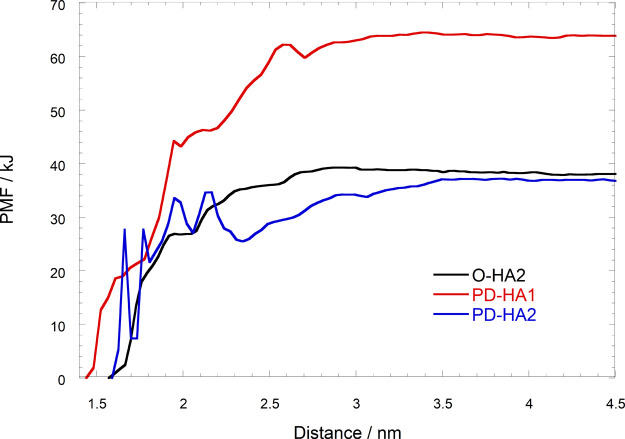
The HA binding free energies (ΔGs) of CD44 HABD-HA complexes in binding mode-1 and -2 were estimated by using the steered MD and umbrella sampling method, and the results are shown in Figure 7. We chose the representative structure from the largest cluster estimated by PCA, as shown in Figure 6, as an initial structure for the steered MD.
Figure 7.
PMF for the pulling of HA from the protein in HA binding complex models against the distance between the center of mass of the HA and protein.
The ΔG value in the PD-HA1 model was about twice larger than those in the O-HA2 and PD-HA2 models, shown as the potential mean force (PMF) in Figure 7. The ΔG in the PD-HA1 mode1 was about 64 kJ/mol, and those in the O-HA2 and PD-HA2 models were about 37 and 38 kJ/mol, respectively. Our results are in good agreement with the NMR and mutagenesis experimental results, in which the PD conformation has a higher HA affinity compared to the O conformation.13 The dissociation constants (KD) of HA oligomers on the immobilized CD44 HABD were measured by using the SPR method, and the KD value for the HA hexamer was reported as 38.8 ± 4.9 μM.21 The ligand-binding Gibbs free energy derived from the KD value for the HA hexamer yielded −24.8 to −25.4 kJ. Although there is the reported tendency of overestimation for the ligand binding free energy obtained from the value of PMF, the ligand binding free energy estimated from the values of PMF is very close to the ligand-binding Gibbs free energy from the experimental results.22 Therefore, our results are in good agreement with the results from the SPR measurements. Furthermore, Vuorio et al. performed molecular dynamics simulations to investigate the HA-CD44 binding by using three different binding modes: crystallographic, parallel, and upright binding modes. They reported HA octamer binding free energies to the CD44 HABD in the crystallographic and parallel binding modes (22 and 33 kJ mol–1, respectively).16 The corresponding HA binding energies in the present study are larger.
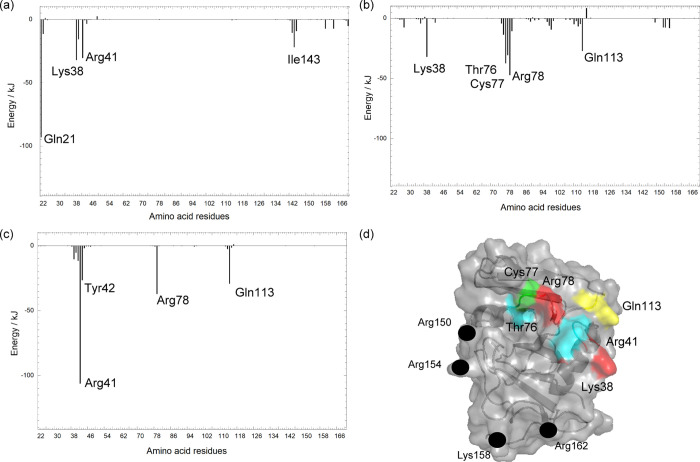
We next estimated the binding free energy per residue for investigating the details of the binding manner in each complex model. The results of ΔG per residue are shown in Figure 8. The main contribution to the ΔG in the O-HA2 model was due to the positively charged amino-acid residues Arg41 and Lys38 belonging to the β1/α1 loop, respectively. Although the interactions of Lys38 and Arg78 with the HA molecule were larger in the PD-HA1 model, the amino-acid residues such as Thr76, Cys77, and Gln113, which are weakly polar compared to Arg and Lys, contribute to the interactions between the HA and protein in the PD-HA1 model. The main contributor for the interaction in the PD-HA2 model was Arg41, and the next are Arg78 and Gln113. The HA molecules in the O-HA2 model and PD-HA2 model interact with a few residues on the protein surface, while the HA molecule in the PD-HA1 model interacts with multiple residues.
Figure 8.
HA-binding Gibbs free energy per residue estimated by MM/GBSA for (a) O-HA2, (b) PD-HA1, and (c) PD-HA2 models. (d) Important residues are projected on the protein surface of the PD refold conformation at 500 ns of MD simulation. Red, yellow, green, and blue colors on the molecular surface denote positively charged (Arg and Lys), amidic (Asn), sulfur-containing (Cys), and aromatic (Tyr) residues, respectively. The black circles represent the residues in the C-terminal region, which were found to be important for the HA binding by the mutagenesis experiment.2,11 The figure of (d) was reprinted with permission from ref (11). Copyright 2006 Elsevier.
As Arg41 has been reported to be the essential amino-acid residue for the HA binding in the O conformation from the experimental and the computational results,10,14,16 Arg41 played an important role for the HA binding in the mode-2 models of both O and PD conformations in the present study. The contribution of Arg78 to the HA binding energy becomes significant in both PD-HA1 and PD-HA2 models, and this result was in good agreement with the previous MD simulations.16 NMR studies determined the solution structure of the CD44 HABD-HA complex, in which the disordered region of the CD44 HABD unfolds, and identified multiple amino-acid residues of CD44 (Thr76, Cys77, Arg78, Tyr79, Gly80, Ile90, Cys97, Ala98, Ala99, Asn100, Asn101, Leu107, Asp115, and Gly152) involved in the HA-CD44 binding. These residues belonged to the α2/β3, β4/β5, and β5/β6 loops in the CD44 HABD site.4,17 The broad HA-CD44 HABD contact has also been reported by the site-directed mutagenesis method.2,23
Summarizing these results in the present study (see Table 1), the PD-HA1 model showed the highest HA affinity, and the HA molecule contacted with multiple amino residues belonging to the α2/β3 and β5/β6 loops, and these results were in good agreement with the previous experimental results.2,4,17 The essential amino-acid residues shown as binding mode-1 in Table 1 were determined by the NMR-perturbed resonance of the CD44 HABD in either the presence or the absence of the HA molecule.11 On the other hand, the essential amino-acid residues for binding mode-2 in Figure 2 were suggested from the alanine-scanning mutagenesis and NMR studies.2,11,23 The residues Arg150, Arg154, Lys158, and Arg162 in the C-terminal region were found to be important for the HA binding by the mutagenesis experiments.2,11 However, these residues are located far from the binding site as shown in Figure 8d. The stabilization of the PD-HA1 model explains why those distant residues from the binding site are important for the HA binding.
Effect of the HA Binding on the Conformational Shift from O to PD States
Next, the effect of the HA binding on the conformational shift from O to PD conformations was investigated by using the steered MD and umbrella sampling methods. Suzuki et al. have reported that breaking the interaction between Glu48 and Tyr161 triggers a conformational shift from O to PD conformations based on the results of steered MD, mutagenesis, and cell rolling experiments.18 The HA molecule bound and stayed around the β1/α1 loop located close to the disordered region in the O-HA2 model as shown in previous sections. We therefore investigated the effect of the HA binding on breaking the interaction between Glu48 and Tyr161, which links the disordered region to the rest of protein.
The energy required for breaking the interaction between Glu48 and Tyr161 in the O-HA2 model decreased to almost half of that in the O conformation without the HA binding as shown in Figure 9a. The HA molecule was located near the Glu48–Tyr161 bond in the O-HA mode-2 complex as shown in Figure 9b. The existence of the HA molecule seems to disturb the interaction of Glu48–Tyr161 during the process of pulling the disordered region.
Figure 9.
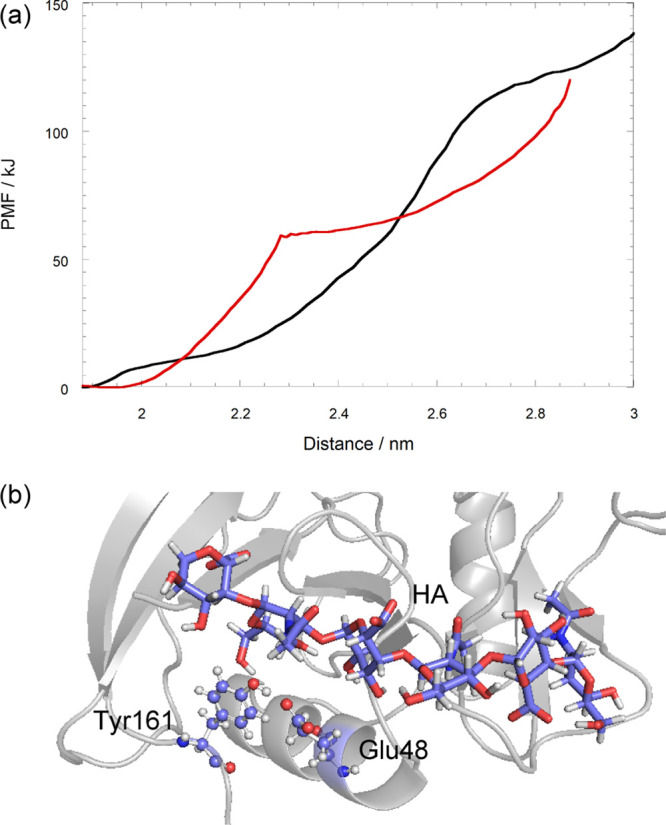
Pulling the C-terminal from the protein core region against the distance between the center of mass of Pro165 and the protein core region. (a) PMF of the pulling process. Black and red lines denote O-apo and O-HA2, respectively. (b) Relative position between the HA molecule and Glu48–Tyr161 in O-HA2.
Suzuki et al. have postulated the mechanism of cell rolling mediated by CD44-HA binding under the shear flow from the steered MD and the cell rolling experiments.18 The CD44 HABD forms an initial contact with the HA molecule in the low HA affinity O conformation, and then as the cell rolls under the shear flow, the tensile force is generated at the C-terminal of the HABD.18 Finally, the tensile force induces transformation from the low affinity O to the high affinity PD conformation.18 In the present study, the CD44 HABD in the O conformation first contacted with the HA molecule in binding mode-2. In the O-HA2 model, the HA molecule promoted the structural change from the O to PD conformation by making the break of the Glu48–Tyr161 interaction easier. As a result, this structural change generated the PD-HA2 complex.
There were two different HA binding modes for the PD conformation. When the external-mechanical force caused the population shift from the O to PD conformation, the HA molecule bound to the PD conformation in binding mode-2. Then, the HA molecule moved to a more stable state (binding mode-1).
Summary
We investigated the HA binding modes and affinities on both of O and PD conformations of the CD44 HABD by using MD simulations. There were two different binding modes (mode-1 and mode-2) for the HA binding to the PD conformation of the CD44 HABD. The HA molecule in binding mode-2 bound around the β1/α1 loop in both O and PD conformations of the CD44 HABD. Further, the HA molecule interacted with a limited number of amino-acid residues, mainly Lys38, Arg41, or Arg78, in binding mode-2 on both O and PD conformations, while the HA molecule interacted with a wide range of amino-acid residues in binding mode-1 on the PD conformation. The HA binding affinity in mode-2 was <40 kJ/mol, while that in mode-1 was about 60 kJ/mol.
The present study showed that the transformation from O to PD conformations in the HA bound state occurred easily due to the interaction between the HA and Tyr161 compared to that in the HA unbound state. These results suggested that the external-mechanical force changed the disordered region of CD44 that is remote from the ligand binding site and the unfolding of the disordered region allosterically regulates the HA affinity.
Understanding the CD44-mediated cell rolling via HA binding is important for understanding the mechanisms of various physiological processes such as leukocyte trafficking, lymphocyte homing, and tumor cell metastasis. In addition, the allosteric regulation plays an important role in the protein function, and new insights from the present study should contribute to deeper understanding of these processes.
Methods
Building O and PD Models and Their HA Complex Models
The crystal structure (PDB ID: 1UUH) and NMR structure (PDB ID: 2I83) of the human CD44 HABD were used for building the initial geometrical structures for the O and PD conformations, respectively. We chose model 1 from the NMR-derived structures (PDB ID: 2I83) for the PD conformation. The crystal structure (PDB ID: 1UUH) has been reported for the O conformation in the HA unbound state, while the NMR structure (PDB ID: 2I83) has been reported for the PD-HA complex, in which the geometry of the HA molecule has not been identified.4 Because the geometrical structures of Ala20–Tyr169 and Gln21–Val178 have been clarified in 1UUH and 2I83, respectively, both O and PD models include Gln21–Tyr169 in the present study. We named the O and PD conformations O-apo and PD-apo models, respectively, as shown in Figure 3.
Building CD44 HABD-HA Complex Models
The crystal structure of the human CD44 HABD-HA complex has not been determined yet, and there is a lack of the geometry of the HA molecule in the human CD44 HABD-HA complex determined by NMR.4 Therefore, we generated the HA binding complex models in both O and PD conformations by using a docking program, Sievgene.24 The HA hexamer (GluUA1–GlcNAc2–GlcUA3–GlcNAc4–GlcUA5–GlcNAc6) was used for the docking (see Figure 3). The HA binding complex models docking to protein were performed under several different constrained conditions with the binding probe points. The centers of the binding probe points were located at the amino-acid residues such as Arg41 and Arg78, which have been reported to be important residues for the HA binding.
We supposed the two different HA binding modes, mode-1 and mode-2, as shown in Figures 2 and 3. These two HA binding modes for the human CD44 HABD were suggested from the NMR experimental data.11 For O-HA1 and PD-HA1 models generated by the docking procedure with Sievgene, we confirmed that both structures were similar to the structure of the HA octamer complex of murine CD44.10 The structures of the docked HA complex models by using this procedure were similar to the parallel and upright binding modes in the previous MD simulation study, respectively.16 Four different CD44 HABD-HA complex models were generated and named as O-HA1, O-HA2, PD-HA1, and PD-HA2 models as shown in Figure 3. The conformations having the best docking score were chosen as the initial structure of each complex model. The HA molecule was pulled away from the protein surface until the distance was 30 Å, and then the initial structure of each model for the MD simulations was achieved by the energy minimization under the position restrains of protein and the restrains of the distance between the center of masses of HA and protein.
Molecular Dynamics Simulation
The MD simulations were performed under the periodic boundary conditions. The whole structure of each protein was embedded in TIP3P water molecules25 including ion particles of Cl– and Na+ in order to neutralize the total charge of the systems under physiological concentrations. The initial cell size was set to 9.65 × 7.53 × 7.96 (nm3). The charges of atoms and the force field in the protein were originated from AMBER ff14SB,26,27 while the RESP charges of atoms in the HA molecule were generated at B3LYP/6-31G(d,p) by using Gaussian 03,28 and GAFF29,30 was used for the force field of the HA molecule. After steepest-descent energy minimizations (5000 steps) with positional restrains on the solute-heavy atoms, the short-time (1 ns) NVT simulation with the position restrains of the solute atoms by a force constant of 10 kcal·mol–1·Å–2 to let the water diffuse around the molecule was carried out, and the temperature was elevated to 300 K during the NVT simulation. The particle mesh Ewald method (PME)31 was used for the calculation of the electrostatic contribution, and the cut-off distance of the van der Waals interaction was 12 Å. Then, the short-time (10 ns) NPT simulation at 300 K and 1 atm was performed for equilibration. During the NPT simulation, the position restrains of the solutes were gradually released. A production run (500 ns NPT simulation) was performed with a time step of 2.0 fs. The LINCS algorithm32 was applied to the system. The snapshot structures were obtained every 10 ps and used as each target structure from the trajectory of each model for the following analyses. All the MD simulations and following analyses were performed by the Gromacs 2018 program.33
Analysis of Trajectories
The trajectories of 500 ns simulations for all the models were analyzed by using a trajectory analysis module embedded in the Gromacs 2018 package33 and Visual Molecular Dynamics (VMD) software.34 pyMol software35 was used for the visualization of snapshots from all trajectories. The changes of the second structures during 500 ns simulations were investigated by using the definition of the secondary structure of protein (DSPP) method.36
The principal component analyses (PCA) of Cα-RMSDs and RMSDs of ligand O atoms along the trajectories were performed to investigate the collective motions of all the models and to extract representative and stable structures from the trajectories. The free energy landscape was generated by using the probability distribution along the principle components.
Steered MD Simulation and Umbrella Sampling Method
Gibbs free energies for CD44 HABD-HA complex models were also estimated by using the umbrella sampling method combined with steered MD simulation. The representative structures were extracted from the trajectories by PCA. The representative structure included in the largest ensemble was chosen as the initial structure. In the steered MD simulations, the geometry of protein was fixed during the pulling of the HA molecule from the protein at a constant speed of 10 Å·ns–1 with a spring constant of 1 kcal·mol–1·Å–2. The snapshots were extracted at every 0.1 Å along the steered MD trajectory on the umbrella sampling,37−39 and then a 10 ns NPT simulation was performed for each snapshot for generating the potential mean force (PMF).
The required energy for pulling the C-terminal disordered region from the protein core was performed by using the same procedure as mentioned above. The C-terminal disordered region is latched on to the protein core surface by the interaction between Glu48 and Tyr161. The amino-acid residues Glu166–Tyr169 were removed from each model for neglecting the effect of α3 helix unfolding. The geometry of the protein was fixed except for the disordered region (Thr153–Pro165) during pulling Pro165 from the protein core region. The procedure and conditions for the steered MD following the estimation of PMF were the same as mentioned previously.
Details of Interactions between the HA Molecule and Protein Surface in the HA Binding Complex Models
To elucidate the interactions between the HA molecule and each residue of protein in the complex models, the binding free energy was decomposed into the interaction energy of the single residue and the HA molecule pair by the MM-generalized-Born (GB) SA method.40−48 Total 6000 snapshots around the energy minima on the free energy landscape generated by PCA were chosen for the estimation of the interaction energy.
Gibbs free energies were calculated by the following equation:
| 1 |
where ⟨EMM⟩ and ⟨Gsolv⟩ are the gas phase molecular mechanics energy and the solvation free energy, respectively. The bracket “⟨ ⟩” represents the canonical-ensemble average. ⟨EMM⟩ includes the internal (bond, angle, and torsion), electrostatic, and van der Waals energies, and it is calculated by the classical force field. ⟨Gsolv⟩ is divided into the electrostatic and non-electrostatic solvation energies. The electrostatic contribution is evaluated by using the GB model, while the non-electrostatic solvation energy is estimated by the solvent accessible surface area (SASA). The binding free energy decomposition was applied to the summation of EMM and Gsolv in this study.
The entropy term is generally calculated by using normal mode analysis. Although the uncertainty of the solute entropy estimation by the normal mode analysis has been reported,49 the computational cost was found to be very high. Therefore, the entropy term was not included in this study. We performed the MM-GBSA calculations and decomposition of binding free energy by using the Ambertools16.26
Acknowledgments
The computations in this work were performed at the Research Center for Computational Science, Okazaki, Japan and by the Development of Core Technologies for Innovative Drug Development based upon IT from Japan Agency for Medical Research and Development, AMED.
Glossary
Abbreviations
- DSSP
definition of secondary structure of protein
- GBSA
generalized-Born surface area
- FMM
fast multipole method
- GlcNAc
N-acetylglucosamine
- GlcUA
glucuronic acid
- HA
hyaluronan
- HABD
hyaluronan binding domain
- LINCS
linear constraint solver
- MD
molecular dynamics
- MM
molecular mechanics
- O
ordered
- PCA
principle component analysis
- PD
partially disordered
- PMF
potential mean force
- RESP
restrained electrostatic potential
- SASA
solvent accessible surface area
- Exp.
experimental results
Supporting Information Available
The Supporting Information is available free of charge at https://pubs.acs.org/doi/10.1021/acsomega.0c05502.
RMSDs of HA molecules in O-HA1, O-HA2, PD-HA1, and PH-HA2 models (Figure S1); secondary structures defined by DSSP for O and PD conformations in the HA bound and unbound states (Figures S2 and S6); Cα-RMSFs and B-factors projected on protein surfaces for the simulated models (Figure S3); conformational change of the HA molecule on the protein surface of O-HA1 and O-HA2 models (Figure S4); and distances between centers of mass of amino residues including in the disordered region and the rest protein in the PD conformation (Figure S5) (PDF)
Author Contributions
M.L. conceived and designed the calculations. M.L., Y.H., and S.H. performed the calculations and analyzed the data. J.M.L. and Y.F. analyzed the data. M.L., J.M.L., and Y.F. wrote the manuscript. All authors have given approval to the final version of the manuscript.
The authors declare no competing financial interest.
Supplementary Material
References
- Ponta H.; Sherman L.; Herrlich P. A. CD44: from adhesion molecules to signalling regulators. Nat. Rev. Mol. Cell Biol. 2003, 4, 33. 10.1038/nrm1004. [DOI] [PubMed] [Google Scholar]
- Peach R. J.; Hollenbaugh D.; Stamenkovic I.; Aruffo A. Identification of hyaluronic acid binding sites in the extracellular domain of CD44. J. Cell. Biol. 1993, 122, 257–264. 10.1083/jcb.122.1.257. [DOI] [PMC free article] [PubMed] [Google Scholar]
- Dougherty G. J.; Dougherty S. T.; Dirks J. F.; Chui R. K.; Peters C. E.; Droll A. Regulation of the functional activity and ligand binding specificity of the adhesion protein CD44. Trends Glycosci. Glycotechnol. 1995, 7, 45–56. 10.4052/tigg.7.45. [DOI] [Google Scholar]
- Takeda M.; Ogino S.; Umemoto R.; Sakakura M.; Kajiwara M.; Sugahara K. N.; Hayasaka H.; Miyasaka M.; Terasawa H.; Shimada I. Ligand-induced structural changes of the CD44 hyaluronan-binding domain revealed by NMR. J. Biol. Chem. 2006, 281, 40089–40095. 10.1074/jbc.M608425200. [DOI] [PubMed] [Google Scholar]
- Guvench O. Revealing the mechanisms of protein disorder and N-glycosylation in CD44-hyaluronan binding using molecular simulation. Front. Immunol. 2015, 6, 305. 10.3389/fimmu.2015.00305. [DOI] [PMC free article] [PubMed] [Google Scholar]
- Fraser J. R. E.; Laurent T. C.; Laurent U. B. G. Hyaluronan: its nature, distribution, functions and turnover. J. Intern. Med. 1997, 242, 27–33. 10.1046/j.1365-2796.1997.00170.x. [DOI] [PubMed] [Google Scholar]
- Laurent T. C.; Fraser J. R. E. Hyaluronan. FASEB J. 1992, 6, 2397–2404. 10.1096/fasebj.6.7.1563592. [DOI] [PubMed] [Google Scholar]
- Yang B.; Yang B. L.; Savani R. C.; Turley E. A. Identification of a common hyaluronan binding motif in the hyaluronan binding proteins RHAMM, CD44 and link protein. EMBO J. 1994, 13, 286–296. 10.1002/j.1460-2075.1994.tb06261.x. [DOI] [PMC free article] [PubMed] [Google Scholar]
- Aya K. L.; Stern R. Hyaluronan in wound healing: rediscovering a major player. Wound Repair Regener. 2014, 22, 579–593. 10.1111/wrr.12214. [DOI] [PubMed] [Google Scholar]
- Banerji S.; Wright A. J.; Noble M.; Mahoney D. J.; Campbell I. D.; Day A. J.; Jackson D. G. Structures of the Cd44–hyaluronan complex provide insight into a fundamental carbohydrate-protein interaction. Nat. Struct. Mol. Biol. 2007, 14, 234–239. 10.1038/nsmb1201. [DOI] [PubMed] [Google Scholar]
- Teriete P.; Banerji S.; Noble M.; Blundell C. D.; Wright A. J.; Pickford A. R.; Lowe E.; Mahoney D. J.; Tammi M. I.; Kahmann J. D.; Campbell I. D.; Day A. J.; Jackson D. G. Structure of the regulatory hyaluronan binding domain in the inflammatory leukocyte homing receptor CD44. Mol. Cell 2004, 13, 483–496. 10.1016/S1097-2765(04)00080-2. [DOI] [PubMed] [Google Scholar]
- Liu L.-K.; Finzel B. High-resolution crystal structures of alternate forms of the human CD44 hyaluronan-binding domain reveal a site for protein interaction. Acta Crystallogr., Sect. F: Struct. Biol. Cryst. Commun. 2014, 70, 1155–1161. 10.1107/S2053230X14015532. [DOI] [PMC free article] [PubMed] [Google Scholar]
- Ogino S.; Nishida N.; Umemoto R.; Suzuki M.; Takeda M.; Terasawa H.; Kitayama J.; Matsumoto M.; Hayasaka H.; Miyasaka M.; Shimada I. Two-state conformations in the hyaluronan-binding domain regulate CD44 adhesiveness under flow condition. Structure 2010, 18, 649–656. 10.1016/j.str.2010.02.010. [DOI] [PubMed] [Google Scholar]
- Favreau A. J.; Faller C. E.; Guvench O. CD44 receptor unfolding enhances binding by freeing basic amino acids to contact carbohydrate ligand. Biophys. J. 2013, 105, 1217–1226. 10.1016/j.bpj.2013.07.041. [DOI] [PMC free article] [PubMed] [Google Scholar]
- Faller C. E.; Guvench O. Terminal sialic acids on CD44 N-glycans can block hyaluronan binding by forming competing intramolecular contacts with arginine sidechains. Proteins: Struct., Funct., Bioinf. 2014, 82, 3079–3089. 10.1002/prot.24668. [DOI] [PMC free article] [PubMed] [Google Scholar]
- Vuorio J.; Vattulainen I.; Martinez-Seara H. Atomistic fingerprint of hyaluronan–CD44 binding. PLoS Comput. Biol. 2017, 13, e1005663 10.1371/journal.pcbi.1005663. [DOI] [PMC free article] [PubMed] [Google Scholar]
- Takeda M.; Terasawa H.; Sakakura M.; Yamaguchi Y.; Kajiwara M.; Kawashima H.; Miyasaka M.; Shimada I. Hyaluronan recognition mode of CD44 revealed by cross-saturation and chemical shift perturbation experiments. J. Biol. Chem. 2003, 278, 43550–43555. 10.1074/jbc.M308199200. [DOI] [PubMed] [Google Scholar]
- Suzuki T.; Suzuki M.; Ogino S.; Umemoto R.; Nishida N.; Shimada I. Mechanical force effect on the two-state equilibrium of the hyaluronan-binding domain of CD44 in cell rolling. Proc. Natl. Acad. Sci. U. S. A. 2015, 112, 6991–6996. 10.1073/pnas.1423520112. [DOI] [PMC free article] [PubMed] [Google Scholar]
- Majewski M.; Ruiz-Carmona S.; Barril X. An investigation of structural stability in protein-ligand complexes reveals the balance between order and disorder. Commun. Chem. 2019, 2, 1–8. [Google Scholar]
- Schultes S.; de Graaf C.; Haaksma E. E. J.; de Esch I. J. P.; Leurs R.; Krämer O. Ligand efficiency as a guide in fragment hit selection and optimization. Drug Discovery Today: Technol. 2010, 7, e157–e162. 10.1016/j.ddtec.2010.11.003. [DOI] [PubMed] [Google Scholar]
- Liu L.-K.; Finzel B. C. Fragment-based identification of an inducible binding site on cell surface receptor CD44 for the design of protein–carbohydrate interaction inhibitors. J. Med. Chem. 2014, 57, 2714–2725. 10.1021/jm5000276. [DOI] [PubMed] [Google Scholar]
- Fukunishi Y.; Mitomo D.; Nakamura H. Protein– Ligand Binding Free Energy Calculation by the Smooth Reaction Path Generation (SRPG) Method. J. Chem. Inf. Model. 2009, 49, 1944–1951. 10.1021/ci9002156. [DOI] [PubMed] [Google Scholar]
- Bajorath J.; Greenfield B.; Munro S. B.; Day A. J.; Aruffo A. Identification of CD44 residues important for hyaluronan binding and delineation of the binding site. J. Biol. Chem. 1998, 273, 338–343. 10.1074/jbc.273.1.338. [DOI] [PubMed] [Google Scholar]
- Fukunishi Y.; Mikami Y.; Nakamura H. Similarities among receptor pockets and among compounds: analysis and application to in silico ligand screening. J. Mol. Graphics Modell. 2005, 24, 34–45. 10.1016/j.jmgm.2005.04.004. [DOI] [PubMed] [Google Scholar]
- Jorgensen W. L.; Chandrasekhar J.; Madura J. D.; Impey R. W.; Klein M. L. Comparison of simple potential functions for simulating liquid water. J. Chem. Phys. 1983, 79, 926–935. 10.1063/1.445869. [DOI] [Google Scholar]
- Case D. A.; Betz R.; Cerutti D.; Cheatham T. E.; Darden T.; Duke R. E.; Giese T.; Gohlke H.; Goetz A.; Homeyer N.. AMBER16; 2016. San Francisco.
- Maier J. A.; Martinez C.; Kasavajhala K.; Wickstrom L.; Hauser K. E.; Simmerling C. ff14SB: improving the accuracy of protein side chain and backbone parameters from ff99SB. J. Chem. Theory Comput. 2015, 11, 3696–3713. 10.1021/acs.jctc.5b00255. [DOI] [PMC free article] [PubMed] [Google Scholar]
- Frisch M.; Trucks G.; Schlegel H.; Scuseria G.; Robb M.; Cheeseman J.; Montgomery J. Jr.; Vreven T.; Kudin K.; Burant J.; et al. Gaussian 03; revision c. 02; Gaussian. Inc.: Wallingford, CT, 2004, 4.
- Wang J.; Wang W.; Kollman P. A.; Case D. A. Automatic atom type and bond type perception in molecular mechanical calculations. J. Mol. Graphics Modell. 2006, 25, 247–260. 10.1016/j.jmgm.2005.12.005. [DOI] [PubMed] [Google Scholar]
- Wang J.; Wolf R. M.; Caldwell J. W.; Kollman P. A.; Case D. A. Development and testing of a general amber force field. J. Comput. Chem. 2004, 25, 1157–1174. 10.1002/jcc.20035. [DOI] [PubMed] [Google Scholar]
- Darden T.; York D.; Pedersen L. Particle mesh Ewald: An N log (N) method for Ewald sums in large systems. J. Chem. Phys. 1993, 98, 10089–10092. 10.1063/1.464397. [DOI] [Google Scholar]
- Hess B.; Bekker H.; Berendsen H. J. C.; Fraaije J. G. E. M. LINCS: a linear constraint solver for molecular simulations. J. Comput. Chem. 1997, 18, 1463–1472. . [DOI] [Google Scholar]
- Abraham M. J.; Murtola T.; Schulz R.; Páll S.; Smith J. C.; Hess B.; Lindahl E. GROMACS: High performance molecular simulations through multi-level parallelism from laptops to supercomputers. SoftwareX 2015, 1-2, 19–25. 10.1016/j.softx.2015.06.001. [DOI] [Google Scholar]
- Humphrey W.; Dalke A.; Schulten K. VMD: visual molecular dynamics. J. Mol. Graphics 1996, 14, 33–38. 10.1016/0263-7855(96)00018-5. [DOI] [PubMed] [Google Scholar]
- Schrödinger L. L. C.The PyMOL Molecular Graphics System; 2010.
- Kabsch W.; Sander C. Dictionary of protein secondary structure: pattern recognition of hydrogen-bonded and geometrical features. Biopolymers 1983, 22, 2577–2637. 10.1002/bip.360221211. [DOI] [PubMed] [Google Scholar]
- Torrie G. M.; Valleau J. P. Nonphysical sampling distributions in Monte Carlo free-energy estimation: Umbrella sampling. J. Comput. Phys. 1977, 23, 187–199. 10.1016/0021-9991(77)90121-8. [DOI] [Google Scholar]
- Torrie G. M.; Valleau J. P. Monte Carlo free energy estimates using non-Boltzmann sampling: Application to the sub-critical Lennard-Jones fluid. Chem. Phys. Lett. 1974, 28, 578–581. 10.1016/0009-2614(74)80109-0. [DOI] [Google Scholar]
- Patey G. N.; Valleau J. P. The free energy of spheres with dipoles: Monte Carlo with multistage sampling. Chem. Phys. Lett. 1973, 21, 297–300. 10.1016/0009-2614(73)80139-3. [DOI] [Google Scholar]
- Yang C.-Y.; Sun H.; Chen J.; Nikolovska-Coleska Z.; Wang S. Importance of ligand reorganization free energy in protein– ligand binding-affinity prediction. J. Am. Chem. Soc. 2009, 131, 13709–13721. 10.1021/ja9039373. [DOI] [PMC free article] [PubMed] [Google Scholar]
- Watanabe Y. S.; Fukunishi Y.; Nakamura H. Generation of a flexible loop structural ensemble and its application to induced-fit structural changes following ligand binding. Biophysics 2006, 2, 1–12. 10.2142/biophysics.2.1. [DOI] [PMC free article] [PubMed] [Google Scholar]
- Watanabe Y. S.; Kim J. G.; Fukunishi Y.; Nakamura H. Free energy landscapes of small peptides in an implicit solvent model determined by force-biased multicanonical molecular dynamics simulation. Chem. Phys. Lett. 2004, 400, 258–263. 10.1016/j.cplett.2004.10.118. [DOI] [Google Scholar]
- Cramer C. J.; Truhlar D. G. General parameterized SCF model for free energies of solvation in aqueous solution. J. Am. Chem. Soc. 1991, 113, 8305–8311. 10.1021/ja00022a017. [DOI] [Google Scholar]
- Hawkins G. D.; Cramer C. J.; Truhlar D. G. Pairwise solute descreening of solute charges from a dielectric medium. Chem. Phys. Lett. 1995, 246, 122–129. 10.1016/0009-2614(95)01082-K. [DOI] [Google Scholar]
- Onufriev A.; Bashford D.; Case D. A. Modification of the generalized Born model suitable for macromolecules. J. Phys. Chem. B 2000, 104, 3712–3720. 10.1021/jp994072s. [DOI] [Google Scholar]
- Schaefer M.; Karplus M. A comprehensive analytical treatment of continuum electrostatics. J. Phys. Chem. 1996, 100, 1578–1599. 10.1021/jp9521621. [DOI] [Google Scholar]
- Still W. C.; Tempczyk A.; Hawley R. C.; Hendrickson T. Semianalytical treatment of solvation for molecular mechanics and dynamics. J. Am. Chem. Soc. 1990, 112, 6127–6129. 10.1021/ja00172a038. [DOI] [Google Scholar]
- Lee M. S.; Olson M. A. Calculation of absolute protein-ligand binding affinity using path and endpoint approaches. Biophys. J. 2006, 90, 864–877. 10.1529/biophysj.105.071589. [DOI] [PMC free article] [PubMed] [Google Scholar]
- Kuhn B.; Kollman P. A. Binding of a diverse set of ligands to avidin and streptavidin: an accurate quantitative prediction of their relative affinities by a combination of molecular mechanics and continuum solvent models. J. Med. Chem. 2000, 43, 3786–3791. 10.1021/jm000241h. [DOI] [PubMed] [Google Scholar]
Associated Data
This section collects any data citations, data availability statements, or supplementary materials included in this article.


