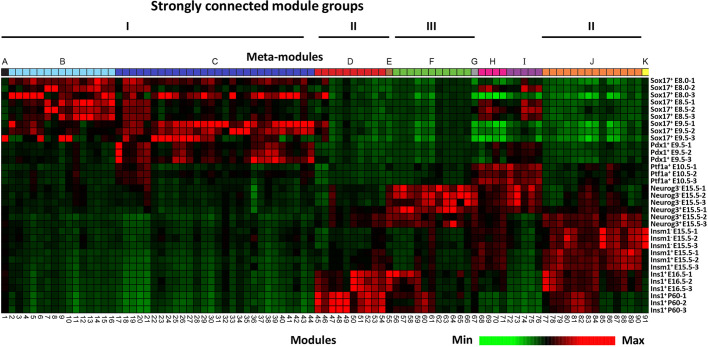
Fig. 2.
Meta-network defined by module eigengenes highlights a shift in transcriptome dynamic prior to endocrine specification. A heatmap-based clustering of the eigengenes of the 91 modules comprising the meta-network illustrated in Fig. 1B reveals a distinct shift in expression pattern just prior to endocrine specification. Modules (columns) are organized according to meta-modules denoted as colored blocks at the top (as in Fig. 1B) and clustered based on correlation between eigengenes within each meta-module. Samples (rows) are clustered by correlation in eigengene-standardized expression across the modules.

