

Abstract
Contrary to common stereotypes, loneliness is not restricted to old age but can occur at any life stage. In this study, we used data from a large, nationally representative German study (N = 16,132) to examine and explain age differences in loneliness from late adolescence to oldest old age. The age distribution of loneliness followed a complex non-linear trajectory, with elevated loneliness levels among young adults and among the oldest old. The late-life increase in loneliness could be explained by lower income levels, higher prevalence of functional limitations, and higher proportion of singles in this age group. Consistent with an age-normative perspective, the association of income, relationship status, household size, and work status with loneliness differed between different age groups. In contrast, indicators of the quantity of social relationships (social engagement, number of friends, contact frequency) were universally associated with loneliness regardless of age. Overall, these findings show that sources of loneliness in older adults are well understood. Future research should focus on understanding the specific sources of loneliness in middle-aged adults.
Keywords: loneliness, perceived social isolation, age differences, life-span development
Lonely people are often depicted as older adults relegated to a solitary existence. The reality, however, is that loneliness is experienced by people of all ages and is not confined to people who live solitary lives. To begin, loneliness is not synonymous with being alone. Loneliness is commonly defined as a perceived discrepancy between desired and actual social relationships (Peplau & Perlman, 1982), and therefore is also often called perceived social isolation. Perceived social isolation is distinguishable from objective social isolation, living alone, and solitude in that the latter circumstances may or may not be distressing, dependent in large part on whether people have control over the frequency with which they socialize, their living arrangements, and the amount of time they spend alone. Loneliness is characterized by a perceived lack of control over the quantity and especially the quality of one’s social activity (Newall et al., 2009; Schulz, 1976).
Furthermore, loneliness is not restricted to old age. Rather, extant data suggest that loneliness levels tend to peak in young adulthood (defined here as < 30 years) and then diminish through middle adulthood (30 – 65 years) and early old age (65 – 80 years) before gradually increasing such that loneliness levels do not reach and surpass young adult levels until oldest old age (> 80 years) (for meta-analyses and reviews, see Perlman, 1990; Pinquart & Sörensen, 2003; Qualter et al., 2015).
Age differences in loneliness may arise from two distinct sources. First, the risk factors associated with increased levels of loneliness may be more prevalent in one age group than another. For instance, higher levels of loneliness among older adults are often attributed to the smaller social networks, greater percentage of single households, and more prevalent and/or severe functional limitations among this age group relative to younger adults (de Jong Gierveld & van Tilburg, 1999; Green, Richardson, Lago, & Schatten-Jones, 2001; Luo, Hawkley, Waite, & Cacioppo, 2012). Second, the relative impact of a specific risk factor may vary across the life span. For instance, the number of friends may be more strongly correlated with loneliness among adolescents and young adults, for whom friendships are their primary social relationships, than among middle-aged and older adults (Green et al., 2001; Qualter et al., 2015). In the present paper, we examine the age distribution of loneliness and these different sources of age differences in loneliness in a large-scale, nationally representative study from Germany.
Previous Studies on Age Differences in Loneliness
As noted above, previous studies suggest that the age distribution of loneliness is U-shaped with elevated levels in both early and late adulthood and relatively lower levels during mid-adulthood (for reviews, see Pinquart & Sörensen, 2003; Qualter et al., 2015). However, many of these studies have focused on selected age groups rather than the entire adult age range (e.g., Heinrich & Gullone, 2006; Victor & Yang, 2012), making it difficult to distinguish age differences from the many other differences among surveys. This limitation can be addressed by using data from large, age-heterogeneous surveys that incorporate measures of loneliness. To date, such surveys have typically used single items that ask a direct question about the frequency with which respondents experience loneliness (e.g., Victor & Yang, 2012; Yang & Victor, 2011). Responses allow a direct assessment of the prevalence of loneliness, but face-valid questions about loneliness may elicit biased responses, and certain subgroups are more likely than others to underreport loneliness when asked directly (Borys & Perlman, 1985; Nicolaisen & Thorsen, 2014). In the case of age, loneliness may be more readily reported in older age when it is considered age-typical than in younger age. Indirect measures reduce this bias by asking about deficits, and feelings about deficits, in social relationships and by avoiding the use of terms like “lonely” and “loneliness.” Indirect measures are also invariably multi-item measures that offer greater reliability than single-item measures. Moreover, recent studies have shown that prevalence findings obtained with a single direct item do not generalize to multi-item indirect loneliness questionnaires, and the two types of loneliness measures do not produce equivalent correlations with age (Nicolaisen & Thorsen, 2014; Shiovitz-Ezra & Ayalon, 2012).
Another limitation of many previous studies is that age is treated as a categorical variable such that the respondents are grouped into different age groups (e.g., Victor & Yang, 2012). This approach is no doubt suitable to detect general age trends, but the use of broad age groups may conceal subtle age differences and discontinuities in the age distribution.
In sum, prior findings on age differences in loneliness need to be replicated in samples that represent the entire life span and in which loneliness is measured indirectly with multiple items. In this study, we used the first panel-wide loneliness data collected as part of the nationally representative German Socioeconomic Panel (SOEP; Wagner, Frick, & Schupp, 2007) to examine the age distribution of loneliness from late adolescence to oldest old age in Germany and to explain these age differences. Loneliness was measured with a three-item measure first validated in the Health and Retirement Study (HRS) (Hughes, Waite, Hawkley, & Cacioppo, 2004) and translated to German for use in the SOEP (Hawkley, Duvoisin, Ackva, Murdoch, & Luhmann, 2015).
Explaining Age Differences in Loneliness
Previous research has identified a host of risk factors for loneliness, ranging from female gender and low income to health problems to low quantity and quality of social relationships (Cohen-Mansfield, Hazan, Lerman, & Shalom, 2015; Hawkley et al., 2008; Pinquart & Sörensen, 2003; Victor & Yang, 2012). These variables may also account for age differences in loneliness in two ways. First, age differences in loneliness may be due to age differences in the distribution of these risk factors. In this case, one would expect that the impact of a specific variable on loneliness is similar in all age groups, but that higher prevalence of a specific risk factor is sufficient to account for higher loneliness in that age group. Second, age differences in loneliness may also be due to age differences in the impact of a specific variable on loneliness. Certain factors may matter more in youth than in old age, and vice versa, and other factors may operate similarly across age (Qualter et al., 2015). Whether a certain life context is associated with loneliness is expected to depend, at least in part, on whether an individual perceives that the context is normative at that age. Sociocultural norms play a role in defining the desired and expected level of social engagement, and loneliness may ensue when the actual quantity and/or quality of social relationships do not meet normative expectations (Ayalon, Palgi, Avidor, & Bodner, 2015). These norms change over the life course. For instance, a teenage girl may feel lonely if she has only two good friends whereas an 80-year old woman may feel very connected because she still has two good friends. Norms for social engagement also differ between different life stages which are characterized by unique developmental goals (Heckhausen, Wrosch, & Schulz, 2010). For instance, young adults are focused on building social networks, launching careers, and establishing lifetime partnerships. Hence, having few friends, no job, and no romantic partner may be particularly strong risk factors for loneliness among young adults.
The age-normative life stage perspective informs our review of the factors that are likely to influence loneliness at each age. We review factors that have been associated with loneliness at different ages and focus specifically on those factors that we were able to examine using the SOEP data, beginning with the most distal causes and ending with the most proximal causes of loneliness. According to Hawkley et al. (2008), distal factors are structural variables that affect loneliness indirectly through their impact on more proximal, interpersonal factors.
Sociodemographic factors
Empirical findings on gender differences in loneliness are inconsistent and seem to vary as a function of how loneliness is measured. For example, in two studies, loneliness was more prevalent in women when a single-item measure was used, but men were as lonely as or even lonelier than women when multi-item measures of loneliness (i.e., the UCLA Loneliness Scale and the De Jong Gierveld Scale) were used (Borys & Perlman, 1985; Nicolaisen & Thorsen, 2014).
Socioeconomic status has been associated with loneliness in adults, whether measured in terms of income or educational attainment. For instance, in a nationally representative sample of over 24,000 17–65 year-olds in the Netherlands, the odds of severe loneliness were three times higher in the lowest than the highest income group (Bosma, Jansen, Schefman, Hajema, & Feron, 2015). Higher levels of education are consistently associated with lower levels of loneliness even after adjusting for possible confounds such as income, health, and marital status (Hawkley et al., 2008; Savikko, Routasalo, Tilvis, Strandberg, & Pitkälä, 2005). It is unclear, however, whether income and education are more important predictors of loneliness in some age groups than in others.
Loneliness appears to vary with employment status. For instance, employed young adults have been observed to be less lonely than their unemployed counterparts (Creed & Reynolds, 2001). Employment is expected to be associated with lower levels of loneliness because of the “latent functions” of employment, which include time structure, social contact, collective purpose, status, and activity (Paul & Batinic, 2010). However, employment may also contribute to higher levels of loneliness because it restricts one’s available leisure time and thereby may be associated with fewer interactions with friends and family. Across the life span, work status may be a particularly strong predictor of loneliness during the period in which having a job is the norm, that is, between 30 and 65 years.
Marital status and living arrangements
Being married is robustly associated with lower levels of loneliness (Stack, 1998). Marriage appears to be more important for loneliness in older than in younger adults (Green et al., 2001; Victor & Yang, 2012), a finding that likely reflects the increasing importance of the marital relationship with age (Choi & Marks, 2008). Nevertheless, the formation of an intimate relationship and partnership in young adults is a developmental accomplishment that when thwarted could trigger feelings of loneliness (Qualter et al., 2015). Relationship status may therefore be associated with loneliness in all age groups, but the strength of this association may increase with increasing age.
Age differences in loneliness may also be due to age differences in living arrangements. Among both younger and older German adults, the proportion of people living alone is substantially higher than among middle-aged adults (Statistisches Bundesamt, 2011). Living alone (versus living with others or versus living with a partner) is robustly associated with loneliness (Sundström, Fransson, Malmberg, & Davey, 2009; Victor, Scambler, Bond, & Bowling, 2000). For instance, in a random sample of over 800 Dutch older adults, living with a spouse or partner was associated with lower levels of loneliness than living alone or living with non-spousal others, even after adjusting for demographic factors, socioeconomic status, health, and network size and support (de Jong Gierveld & van Tilburg, 1999). The size of the household does not itself protect against loneliness or isolation (Victor et al., 2000). The link between living alone and loneliness appears to be weakening over time, however (Victor et al., 2002), possibly because the proportion of people living alone has been rising steadily over the last decades in most Western nations (Klinenberg, 2012). Young adults in particular choose to live alone for years longer than has been the norm in the past (Klinenberg, 2012). Hence, the impact of household size on loneliness may be weaker for young adults than for middle-aged or older adults.
The presence of children in the household is of particular interest for young and middle-aged adults. Living with young children is associated with responsibilities that restrict one’s social opportunities and may therefore be associated with higher levels of loneliness. On the other hand, having no children in the household may also be associated with higher levels of loneliness, for instance in middle-aged adults who are childless and thus socially peripheralized, or who are experiencing the isolation of children having left the home (i.e., empty nest syndrome). In sum, living arrangements may be associated with loneliness across age, but the direction of this association may differ between different age groups.
Physical functioning
Health issues are both precursors and consequences of loneliness. From youth to old age, loneliness is prospectively associated with depressive symptoms, poor sleep quality, and lower self-reported health (Hawkley & Capitanio, 2015). But health issues can also trigger loneliness, particularly if they are associated with functional limitations that reduce people’s opportunities for social participation in daily life. Functional limitations have been associated with greater loneliness in, for example, adults with paraplegia from spinal cord injury (Tzonichaki & Kleftaras, 2002), individuals with health-related reductions in the ability to perform the activities of daily living (Cohen-Mansfield et al., 2013; Luo et al., 2012), and older adults who lack both private and accessible public transport (Dahlberg, Andersson, McKee, & Lennartsson, 2015). While these findings suggest that functional limitations may increase loneliness in all age groups, a recent study in the United Kingdom found that functional limitations were associated with loneliness only in young (15–29 years) and mid-aged adults (30–59 years), but not in older adults (> 60 years) (Victor & Yang, 2012). Poor health and functional limitations are rare in younger individuals, and this deviation from age-typical norms may increase the size of the association with loneliness in younger relative to older adults for whom health and mobility are expected to decline.
Social engagement
A greater degree of social engagement – socializing with friends and relatives, participating in social groups, attending church, and volunteering – is consistently associated with lower levels of loneliness from childhood through to old age (Croezen, Haveman-Nies, Alvarado, Van’t Veer, & De Groot, 2009; Rotenberg et al., 2010), and experimental studies that increase social engagement have been shown to reduce loneliness in young adults (Lucas, Knowles, Gardner, Molden, & Jefferis, 2010).
Social relationships
Young adults are motivated to develop and expand a social network of their own choosing as they launch lives outside the family of origin and for them a large network was seen to offer better protection against loneliness than it did in older adults (Green et al., 2001). Consistent with this finding, age differences were observed among 235 13–67 year-old refugees from the former German Democratic Republic (now East Germany) who migrated to West Germany. New friendships increased and loneliness decreased overall, but younger individuals formed larger networks than older adults over three annual assessments (Jerusalem, Hahn, & Schwarzer, 1996).
Frequency of social contact has also been observed to correlate more highly with loneliness in young and middle-aged adults than in older adults (Victor & Yang, 2012). For older adults, on the other hand, the quality or closeness of network relationships has a larger negative association with loneliness than it has in younger adults (Green et al., 2001; Victor & Yang, 2012), a phenomenon that may be attributable to the greater emphasis on quality social relationships with increasing age predicted by socioemotional selectivity theory (Carstensen, Isaacowitz, & Charles, 1999). The shift in emphasis from quantity to quality may begin even earlier than old age. A recent prospective study showed that the quantity (but not quality) of social interactions at age 20, and the quality (but not quantity) of social interactions at age 30 predicted loneliness 30 years later, at age 50 (Carmichael, Reis, & Duberstein, 2015).
Research suggests that the importance of different types of social contacts for loneliness changes over the life course. In a study of 325 19–85 year-olds, Segrin (2003) found that the association between loneliness and contact with family members was largest in the younger age group, suggesting that older adults are less dependent on family contact to maintain a feeling of connectedness. Contact with friends, on the other hand, was equally potent in protecting against loneliness in young and older participants. In a study of 3,589 24–75-plus year-olds in the American’s Changing Lives Survey, no age differences were found in associations between loneliness and numbers of friends, confidants, and children (Schnittker, 2007). Aging is associated with an increase in risk factors that limit social activity, such as loss of a spouse and mobility limitations. Some research has shown that age is no longer associated with loneliness when age-related risk factors are held constant (Jylhä, 2004; Queen, Stawski, Ryan, & Smith, 2014; Tijhuis, De Jong-Gierveld, Feskens, & Kromhout, 1999; Wenger & Davies, 1996). In the American’s Changing Lives Survey, reports of loneliness actually declined with age despite role losses (Schnittker, 2007). These divergent findings do not permit hypotheses about age differences in the contributions of social contact type and frequency to feelings of loneliness.
Research Objectives
In the present paper, we examined age differences in loneliness in a large, cross-sectional, and nationally representative sample of Germans using an indirect, multi-item measure of loneliness. To the best of our knowledge, this is the first study to use loneliness data acquired in a single nationally representative sample across the entire adult age span. As such, these data allow direct comparisons of loneliness levels across age. In addition, the potency of various loneliness risk factors can be directly compared across age groups, because the same set of explanatory variables was used at all ages. Our analyses were guided by three main research questions. First, how is loneliness distributed across the life span? Second, to what extent can the observed age differences in loneliness be explained by age differences in sociodemographic factors, relationship status and living arrangements, functional limitations, social engagement, and frequency of social contact? Finally, to what extent do these factors vary in the strength of their association with loneliness across age? In particular, we expected that the associations of work status, relationship status, living arrangements, functional limitations, and number of friends with loneliness differ between different age groups. In addition, we also explored age differences in the associations between loneliness and those variables included in this study for which we had no clear hypotheses with respect to their differential association with loneliness across age.
Methods
Sample
The Socioeconomic Panel (SOEP; Wagner et al., 2007) is a large-scale panel study of German households first started in 1984. All household members aged 17 and above are interviewed on an annual basis. Original households were sampled from the total German population using a multi-stage stratified sampling procedure and are representative of the German population in terms of sociodemographic characteristics such as gender, age, sociodemographic status, and geographic region (for details, see Haisken-DeNew & Frick, 2005). All household members are retained in the SOEP even if they leave the original household (e.g., children moving out). To compensate for sample mortality, refreshment samples are added to the panel at regular intervals. In addition, specific groups such as immigrants or high-income households are oversampled to ensure a sufficient sample size for these groups.
For the present study, we used data collected in 2013, the latest available wave and the first wave in which loneliness was measured. The total sample size in this wave was N = 19,406. We selected those participants who provided valid data on all variables analyzed in this study (N = 16,132, 53.0% female, age range from 18 to 103 with Mage = 53.3, Mdage = 54, and SDage = 17.2). These participants were nested within 10,256 households (corresponding to an average of 1.6 participants per household). Of these households, 5078 households (49.5 %) provided one participant, 4595 households (44.8 %) provided two participants, and the remaining 583 households (5.7 %) provided three or more participants.
To ensure that our findings are generalizable to the total German population, we applied cross-sectional sample weights in all analyses. By using sample weights, data from groups of participants who are underrepresented in the sample relative to their representation in the population gain more weight in the analyses than data from groups of participants who are overrepresented in the sample relative to their representation in the population (e.g., high-income households).
To evaluate the replicability of our findings and to reduce the risk of reporting false positives, we randomly split the sample into two subsamples (Sample A with n = 7,962 and Sample B with n = 8,170) and conducted our analyses separately in both subsamples. Due to the large size of the total sample, both subsamples were still large enough to detect even small effects with a statistical power of > .95. The two subsamples did not differ significantly on any of the variables included in our analyses.
For some analyses (see below), the sample was additionally split into three age groups: < 30 years (young adults, n = 1,903), 30 to 65 years (middle-aged adults, n = 9,881), and > 65 years (old age, n = 4,348). These specific age groups were chosen for several reasons. First, they reflect major developmental stages. Second, these age groups have been used in and are therefore more readily compared with results of other studies (e.g., Victor & Yang, 2012). Third, preliminary analyses suggested that these age groups are distinct with respect to the distribution of various predictor variables (see supplemental material). For instance, the proportion of people living with their partner is less than 20% among young adults and above 60% throughout mid-adulthood into old age. After (but not before) age 65, the majority of the participants did not work and had at least mild functional limitations due to health issues. Although our sample size would have allowed us to define more narrow age groups, doing so would have inflated the number of separate tests and increased the risk of Type I errors. Table 1 provides detailed descriptive statistics for the total sample and separately for the three age groups.
Table 1.
Descriptive statistics for all variables for the total sample and by age group and their bivariate associations with loneliness.
| Variable | Total sample | < 30 years | 30–65 years | > 65 years | Association with loneliness | ||||||
|---|---|---|---|---|---|---|---|---|---|---|---|
| % or M | SD | % or M | SD | % or M | SD | % or M | SD | r | M | SD | |
| Loneliness | 0.99 | 0.75 | 1.05 | 0.72 | 1.01 | 0.74 | 0.94 | 0.76 | |||
| Age | 53.29 | 17.16 | 24.73 | 3.44 | 49.42 | 9.52 | 74.57 | 6.12 | −.04*** | ||
| Gender | |||||||||||
| female | 53.0% | 51.9% | 53.9% | 51.5% | 1.03a | 0.77 | |||||
| male | 47.0% | 48.1% | 46.1% | 48.5% | 0.95b | 0.71 | |||||
| Log-Income | 7.84 | 0.59 | 7.78 | 0.66 | 7.94 | 0.59 | 7.65 | 0.52 | −.20*** | ||
| Years of education | 12.40 | 2.72 | 12.32 | 2.39 | 12.65 | 2.73 | 11.87 | 2.75 | −.08*** | ||
| Work status | |||||||||||
| not working | 42.1% | 29.4% | 21.7% | 94.2% | 1.05a | 0.81 | |||||
| working full-time | 37.2% | 38.3% | 53.0% | 1.1% | 0.94b | 0.68 | |||||
| other work status | 20.6% | 32.3% | 25.4% | 4.8% | 0.99c | 0.72 | |||||
| Living arrangements | |||||||||||
| Household size | |||||||||||
| 1 person | 18.6% | 19.2% | 14.4% | 27.7% | 1.17a | 0.84 | |||||
| 2 persons | 45.6% | 28.4% | 39.1% | 67.9% | 0.94b | 0.72 | |||||
| 3 or more persons | 35.9% | 52.4% | 46.5% | 4.4% | 0.96b | 0.71 | |||||
| Children in household | |||||||||||
| Yes | 22.5% | 23.6% | 32.0% | 0.5% | 0.98a | 0.72 | |||||
| No | 77.5% | 76.4% | 68.0% | 99.5% | 1.00a | 0.75 | |||||
| Relationship status | |||||||||||
| Single | 21.9% | 38.4% | 16.3% | 27.2% | 1.20a | 0.86 | |||||
| Not living with partner | 7.8% | 27.2% | 6.4% | 2.6% | 1.01b | 0.75 | |||||
| Living with partner | 70.3% | 34.4% | 77.3% | 70.2% | 0.93c | 0.69 | |||||
| Functional limitations | |||||||||||
| not at all | 63.7% | 88.3% | 68.6% | 42.0% | 0.90a | 0.68 | |||||
| somewhat | 25.5% | 10.0% | 22.9% | 38.3% | 1.06b | 0.76 | |||||
| severely | 10.7% | 1.7% | 8.5% | 19.8% | 1.37c | 0.95 | |||||
| Social engagement | |||||||||||
| Volunteering in clubs etc. | 0.64 | 1.09 | 0.58 | 1.02 | 0.66 | 1.10 | 0.62 | 1.10 | −.06*** | ||
| Religious engagement | 0.70 | 0.95 | 0.50 | 0.81 | 0.66 | 0.90 | 0.88 | 1.06 | −.06*** | ||
| Political engagement | 0.17 | 0.52 | 0.13 | 0.44 | 0.17 | 0.53 | 0.18 | 0.52 | −.02** | ||
| No of friends | 4.27 | 3.69 | 4.92 | 3.53 | 4.13 | 3.50 | 4.30 | 4.15 | −.13*** | ||
| Contact frequency | |||||||||||
| Face-to-face contact with friends | 2.11 | 0.92 | 2.61 | 0.84 | 2.10 | 0.87 | 1.92 | 0.99 | −.13*** | ||
| Face-to-face contact with relatives | 2.25 | 0.96 | 2.28 | 0.93 | 2.25 | 0.95 | 2.25 | 1.01 | −.10*** | ||
| Contact with friends/relatives abroad | 1.10 | 1.31 | 1.36 | 1.46 | 1.13 | 1.31 | 0.91 | 1.21 | .003 | ||
| Use of social online networks | 1.35 | 1.71 | 3.12 | 1.45 | 1.40 | 1.68 | 0.46 | 1.13 | .05*** | ||
| N | 16,132 | 1,903 | 9,881 | 4,348 | |||||||
Notes. Loneliness was measured on a scale from 0 to 4. The bivariate associations with loneliness are provided in terms of bivariate correlations for continuous variables and in terms of group means for categorical variables. For categorical variables, loneliness group means that share a letter do not differ significantly from each other, as determined with Tukey post hoc tests.
p < .001,
p <. 01,
p < .05.
Measures
Loneliness was measured with a three-item version of the UCLA Loneliness Scale (Russell, 1996) developed specifically for large surveys (Hughes et al., 2004) and translated to German for use in the SOEP (Hawkley et al., 2015). Participants indicated how often they miss the company of other people, feel left out, and feel socially isolated on a 5-point scale ranging from never (0) to very often (4). These three items were originally selected based on their high factor loadings on the dominant first factor of the UCLA Loneliness Scale and have been shown to correlate strongly with the full 20-item version of the UCLA Loneliness Scale and as strongly as the full version with correlates of loneliness such as depression and perceived stress (Hughes et al., 2004). In the present sample, the internal consistency was α = .78. The accuracy of the German translation was evaluated through a back-translation of the German items to English by a native English speaker. The English version of this scale used in the Health & Retirement Study and the National Social Life, Health, and Aging Project, and the German version used in SOEP were found, in a series of multigroup factor analyses, to exhibit measurement invariance and to correlate similarly with correlates of loneliness such as self-rated health and frequency of social activity (Hawkley et al., 2015). Additional analyses showed that in the present sample, the three items were measurement-invariant across the three age groups.1
Predictors were grouped in sets, where the sets were gender, socioeconomic status (income, education), work status, living arrangements (household size, children living in the household), relationship status, functional limitations, social engagement (political engagement, volunteering, religious engagement), number of friends, and contact frequency (face-to-face contact with friends, face-to-face-contact with relatives, contact with people abroad, contact through social online networks).
Income and years of education were used as indicators of socioeconomic status. Income was measured as net household income in Euro and log-transformed to account for its skewed distribution. Years of education is a generated variable provided in the SOEP reflecting the total number of years spent in primary (e.g., elementary school), secondary (e.g., high school), and tertiary education (e.g., college). Both variables were centered on the mean of the total sample.
Work status was assessed with a range of detailed categories (e.g., employed full-time, employed part-time, voluntary military service, not employed). We recoded this variable into a new variable with the following categories: not working at all (reference category), working full-time, and all other types of occupation (including part-time employment and retirees who work at least sometimes).
Living arrangements were measured in two ways. Household size was measured by the number of persons living in the same household. This variable was recoded into a new variable with the following categories: living alone, 2-person household (reference category), three-or-more person household. In addition, we included information about whether children aged 16 or younger lived in the household using a dummy variable with 0 = no children living in the household (reference category) and 1 = children living in the household.
Several variables assessed marital and relationship status. Marital status refers to one’s legal marital status (e.g., married and living together, married and living separately, unmarried, divorced). All participants who were not married (or in a civil union in the case of homosexual couples) were additionally asked whether they currently had a relationship and, if yes, whether they currently lived with their partner. This information was used to create a new variable indicating people’s relationship status with the following categories: in a relationship and living with partner (reference category), in a relationship but not living with partner, and single (i.e., persons who do not have a partner, regardless of their legal marital status).
Current physical functioning was assessed with the following item: “Do you have a health problem that limits you in normal everyday life?” Response options were no, not at all; yes, somewhat; and yes, severely. These responses were dummy-coded with no, not at all as reference category.
Social engagement was measured by three separate variables. Frequency of political engagement was assessed with the following item: “How often do you participate in political parties, municipal politics, citizens’ initiatives?” Frequency of volunteering was assessed with the following item: “How often do you do volunteer work in clubs, associations, or social services?” Frequency of engagement in religious groups was measured with the following item: “How often do you go to church or attend religious events?” For these three items, the response options were never (0), seldom (1), at least once per month (2), at least once per week (3), and daily (4).
The following variables were used as quantitative indicators of social contact: number of close friends (assessed with an open response format), frequency of face-to-face contact with neighbors and friends, frequency of face-to-face contact with close family and other relatives, frequency of contact (including telephone and online) with friends and relatives living abroad, and frequency of use of online social networks. The response options for the frequency variables were never (0), seldom (1), at least once per month (2), at least once per week (3), and daily (4).
Descriptive statistics for all variables are provided in Table 1. For the analyses, all continuous predictor variables were centered on the mean.
Data analysis
Age differences in the average loneliness distribution.
The age distribution of loneliness was visualized with a locally weighted scatterplot smoothing (LOESS, acronym also used for LOcal regrESSion) curve fitted to the bivariate distribution of age and loneliness (Cleveland, 1979). LOESS curves are non-parametric and can therefore be used to gauge the complex non-linear shape of a bivariate association without having to impose a specific statistical model (e.g., linear or quadratic). LOESS curves are estimated by splitting the observed values of the predictor variable (here: age) into smaller subsets called smoothing windows and by estimating the regression within each smoothing windows. The resulting regression lines are then smoothed to form the LOESS curve.
To examine how the age distribution changes by adjusting for predictors of loneliness, we regressed loneliness on these predictors and computed the residuals. As before, these residuals were plotted against age and the distribution was visualized with a LOESS line. Both LOESS lines were plotted with 95% confidence bands. In all analyses, loneliness was standardized on the mean and standard deviation of the total sample. Differences in loneliness can therefore be interpreted in terms of standard deviation units (Cohen’s d).
Explaining age differences in loneliness.
The unique contribution of each set of predictors was examined using separate regression models that included (1) all predictors (i.e., complete model) and (2) all predictors except the predictors of interest (incomplete model). The difference in the proportion of explained variance (R2) between these models reflects the proportion of the total variance explained by each set of predictors (utility), over and above all other predictors included in the model. These regression models were fitted separately in the two random subsamples to gauge the robustness of the observed associations.
To visualize the effect of each set of predictors on the age distribution of loneliness, the residuals for the complete and incomplete models were estimated using the complete sample, and the distributions of these residuals were plotted using LOESS curves. Here, for illustrative purposes, we present figures in which the age distributions of the models differed visibly from each other. All other figures are provided in the supplemental material.
Age differences in the relevance of predictors.
We examined whether the strength of the associations between these groups of predictors and loneliness differed across age by testing interaction effects between age and different predictors. For these analyses, we did not treat age as a continuous variable. A significant interaction between age and some predictor would indicate that the effect of this predictor increases or decreases linearly with age. However, it may also be possible that the importance of a predictor is greatest during middle adulthood, that is, that the interaction is non-linear. To model such nonlinearities and discontinuities in the effects of predictors of loneliness across age, it would be necessary to additionally include the interaction effects between the predictors and polynomial terms such as age2, age3, and so on. This approach would not only increase the number of hypotheses tests, but these kinds of non-linear interactions are also hard to interpret. To limit the total number of hypothesis tests and to facilitate interpretation, we treated age as a categorical variable and split the sample into three age groups (see sample description).
The interaction effects were tested separately for each group of predictors, controlling for all other predictors. Although this approach is warranted because we had specific hypotheses about most predictors, it nevertheless requires a large number of separate tests and may therefore increase the probability of Type I error. To reduce the risk of reporting false positives, we therefore conducted the analyses separately in Sample A and Sample B. Only interaction effects that were significant in both subsamples were interpreted. Significant interactions were followed up using Tukey-adjusted post hoc tests. These tests were conducted on the total sample to maximize statistical power and the representativeness and generalizability of the results.
Software.
All analyses were conducted in R version 3.1.3 (R Development Core Team, 2015). The LOESS curves and their confidence bands were estimated using the function loess available in the basic R packages. Omnibus tests for the interaction effects were conducted with the function Anova available in the package car (Fox & Weisberg, 2011). Post hoc tests for significant interactions were conducted with the functions lsmeans (categorical predictors) and lstrends (continuous predictors) available in the package lsmeans (Lenth & Hervé, 2015). To account for the hierarchical structure of our data (individuals nested in households), standard errors were adjusted for clustering using the robcov function available in the package rms (Harrell, 2015).
Results
Age differences in average loneliness levels
The average level of loneliness in the total sample was 0.99 which corresponds to the response option “rarely”. However, there were some significant differences across age. Figure 1 displays the observed distribution of loneliness across age for the entire sample (solid line). From late adolescence until retirement age, the age distribution of observed loneliness levels is characterized by two peaks (around age 30 and around age 60) and two dips (around age 40 and around age 75). Despite this markedly non-linear age distribution, there is a general downward trend in loneliness across young and middle adulthood. The overall lowest levels of loneliness are found around the age of 75 after which the levels rise continuously into old age. As expected, loneliness levels were highest among the oldest old. However, as indicated by the broad confidence band, the average loneliness levels were estimated with less precision in this age group, suggesting that the interindividual variability in loneliness is greatest among oldest adults.
Figure 1.
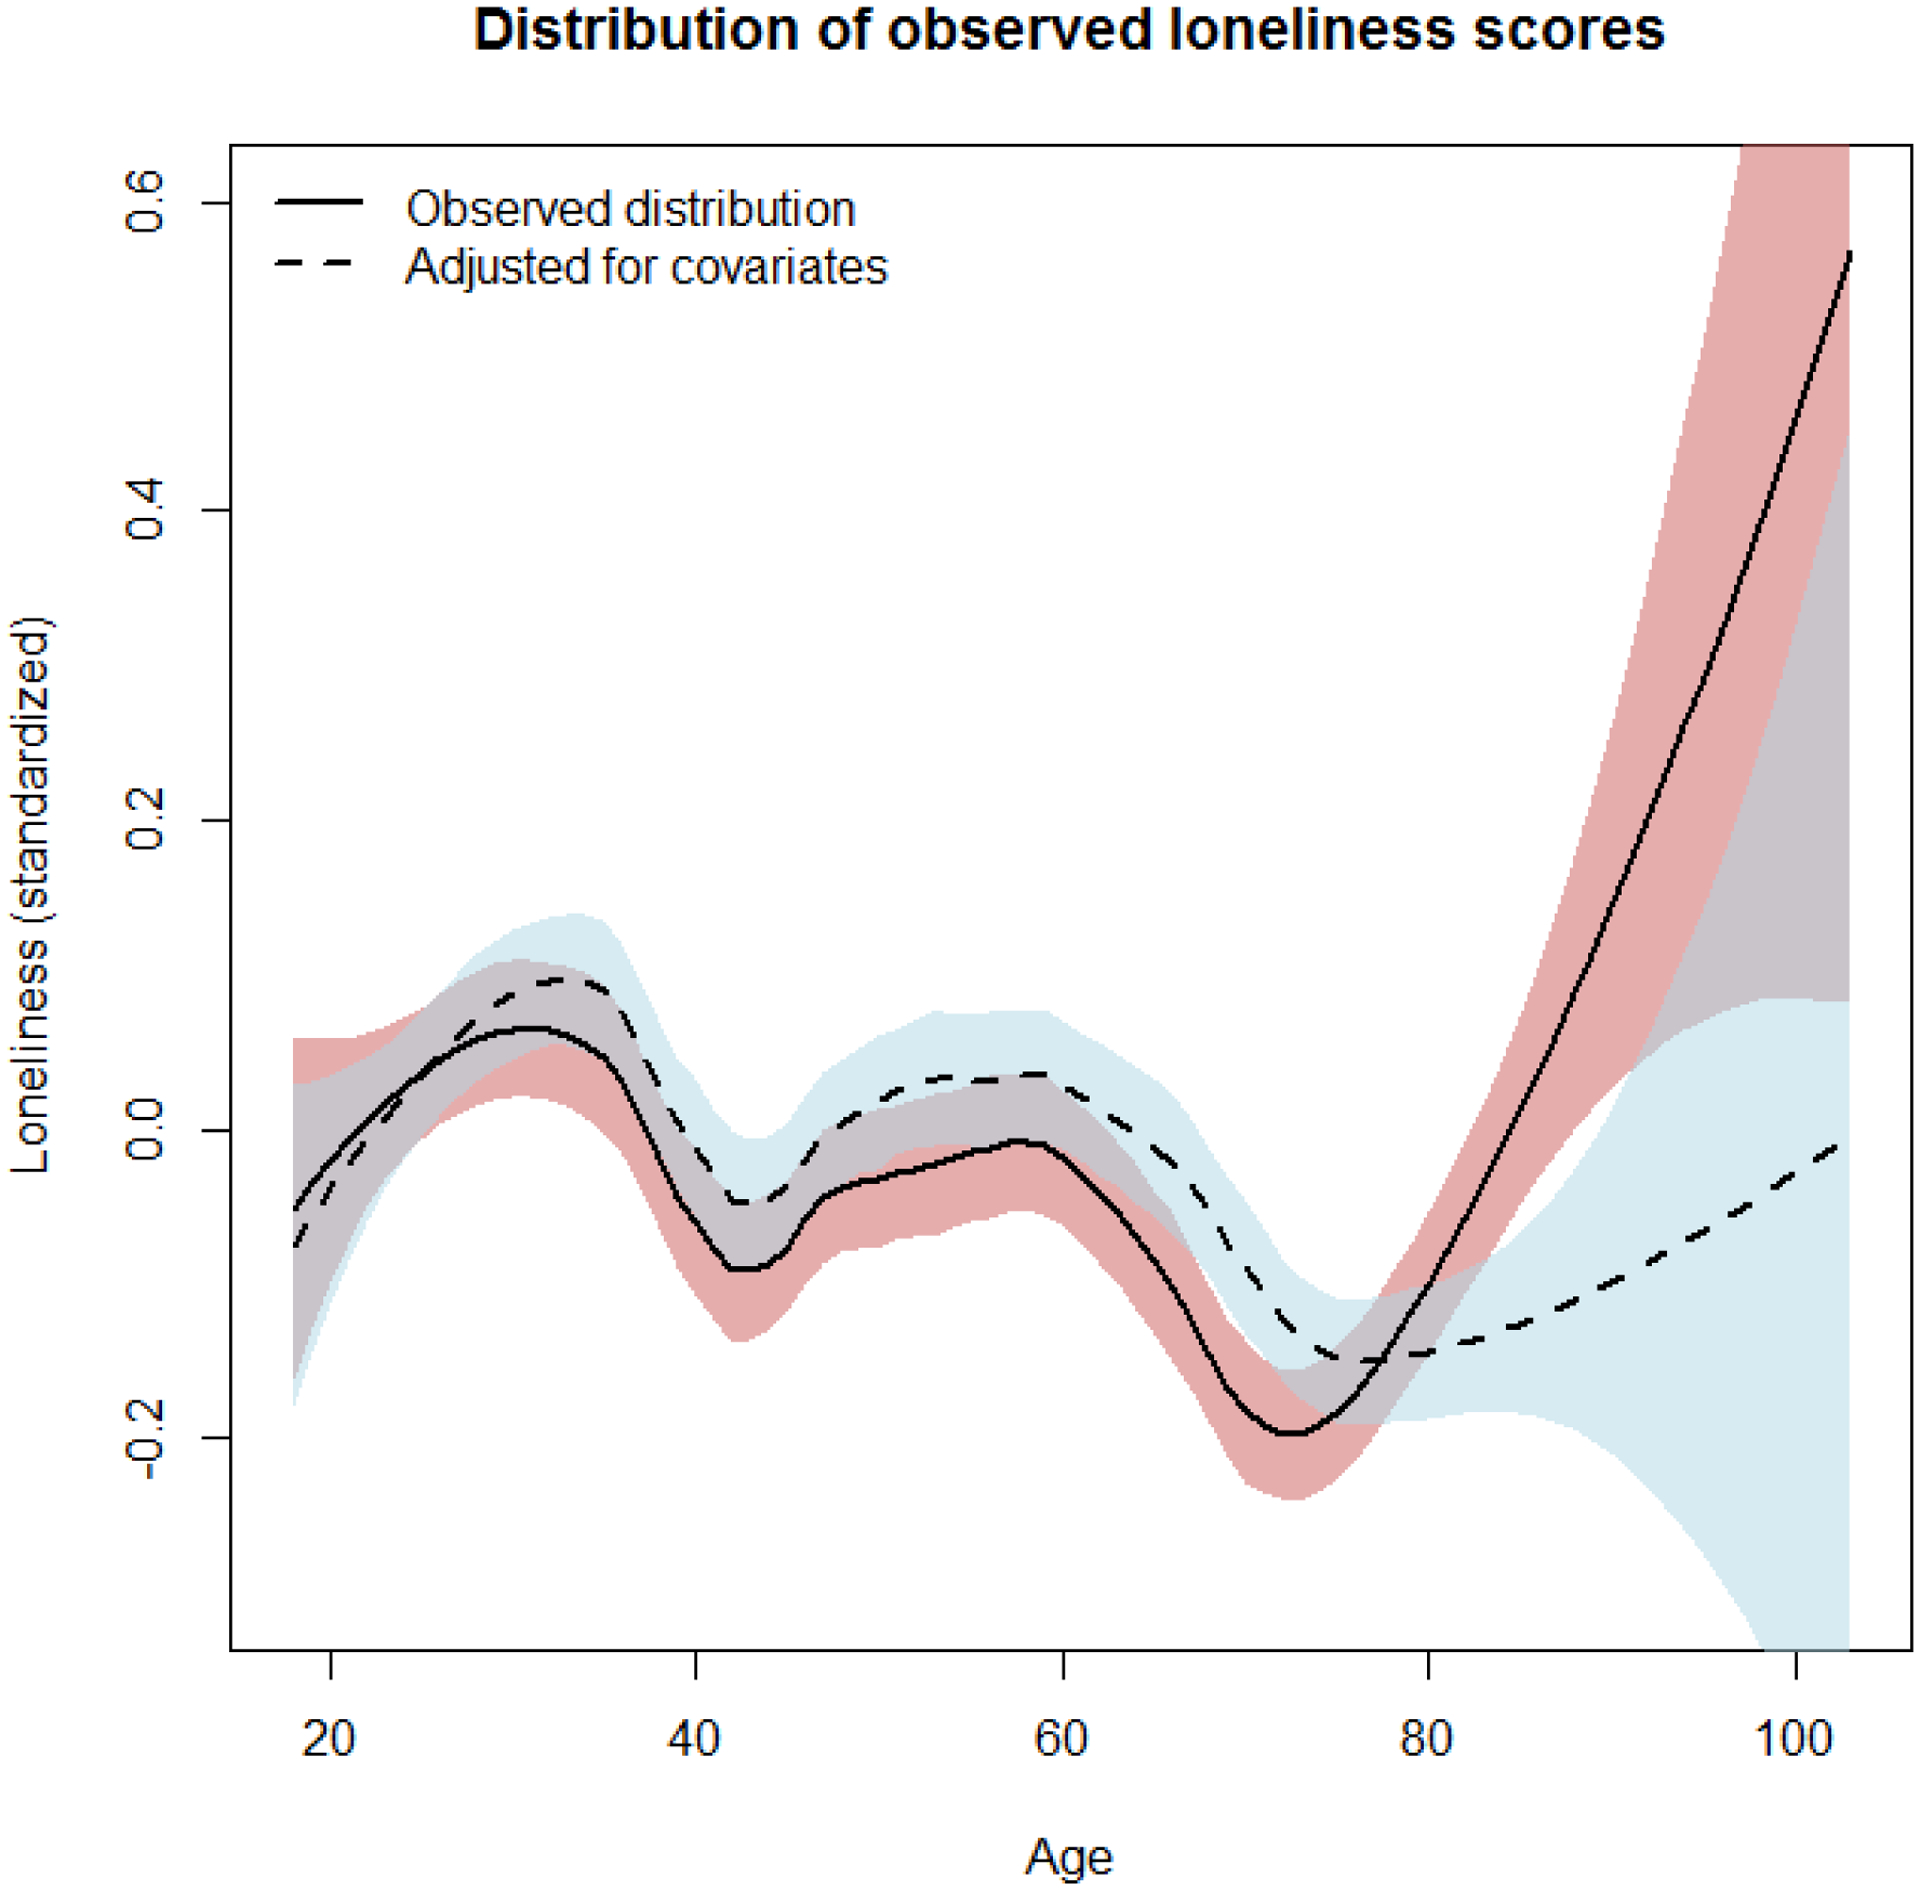
Distribution of observed and adjusted loneliness from adolescence to old age. The confidence bands reflect the 95% confidence interval of the LOESS line.
Explaining age differences in loneliness
Age differences in loneliness arise if the prevalence of important risk factors varies across age. To explain the observed age differences, we therefore adjusted the loneliness scores for a series of covariates that had been associated with loneliness in previous studies. Table 2 shows the regression coefficients for this model separately for Sample A and Sample B. Recall that these coefficients reflect the association between the predictor and loneliness across the entire sample. A significant coefficient does not imply that this predictor contributes to loneliness in every age group, and similarly a non-significant coefficient does not imply that this predictor does not matter for any age group. These questions will be addressed in a separate set of analyses in the next section.
Table 2.
Regression coefficients and utility for sets of predictors.
| Regression coefficients Sample A | Regression coefficients Sample B | Utility Sample A | Utility Sample B | |||
|---|---|---|---|---|---|---|
| Variable | B | SE | B | SE | ΔR2 | ΔR2 |
| (Intercept) | −0.32*** | 0.030 | −0.32*** | 0.032 | ||
| Female | 0.072*** | 0.022 | 0.088*** | 0.023 | .0011** | .0016*** |
| Socioeconomic status | ||||||
| Log-Income | −0.32*** | 0.029 | −0.28*** | 0.028 | .0185*** | .0129*** |
| Years of education | 0.015** | 0.005 | 0.010* | 0.005 | .0012*** | .0005* |
| Work status | .0020*** | .0006 | ||||
| Working full-time | 0.116*** | 0.028 | 0.067* | 0.029 | ||
| Other work status | 0.075* | 0.032 | 0.034 | 0.034 | ||
| Living arrangements | .0043*** | .0048** | ||||
| Household size | ||||||
| 1 person | −0.110* | 0.054 | −0.074 | 0.052 | ||
| 3 or more persons | 0.097** | 0.040 | 0.084* | 0.039 | ||
| Living with children | 0.054 | 0.044 | 0.101* | 0.041 | ||
| Relationship status | .0027*** | .0088*** | ||||
| Not living with a partner | 0.10* | 0.051 | 0.10 | 0.055 | ||
| Single | 0.20*** | 0.051 | 0.33*** | 0.046 | ||
| Functional limitations | .0299*** | .0233*** | ||||
| somewhat | 0.22*** | 0.026 | 0.21*** | 0.028 | ||
| severe | 0.58*** | 0.044 | 0.52*** | 0.044 | ||
| Social engagement | .0006 | .0016** | ||||
| Volunteering | −0.008 | 0.010 | −0.021 | 0.011 | ||
| Political engagement | −0.032 | 0.023 | 0.012 | 0.023 | ||
| Religious engagement | −0.014 | 0.012 | −0.033* | 0.013 | ||
| No. of friends | −0.028*** | 0.003 | −0.021*** | 0.003 | .0101*** | .0047*** |
| Contact frequency | .0214*** | .0198*** | ||||
| Face-to-face contact with friends | −0.111*** | 0.014 | −0.118*** | 0.015 | ||
| Face-to-face contact with relatives | −0.051*** | 0.012 | −0.069*** | 0.013 | ||
| Contact with friends and relatives abroad | 0.038*** | 0.009 | 0.016 | 0.009 | ||
| Use of social online networks | 0.051*** | 0.007 | 0.039*** | 0.007 | ||
Notes. All continuous predictors were centered on the mean of the total sample. Standard errors are adjusted for clustering. Categorical predictors were dummy-coded with the following reference groups: gender: male; work status: not working; household size: 2 persons; relationship status: living with partner; functional limitations: not at all. The utility ΔR2 corresponds to the difference in R2 between the full model reported here and a reduced model that did not include the predictors for which the utility was computed.
p < .001,
p <. 01,
p < .05.
The adjusted age distribution of loneliness is displayed in Figure 1 (dashed line). The shape of the distribution during early and mid-adulthood was unchanged. As before, loneliness peaked around age 35 and again around age 60, and these peaks (and intermittent dips, for that matter) are not explained by known risk factors of loneliness included in the analysis, such as contact frequency, number of friends, marital status, social engagement, and functional limitations. However, the included predictors were able to explain the high levels of loneliness during old age and the comparatively lower levels of loneliness during mid-adulthood. In comparison to the unadjusted loneliness levels, the adjusted loneliness levels were higher from about age 35 to 70 and lower after about age 80.
So which predictors in particular account for these age differences? To answer this question, we examined specific groups of predictors in separate analyses. Table 2 provides the predictive utility for each set of predictors separately for Sample A and Sample B, that is, the proportion of variance (R2) explained by this set of predictors over and above all other predictors included in the model. Together, these predictors explained 11.7 % and 12.1% of the total variance in loneliness in Sample A and B, respectively. In the presentation of the results, we begin with those predictors presumed to be the most distal causes of loneliness (i.e., gender) and end with those presumed to be the most proximal causes of loneliness (i.e., social contact frequency). Unless stated explicitly, the effects were consistent across the two subsamples.
Gender.
Women were significantly lonelier than men (Table 1), even after controlling for all other covariates (Table 2). The effect on the age distribution is provided in Figure S1.
Socioeconomic status.
In general, a higher number of years of education was associated with decreased levels of loneliness (Table 1), but after controlling for the other covariates, this association flipped such that a higher number of years was associated with increased levels of loneliness, all else being equal (Table 2). We revisit this negative suppression effect below. The effect on the age distribution is provided in Figure S1.
Higher income was generally associated with lower levels of loneliness (Table 1), and this association held after controlling for the other covariates (Table 2). Average income levels were significantly lower among the very old than among other age groups (Table 1, see also Figure S3 for a higher dissolution of age differences), and adjusting for income visibly changed the distribution of loneliness among the very old (Figure 2A) such that loneliness levels in this age group would be even lower if they were not adjusted for the fact that their average income levels are also lower. Hence, relatively low income partly explains the higher levels of loneliness in old age.
Figure 2.
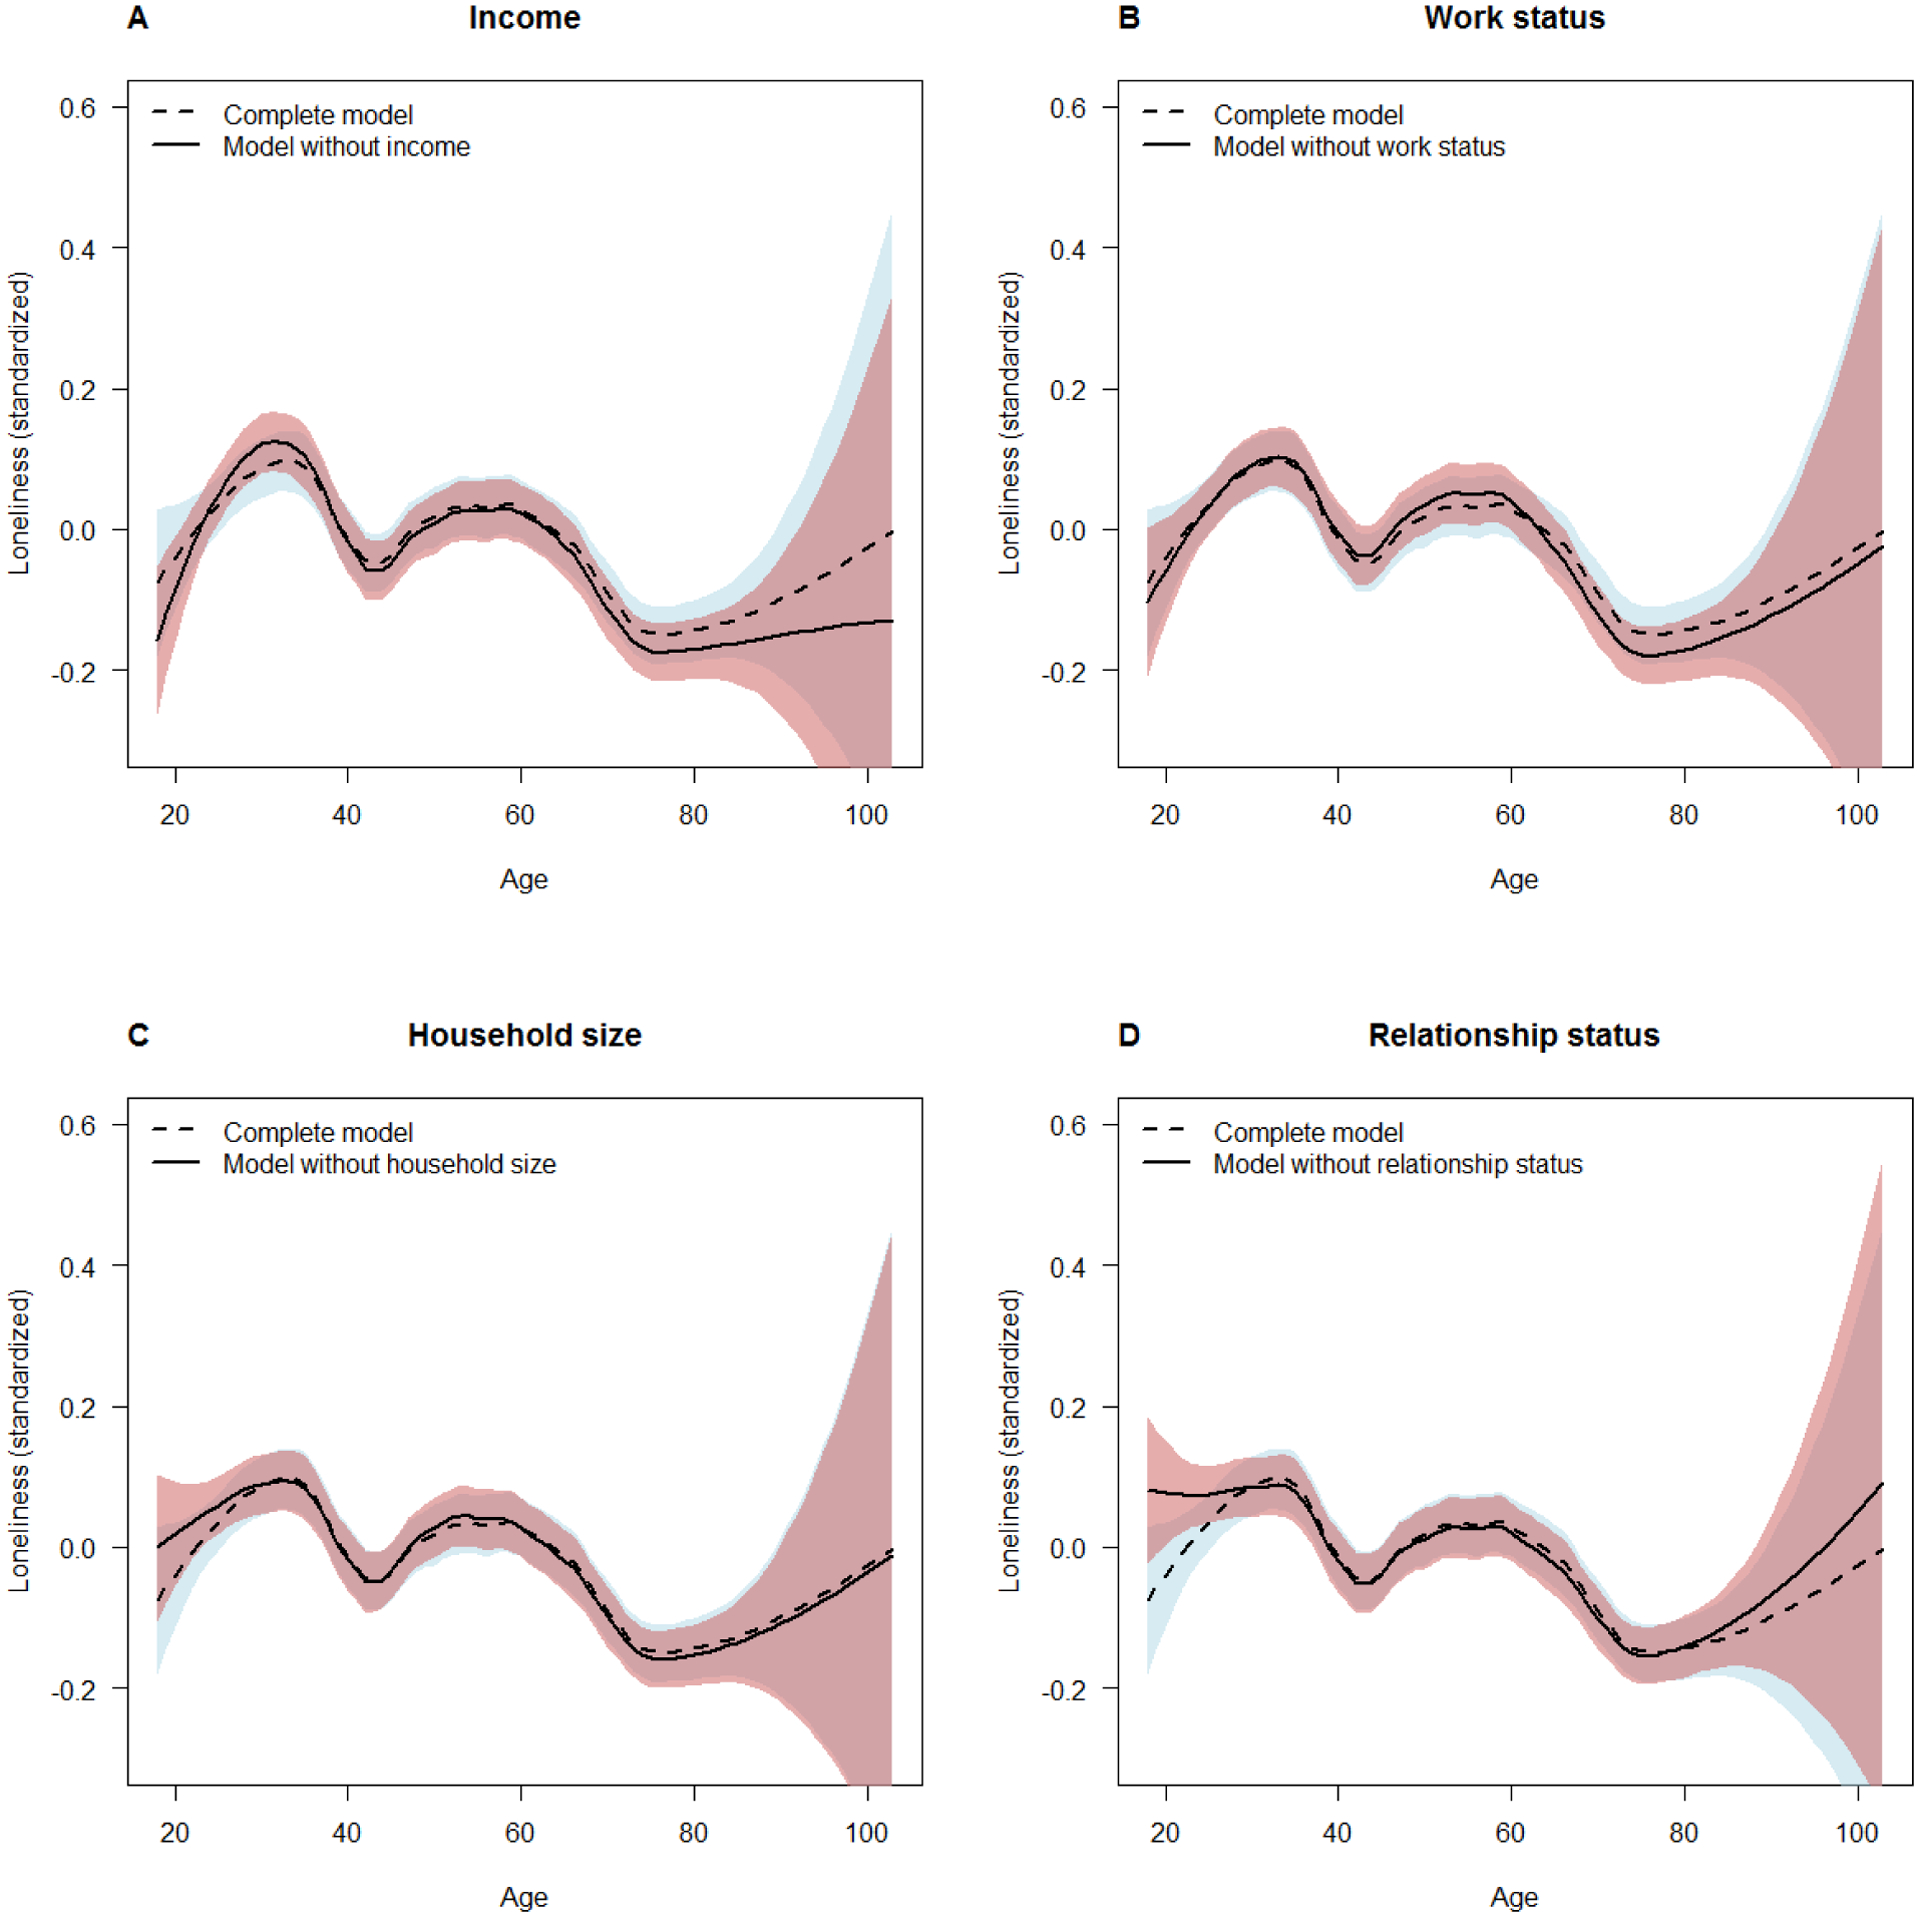
Age distribution of adjusted loneliness scores adjusting for all covariates (dashed lines) and adjusting for all but a (set of) specific covariate(s) (solid lines). The confidence bands reflect 95% confidence intervals of the LOESS lines.
Work status.
Overall, loneliness levels were highest among those who do not work at all and lowest among those with full-time jobs, with those with other occupations in between these two groups (Table 1). However, the association between work status and loneliness was reversed after controlling for the other covariates. All else being equal, loneliness levels were lowest among those not working at all and highest among those with full-time jobs (Table 2). We revisit this negative suppression below. Adjusting for work status had little effect on the age distribution; the most remarkable difference between the curves was visible among older individuals in retirement age (Figure 2B). This effect indicates that work status can account for some differences in loneliness between young and middle-aged adults on the one hand and older adults on the other.
Living arrangements.
We examined two indicators of living arrangements: the size of the household (single vs. two-person household vs. multi-person household) and the presence of children under 16 years in the household. Overall, people living alone were lonelier than people living with others, with no significant differences between people living with one other person and people living with multiple persons (Table 1). Again, however, controlling for the other covariates revealed a negative suppression effect such that all else being equal, loneliness levels were highest among those living in multi-persons households (Table 2).
Although the percentage of people living alone was significantly lower in the young than the old age group (Table 1), adjusting for household size decreased the average loneliness levels among young adults (< 30 years) but did not change the loneliness distribution among middle- and old-aged adults (Figure 2C). Together, these findings suggest that living alone may be a particularly important risk factor for loneliness among young adults.
The presence of children in the household is of particular interest in order to explain age differences in loneliness between middle-aged adults on the one hand and young and old adults on the other. Young and middle-aged adults were more likely than older adults to live with children (Table 1). However, controlling for all other covariates, the effect of the presence of children on loneliness was not robust across the two subsamples (Table 2) and adjusting for the presence of children in the household did not visibly change the age distribution (Figure S1).
Relationship status.
In this study, we distinguished among singles, individuals with a partner with whom they do not live, and individuals who live with their partners. The average loneliness levels were highest among singles and lowest among those living with their partners, both before (Table 1) and after (Table 2) adjusting for the other covariates.
The greatest percentage of singles could be found among young adults (< 25 years) and old adults (> 75 years) (see supplemental material and Table 1). In all other age groups, the percentage of singles was 20% or less. Adjusting for relationship status changed the age distribution in precisely these age groups (Figure 2D). For both young adults (< 30 years) and old adults (> 80 years), the average levels of loneliness were lower when relationship status was statistically controlled than when it was not included in the model. Hence, the higher loneliness levels among young and very old adults can partially be attributed to the greater percentage of singles in these age groups.
Functional limitations.
Functional limitations are rare among young adults, but their prevalence increases almost linearly with age (see Figure S2). At about age 65, functional limitations become the norm as more than 50% of adults aged 65 or older report having mild or severe functional limitations (Table 1). These age differences make functional limitations a good candidate to explain age differences in loneliness.
In general, functional limitations, particularly severe limitations, were associated with increased loneliness, both before (Table 1) and after (Table 2) controlling for the other covariates. Adjusting for functional limitations had visible effects on the age distribution (Figure 2E). Among young adults (until about age 35), adjusting for functional limitations increased the average levels of loneliness, indicating that low prevalence of physical limitations protects this age group from loneliness. Among old adults (from about age 80), adjusting for functional limitations decreased the average levels of loneliness. Hence, higher prevalence of functional limitations in this age group partly explains the high levels of loneliness among the oldest old.
Social engagement.
Social engagement such as volunteering or being a member of a religious community or a political organization affords people with additional opportunities to forge social connections. Indeed, all three forms of social engagement were negatively correlated with loneliness (Table 1), but after controlling for other covariates including number of friends and contact frequency, none of these variables was robustly associated with loneliness across the two subsamples (Table 2). Moreover, the distribution of adjusted loneliness scores across age was nearly unaffected by adjusting for social engagement (Figure S1).
Number of friends.
The more friends people have, the less lonely they are, both before (Table 1) and after (Table 2) controlling for all other covariates. Adjusting for the number of friends had little impact on the age distribution, with the only visible deviation appearing after the age of 90 (Figure 2F).
Frequency of social contact.
Consistent with the assumption that frequency of social contact is a proximal predictor of loneliness, frequency of contact was among the groups of predictors that explained the largest proportion of the variance (2.1% in Sample A and 1.9% in Sample B; Table 2). Interestingly, not all forms of social contact protect against loneliness. Whereas frequent face-to-face contact with both friends and relatives was associated with lower levels of loneliness, frequent contact online was associated with higher levels of loneliness, controlling for all other covariates (Table 2). Contact with friends and relatives abroad was not consistently associated with loneliness in the two subsamples. Adjusting for these variables did not visibly change the age distribution (Figure S1).
Exploring the suppressor effects
For education, work status, and household size, we detected suppressor effects such that the direction of the association of these variables with loneliness reversed after controlling for the other covariates. For instance, more educated people were in general less lonely (negative bivariate association; Table 1), but after controlling for all other variables, more educated people were lonelier than less educated people (positive regression coefficient; Table 2). These suppressor effects merit further exploration. Using the complete sample, we inspected the regression coefficients in models in which one (set of) covariate(s) was sequentially excluded, and found that the coefficients of all variables listed above changed most dramatically if income was excluded (see Table S1 in the supplemental material). In this model, education was marginally (p = .062) negatively associated with loneliness, and both work status and household size were not significantly associated with loneliness. These findings show that the supposedly protective effects of education, work status, and household size are confounded with income. Once income is held constant, these factors are no longer associated with loneliness, and once other variables are accounted for as well, their associations with loneliness flip such that all else being equal, people with more years of education, working full time, and living with others tend to have higher levels of loneliness than people with fewer years of education, not working, and living alone, respectively.
Age differences in the relevance of loneliness predictors
Age differences in loneliness may arise not only from age differences in the prevalence of risk factors, which were examined above, but also from age difference in the relevance of loneliness predictors. In the final part of the analyses, we therefore tested whether the association between the different loneliness predictors and loneliness is moderated by age, adjusted for all other predictors. Table 3 presents the results for the interaction effects in both random subsamples. Only interactions that were significant in both subsamples will be interpreted. This applies to the interactions between age group and income, work status, relationship status, and household size, respectively. These interactions were further probed using post hoc comparison procedures with Tukey adjustment. Note that our a priori age groups do not correspond perfectly to the age cut-points at which visible differences were observed between the unadjusted and adjusted loneliness distributions. As a robustness check, we tested whether the effects of our predictors on loneliness differed among these age groups: < 35 years, 35–80 years, and > 80 years. These effects are reported in supplementary material (Table S2) and demonstrate that not all age groups are equally appropriate for all predictors. We return to this issue in the discussion.
Table 3.
Tests of interactions between age and different predictors in two random subsamples.
| Sample A | Sample B | |||||||||
|---|---|---|---|---|---|---|---|---|---|---|
| Variable | F | df1 | df2 | p | Significance | F | df1 | df2 | p | Significance |
| Gender | 0.63 | 2 | 7937 | .534 | 6.96 | 2 | 8145 | .001 | *** | |
| Income | 10.24 | 2 | 7937 | < .001 | *** | 4.47 | 2 | 8145 | .012 | * |
| Education | 1.88 | 2 | 7937 | .152 | 0.40 | 2 | 8145 | .671 | ||
| Work status | 3.91 | 4 | 7935 | .004 | ** | 7.06 | 4 | 8143 | < .001 | *** |
| Relationship status | 6.21 | 4 | 7935 | < .001 | *** | 7.03 | 4 | 8143 | < .001 | *** |
| Household size | 2.91 | 4 | 7935 | .020 | * | 4.77 | 4 | 8143 | .001 | *** |
| Children in household | 2.79 | 2 | 7937 | .061 | 0.27 | 2 | 8145 | .764 | ||
| Functional limitations | 1.68 | 4 | 7935 | .151 | 0.23 | 4 | 8143 | .921 | ||
| Volunteering | 0.15 | 2 | 7933 | .860 | 2.56 | 2 | 8141 | .077 | ||
| Political engagement | 4.26 | 2 | 7933 | .014 | * | 1.36 | 2 | 8141 | .256 | |
| Religious engagement | 4.37 | 2 | 7933 | .013 | * | 0.25 | 2 | 8141 | .781 | |
| No. of friends | 1.28 | 2 | 7937 | .278 | 0.72 | 2 | 8145 | .488 | ||
| Contact with friends | 4.07 | 2 | 7931 | .017 | * | 0.50 | 2 | 8139 | .609 | |
| Contact with relatives | 0.89 | 2 | 7931 | .410 | 7.43 | 2 | 8139 | .001 | *** | |
| Contact abroad | 0.67 | 2 | 7931 | .510 | 1.55 | 2 | 8139 | .212 | ||
| Contact online | 3.12 | 2 | 7931 | .044 | * | 1.40 | 2 | 8139 | .248 | |
Notes.
p < .001,
p <. 01,
p < .05.
Higher income was significantly associated with lower levels of loneliness among all groups, but this association was significantly stronger among middle-aged adults (β= −0.33, SE = 0.02) than among young adults (β = −0.17, SE = 0.04) and old adults (β = −0.18, SE = 0.03), p < .001 for both comparisons. The simple regression coefficients of young and old adults did not differ significantly (p = .988). Despite the relatively greater relevance of income for loneliness among middle-aged adults, adjusting for income had no effects on the loneliness distribution in this age group (Figure 2A), indicating that changes in the age distribution after adjusting for income are mainly due to age differences in the prevalence of this variable. Specifically, even though income is more important in mid-adulthood, it does not affect the loneliness distribution as much as in other age groups because of the relatively high average income levels in this age group.
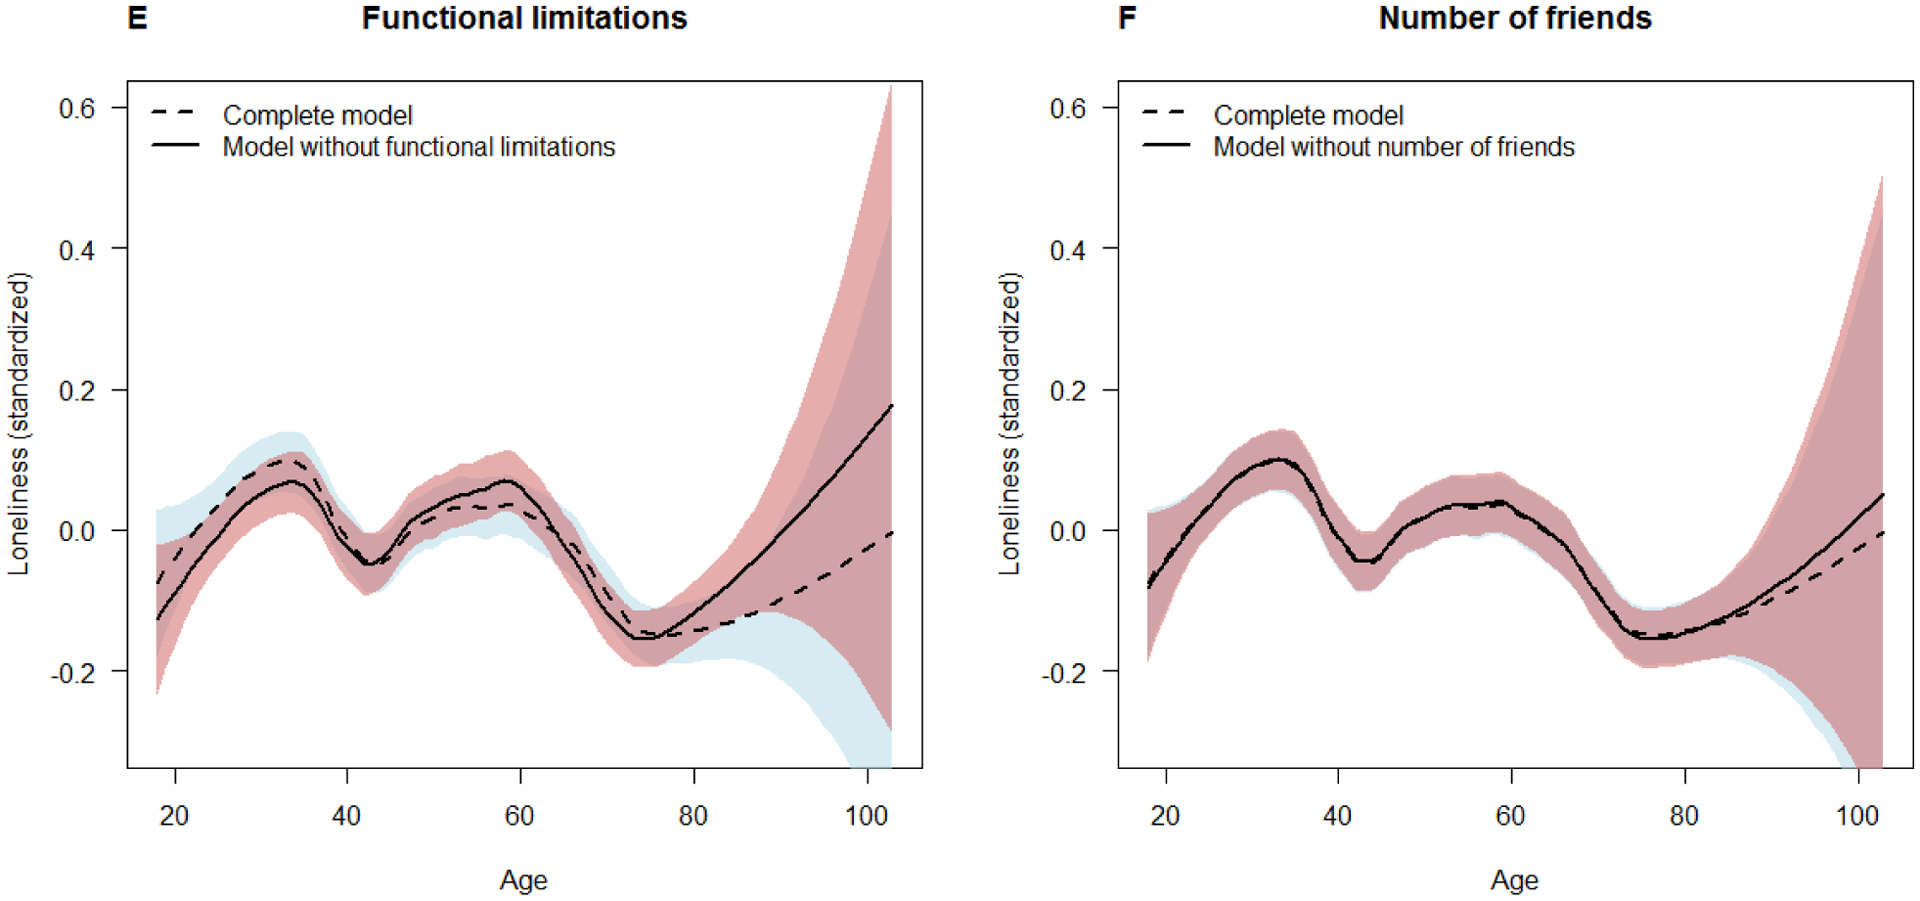
Work status did not account for any mean-level differences in loneliness among old adults (Figure 3), which may be partially due to the low proportion of working individuals in this age group. Work status did account for differences in loneliness in the other two age groups, but the patterns looked different. Among young adults, loneliness levels were elevated for both people without jobs and people working full-time, relative to people with other occupations. Among middle-aged adults, in contrast, loneliness levels were highest among those without jobs and lowest among those working full-time. These patterns support our hypothesis that work has different meanings and different social consequences in different age groups.
Figure 3.
Average loneliness levels by age group and work status, adjusted for all other covariates listed in Table 2. The error bars reflect 95% confidence intervals.
Recall that the effect of household size reversed after controlling for other covariates such that the lowest levels of loneliness were found among those living alone. The post hoc analyses showed that this effect is mainly driven by the young and old age groups. In both of these age groups, people living alone were significantly less lonely than people living in two-person households and, among young adults, people living in households with three or more persons (Figure 4). Household size did not account for mean-level differences in loneliness among middle-aged adults.
Figure 4.
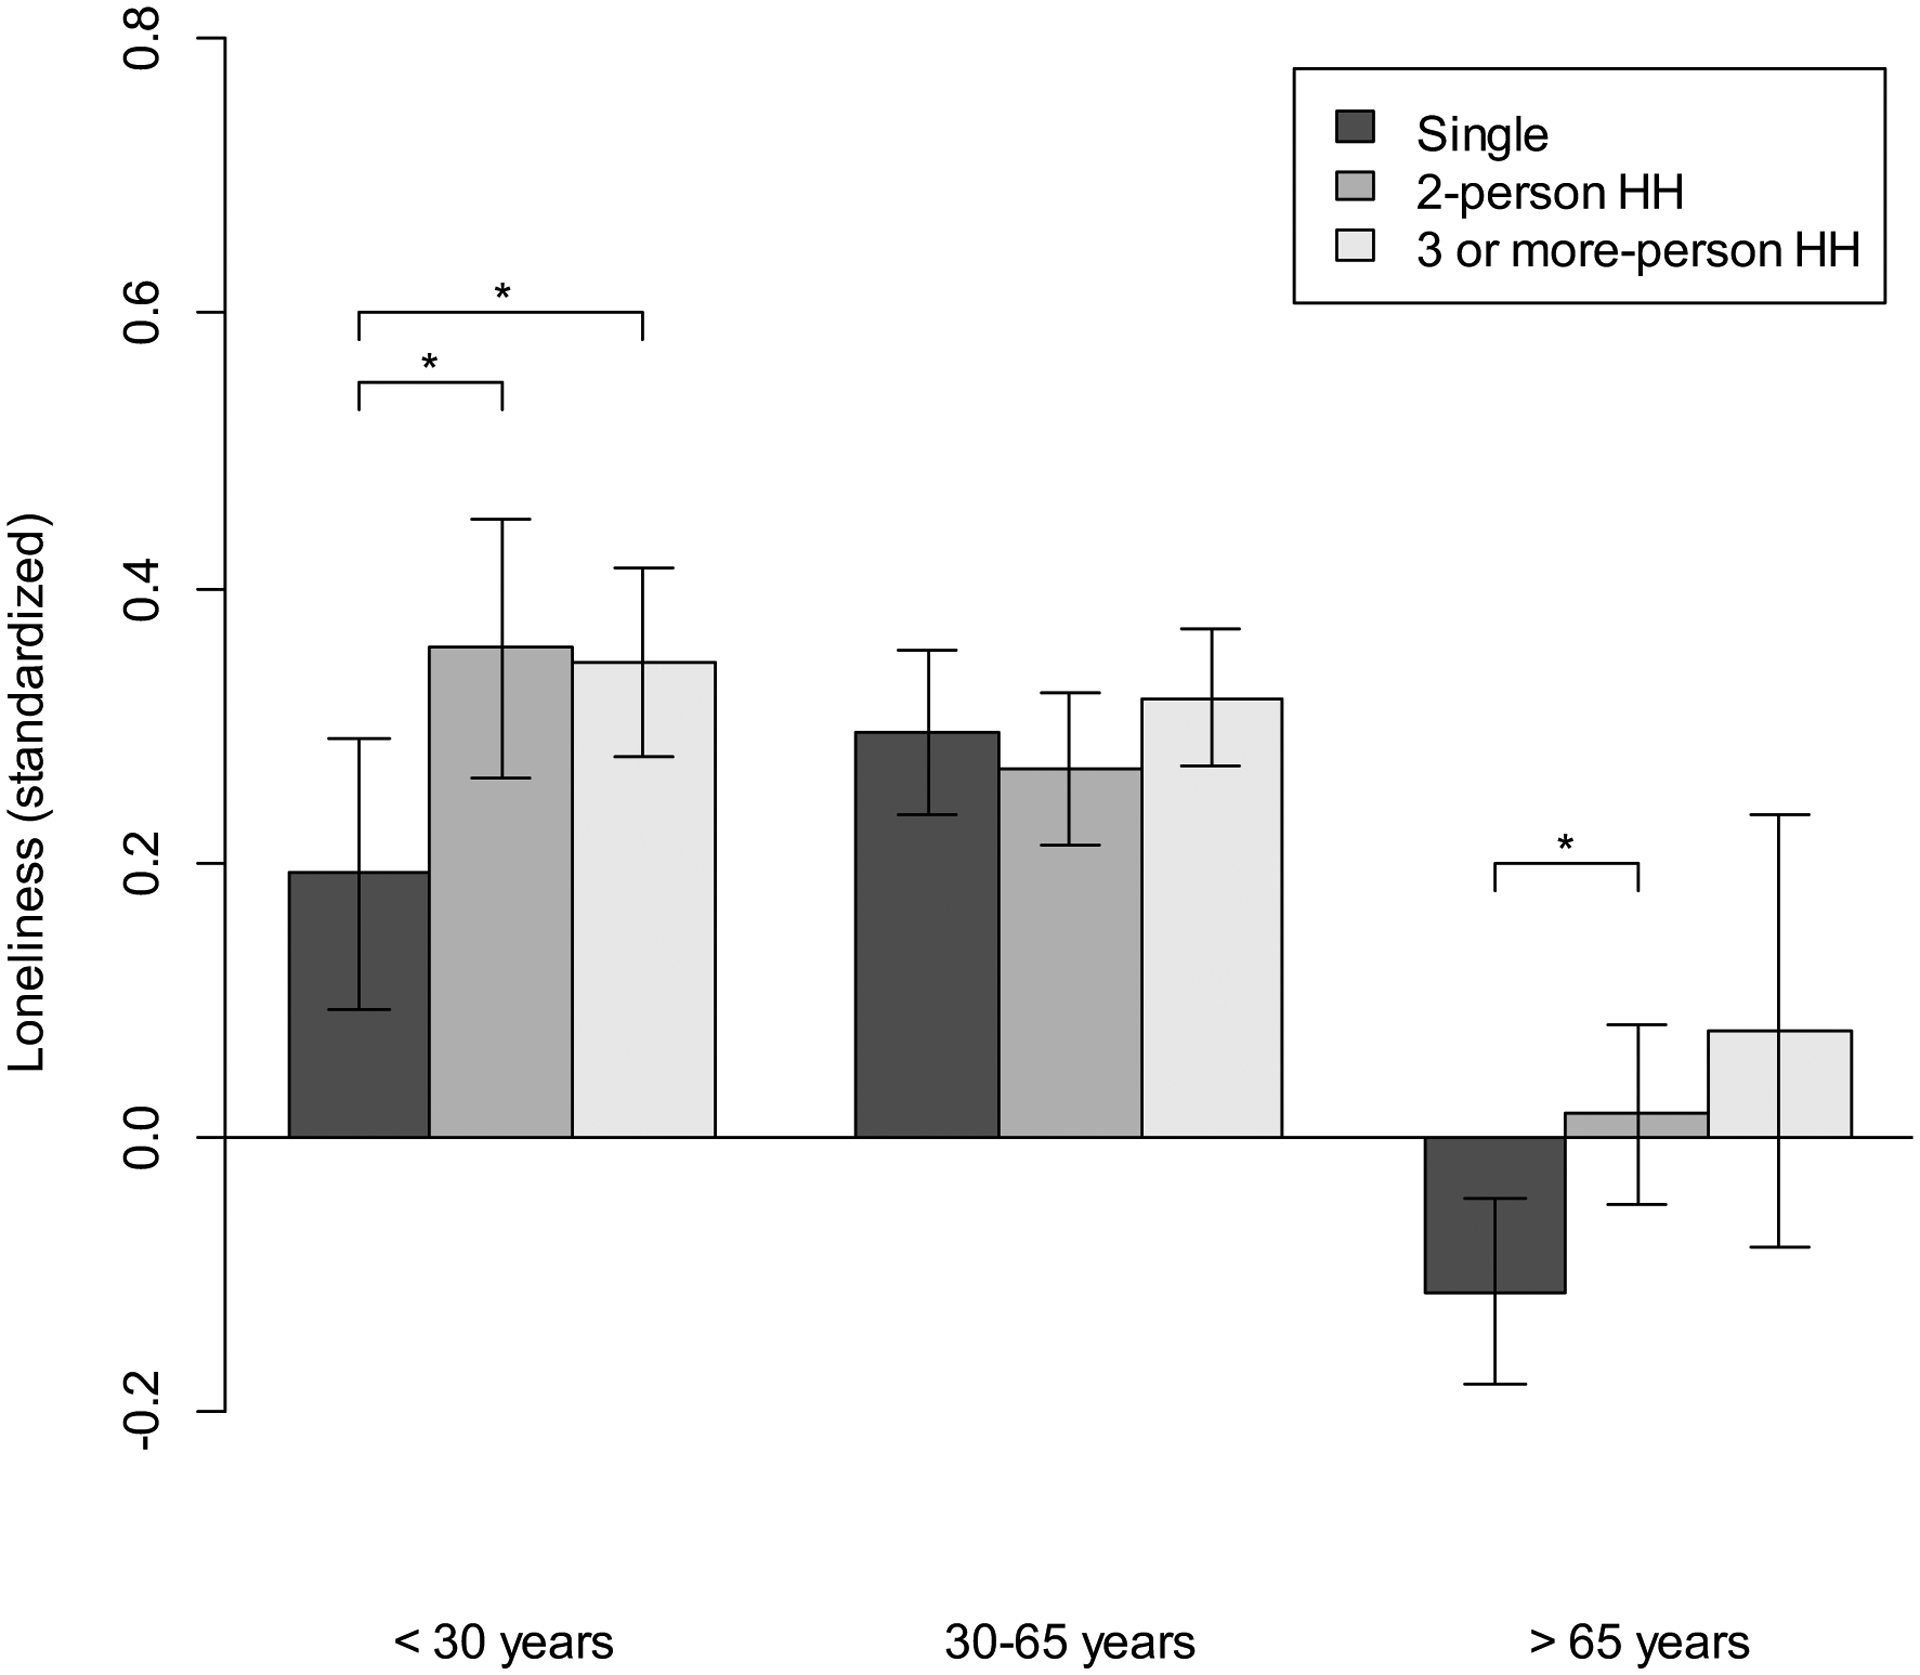
Average loneliness levels by age group and household (HH) size, adjusted for all other covariates listed in Table 2. The error bars reflect 95% confidence intervals.
Finally, the association between relationship status and loneliness varied significantly between the three age groups (Figure 5). In the youngest age group, the average loneliness levels did not differ significantly as a function of relationship status. In the oldest age group, loneliness levels were lower for people who had a partner than for singles; however, due to the low number of people not living with their partner in this age group (Table 1), the standard error for this specific mean was enlarged such that only the difference between people living with their partner and singles was significant. Relationship status mattered most for middle-aged adults. In this group, singles were significantly lonelier than people with partners. People not living with their partners tended to be lonelier than people living with their partner, but this difference was only marginally significant (p = .057). Even though being single was a more important risk factor for loneliness during mid-adulthood that during young or old adulthood, adjusting for relationship status had no effect on the loneliness distribution among middle-aged adults (Figure 2D) because singles are relatively rare in this age group (Table 1).
Figure 5.
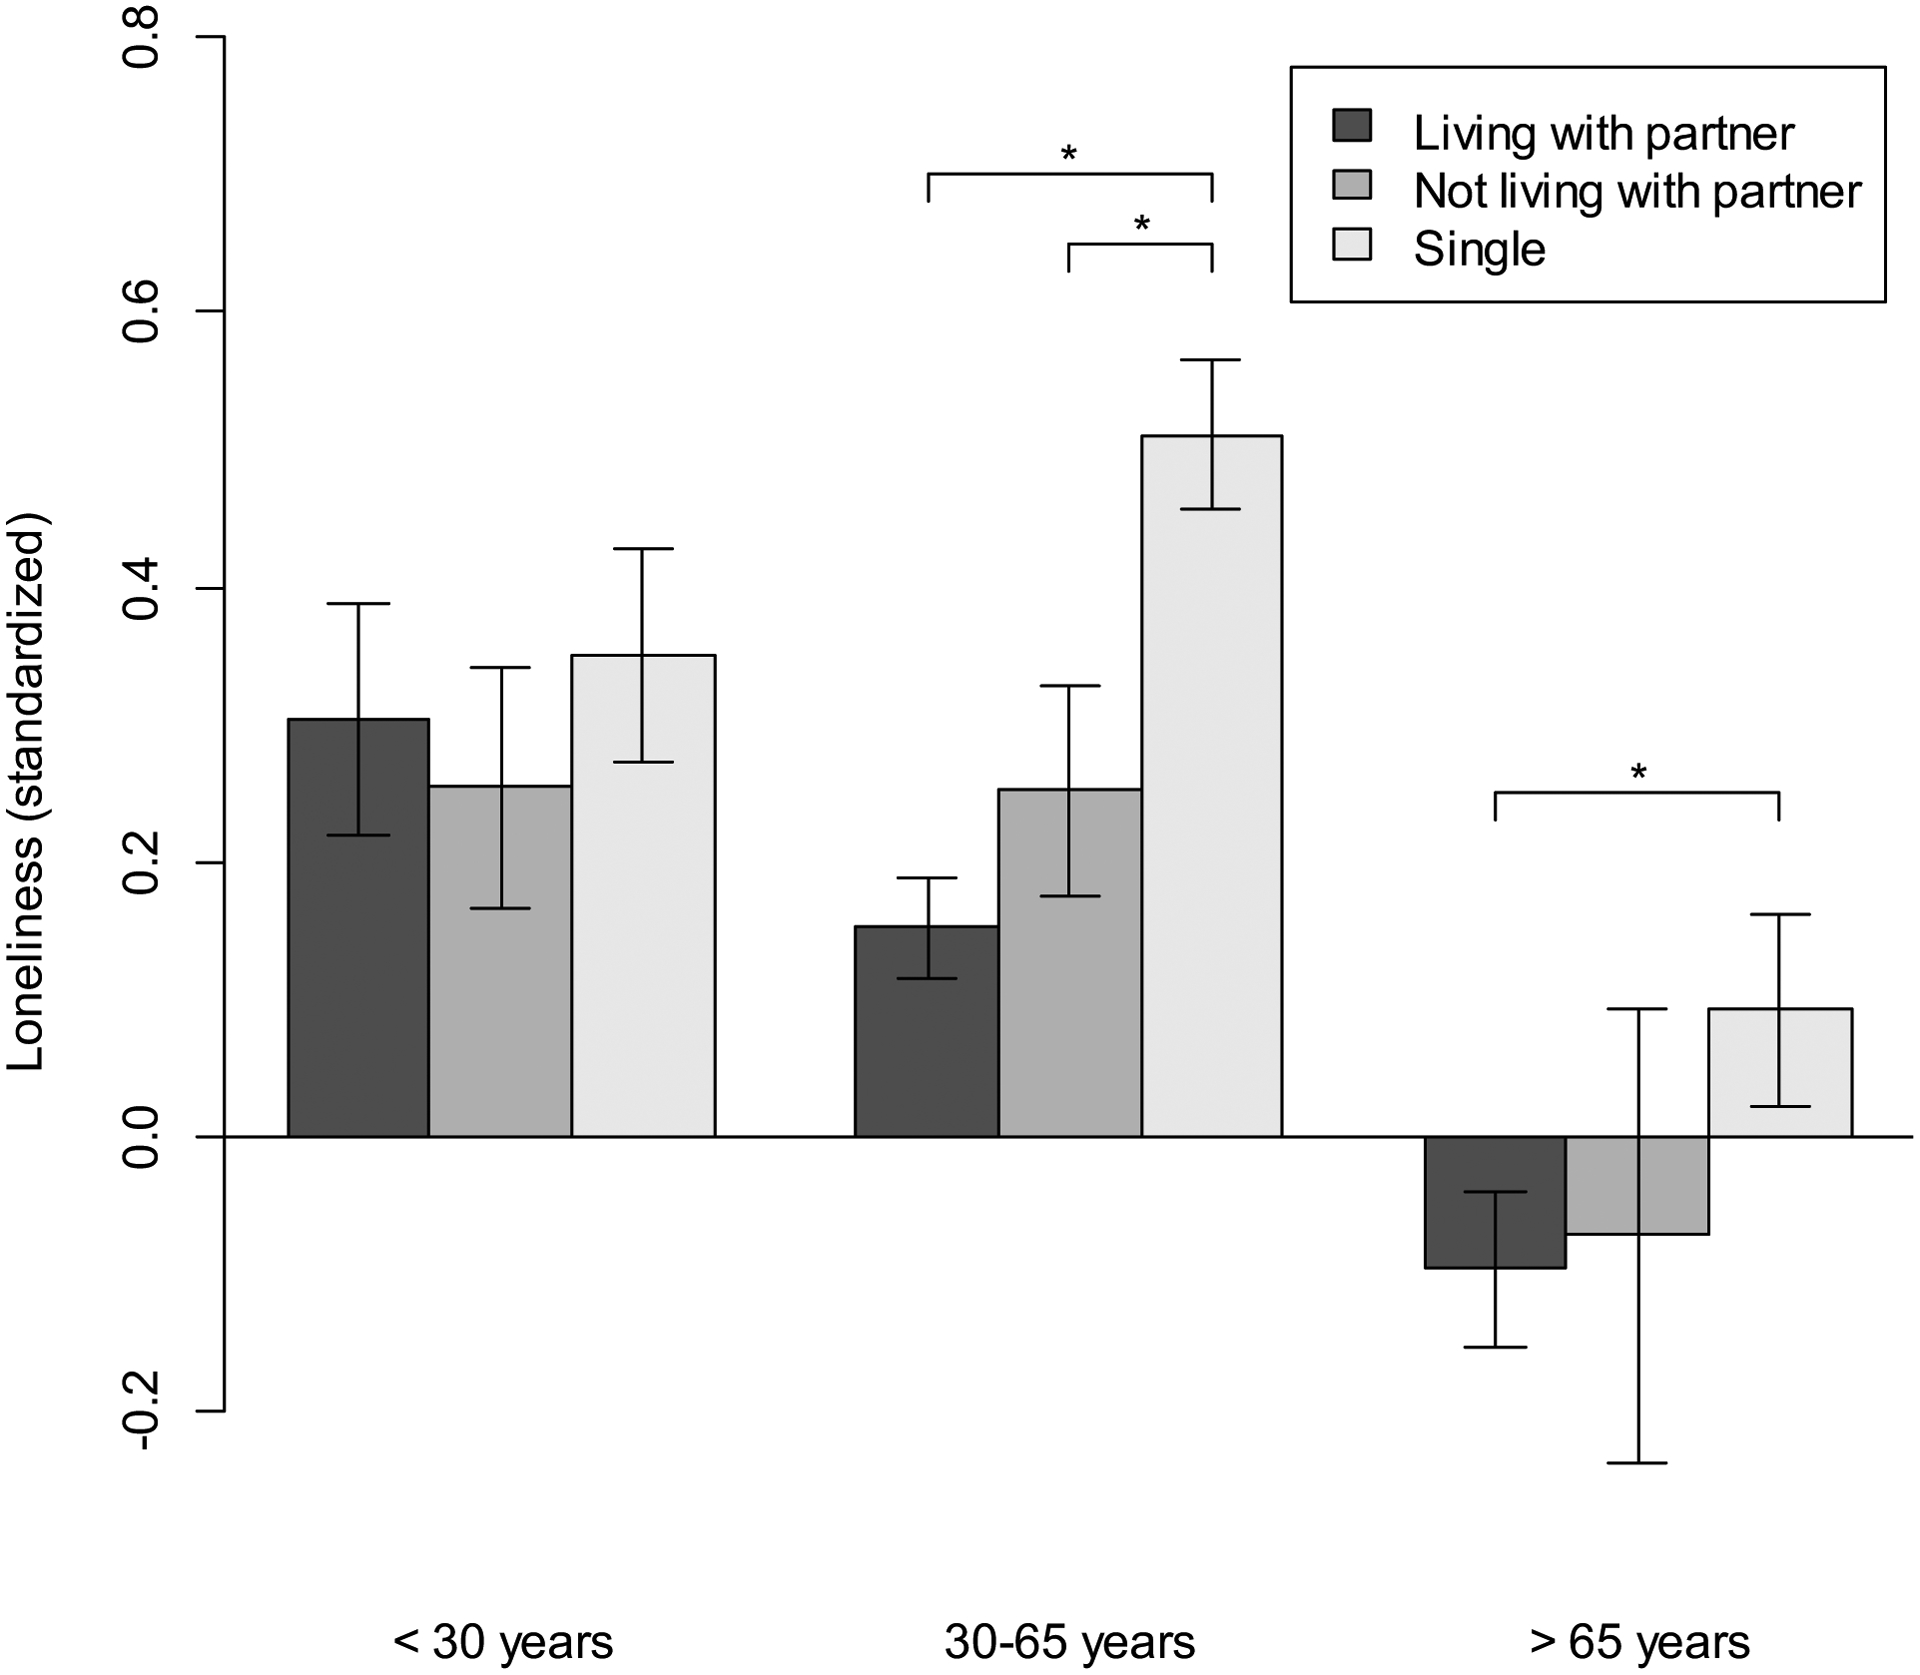
Average loneliness levels by age group and relationship status, adjusted for all other covariates listed in Table 2. The error bars reflect 95% confidence intervals.
Discussion
Popular illustrations of loneliness often depict older adults spending their days in solitude. Consistent with this image, loneliness levels in our data were highest among the oldest old (> 80 years). However, the oldest old are not the only group at risk. Compared to middle adulthood and early old age (< 75 years), loneliness levels were also elevated in young adulthood. Across adulthood, the age distribution of loneliness followed a complex non-linear trajectory which was characterized by two peaks (around 30 years and around 60 years) and two dips (around 40 years and around 75 years).
To explain these age differences, we considered a range of variables that have been associated with loneliness in prior research, ranging from distal variables such as sociodemographic characteristics to proximal variables such as number of friends and frequency of social contact. These results were generally consistent with prior research showing that when age-related risk factors are held constant, old age per se is no longer associated with loneliness (Queen et al., 2014; Tijhuis et al., 1999; Wenger & Davies, 1996). In particular, the absence of a significant attachment figure (spouse, partner) and the presence of functional limitations, both prevalent circumstances in older age, explained a substantial proportion of variance in loneliness in elders over age 80 such that loneliness levels appeared to be as low as or lower than levels at about age 35 (the first peak in the age distribution) after adjusting for these variables. Thus, old age in itself is not a risk factor for loneliness. However, even after adjusting for many of the known loneliness factors, the loneliness distribution was far from flat, indicating that substantive age differences in loneliness remain unaccounted for, particularly among young and middle-aged adults. This result may be due to the fact that most previous studies on predictors of loneliness have focused on older adults. We now have a reasonably good understanding of which factors facilitate or protect against loneliness in old age, but these factors do not generalize to all age groups. More research should be devoted to identifying the age-specific risk factors of loneliness in young and middle-aged adults.
Age-specific predictors of loneliness
Our findings give some insight into which factors may be particularly relevant for young and middle-aged adults. Income is often thought of as a distal predictor of loneliness which affects loneliness indirectly because of its association with work status, or through its effects on the quantity and quality of social relationships (e.g., Hawkley et al., 2008). However, in our data, income was significantly associated with loneliness in all age groups even after controlling for covariates such as work status, social engagement, number of friends, and contact frequency. This finding suggests that income may affect loneliness indirectly through other variables that have not yet been considered in past research (e.g., spending behaviors) and that income may even have direct effects on loneliness that are not mediated by any other variables. Our data also suggest that these effects may be age-graded because the association between income and loneliness was strongest among middle-aged adults. Mid-adulthood is also the period in life when making, investing, and saving money are more important life goals than during early or late adulthood. This finding is therefore consistent with the age-normative perspective according to which people are less lonely if they meet their age-normative expectations (here: financial expectations) (see F. Cheung & Lucas, 2015, for a similar finding on the effect of income on life satisfaction). Alternatively, it may also be the case that both young and old adults are better at fostering their social relationships in ways that do not depend on money (e.g., meeting friends privately at somebody’s home vs. going out for dinner). In sum, the findings on income suggest that income protects against loneliness through multiple, possibly age-graded pathways that need to be further examined in future research.
Another important predictor of loneliness among young and middle-aged adults was work status. As discussed above, working may have protective as well as detrimental consequences. Consistent with the view that working has protective functions (e.g., Paul & Batinic, 2010), people who did not work at all were on average lonelier than people who had some occupation among both young and middle-aged adults, controlling for income and other covariates. However, the strength of the potential detrimental effects of working full-time seem to differ between these two age groups. Middle-aged adults who worked full-time were significantly less lonely than middle-aged adults who did not work at all. In contrast, young adults who worked full-time did not differ significantly from young adults who did not work at all with respect to their average loneliness levels, and both groups were significantly lonelier than those with other occupations (e.g., college students working part-time). As diverse as these findings may seem, they are actually consistent with the age-normative perspective. Among middle-aged adults, working full-time is the norm (with more than 50% working full-time, see Table 1), and building a career is a central developmental goal in this life stage (Heckhausen et al., 2010). Indeed, those who work full-time are the least lonely in this age group. Among young adults, in contrast, the majority do not (yet) work full-time (Table 1). For young adults who work full-time, the detrimental effects of full-time jobs may be stronger than for their older counterparts. For instance, they may struggle to build large and strong social networks because they have less flexibility in their daily lives than their peers who work part-time jobs and/or go to college.
Household size emerged as a loneliness factor specific to young and old adulthood, but in an unexpected direction. Overall, living alone was associated with higher levels of loneliness, but after controlling for all other covariates (particularly income), young and old adults living alone were significantly less lonely than young and old adults living with others, respectively. These findings suggest that it is not living alone per se, but rather the unfavorable combination of other risk factors such as low income and being single that explains the higher levels of loneliness among people living alone. In fact, the finding that young and old people living alone are less lonely than others after controlling for all covariates suggests that living alone may even have beneficial effects on the quality of one’s social relationships. Future research should examine more closely for whom and under which circumstances living alone is detrimental or beneficial for loneliness and other psychological outcomes.
Finally, another factor that varied between different age groups was relationship status. Previous research suggested that the importance of relationship status for loneliness may increase with increasing age (e.g., Green et al., 2001; Victor & Yang, 2012). Our results were partly consistent with this hypothesis. Relationship status accounted for significant differences in loneliness among middle-aged and older adults, but not among younger adults. However, contrary to our hypothesis, these differences were most pronounced among middle-aged adults and not, as expected, among older adults. Again, however, these findings fit well into the age-normative perspective because living with a partner is most common among middle-aged adults (see Table 1), and finding a partner and starting a family are among the central developmental goals in this age group (Heckhausen et al., 2010). Both young and old age groups are characterized by a relatively high proportion of singles, which contributes to the elevated loneliness levels in these age groups. So why does relationship status account for fewer individual differences in loneliness among the very young than among the very old? One reason may be that having a partner is even less normative among young adults than among old adults. Another reason may be that younger people can compensate for the absence of a romantic partner through a larger social network in both private and professional life, whereas older people may have less opportunities for such compensatory social relationships. Finally, many older adults without a partner are in that circumstance because they have lost a partner with whom they have shared most of their life. Widowhood in older age may be more consequential for feelings of loneliness than the lack of a partner in young adults who foresee a longer future in which to find a life partner.
Universal predictors of loneliness
The findings discussed so far were consistent with the age-normative perspective. In contrast, functional limitations, social engagement, number of friends, and the frequency of various forms of social contact appear to be universal predictors of loneliness that do not differ in their impact among different age groups. Adjusting for functional limitations explained a significant part of the late-life increase in loneliness, but this effect was due to a higher prevalence of functional limitations among the oldest old, not to a relatively stronger effect of functional limitations on loneliness in this age group. Similarly, the impact of the quantity of social relationships on loneliness does not differ across age.
Interestingly, all of these variables are rather proximal predictors of loneliness, meaning that they are assumed to have direct rather than indirect effects on loneliness (Hawkley et al., 2008). The fact that the proximal predictors assessed in this study have equivalent effects across age groups suggests that these factors – social engagement, number of friends, and frequency of social contact – may represent what is universal about the human need for social connectedness and belonging. As the definition of loneliness (Peplau & Perlman, 1982) implies, sufficient (and satisfying) relationships, however they are defined by the individual, are the “final common pathway” linking external circumstances with the internal (intrapersonal) processes that give rise to feelings of connectedness. What remains to be examined in future research are whether comparable effects of social contact frequency and quality are explained by comparable intrapersonal processes across age. For instance, disengagement theory (Cumming & Henry, 1961) and socioemotional selectivity theory (Carstensen et al., 1999) suggest that older adults limit their social contacts to their closest and most important relationships and thus may be just as satisfied, and feel just as connected, as younger adults who might require a greater number of relationships to achieve the same degree of satisfaction. Alternatively, older adults might shift their standards and be satisfied with fewer relationships and contacts as an adaptive response to the belief that social deprivation is inevitable with aging, and that they might as well make the best of it. In sum, similar circumstances may lead to loneliness through different pathways, and these intrapersonal processes may differ systematically across age.
Another variable that affected all age groups similarly was education. Overall, more years of education were associated with lower levels of loneliness. However, education is confounded with income, and once income (and other covariates) was accounted for, more years of education were associated with higher levels of loneliness. Recall that loneliness is defined as a perceived discrepancy between desired and actual social relationships. Education may therefore affect loneliness through two different pathways that should be examined in future studies: Higher-educated individuals may be lonelier than lower-educated individuals with the same income because they have higher standards for evaluating their social relationships or because they actually have fewer high-quality relationships.
Limitations
In the interpretation of our data, it is important to keep in mind that the age distribution is estimated from cross-sectional data which means that age and cohort effects are confounded. That is, we do not know whether the observed differences in loneliness are due to actual age effects or to generational differences in loneliness. Age and cohort effects can only be disentangled in cohort-sequential longitudinal designs. Fortunately, the loneliness measure will be administered in the SOEP repeatedly in the future, and the SOEP is regularly updated with refreshment samples, so such a study will be available in a few years.
A related concern is that cross-sectional data do not permit detecting evidence for selective mortality. Chronic loneliness is associated with an increased mortality risk (Holt-Lunstad, Smith, Baker, Harris, & Stephenson, 2015). Individuals with a greater disposition to experience loneliness may be underrepresented among the older age groups because they have already died. It is therefore possible that we underestimated the true loneliness levels among the very old.
Another limitation of our study, and large-scale panel studies in general, is that important predictors are not included. For instance, relationship quality (e.g., marital quality) is one of the most proximal predictors of loneliness (Hawkley et al., 2008), but no measures of relationship quality were available in the SOEP. In addition, it may be a promising route for future research to explain age differences in loneliness by directly assessing both the actual level of social relationships and the norms and expectations for these social relationships.
One aim of this study was to investigate age differences in the predictors of loneliness. For statistical and practical reasons, we compared the associations of various predictors with loneliness among different age groups which were defined a priori. It is important to be aware that our conclusions about the age-specificity versus universality of predictors of loneliness only apply to these broad age groups. In future research, age differences in predictors of loneliness should be examined in more detail by using more narrow age groups or by treating age as a continuous variable. Because these approaches require a large number of statistical tests, we advise that such a study focuses on a few selected predictors rather than considering all known risk factors of loneliness simultaneously as we have done here.
In addition, we caution that our findings should not be generalized beyond the age range examined here. In particular, our sample did not include children and adolescents. Nevertheless, our data give an accurate and representative picture of the distribution of loneliness among adults in Germany in the year 2013, and this distribution can be used as a baseline with which the loneliness distributions found in future waves of data collection can be compared. Related to this point, our findings do not necessarily generalize to other countries. Indeed, as shown by Yang and Victor (2011), the age distribution of loneliness varies significantly among European countries. It may also be the case that these age differences in loneliness are explained by different predictors in different countries. A recent study found that the lack of social interactions with family members is a stronger predictor of loneliness in collectivist countries whereas a lack of social interactions with friends is a stronger predictor of loneliness in individualistic countries (Lykes & Kemmelmeier, 2014). Luckily for this field of research, loneliness measures are increasingly incorporated in large-scale panel studies, so replications of our findings in other countries will soon be possible.
Conclusion
Loneliness is unevenly distributed across the age range. Previous research helped us identify the factors that contribute to loneliness among older adults: Older adults are lonelier than young and middle-aged adults because of their relatively lower incomes, higher prevalence of functional limitations, and higher proportion of singles (Cohen-Mansfield et al., 2015). Indeed, the overall longitudinal trend that can be cautiously inferred from our cross-sectional data is that loneliness increases with age. This trend is consistent with lay conceptions of loneliness, but loneliness is more than simply the result of age-related losses. An age-normative perspective allows for loneliness to be experienced at all stages of the life course, albeit for different reasons at different ages. Such a perspective has been used to good effect to describe developmental changes in the sources of loneliness in children and adolescence (Parkhurst & Hopmeyer, 1999), and could be extended to include the adult life span. To date, most loneliness studies have focused on explanations for loneliness in children, adolescents, and older adults (for overviews, see Asher & Paquette, 2003; Cohen-Mansfield et al., 2015; Heinrich & Gullone, 2006; Qualter et al., 2015). In the future, we should turn our attention to the sources of loneliness among middle-aged adults. In addition, greater research attention needs to be paid to the intrapersonal processes through which external circumstances lead to feelings of loneliness, and how these processes differ across the lifespan. In sum, our data indicate that a more comprehensive lifespan approach is necessary to understand the form and sources of loneliness at every age.
Supplementary Material
Footnotes
Specifically, a series of multigroup factor analyses showed that a model assuming strict measurement invariance (i.e., factor loadings, intercepts, and residual variances are constrained to be equal across groups) did not fit significantly worse than a model assuming configural measurement invariance (i.e., no constraints placed on factor loadings, intercepts, and residual variances), as indicated by a reduction of the CFI of less than −0.01 (G. W. Cheung & Rensvold, 2002).
References
- Asher SR, & Paquette JA (2003). Loneliness and peer relations in childhood. Current Directions in Psychological Science, 12(3), 75–78. doi: 10.1111/1467-8721.01233 [DOI] [Google Scholar]
- Ayalon L, Palgi Y, Avidor S, & Bodner E (2015). Accelerated increase and decrease in subjective age as a function of changes in loneliness and objective social indicators over a four-year period: Results from the Health and Retirement Study. Aging and Mental Health, 1–9. doi: 10.1080/13607863.2015.1035696 [DOI] [PubMed] [Google Scholar]
- Borys S, & Perlman D (1985). Gender differences in loneliness. Personality and Social Psychology Bulletin, 11(1), 63–74. doi: 10.1177/0146167285111006 [DOI] [Google Scholar]
- Bosma H, Jansen M, Schefman S, Hajema KJ, & Feron F (2015). Lonely at the bottom: A cross-sectional study on being ill, poor, and lonely. Public Health, 129(2), 185–187. doi: 10.1016/j.puhe.2014.11.016 [DOI] [PubMed] [Google Scholar]
- Carmichael CL, Reis HT, & Duberstein PR (2015). In your 20s it’s quantity, in your 30s it’s quality: The prognostic value of social activity across 30 years of adulthood. Psychology and Aging, 30(1), 95–105. doi: 10.1037/pag0000014 [DOI] [PMC free article] [PubMed] [Google Scholar]
- Carstensen LL, Isaacowitz DM, & Charles ST (1999). Taking time seriously: A theory of socioemotional selectivity. American Psychologist, 54(3), 165–181. doi: 10.1037/0003-066x.54.3.165 [DOI] [PubMed] [Google Scholar]
- Cheung F, & Lucas RE (2015). When does money matter most? Examining the association between income and life satisfaction over the life course. Psychology and Aging, 30(1), 120–135. doi: 10.1037/a0038682 [DOI] [PMC free article] [PubMed] [Google Scholar]
- Cheung GW, & Rensvold RB (2002). Evaluating goodness-of-fit indexes for testing measurement invariance. Structural Equation Modeling, 9(2), 233–255. doi: 10.1207/S15328007SEM0902_5 [DOI] [Google Scholar]
- Choi H, & Marks NF (2008). Marital conflict, depressive symptoms, and functional impairment. Journal of Marriage and Family, 70(2), 377–390. doi: 10.1111/j.1741-3737.2008.00488.x [DOI] [PMC free article] [PubMed] [Google Scholar]
- Cleveland WS (1979). Robust locally weighted regression and smoothing scatterplots. Journal of the American Statistical Association, 74(368), 829. [Google Scholar]
- Cohen-Mansfield J, Hazan H, Lerman Y, & Shalom V (2015). Correlates and predictors of loneliness in older-adults: A review of quantitative results informed by qualitative insights. International Psychogeriatrics. doi: 10.1017/S1041610215001532 [DOI] [PubMed] [Google Scholar]
- Cohen-Mansfield J, Shmotkin D, Blumstein Z, Shorek A, Eyal N, & Hazan H (2013). The old, old-old, and the oldest old: Continuation or distinct categories? An examination of the relationship between age and changes in health, function, and wellbeing. International Journal of Aging and Human Development, 77(1), 37–57. doi: 10.2190/AG.77.1.c [DOI] [PubMed] [Google Scholar]
- Creed PA, & Reynolds J (2001). Economic deprivation, experiential deprivation and social loneliness in unemployed and employed youth. Journal of Community & Applied Social Psychology, 11(3), 167–178. doi: 10.1002/casp.612 [DOI] [Google Scholar]
- Croezen S, Haveman-Nies A, Alvarado VJ, Van’t Veer P, & De Groot CPGM (2009). Characterization of different groups of elderly according to social engagement activity patterns. Journal of Nutrition, Health and Aging, 13(9), 776–781. [DOI] [PubMed] [Google Scholar]
- Cumming E, & Henry WH (1961). Growing old: The process of disengagement. New York: Basic books. [Google Scholar]
- Dahlberg L, Andersson L, McKee KJ, & Lennartsson C (2015). Predictors of loneliness among older women and men in Sweden: A national longitudinal study. Aging & Mental Health, 19(5), 409–417. doi: 10.1080/13607863.2014.944091 [DOI] [PubMed] [Google Scholar]
- de Jong Gierveld J, & van Tilburg T (1999). Living arrangements of older adults in the Netherlands and Italy: Coresidence values and behaviour and their consequences for loneliness. Journal of Cross-Cultural Gerontology, 14(1), 1–24. doi: 10.1023/A:1006600825693 [DOI] [PubMed] [Google Scholar]
- Fox J, & Weisberg S (2011). An R Companion to applied regression (2nd ed.). Thousand Oaks, CA: Sage. [Google Scholar]
- Green LR, Richardson DS, Lago T, & Schatten-Jones EC (2001). Network correlates of social and emotional loneliness in young and older adults. Personality and Social Psychology Bulletin, 27(3), 281–288. doi: 10.1177/0146167201273002 [DOI] [Google Scholar]
- Haisken-DeNew JP, & Frick JR (2005). Desktop companion to the German Socio-Economic Panel (SOEP). Version 8.0 Retrieved from http://www.diw.de/deutsch/sop/service/dtc/dtc.pdf
- Harrell FE (2015). rms: Regression Modeling Strategies. R package version 4.4–1. [Google Scholar]
- Hawkley, & Capitanio JP (2015). Perceived social isolation, evolutionary fitness and health outcomes: A lifespan approach. Philosophical Transactions of the Royal Society of London. Series B, Biological Sciences, 370(1669). doi: 10.1098/rstb.2014.0114 [DOI] [PMC free article] [PubMed] [Google Scholar]
- Hawkley LC, Duvoisin R, Ackva J, Murdoch JC, & Luhmann M (2015). Loneliness in older adults in the USA and Germany: Measurement invariance and validation. Working Paper Series, NORC at the University of Chicago, Paper 2015–002. [Google Scholar]
- Hawkley LC, Hughes ME, Waite LJ, Masi CM, Thisted RA, & Cacioppo JT (2008). From social structural factors to perceptions of relationship quality and loneliness: The Chicago Health, Aging, and Social Relations Study. Journals of Gerontology: Series B: Psychological Sciences and Social Sciences, 63B(6), S375–S384. doi: 10.1093/geronb/63.6.s375 [DOI] [PMC free article] [PubMed] [Google Scholar]
- Heckhausen J, Wrosch C, & Schulz R (2010). A motivational theory of life-span development. Psychological Review, 117(1), 32–60. doi: 10.1037/a0017668 [DOI] [PMC free article] [PubMed] [Google Scholar]
- Heinrich LM, & Gullone E (2006). The clinical significance of loneliness: A literature review. Clinical Psychology Review, 26(6), 695–718. doi: 10.1016/j.cpr.2006.04.002 [DOI] [PubMed] [Google Scholar]
- Holt-Lunstad J, Smith TB, Baker M, Harris T, & Stephenson D (2015). Loneliness and social isolation as risk factors for mortality: A meta-analytic review. Perspectives on Psychological Science, 10(2), 227–237. doi: 10.1177/1745691614568352 [DOI] [PubMed] [Google Scholar]
- Hughes ME, Waite LJ, Hawkley LC, & Cacioppo JT (2004). A short scale for measuring loneliness in large surveys: Results from two population-based studies. Research on Aging, 26(6), 655–672. [DOI] [PMC free article] [PubMed] [Google Scholar]
- Jerusalem M, Hahn A, & Schwarzer R (1996). Social bonding and loneliness after network disruption: A longitudinal study of East German refugees. Social Indicators Research, 38(3), 229–243. doi: 10.1007/BF00292047 [DOI] [Google Scholar]
- Jylhä M (2004). Old age and loneliness: Cross-sectional and longitudinal analyses in the Tampere Longitudinal Study on Aging. Canadian Journal on Aging, 23(2), 157–168. doi: 10.1353/cja.2004.0023 [DOI] [PubMed] [Google Scholar]
- Klinenberg E (2012). Going solo: The extraordinary rise and surprising appeal of living alone. New York, NY: Penguin Press. [Google Scholar]
- Lenth RV, & Hervé M (2015). lsmeans: Least-Squares Means. R package version 2.16. [Google Scholar]
- Lucas GM, Knowles ML, Gardner WL, Molden DC, & Jefferis VE (2010). Increasing social engagement among lonely individuals: The role of acceptance cues and promotion motivations. Personality and Social Psychology Bulletin, 36(10), 1346–1359. doi: 10.1177/0146167210382662 [DOI] [PubMed] [Google Scholar]
- Luo Y, Hawkley LC, Waite LJ, & Cacioppo JT (2012). Loneliness, health, and mortality in old age: A national longitudinal study. Social Science & Medicine, 74(6), 907–914. doi: 10.1016/j.socscimed.2011.11.028 [DOI] [PMC free article] [PubMed] [Google Scholar]
- Lykes VA, & Kemmelmeier M (2014). What predicts loneliness? Cultural difference between individualistic and collectivistic societies in Europe. Journal of Cross-Cultural Psychology, 45(3), 468–490. doi: 10.1177/0022022113509881 [DOI] [Google Scholar]
- Newall NE, Chipperfield JG, Clifton RA, Perry RP, Swift AU, & Ruthig JC (2009). Causal beliefs, social participation, and loneliness among older adults: A longitudinal study. Journal of Social and Personal Relationships, 26(2–3), 273–290. doi: 10.1177/0265407509106718 [DOI] [Google Scholar]
- Nicolaisen M, & Thorsen K (2014). Who are lonely? Loneliness in different age groups (18–81 years old), using two measures of loneliness. International Journal of Aging & Human Development, 78(3), 229–257. doi: 10.2190/AG.78.3.b [DOI] [PubMed] [Google Scholar]
- Parkhurst JT, & Hopmeyer A (1999). Developmental change in the source of loneliness in childhood and adolescence: Constructing a theoretical model. In Rotenberg KJ & Hymel S (Eds.), Loneliness in childhood and adolescence (pp. 56–79). New York: Cambridge University Press. [Google Scholar]
- Paul KI, & Batinic B (2010). The need for work: Jahoda’s latent functions of employment in a representative sample of the German population. Journal of Organizational Behavior, 31(1), 45–64. doi: 10.1002/job.622 [DOI] [Google Scholar]
- Peplau LA, & Perlman D (Eds.). (1982). Loneliness: A sourcebook of current theory, research, and therapy. New York: Wiley. [Google Scholar]
- Perlman D (1990). Age differences in loneliness: A meta-analysis. Retrieved from http://eric.ed.gov/?id=ED326767 [Google Scholar]
- Pinquart M, & Sörensen S (2003). Risk factors for loneliness in adulthood and old age: A meta-analysis. In Shohov SP (Ed.), Advances in psychology research, Vol. 19. (pp. 111–143). Hauppauge, NY: Nova Science Publishers. [Google Scholar]
- Qualter P, Vanhalst J, Harris R, Van Roekel E, Lodder G, Bangee M, … Verhagen M, (2015). Loneliness across the life span. Perspectives on Psychological Science, 10(2), 250–264. doi: 10.1177/1745691615568999 [DOI] [PubMed] [Google Scholar]
- Queen TL, Stawski RS, Ryan LH, & Smith J (2014). Loneliness in a day: Activity engagement, time alone, and experienced emotions. Psychology and Aging, 29(2), 297–305. doi: 10.1037/a0036889 [DOI] [PMC free article] [PubMed] [Google Scholar]
- R Development Core Team. (2015). R: A language and environment for statistical computing. Vienna, Austria: R Foundation for Statistical Computing. [Google Scholar]
- Rotenberg KJ, Addis N, Betts LR, Corrigan A, Fox C, Hobson Z, … Boulton MJ (2010). The relation between trust beliefs and loneliness during early childhood, middle childhood, and adulthood. Personality and Social Psychology Bulletin, 36(8), 1086–1100. doi: 10.1177/0146167210374957 [DOI] [PubMed] [Google Scholar]
- Russell DW (1996). UCLA Loneliness Scale (Version 3): Reliability, validity, and factor structure. Journal of Personality Assessment, 66(1), 20–40. doi: 10.1207/s15327752jpa6601_2 [DOI] [PubMed] [Google Scholar]
- Savikko N, Routasalo P, Tilvis RS, Strandberg TE, & Pitkälä KH (2005). Predictors and subjective causes of loneliness in an aged population. Archives of Gerontology and Geriatrics, 41(3), 223–233. doi: 10.1016/j.archger.2005.03.002 [DOI] [PubMed] [Google Scholar]
- Schnittker J (2007). Look (closely) at all the lonely people: Age and the social psychology of social support. Journal of Aging and Health, 19(4), 659–682. doi: 10.1177/0898264307301178 [DOI] [PubMed] [Google Scholar]
- Schulz R (1976). Effects of control and predictability on the physical and psychological well-being of the institutionalized aged. Journal of Personality and Social Psychology, 33(5), 563–573. doi: 10.1037/0022-3514.33.5.563 [DOI] [PubMed] [Google Scholar]
- Segrin C (2003). Age moderates the relationship between social support and psychosocial problems. Human Communication Research, 29(3), 317–342. doi: 10.1111/j.1468-2958.2003.tb00842.x [DOI] [Google Scholar]
- Shiovitz-Ezra S, & Ayalon L (2012). Use of direct versus indirect approaches to measure loneliness in later life. Research on Aging, 34(5), 572–591. doi: 10.1177/0164027511423258 [DOI] [Google Scholar]
- Stack S (1998). Marriage, family and loneliness: A cross-national study. Sociological Perspectives, 41(2), 415–432. doi: 10.2307/1389484 [DOI] [Google Scholar]
- Statistisches Bundesamt. (2011). Bevölkerung und Erwerbstätigkeit: Entwicklung der Privathaushalte bis 2030 [Population and work status: Development of private households until 2030]. Retrieved from https://www.destatis.de/DE/Publikationen/Thematisch/Bevoelkerung/HaushalteMikrozensus/EntwicklungPrivathaushalte.html
- Sundström G, Fransson E, Malmberg B, & Davey A (2009). Loneliness among older Europeans. European Journal of Ageing, 6(4), 267–275. doi: 10.1007/s10433-009-0134-8 [DOI] [PMC free article] [PubMed] [Google Scholar]
- Tijhuis MA, De Jong-Gierveld J, Feskens EJ, & Kromhout D (1999). Changes in and factors related to loneliness in older men: The Zutphen Elderly Study. Age and Ageing, 28(5), 491–495. doi: 10.1093/ageing/28.5.491 [DOI] [PubMed] [Google Scholar]
- Tzonichaki I, & Kleftaras G (2002). Paraplegia from spinal cord injury: Self-esteem, loneliness, and life satisfaction. OTJR: Occupation, Participation and Health, 22(3), 96–103. doi: 10.1177/153944920202200302 [DOI] [Google Scholar]
- Victor CR, Scambler S, Bond J, & Bowling A (2000). Being alone in later life: Loneliness, social isolation and living alone. Reviews in Clinical Gerontology, 10(4), 407–417. doi: 10.1017/S0959259800104101 [DOI] [Google Scholar]
- Victor CR, Scambler SJ, Shah S, Cook DG, Harris T, Rink E, & de Wilde S (2002). Has loneliness amongst older people increased? An investigation into variations between cohorts. Ageing & Society, 22(5), 585–597. doi: 10.1017/S0144686X02008784 [DOI] [Google Scholar]
- Victor CR, & Yang K (2012). The prevalence of loneliness among adults: A case study of the United Kingdom. Journal of Psychology: Interdisciplinary and Applied, 146(1–2), 85–104. doi: 10.1080/00223980.2011.613875 [DOI] [PubMed] [Google Scholar]
- Wagner GG, Frick JR, & Schupp J (2007). The German Socio-Economic Panel Study (SOEP). Scope, evolution and enhancements. Schmollers Jahrbuch, 127, 139–169. [Google Scholar]
- Wenger GC, & Davies R (1996). Social isolation and loneliness in old age: Review and model refinement. Ageing & Society, 16(3), 333. doi: 10.1017/S0144686X00003457 [DOI] [Google Scholar]
- Yang K, & Victor C (2011). Age and loneliness in 25 European nations. Ageing & Society, 31(8), 1368–1388. doi: 10.1017/S0144686X1000139X [DOI] [Google Scholar]
Associated Data
This section collects any data citations, data availability statements, or supplementary materials included in this article.