

Abstract
Recent success in identifying gene regulatory elements in the context of recombinant adeno-associated virus vectors have enabled cell type-restricted gene expression. However, within the cerebral cortex these tools are largely limited to broad classes of neurons. To overcome this limitation, we developed a strategy that led to the identification of multiple novel enhancers to target functionally distinct neuronal subtypes. By investigating the regulatory landscape of the disease gene Scn1a, we discovered enhancers selective for parvalbumin and vasoactive intestinal peptide-expressing interneurons. Demonstrating the functional utility of these elements, we show that the PV-specific enhancer allowed for the selective targeting and manipulation of these neurons across vertebrate species, including humans. Finally, we demonstrate that our selection method is generalizable and characterize additional PV-specific enhancers with exquisite specificity within distinct brain regions. Altogether, these viral tools can be used for cell-type specific circuit manipulation and hold considerable promise for use in therapeutic interventions.
INTRODUCTION
Large-scale transcriptomic studies are rapidly revealing where and when genes associated with neuropsychiatric disease are expressed within specific cell types 1–4. Approaches for understanding and treating these disorders will require methods for targeting and manipulating specific neuronal subtypes; thus, gaining access to these populations in non-human primates and humans has become paramount. Recombinant adeno-associated viruses (rAAVs) are the method of choice for gene delivery in the nervous system but have a limited genomic payload and are not intrinsically selective for particular neuronal populations5. We and others have identified short regulatory elements capable of restricting viral expression to broad neuronal classes within the cerebral cortex (i.e. pan-pyramidal5 and pan-interneuron6) or a select subpopulation of a particular subtype (i.e subset of Sst within layer five7). In addition, systematic enhancer discovery has been accelerated by the recent development of technologies allowing for transcriptomic and epigenetic studies at single-cell resolution6–12. Despite these advances, the search space for enhancer selection remains enormous and to date success has been limited. To focus our enhancer selection, we chose to specifically examine the regulatory landscape of Scn1a, a gene expressed in distinct neuronal populations and whose disruption is associated with severe epilepsy13. Combining single-cell ATAC-seq data with sequence conservation across species, we nominated ten candidate regulatory sequences in the vicinity of this gene. By thoroughly investigating each of these elements for their ability to direct viral expression, we identified three enhancers that collectively target the breadth of neuronal populations expressing Scn1a. Among these, one particular short regulatory sequence was capable of restricting viral expression to parvalbumin-expressing cortical interneurons (PV cINs). To fully assess the utility of this element beyond reporter expression, we validated it in a variety of contexts, including synaptic tagging, calcium imaging, as well as opto- and chemo-genic approaches, both ex vivo and in vivo. Moreover, we show that this element allows for the selective targeting of PV cINs both during development and across species including rodents, non-human primates and humans. Demonstrating that this approach provides a generalizable strategy for enhancer discovery, we further selected twenty-five regulatory elements in the vicinity of seven additional genes whose expression is enriched in PV INs. From these we identified an additional four PV-specific regulatory elements, each of which had remarkably selective expression for this population within specific brain regions. Together our findings demonstrate the generalizability of our enhancer selection method, as well as the utility of a variety of functionally-tested tools that can be immediately utilized across animal models. These viral reagents can be employed to interrogate how functionally distinct neuronal cell-types are affected in the context of neurological, neurodevelopmental and neurodegenerative diseases in non-human primates. Ultimately, these may provide the means to therapeutically normalize pathological neuronal activity or gene expression in specific neuronal populations.
RESULTS
Identification of Scn1a enhancers
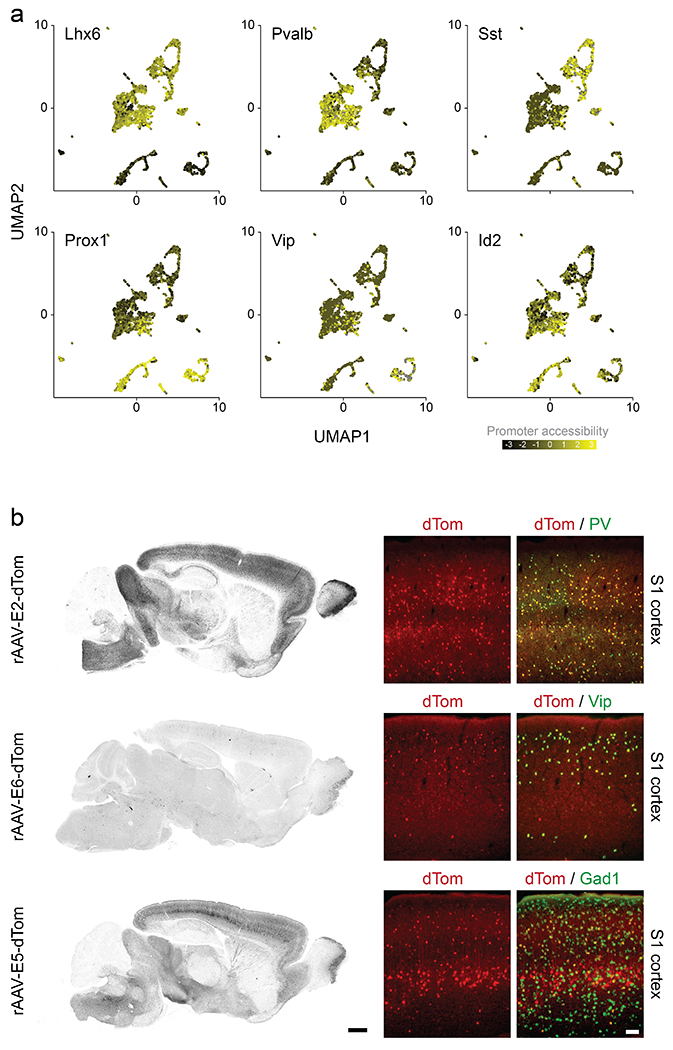
Scn1a encodes for Nav1.1, a sodium channel expressed in three non-overlapping neuronal populations: fast-spiking cortical interneurons expressing parvalbumin (PV cINs), dis-inhibitory cortical interneurons expressing the vaso-intestinal peptide (VIP cINs) and layer 5 pyramidal neurons14–16. Haploinsufficiency or pathogenic variants of Scn1a cause Dravet Syndrome, a common and intractable form of epileptic encephalopathy characterized by the early onset of seizures17–19. To devise a genetic strategy to target the distinct cortical populations expressing this gene, we developed an integrative method to systematically identify candidate enhancers within this locus. Regulatory sequences were selected based on the following three criteria. First, it has been posited that the proximity of the enhancer to the transcriptional start site (TSS) of a gene scales directly to the level of expression20. Therefore, to identify enhancers capable of driving functional levels of transgenes, we examined the intergenic and intronic regions of Scn1a closest to its TSS. Second, the location of active enhancers within a given cell type correlates with chromatin accessibility21,22. To assess the chromatin landscape of the cellular populations expressing Scn1a, we isolated and collected GFP+ nuclei from interneurons in the primary visual cortex of Dlx6a-cre::Sun1-eGFP transgenic mice and performed single-cell ATAC-seq profiling23,24 using the 10x Chromium platform. By applying stringent quality control criteria (see method) we recovered 3,374 nuclei with on average 107,000 reads and 74,100 fragments detected per cell (62% of the total number of nuclei loaded on the 10X chip). The chromatin accessibility profile of these nuclei was then analyzed using the SnapATAC analysis pipeline (see methods) allowing for the classification of these cells into the four major classes of cortical interneurons (figure 1a–c and extended data figure 1a). Third, as regulatory elements are subject to positive selection pressure, we identified sequences showing the highest conservation across mammalian species, including humans25–29. Thus, to nominate enhancers with therapeutic potential, we focused on ten selectively accessible intronic and intergenic regions near the TSS of Scn1a that are highly conserved across evolution (enhancer sequences E1 to E10 - figure 1d and supplementary table 1).
Figure 1. Identification of Scn1a enhancers.
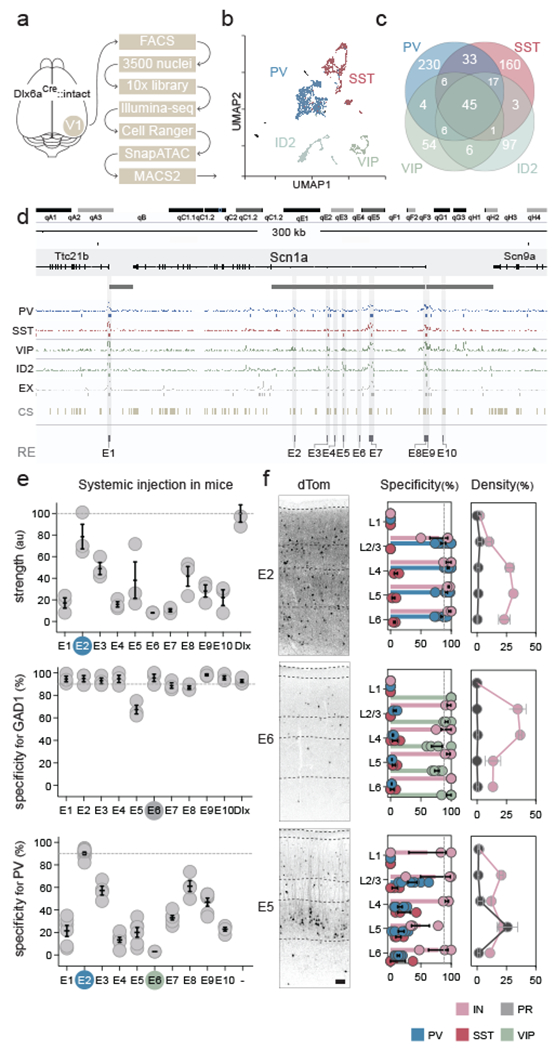
(a) Schematic representation of the scATAC-seq pipeline. Interneurons were collected from the visual cortex of adult Dlx6a-cre::Sun1-eGFP mice. (b) Plot of the 3500 nuclei in UMAP space. The clusters obtained from the SnapATAC pipeline were lumped into the four cardinal classes of interneuron. (c) Venn diagram showing the number of unique and shared peaks (in thousands) across the four interneuron populations. (d) Schematic representation of the enhancer selection method at the Scn1a locus (see methods section for complete description). (e, f). Adult mice were injected systemically with the indicated rAAV-E[x]-dTomato and analyzed 3 weeks post-injection. IHC for the reporter and indicated markers in the S1 cortex was used to assess the strength of expression of the reporter (e - upper panel) and the specificity of expression of the viral reporter for the indicated markers (all other panels). Representative fluorescent images of the indicated viral reporter in the somatosensory cortex (f left panels). Dashed lines represent the limits of anatomical structures. Scale bars represent 50um. On the graphs, the dots represent individual measurements and the lines represent average +/− s.e.m. Values for specificity, sensitivity and strength are listed in the supplementary table 2.
To examine the ability of the candidate enhancers to target the neuronal populations that express Scn1a, each sequence was inserted into an rAAV-backbone containing a minimal promoter upstream of a red fluorescent reporter (rAAV-E[x]-dTomato). From these constructs, rAAVs were then produced with the PHPeB capsid30 and systemically injected into adult mice. After 3 weeks, all viruses showed strong expression within the cortex, as well as across multiple brain regions. Except for E5, the vast majority of virally-labelled cells expressed the pan-interneuron marker Gad1. However, the degree of co-localization for PV within cortical neurons varied, ranging from over 90% for E2 to below 5% for E6, with all remaining enhancers displaying intermediate levels of PV specificity (i.e. percentage of cells expressing the viral reporter that co-express PV - figure 1e). Next, we further examined the identity and layer distribution of the neuronal populations captured by the E2, E5 and E6 enhancers. Consistent with their layer distribution, co-localization analysis with various markers revealed that the vast majority of cells expressing the viral reporter under the control of the E2 regulatory element co-localized with PV. We also found that E6 was highly selective for VIP interneurons. By contrast, the E5 regulatory element, while sparsely labeling interneurons across all layers, had a notable enrichment for pyramidal neurons in layer 5 (figure 1e,f and extended data figure 1b).
These data indicate that a significant fraction of the neuronal populations expressing Scn1a in the cortex is mirrored by the collective expression of these 3 enhancers. Notably, these regulatory elements account for largely non-overlapping expression in populations of neurons with distinct functions and developmental origins. The viral tools developed here thus provide a means for dissecting neuronal subtypes and can be used to study their normal function, as well as abnormalities in diseased cortex.
Viral targeting of PV cINs in mice
The E2 regulatory element, with 90% specificity for PV cINs, allows for the targeting of fast-spiking neurons that constitute 40% of all cortical interneurons. These neurons exert a strong level of inhibitory control over local networks and their disfunction has been directly implicated in neurological and neuropsychiatric disorders, including Dravet syndrome, focal epilepsy, ASD and schizophrenia 31–34. As such, gaining control over their activity is of particular interest for both fundamental research and clinical applications. Thus, we focused our efforts on characterizing the E2 regulatory element to develop a viral tool with broad utility. Adult mice systemically-injected with rAAV-E2-dTomato showed detectable expression of the viral reporter after one week and reached a high and stable level of expression after 3 weeks. Immunohistochemistry and in situ hybridization consistently showed that ~90% of virally labeled cells were PV INs in the cortex. Conversely, on average 75% of PV cINs expressed the viral reporter, reaching a maximum of 93% (figure 2a and 2b). To investigate whether the rAAV-E2-dTomato can target all PV subtypes, we further examined the intrinsic firing properties and the morphological features of virally labeled cells in both the somatosensory (S1) and prefrontal cortex (PFC) (extended data figure 2a–c). In these regions, chandelier cells are preferentially found in the upper layers and can be distinguished from basket cells based on their delay to first spike at rheobase35. In the superficial layers of the PFC, cells expressing the viral reporter showed either long or short delay to first spike, consistent with the presence of both basket and chandelier cells (extended data figure 2c). Furthermore, we observed cells in S1 with stereotypical features of chandelier cells. These cells had their soma located at the boundary of layer 1 and 2/3, and dendrites branching into layer 1 (extended data figure 2d). Together, these data suggest that the E2 is capable of targeting both basket and chandelier cells.
Figure 2. Viral targeting of PV cINs in mice.
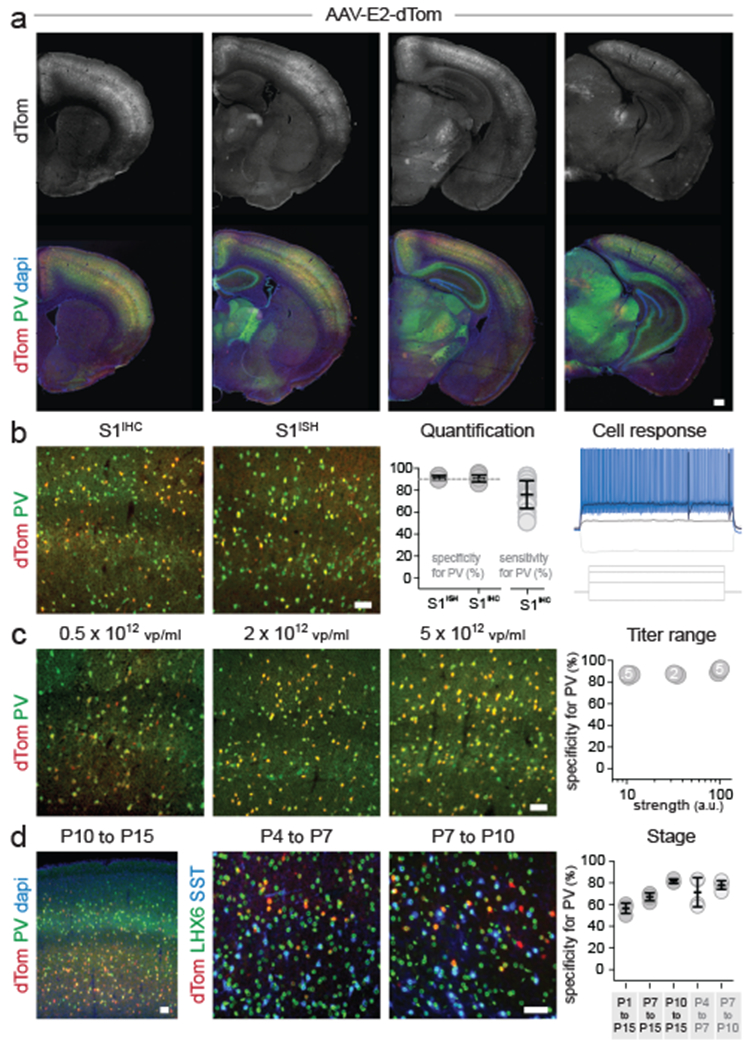
Adult mice were injected systemically (a,b) or locally (c) with rAAV-E2-dTomato and analyzed 3 weeks post-injection (systemic) or 1 week post-injection (local) by IHC or ISH for both the reporter and PV. Slice recording of the intrinsic properties of virally labeled neurons (b - right panel) See method section for details on the reproducibility of the representative images presented in panel a. (d) Mice were injected locally with rAAV-E2-dTomato and analyzed at the indicated developmental stages for the reporter and the indicated markers. Scale bars represent 250um (a) and 50um (b-d). On the graphs, the dots represent individual measurements and the lines represent average +/− s.e.m. Values for specificity, sensitivity and strength are listed in the supplementary table 2.
Although the viral reporter was predominantly confined to the cortex, some positive cells were observed in other brain regions closely corresponding to areas of Scn1a expression. E2 maintained high specificity for PV-expressing neurons within the primary visual cortex (V1) and cingulate cortex, subiculum, hippocampal CA1 and substantia nigra pars reticulata (extended data figure 2e). Importantly, virtually no viral reporter expression was observed outside of the brain, with the exception of a few cells observed in the liver (which is expected upon systemic delivery of any AAVs) and in the lungs (where Scn1a is expressed at a low level - extended data figure 2f). This shows that despite systemic delivery, the E2 vector can be used to selectively target PV-expressing neurons in various brain regions, with insignificant off-target expression outside of the central nervous system.
Many experimental paradigms and clinical applications will require local rather than systemic injection. To be useful in these contexts, viral expression must retain a high level of specificity for PV cINs. Stereotactically guided injections typically lead to a higher number of viral particles per cell compared to systemic delivery, which may result in off-target expression. To test whether increasing the viral load altered the specificity, we locally injected the same volume of rAAV-E2-dTomato at various titers in the cortex of adult mice and assessed reporter expression within PV cINs after a week (figure 2c). The results show that while higher titers had increased levels of reporter expression, no significant alteration of specificity was observed.
Targeting PV cINs at early postnatal stages has been hampered by the relatively late expression of parvalbumin (around 15 days after birth - P15) and the lack of other early markers for this population. Their involvement in developmental disorders highlights the need to target and manipulate this population during cortical circuit assembly. While complex genetic strategies offer a partial solution to achieving this in mice (i.e. Lhx6-Cre, Sst-Flp and Cre and Flp-dependent reporter), even this approach does not offer the means to easily manipulate these neurons before the second postnatal week. To test whether the E2 enhancer can target fast-spiking cINs before the onset of expression of parvalbumin, we examined its activity at various postnatal stages. To this end, we tiled our analysis across the early postnatal period, through a series of stereotactically-guided injections of rAAV-E2-dTomato (figure 2d). First, we assessed the selectivity of the reporter upon the onset of PV expression at P15. This revealed that we could obtain greater than 50% selectivity for PV cINs upon injection at P1, increasing to 67% by P7 injection and over 80% after P10 injection. We next wondered if we could use this approach to label PV cINs prior to P15. To identify fast-spiking cINs in this context, we relied on Lhx6-Cre/Intact transgenic mice, in which GFP is expressed in MGE-derived interneurons (both PV and SST cINs). By co-staining for SST, the PV cINs can be distinguished as GFP-positive/SST-negative. We obtained 72% and 78% specificity for PV cINs with a P4-P7 or a P7-P10 time course, respectively. Our approach provides a means to study these neurons during circuit maturation using a single viral injection.
Viral monitoring and manipulation of PV cINs in mice
Having demonstrated the fidelity of E2-directed expression for PV cINs with differing modes of injection and across developmental stages, we then explored the utility of this vector for studying connectivity (using a presynaptic reporter) and activity (using calcium-imaging). When E2 was used to drive a synaptophysin-tdTomato fusion gene36, reporter expression was restricted pre-synaptically to PV cINs, with terminals peri-somatically located onto pyramidal neurons (figure 3a). When this vector was used to drive GCaMP6f expression37, we demonstrated that PV cINs were recruited upon whisker stimulation (figure 3b and extended data figure 3a). Together these results demonstrate that E2 provides an effective means to monitor various aspects of PV cIN biology. We next examined whether E2 was sufficient to elicit functional changes in activity using chemo- or optogenetic approaches. E2 was used in adult animals to direct the expression of the chemogenetic receptor PSAM4-5HT3-LC (38). PV cINs in brain sections collected from these animals, when exposed to the actuator varenicline, could be induced to fire when current clamped below threshold (figure 3c). Similar results were obtained using the chemogenetic receptor Gq-DREADD39 (extended data figure 3b). Finally, both constant and high frequency laser stimulation of PV cINs expressing the red-shifted opsin C1V1 in brain slices40 resulted in firing time-locked to the stimulus. Demonstrating that engagement of these neurons resulted in concomitant local inhibition, pyramidal neuron activity in the vicinity of virally labeled PV cINs was consistently interrupted by laser stimulation. Notably, this effect was abolished by treatment with picrotoxin (figure 3d and extended data figure 3c).
Figure 3. Viral monitoring and manipulation of PV cINs in mice.
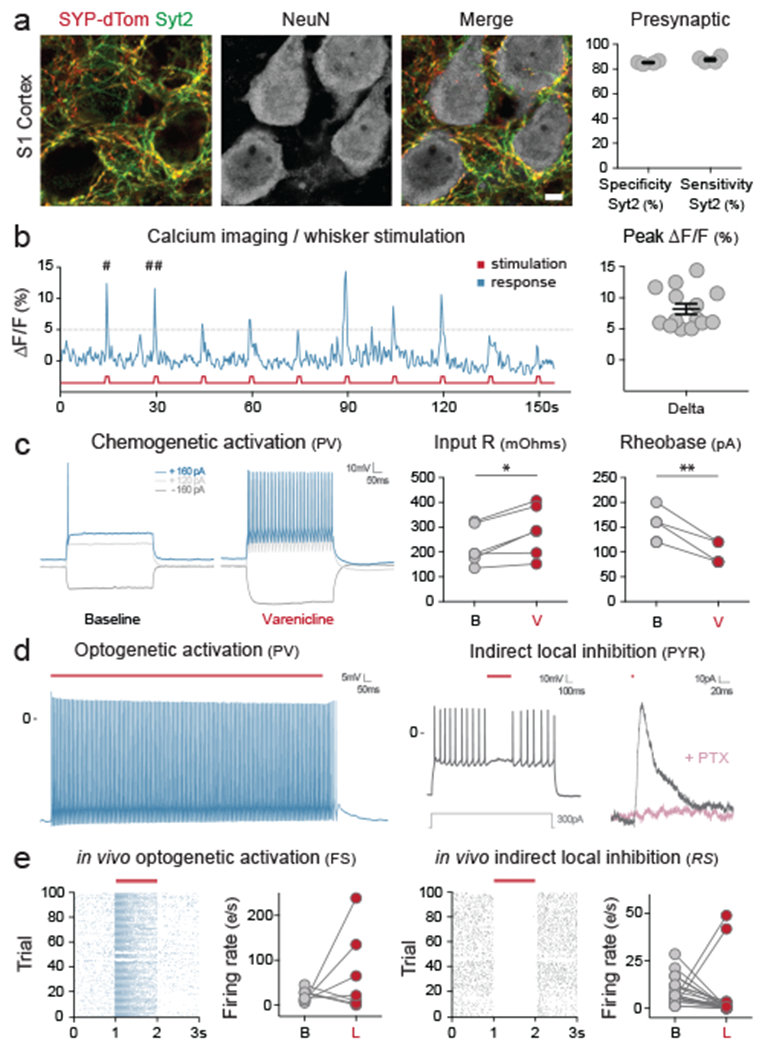
Mice were injected locally in the S1 cortex (a – P10 local injection with rAAV-E2-SYP-dTomato; b – P14 local injection with rAAV-E2-GCaMP6f; d, e – Adult local injection with rAAV-E2-C1V1-eYFP) or systemically (c – Adult systemic injection with rAAV-E2-PSAM4-5HT3-LC-GFP). (a) Representative images of the co-localization between the SYP-dTomato reporter and the synaptic marker Syt2 one-week post-injection and corresponding quantification. See method section for details on the reproducibility of the representative images presented in panel a. (b) Ca2+ imaging upon whisker stimulation was performed 2-3 weeks post-injection. The pound signs points at two peaks for which the widefield images are shown in extended data figure 3a. On the right panel, the success rate was calculated as the proportions of ΔF/F peaks above threshold in response to whisker stimulation. (c) Current clamp recording was performed on brain sections 4 weeks after injection. The traces show a representative cellular response at the indicated currents at both baseline and after bath application of varenicline. Left panel: p-value = 0.0616; t = 3.564; df = 5; *, ** and *** correspond to a p-value < 0.01, <0,001 and < 0,0001 respectively. Right panel: p-value = 0.0015; t = 6.325; df = 5; *, ** and *** correspond to a p-value < 0.01, <0,001 and < 0,0001 respectively. (d) Current clamp recording was performed on brain sections 2 weeks after injection. Cells expressing the viral reporter were exposed to 2 seconds of constant laser stimulation (550nm) while the voltage was recorded over 3 seconds. Neighboring pyramidal cells that did not express the viral reporter were also recorded from during laser stimulation. (e) In-vivo single-unit analysis of neuronal activity. Raster plots of virally infected neurons upon laser stimulation and corresponding population quantification data. The left panels show fast-spiking cells and the right panels show regular spiking excitatory cells. Notably, due to the mosaic nature of local viral injection, individual cell responses were bimodal. This presumably reflects whether or not particular cells were infected. Scale bars represent 5um. The red bars represent laser stimulation. On the graphs, dots represent individual measurements and the lines represent average +/− s.e.m. Values for specificity and sensitivity are listed in the supplementary table 2.
Having shown the efficacy of the method ex vivo, we next sought to explore our ability to alter excitatory networks in vivo by opto-genetically stimulating PV cINs. Three weeks following local injection of rAAV-E2-C1V1 in the primary visual cortex of adult animals, single unit recordings within the infected region were performed both at baseline and upon laser stimulation. The identity of recorded neurons was distinguished based upon their spike width and maximal firing frequency. Reliably, inhibitory interneuron firing rates were increased by laser stimulation, while excitatory neuronal firing was silenced (figure 3e). Together, these data show that the E2 enhancer is able to functionally engage PV cINs and elicit network inhibition using chemo- or optogenetics approaches both ex vivo and in vivo.
Viral targeting and manipulation of PV cortical interneurons in primates including humans
The high degree of sequence conservation of the E2 enhancer across mammalian species is suggestive of a conserved role in gene regulation. We thus sought to establish whether this element could be used to target PV cINs across mammalian species. We administered the rAAV-E2 driving a fluorescent reporter systemically in marmoset (intravenous injection using the capsid 9) or focally in rats and macaques (using the PHPeB capsid) and showed that we were able to target PV cINs with approximately 90% specificity across all three species (figure 4a).
Figure 4. Viral targeting and manipulation of PV cINs in primates including humans.
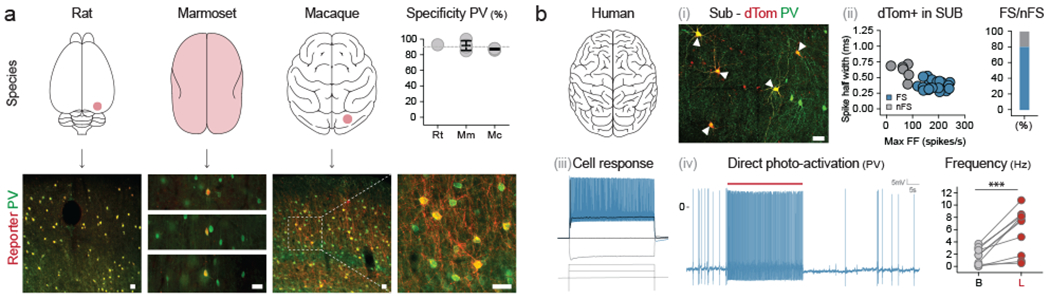
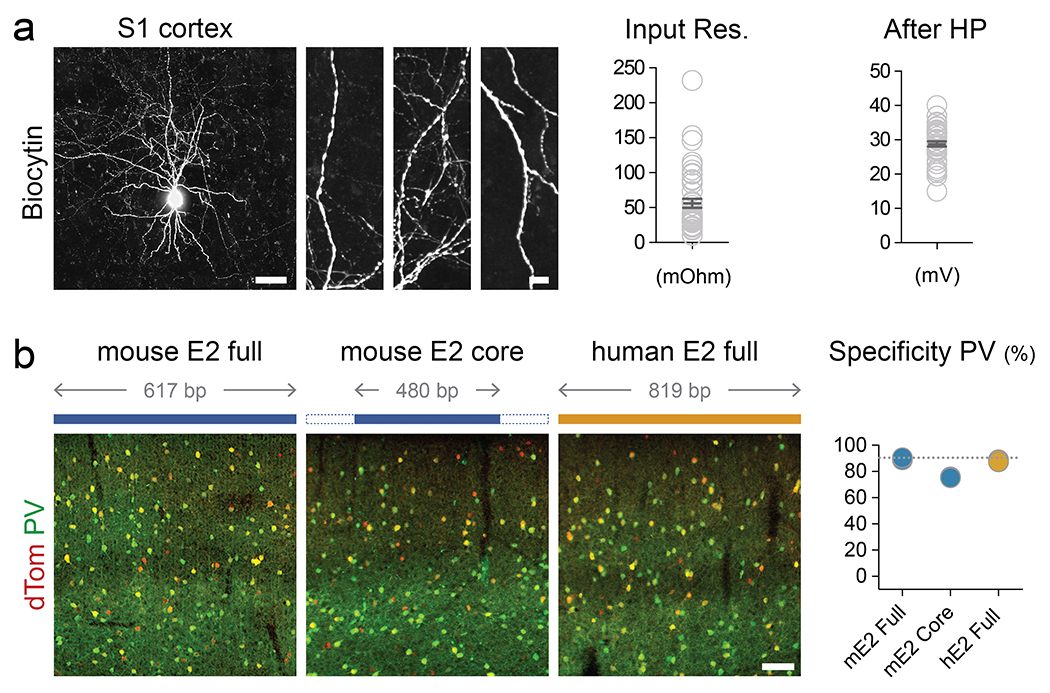
(a) Animals from indicated species were locally (rat and macaque) or systemically (marmoset) injected with rAAV-E2-C1V1-eYFP (macaque) or rAAV-E2-dTomato (rat and marmoset) and analyzed 2-8 weeks post-injection. See method section for details on the reproducibility of the representative images presented in panel a. (b) Human brain tissue obtained from surgical resection was exposed to either rAAV-E2-dTomato (i-iii) or rAAV-E2-C1V1-eYFP. See method section for details on the reproducibility of the representative images presented in panel b (i). (iv) and maintained in culture for 7-14 days. The p-value = 0.008; t = 4.899; df = 9; *, ** and *** correspond to a p-value < 0.01, <0,001 and < 0,0001 respectively. The upper right panel (ii) shows the proportion of fast-spiking neurons among the virally labeled cells assessed by electrophysiological recordings of intrinsic properties. (iii) Representative trace from a neuron recorded in (ii). (iv) Electrophysiology current clamp recording of virally labeled cells upon laser stimulation. Scale bars represent 50um. The red bars represent laser stimulation and the arrowheads point at neurons co-expressing PV and the viral reporter. On the graphs, dots represent individual measurements and the lines represent average +/− s.e.m. Values for specificity are listed in the supplementary table 2.
It has been discovered that human brain tissue obtained during surgical resection can be cultured for prolonged periods41. Taking advantage of this exceptional ability of human brain tissue to remain healthy ex vivo, we exposed freshly resected subiculum or medial temporal cortex to the rAAV-E2 virus. Over the two-week culture period, we observed the progressive appearance of fluorescently labeled cells. In regions where PV staining was reflective of the expected distribution of these cells, virally labeled cells were PV-positive (figure 4bi; see methods for details). In addition, the majority of cells within both the cortex and subiculum showed the characteristic hallmarks of PV INs as indicated by multiple criteria. These include morphology, as well as maximum firing rate when evoked through direct depolarization or optogenetic light stimulation (figure 4bii–iv and extended data figure 4a).
Importantly, the human version of the E2 enhancer showed the same degree of specificity for PV cINs upon injection in mice (extended data figure 4b), further demonstrating that non-coding regions of the genome characterized by a high degree of sequence conservation are likely to retain their functional properties across species. Finally, truncation of both the 5’ and 3’ ends of this enhancer resulted in a drastic reduction of specificity, suggesting that the functional boundaries of the E2 enhancer have been optimally identified (extended data figure 4b). Altogether these results indicate that the E2 enhancer provides an effective tool for targeting and manipulating PV cINs across mammals, including humans.
Identification of viral enhancers with regional specificity
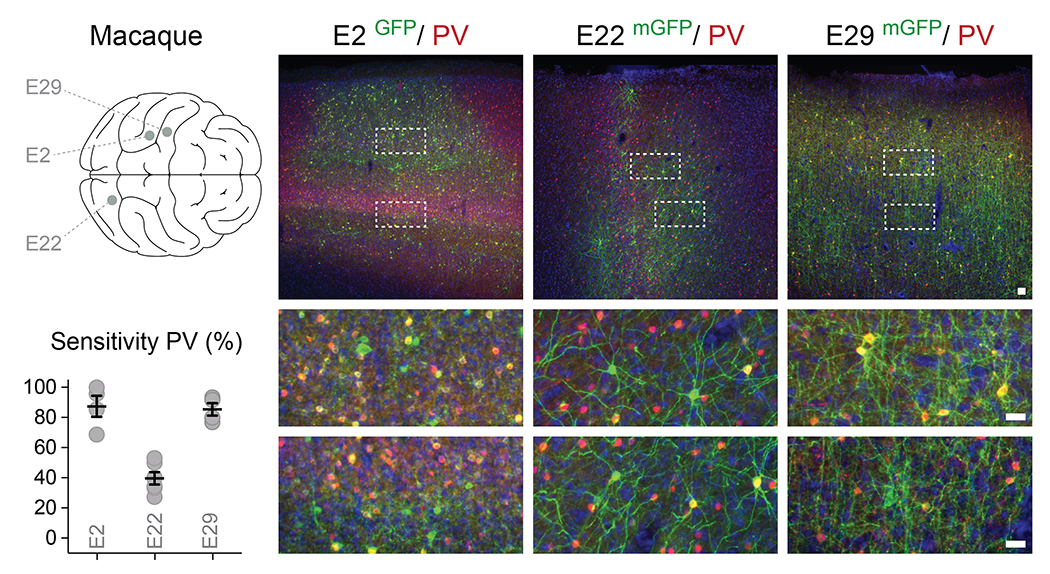
To demonstrate that our enhancer selection method is generalizable, we identified a further 25 candidates in the vicinity of seven genes whose expression was enriched in PV cINs across species (see methods). Systemic injection of AAVs containing these sequences revealed that four of them displayed an above 90% selectivity for PV cINs. Notably, among these enhancers, the relatively few virally labeled neurons that did not express PV, were positive for the pan-interneuron marker Gad1 (figure 5a). Each of these four enhancers were specific for distinct but overlapping subsets of the PV-expressing neurons. Specifically, while E11 and E14 enhancers showed the strongest reporter expression in the upper cortical layers, the E22 enhancer restricted expression almost exclusively to the cortex, with only a few cells showing low levels of expression elsewhere. By contrast, the E29 enhancer directed the most global expression, targeting the entire population of PV-expressing neurons throughout the central nervous system. All enhancers selected for our screen have a high degree of sequence conservation suggestive of conserved regulatory function across species. To directly test whether this correspondingly results in similar expression across species, we performed local injection of rAAV-E22-dTomato and rAAV-E29-dTomato viruses in the prefrontal and somatosensory cortices of macaques, respectively. This showed that, similar to mice, in both cases the expression of the reporter was restricted to PV cINs (figure 5b). The combination of regional selectivity and conservation of expression across species demonstrates the scalability of the enhancer selection method. This opens the possibility of using these tools for work in non-human primates and paves the way for the development of targeted therapies to correct abnormal brain function.
Figure 5. Identification of viral enhancers with regional specificity.
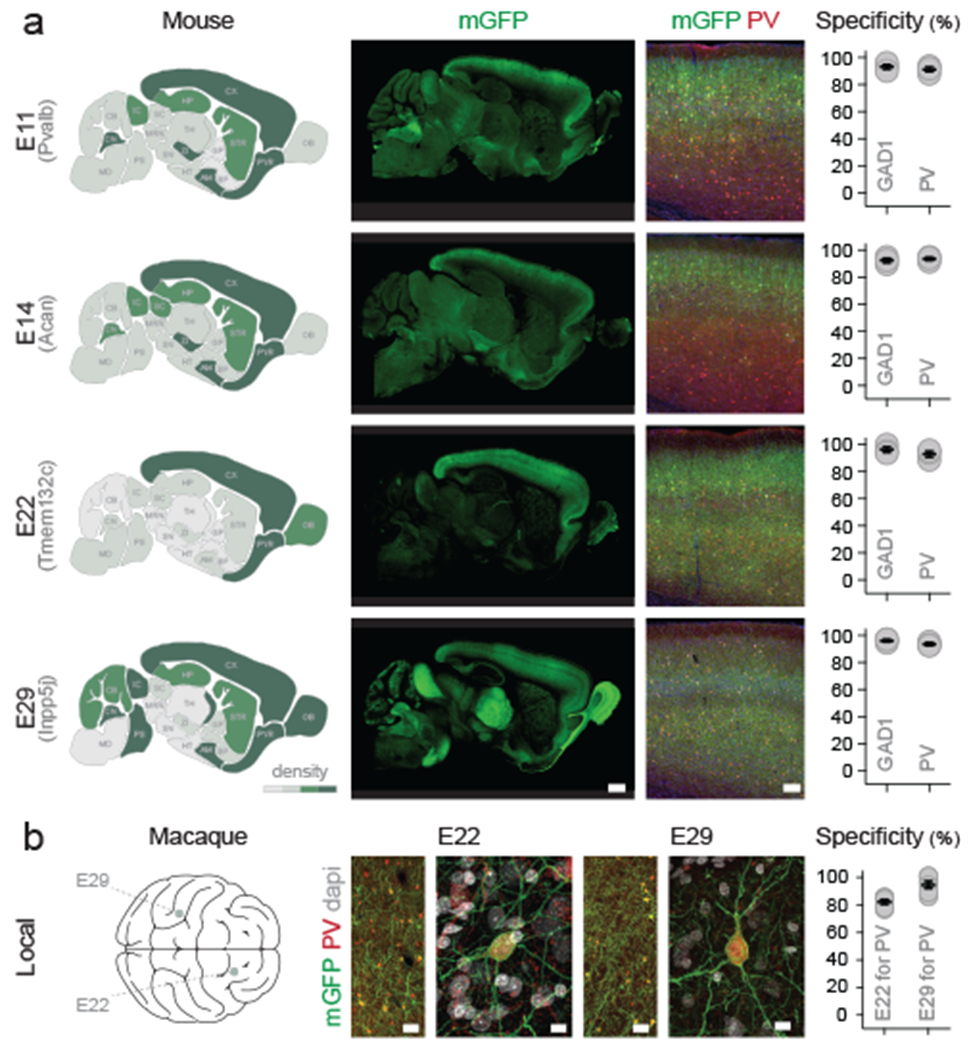
(a) Adult mice were injected systemically with the indicated rAAV-E[x]-mGFP and analyzed 3 weeks post-injection. IHC for the reporter and indicated markers in the S1 cortex was used to assess the density of neuronal cell-bodies expressing the viral reporter (left panels) and the specificity of expression of the viral reporter for the indicated markers (right panels). Note that for the E29 virus, there are no cell bodies in the thalamus at the exception of the TRN. (b) One adult macaque was injected in PFC with rAAV-E22-eGFP and another in S1 with AAV-E29-eGFP. Both animals were analyzed 8 weeks post-injection with immunohistochemistry for the reporter and indicated markers. Scale bars represent 100um (a), 50um (b left) and 10um (b right). On the graphs, dots represent individual measurements and the lines represent average +/− s.e.m. Values for specificity are listed in the supplementary table 2.
Sensitivity of viral enhancers for the PV cINs population
In order to estimate the percentage of the total targeted population which can be captured by a given enhancer, one needs to accurately know the percentage of the target population infected. As a result, the proportion of a given cellular population infected by a given rAAV depends on the mode of administration and the absolute number of viral particles injected. Estimating this is non-trivial. In fact, the only practical solution to achieving this is by performing viral injections that reach saturation (i.e. all cells are infected by at least one viral particle). This is currently impossible in primates. However, we attempted to estimate this for E2, E22 and E29 using local injections in macaques. As the diffusion of AAVs in parenchymal tissue upon local injection is limited, the degree of capture of the target population varied with the distance to the center of the injection site. We thus quantified the percentage of PV cINs expressing the viral reporter using the coronal brain sections showing the highest density of reporter expression. By selecting sub-regions of the images where the density of expression of the viral reporter was the highest (i.e. in the region nearest to the center of the injection), we could show that the sensitivity for PV (i.e. the percentage of PV cINs that express the viral reporter) appears highest for both E2 and E29 but lower for E22 (capturing 87%, 85 % and 40% of PV cINs, respectively - extended data figure 5). These numbers indicate E2 and E29 are capable of targeting the majority PV cINs, while E22 might be restricted to a subset of the population in non-human primates. Importantly, these measures are almost certainly an underestimate of the sensitivity, as we strongly suspect that in none of these cases 100% infectivity was achieved.
Enhancer sequence composition
Although the degree of conservation between the mouse and the human enhancer sequences is high, we wondered whether the continuously conserved sub-regions of these sequences might be enriched with core transcription-factor binding-sites (TFBS). To assess this, we analyzed the TFBS enrichment profile for each cell-type-specific enhancer using the CiiiDER analysis pipeline with the Jaspar vertebrate database42,43 (see methods). The analysis revealed that the majority of TFBS enriched in these sequences are found within sub-regions of the enhancer that are conserved between mouse and human (extended data figure 6). When conducted on the human homolog enhancer sequences, the outcome of this analysis was identical (data not shown). These results corroborate the initial assumption that the functional elements responsible for the specificity of the selected enhancers are nested within highly conserved sub-regions of the enhancer. Notably, a fraction of the mouse motifs enriched on the mouse enhancer sequence can be recognized by the equivalent human TFs. We speculate that these shared motifs constitute the core sequences that allow these sequences to maintain their functional properties across species.
DISCUSSION
A challenge in understanding neurological disorders stems from the complexity of the neuronal types involved. Here, in an effort to deconvolve the cellular actions of a particular disease gene, we systematically dissected Scn1a genomic locus. To this end, we identified ten different enhancers distributed across the intronic and intergenic region of this gene. By creating AAVs whose expression depends on each of these enhancers, we found three that recapitulate the global pattern of Scn1a gene expression. As loss of expression of Scn1a is especially associated with PV cIN disfunction15–19, we focused on the E2 enhancer, which was effective for selectively targeting these neurons, not only in rodents but also within various primates, including humans. This enhancer also proved useful for investigating various aspects of PV cIN function including connectivity, excitability, and for manipulating their activity with chemogenetic and optogenetic effectors. The demonstration of the utility of the E2 enhancer in a range of species highlights its usefulness for basic and clinical applications. Notably, this approach provides the means to evaluate and compare the circuit contributions and function of PV cINs across species, regardless of their genetic accessibility44,45.
An obstacle for enhancer discovery has been the broad landscape over which regulatory elements can act. Indeed, it has been shown that enhancers can regulate gene expression up to 1Mb away from the transcriptional start site. As a consequence, the more distal the enhancer the harder it is to predict what gene it regulates. As the purpose of this study was to identify cell type specific enhancers rather than to identify all the regulatory elements involved in Scn1a gene regulation, we limited the search to the intronic and intergenic regions of this locus. This approach led to the identification of 10 enhancers with various degrees of specificity, including three that collectively recapitulate the expression of Scn1a in the cortex. Our findings suggest that Scn1a expression is at least in part controlled by these elements, but doesn’t exclude the possibility that additional sequences located further away from the TSS of Scn1a may also contribute. With the advent of CRISPR-based screening20, this limitation will be addressed and will likely uncover additional regulatory elements that are more distal to the TSS of Scn1a.
We began this study by examining enhancers at a specific disease locus, the Scn1a gene. By identifying key regulatory elements for each of the cell types that express this gene, we clarified its regulatory landscape. Many SNPs associated with the SCN1A locus map to the first intron46–48. The three enhancers we characterized were located within this region, perhaps indicating that these SNPs represent mutations affecting the expression of Scn1a. Corroborating this hypothesis, GTEx data show multiple eQTLs within these enhancers that are associated with alterations in SCN1A expression in humans49. As Scn1a expression is largely restricted to the PV cINs (17,18), it is tempting to speculate that mutations of the E2 enhancer may be a direct cause of Dravet syndrome.
A major impediment in examining early dynamics of circuit maturation in the context of normal or pathological development (including Dravet Syndrome) is the inaccessibility to specific cell types without the use of transgenic animals. Young PV cINs have been particularly problematic to target even with complex genetic strategies. Given their abundance (they represent 40% of all inhibitory cINs) and relatively late, gaining access to them prior to the onset of PV expression has been long awaited by the field. The specificity of the E2 enhancer at these developmental stages and the simplicity of the viral injection over the use of transgenic animals provides the means to study both their normal development and role in disease.
More broadly, the enhancers identified in this study provide access to neuronal populations with particular clinical relevance. Most obviously these enhancers can potentially be leveraged to alleviate debilitating aspects of Dravet syndrome, through either gene therapy or modulation of neuronal activity50. We demonstrate that local and systemic injections can be used for effective viral delivery to the brain. With local injections, one could possibly ameliorate focal epilepsy, prefrontal cortex dysfunction or hippocampal memory disorders. By contrast, systemic introduction of virus could be used in contexts where global interventions are necessary. For instance, to correct generalized seizures, or for psychiatric and neurodegenerative disorders. Our study shows that the rigorous identification of regulatory elements provides a road map for accessing specific cell types for therapeutic contexts.
Importantly, we demonstrated that our enhancer selection method is generalizable to other genes. Overall, we found a set of 7 enhancers with unique specificity for both distinct neuronal populations and regions of the central nervous system. Even with the stringent criteria that we applied (>90% selectivity for the target population), our method has a remarkable (>20%) success rate. Moreover, as predicted by the high degree of sequence conservation, the subset of enhancers that we tested proved equally selective and effective across species including humans. Taken together, our findings support that these methods provide a reliable means to systematically identify cell-type specific enhancers that work across species.
METHODS
Animals.
Mice. Female C57BL/6J mice (Mus musculus; 10 weeks old) were obtained from Jackson Labs (Bar Harbor, ME - stock# 000664). Male hemizygous Dlx6a-cre mice (Mus musculus; 10 weeks old - Jax stock #008199) and female homozygous INTACT mice (Mus musculus; 10 weeks old - flox-Sun1-eGFP, Jax stock #021039). Mice were maintained at macroenvironmental temperature and humidity ranges of 64 to 79 °F (17.8 to 26.1 °C) and 30% to 70%, respectively. These parameters were monitored closely and controlled within rodent colony rooms. Rat. Sprague Dawley rats (Rattus norvegicus, 12 weeks old 150-250g) were obtained from Charles River labs, Kingston, NY. Marmosets. One female common marmoset (Callithrix jacchus, 6.0 years old) was obtained from the colony at Massachusetts Institute of Technology. Macaques. Adult (2 years old) male macaques (Macaca mulatta) were obtained from the California National Primate Research Center at the University of California, Davis. All the animals were maintained in a 12 light/12 dark cycle with a maximum of five animals per cage for mice and one animal per cage for rats at . Marmosets and macaques were socially housed. All animal maintenance and experimental procedures were performed according to the guidelines established by the Institutional Animal Care and Use Committee at the Broad Institute of MIT and Harvard (mice), McGovern research institute at MIT (rats and marmosets) and Salk Institute for Biological studies (macaques).
scATAC-seq library preparation and sequencing.
Male hemizygous Dlx6a-cre mice (Jax stock #008199) were crossed with female homozygous INTACT mice (flox-Sun1-eGFP, Jax stock #021039) to yield Dlx6a-cre::INTACT offspring for scATAC-seq experiments. Brains from P28 Dlx6a-cre::Sun1-eGFP mice were harvested, sectioned coronally on a mouse brain slicer (Zivic Instruments), and the primary visual cortex was dissected in ice-cold ACSF. Tissue was then transferred to a dounce homogenizer containing Lysis Buffer (10 mM Tris-HCl, 10 mM NaCl, 3 mM MgCl2, 0.01% Tween-20, and 0.01% IGEPAL CA-630, 0.001% Digitonin). Tissue was homogenized with 10 strokes of pestle A, 10 strokes of pestle B, and incubated for 5 min on ice before being filtered through a 30 μm filter and centrifuged at 500xg for 10 min at 4μc. The pellet was resuspended in 1% BSA for sorting GFP+ nuclei on a Sony SH800S cell sorter. Nuclei were sorted into Diluted Nuclei Buffer (10X Genomics). The scATAC library was prepared using the 10x Genomics platform with the Chromium Single Cell ATAC Library & Gel Bead Kit v1.0 (PN-1000111), Chromium Chip E Single Cell kit (PN-1000156) and Chromium i7 Multiplex Kit N, Set A (PN-1000084) as instructed by the manufacturer. High quality data was recovered from approximately 60% of the input nuclei. Libraries were sequenced using a Nova-Seq S2 100 cycle kit (Illumina).
scATAC analysis.
Raw sequencing data were processed with Cell Ranger ATAC (v1.1.0) pipeline (10X Genomics) and sequencing reads were aligned to the mouse reference genome (GRCm38 - mm10 - Mus musculus). The fragments files from the output of this pipeline were then used to generate snap files for analysis using the snapATAC package as described previously (v1 - https://doi.org/10.1101/615179). Cells were clustered using graph-based clustering (k=15, 24 principle components). Gene body accessibility was calculated as described in the snapATAC package for interneuron subtype marker genes and used to determine clusters corresponding to interneuron cardinal classes. For each cardinal class, bigwig files were generated and peaks were called using MACS2 (v2.2.7.1 - https://github.com/taoliu/MACS). for input into the Integrated Genome Browser (v2.3) and enhancer selection. Peaks across cardinal classes were compared using Bedtools (v 2.28.0).
Enhancer selection.
Candidate regulatory elements were manually curated from a list of elements generated by intersecting the “context” region (intergenic region limited to 100kb + intron1 of Scn1a for the first part of the study or another 7 genes for the larger screen described in Figure 5) with both the scATAC-seq peak and the conservation data from the PhastCons Analysis. Three criteria as outlined below were used to make these selections (i.e. Gene selection, Accessibility, and Conservation). Gene selection. Scn1a was selected based on its known expression profile in PV cINs and its role in disease. The 7 genes for the screen presented in Figure 5 were selected based on a differential gene expression analysis performed independently on both the Tasic et al., 2016 and Saunders and Macosko et al, 2018 scRNAseq datasets. Specifically, each cluster from the original study was manually associated to one of seven meta-clusters (i.e. the four cardinal classes in interneurons - PV, SST, VIP, ID2, two classes of pyramidal neurons - intratelencephalic IT or subcortical SC projecting neurons and non-neuronal populations - NN). A total of 92 genes showed significant enrichment in PV cINs in both datasets (i.e. the average expression of the genes was at least 2 times higher in PV cINs compared to other interneurons meta-clusters and 5 times higher compared to pyramidal or non-neuronal cell types - with an adjusted p-value below 0.01 based on pairwise comparison of each meta-clusters using t-test and Bonferroni correction for multiple comparisons). We then focused on the top 20 genes with the highest average expression in PV cINs and manually selected a final subset of 7 genes that showed an expression pattern consistent with PV cINs enrichment using ISH data from the Allen Brain Atlas mouse brain (i.e. sparse labeling in the S1 cortex with biased distribution toward deep cortical layers). The seven genes included in the final selection were Pvalb, Acan, Tmem132c, Lrrc38, Inpp5j, Mef2c, and Pthlh. Accessibility. scATAC-seq peaks obtained for each of the 4 classes of interneurons (see above) were examined. Bulk ATAC-seq data for cortical excitatory neurons generated in Mo et al. 2015 were downloaded from the GEO repository (GSE63137) and discretized as peaks using MACS2 (v2.2.7.1 - https://github.com/taoliu/MACS). Conservation. The “phastCons-Element60way” track was downloaded from the UCSC portal (https://genome.ucsc.edu) using the table browser interface. We then used the bedtools suite to remove blocks shorter than 10bp and subsequently merged any blocks separated by less than 50bp. The resulting file was then imported to the IGV genome browser and used to identify genomic regions with a high degree of conservation across species. Identification of human homolog sequence of each mouse enhancer. In order to find the human homolog of the mouse enhancer sequences, we used EMBOSS Needle portal (https://www.ebi.ac.uk/Tools/psa/emboss_needle/). This tool is based on the Needleman-Wunsch alignment algorithm that finds an optimal global sequence alignment by penalizing starting and extending gaps. Using this approach, we compared the mouse sequence of a given enhancer with a region of 100kb up and downstream surrounding the human gene associated with the enhancer (i.e. the mouse E2 enhancer sequence was compared to a ~200kb region of the human genome centered on the SCN1A). In all cases tested, we identified a human sequence of similar length showing a high degree of conservation with the mouse sequence. Degree of conservation between mouse and human. We used the output of the analysis described above and calculated the percentage of base pairs from mice that are identical in humans. This criterion was used to prioritize which enhancers were tested in non-human primates.
Transcription binding-site enrichment analysis.
TFBS enriched in the mouse or human enhancer sequences were identified using the CiiiDER pipeline (42, 43). The analysis was performed using the mouse or human motifs from the Jaspar 2020 core redundant vertebrates TFBS database (http://jaspar.genereg.net/tools/), respectively. TFBS were classified based on whether the motif sequence predominantly overlaps with a conserved or non-conserved region, excluding TFBS with exactly 50% overlap. The Emboss Needle tool was used to define regions of conservation by using the mouse sequence and human homolog as inputs. Next, putative human TFs that recognize motifs on the conserved regions of the mouse sequence were identified using the human Jaspar motifs and mouse sequence as inputs to CiiiDER. Finally, the putative human and mouse TFBS on the mouse sequence were compared to define if any equivalent TFs between the two species were corresponding on the same location.
rAAV cloning and production.
The enhancer sequences were amplified by PCR from mouse genomic DNA using the following primers: E1: caaagtggacagaggggagg and gtgctgttgggagtggtgga (1280 bp); E2: aatctaacatggctgctata and caattgctcagagttatttt (618 bp); E3: ataaaattttattttcctaa and gaggaaatcagctacggggc (832 bp); E4: tctgacagagcaagtcttga and tatcaaaattgtatattcag (261 bp); E5: aatgttttgatatttaggag and ttgactcttaaaatttaata (663 bp); E6: ttgtcactttgttactctac and ttaaatcttaaaattttcct (606 bp); E7: gatactgtataattaattag and cttccttctggttccttttt (2430 bp); E8: attgatctccaactttttaa and gttcatccaagtaataagag (1644 bp); E9: atctcaagtgtatgtaacat and gtctttttgttttttttttt (521 bp); E10: tattgcaaaaggaaggaatg and tcatggaaaaagaaaaaatc (547 bp); E11: actgtttgagcgggcagagc and agttcttaacattcagattt (504 bp); E14: tcggttctctctgtagtctg and gcggggaggggtgtcttcaa (496 bp); E22: tcggggtttaaccgttcaga and gggtttaaatatagagtccc (443 bp); E29: atagtggcgctatgtgggag and agagtagaggctttgccttg (628 bp). The enhancers, reporters and effectors were cloned using the Gibson Cloning Assembly Kit (NEB-E5510S) following standard procedures. Specifically, for AAV-E1:10-dTomato, we amplified the dTomato coding sequence from the plasmid Addgene # 83897; for AAV-E2-SYP-dTomato, we amplified the Synaptophysin-tdTomato coding sequence from the plasmid Addgene # 34881; for AAV-E2-GCaMP6f, we amplified the GCaMP6f coding sequence from the plasmid Addgene # 83899; for AAV-E2-C1V1-eYFP, we amplified the C1V1-eYFP coding sequence from the plasmid Addgene # 35499. For AAV-E11,14,22 and 29-ChR2-GFP, we amplified the ChR2 coding sequence from the plasmid Addgene # 55639 and complemented it with a GFP-P2A-GFP cassette. The rAAVs were produced using standard production methods. PEI was used for transfection and OptiPrep gradient (Sigma, USA) was used for viral particle purification. Serotype 1 was used to produce the AAVs for local injections in mice and rats. Serotype 9 was used for systemic injection in marmosets and serotype PHPeB was used for both local injection in macaques and systemic injections in mice. Titer was estimated by qPCR with primers for the WPRE sequence that is common to all constructs. All batches produced were in the range of 10E+11 to 10E+13 viral genomes per ml.
Local and systemic viral injections.
Mouse local S1. Local injection in adult mice were performed by stereotactically guided injections in the somatosensory cortex with the following coordinates 1.0 mm posterior, 2.9 mm lateral, 0.7/0.45 mm ventral relative to Bregma with 75nL of virus produced with the capsid PHPeB. Mouse systemic. For systemic injection in adult mice, 10E+11 viral particles produced with the capsid PHPeB were injected in the retro-orbital sinus per animal. Post-operative monitoring was performed for five days post injection. Rat local in V1. Local injection of AAV produced with the capsid PHPeB in adult rats were performed by stereotactically guided injections in the primary visual cortex with the following coordinates 5.4 mm posterior, 4.2 mm lateral, 2.0 mm ventral relative to bregma with 670nL of virus. Marmoset systemic injection. For systemic injection in adult marmosets, approximately 10E+12 viral particles produced with the serotype 9 in ~ 0.7 ml of sterile PBS were injected into the saphenous vein, followed by another infusion with ~ 0.5 ml of saline. After the final infusion, pressure was applied to the injection site to ensure hemostasis. The animal was returned to its home cage and monitored closely for normal behavior post anesthesia. The animal was euthanized 51 days after viral injection. Macaque local: Local injection in adult macaques were performed by a stereotactically guided injection of virus produced with the capsid PHPeB at the following coordinates: 13 mm anterior, 19 mm lateral, 23 mm superior (V1), 27 mm anterior, 18 mm lateral, 34 mm superior (PFC); 5 mm posterior, 13 mm lateral, 40 mm superior (V1) relative to the center of the inter-aural line (based on the animal’s MRI). A total of volume of 1332nL was injected, equally divided in 4 depths (i.e. 1.8, 1.3, 0.8 and 0.3 mm from the cortical surface).
Electrophysiological recordings in mice.
Virally injected mice were anesthetized with isoflurane. Upon loss of reflexes, mice were transcardially perfused with ice-cold oxygenated ACSF containing the following (in mM): 87 NaCl, 75 sucrose, 2.5 KCl, 1.25 NaH2PO4, 26 NaHCO3, 10 glucose, 1 CaCl2 and 2 MgCl2. Mice were then decapitated and 300-μm thick coronal slices were sectioned using a Leica VT-1200-S vibratome and incubated in a holding chamber at 32–35 °C for 15–30 min followed by continued incubation at room temperature 20–23.5 °C (68–74 °F) for at least 45–60 min before physiological recordings. Slice containing the injection site were transferred in a recording chamber submerged with oxygenated ACSF containing the following (in mM): 125 NaCl, 2.5 KCl, 1.25 NaH2PO4, 26 NaHCO3, 10 glucose, 2 CaCl2 and 1 MgCl2 (pH = 7.4, bubbled with 95% O2 and 5% CO2). Whole-cell current-clamp recordings were obtained from visually identified cells expressing the viral reporter using borosilicate pipettes (3–5 MΩ) containing (in mM): 130 K-gluconate, 6.3 KCl, 0.5 EGTA, 10 HEPES, 4 Mg-ATP, 0.3 Na-GTP and 0.3% biocytin (pH adjusted to 7.3 with KOH). Upon break-in, series resistance (typically 15–25 MΩ) was compensated and only stable recordings (<20% change) were included. Data were acquired using a MultiClamp 700B amplifier (Molecular Devices), sampled at 20 kHz and filtered at 10 kHz. All cells were held at −60 mV with a DC current, and current-step protocols were applied to obtain firing patterns and to extract basic sub-threshold and supra-threshold electro-physiological properties. Cells not expressing the viral reporter were selected according to their pyramidal-cell-shaped soma under IR-DIC visualization and voltage clamp recordings were made with pipettes containing (in mM): 130 Cs-gluconate, 0.5 EGTA, 7 KCl, 10 HEPES, 4 Mg-ATP, 0.3 Na-GTP, 5 phosphocreatine, 5 QX-314 and 0.3% biocytin (pH adjusted to 7.3 with CsOH). Cells were held at 0 mV for baseline and optogenetic or chemogenetic stimulation. For both current and voltage clamp recording, a baseline of at least 2 min was recorded before stimulation. Small pulses (−20 pA or −5 mV, 100 ms at 0.2 Hz or 0.5 Hz) were applied throughout the baseline and CNO application to monitor series resistance changes. Data were analyzed offline using Clampfit software (v10.2 - Molecular Devises).
In-vivo calcium imaging.
Approximately 100 nL of AAV-E2-GCaMP6 virus was injected in barrel cortex at postnatal day 10. At P27-P34, craniotomies were implanted over the injection site and widefield calcium imaging performed after recovery from craniotomy procedure. Briefly, anesthetized (1.5% isoflurane) mice were imaged at 3-4Hz with 4x magnification (Thorlabs CCD camera – 1501M-USB, Thorlabs LED stimulation – DC4104), while air puffs (100-200ms duration, Picospritzer III) at specific intervals (5-20s) were directed at contralateral whiskers. Multiple recordings were performed and afterward the mouse was perfused for histological analysis. Recordings were analyzed in ImageJ by calculating the F/F (change in fluorescence/average fluorescence) for each recording and synched whisker stimulation. A threshold of (5%) F/F was set for both stimulated and spontaneous calcium signal response.
Electrophysiological recordings in human.
Tissue preparation, culture protocol and inoculation of virus. Four participants (2 male / 2 female; age range 22-57 years) underwent a surgical procedure in which brain tissue (temporal lobe and hippocampus) was resected for the treatment of drug resistant epilepsy. In all cases, each participant had previously undergone an initial surgery for placement of subdural and/or depth electrodes for intracranial monitoring in order to identify the location of seizure onset. The NINDS Institutional Review Board (IRB) approved the research protocol (ClinicalTrials.gov Identifier NCT01273129), and we obtained informed consent from the participants for experimental use of the resected tissue. 300 um slices from both hippocampus and temporal lobe were attained (Leica 1200S Vibratome; Leica Microsystems, Bannockburn, IL) in ice-cold oxygenated sucrose based cutting solution (100mM sucrose, 80mM NaCl, 3.5mM KCl, 24mM NaHCO3, 1.25mM NaH2PO4, 4.5mM MgCl2, 0.5mM CaCl2, and 10mM glucose, saturated with 95% O2 and 5% CO2) within 30 minutes following neurosurgical resection. Slices were then incubated in the sucrose cutting solution at 33oC for 30 minutes and allowed to cool to room temperature for 15-30 minutes. The slices were transferred to culture media (Eugène et al., 2014) and placed in an incubator (5% CO2) at 35oC for 15 minutes of equilibration. Each individual slice was then transferred onto a 30 mm Millicell Cell Culture Insert (Millipore; Cat No. PICM0RG50) for interface culture and incubated as above. After 12 hours, the culture medium was changed and 1-2 ul of pAAV-S5E2-dTomato with or without pAAV-S5E2-C1V1-eYFP was directly pipetted onto each slice and placed back into the incubator. For hippocampal slices, the virus was targeted to the subiculum subfield. Electrophysiological recordings. Electrophysiological recordings from cultured human slices were performed between 7 to 14 days after viral inoculation. Cultured human slices were transferred to a recording chamber perfused with extracellular solution (130 mM NaCl, 3.5 mM KCl, 24 mM NaHCO3, 1.25 mM NaH2PO4-H2O, 10 mM glucose, 2.5 mM CaCl2 and 1.5 mM MgCl2 saturated with 95% O2/5% CO2 (pH 7.4; 300-310 mOsm) at a rate of 3 - 4 ml/min at 33oC. Whole cell patch clamp recordings from pAAV_S5E2-dTomato or pAAV-S5E2-C1V1-eYFP infected neurons were performed with an intracellular solution of the following composition: 130 mM K-gluconate, 10 mM HEPES, 0.6 mM EGTA, 2 mM MgCl2, 2 mM Na2ATP, 0.3 mM NaGTP and 0.5% biocytin (pH adjusted to 7.4; osmolarity adjusted to 285 -300 mOsm). Intrinsic membrane and firing properties were assayed essentially as described previously. 550nm light stimulated optogenetic activation of C1V1 was delivered to the slices via the 40X water immersion objective using a CoolLED pE-4000 Illumination system (Andover, UK).
Immunohistochemistry.
All antibodies used in this study are commercially available and have been validated by the manufacturer. In addition to the validation statement that can be found by consulting the manufacturer’s website using the references provided below, the specificity of each primary antibody was examined and confirmed for the species for which it was used based on examining the signal intensity, the density of staining and the consistency with morphological features of the cellular populations and are presented in the relevant panels across the figures and extended data figures of the manuscript. All animals injected with the virus were trans-cardially perfused with 4% paraformaldehyde (PFA). The brains were placed in 4% PFA overnight then sectioned at 40 μm using a Leica VTS1000 vibrosector. Floating sections were permeabilized with 0.3% Triton X 100, 5% normal donkey serum, and PBS for 30 minutes. The sections were then incubated overnight in 0.1% Triton X 100 with the indicated combination of the following primary antibodies at 4 °C: chicken anti-GFP at 1:1,000 (Abcam USA, ab13970); rabbit anti-DsRed at 1:1,000 (Clontech USA 632496); goat anti-PV at 1:1,000 (Swant USA, PVG-213); guinea-pig anti-PV at 1:2,000 (Swant USA, GP-72); rabbit anti-SST at 1:2,000 (Peninsula USA, T-4103.0050); mouse anti-Synaptotagmin-2 at 1:250 (ZFIN USA, #ZDB-ATB-081002-25). The sections were then washed three times with PBS, incubated with Alexa Fluor-conjugated secondary antibodies at 1:1,000 (Invitrogen, USA), counterstained with DAPI (Sigma, USA) and mounted on glass slides using Fluoromount-G (Sigma, USA).
In-situ hybridization.
The in-situ hybridization probes (Gad1; product #400951, Pvalb; product #421931, VIP; product #415961) used were designed by Advanced Cell Diagnostics (Newark, CA, USA). The reagents in the RNAscope® Multiplex Fluorescent Reagent Kit v2 (product # 323100), RNAscope® Probe Diluent (product #300041), HybEZ™ oven (product #321710/321720), humidity control tray (product # 310012), and HybEZ Humidifying Paper (product #310025) were also from Advanced Cell Diagnostics. TSA Plus Fluorescein, TSA Plus Cyanine 3, and TSA Plus Cyanine 5 from PerkinElmer (#NEL741, #NEL744, and #NEL745). Brain tissue was processed as mentioned in the immunohistochemistry section. Brain sections were washed one time in PBS followed by three washes in 0.1% Triton X-100 and PBS, mounted on Superfrost Plus glass slides (Fisher Scientific, 12-550-15) and baked at 60C in the HybEZ oven for 25 minutes. The slides were then submerged in 4% PFA for 30 minutes then washed 3 times in H2O. RNAscope H2O2 was applied to each section for 5 minutes at room temperature. The slides were then washed 3 times in H2O before being submerged in pre-warmed 90μc H2O for 15 seconds and followed by pre-warmed 90C RNAscope Target Retrieval for 15 minutes. Slides were washed 3 times in H2O before RNAscope Protease III was applied onto each section and then incubated for 15 minutes at 40μc in the HybEZ oven. Slides were washed 3 times in H2O and then incubated with probe solution diluted to 1:50 with probe diluent for 2 hours at 40μc in HybEZ oven. Next, the sections were washed three times in RNAscope wash buffer followed by fluorescence amplification. Of note, probes against the RNA of the reporter revealed a non-specific staining that we speculate comes from the viral DNA. In order to reveal the viral reporter, we followed the RNAscope protocol with an IHC amplification of the dTomato. The sections were incubated in blocking solution (0.3% Triton X-100 plus 5% normal horse serum in PBS) for 30 minutes. Then sections were incubated in antibody solution (0.1% Triton X-100 plus 5% normal horse serum in PBS) with rabbit anti-DsRed at 1:250 (Clontech USA 632496) at 4μc overnight. The sections were then washed three times with PBS, incubated with Alexa Fluor-conjugated secondary antibodies at 1:500 (Invitrogen, USA), stained with DAPI (Sigma, USA) and mounted on glass slides using Fluoromount-G (Sigma, USA).
Quantifications, statistics and reproducibility.
For strength of expression, fluorescence images were taken at a standardized magnification and exposure time and the average pixel intensity of the cells bodies of each cell expressing the viral reporter was recorded and reported as an average over all cells per enhancer. For quantification of colocalization, cells expressing the indicated reporter were counted using only the corresponding color channel, and then among these cells, the number of cells co-expressing the marker of interest were counted. A cell was considered to be positive for a given marker if the corresponding signal was above background fluorescence. The ratio of cells co-expressing both markers over the total number of cells expressing only the reporter was then calculated and reported as mean ± s.e.m. Quantifications were performed using a minimum of two independent biological replicates. Several sections from the same animal were used when indicated. Data collection and analysis were not performed blind to the conditions of the experiments, but experimenters from different research groups performed the quantification. No statistical methods were used to predetermine sample sizes, but our sample sizes are similar to those reported in previous publications (6). Two-tailed unpaired t-test were performed to estimate the statistical differences between the indicated test and control groups in figures 3c, 4b(iV) and extended data figure 3c. Equal variance between the two populations was not tested. The specific p-values, t and df for each test is indicated in the legends of the figures. The images presented in the figures 2a, 3a, 4a, 4b and the extended data figures 1b, 2d, 2f, 3a show representative data that were obtained from at least 3 independent injections from the indicated virus in the indicated species. The image for the marmoset injection on figure 4a is representative of the specificity and cellular density observed across 12 sections from the same animal. The specific number of cells, animals and conditions as well as the types of replicates are reported in the supplementary table 2 and a Supplementary Methods Checklist is available. At least two biological replicates per data point were included for all quantification presented in this study. In all cases where the number of biological replicates was not above 2, the replicates were highly consistent. For ethical and economic reasons, the data generated for systemic viral injection in a marmoset and for local injection in macaques come from a unique animal and was not repeated. The staining of PV IHC within human brain tissues was highly variable. As such, estimates of viral specificity were made within regions of cortex and subiculum where staining density was reflective of the known distribution and density of these cells. Sections where the PV-IHC was not reflective of the know distribution of these cells were excluded from the study.
Data availability statement and accession codes.
The data that support the findings of this study are available from the corresponding author upon reasonable request. The scATAC datasets presented in the study are available on GEO with the accession number GSE152449. All AAV plasmids and their corresponding sequences are available on Addgene (pAAV-S5E2-dTom-nlsdTom Addgene#135630; pAAV-S5E2-GFP-fGFP Addgene#135631; pAAV-S5E2-GCaMP6f Addgene#135632; pAAV-S5E2-C1V1-eYFP Addgene#135633; pAAV-S5E2-ChR2-mCherry Addgene#135634; pAAV-S5E2-Gq-P2A-dTomato-short Addgene#135635; pAAV-S5E1-dTom-nlsdTom Addgene#135637; pAAV-S5E3-dTom-nlsdTom Addgene#135638; pAAV-S5E4-dTom-nlsdTom Addgene#135639; pAAV-S5E5-dTom-nlsdTom Addgene#135640; pAAV-S5E6-dTom-nlsdTom Addgene#135641; pAAV-S5E7-dTom-nls-dTom Addgene#135642; pAAV-S5E8-dTom-nlsdTom Addgene#135643; 018_pAAV-S5E9-dTom-nls-dTom Addgene#135644; pAAV-S5E10-dTom-nlsdTom Addgene#135645; pAAV-E11-ChR2GFP2x Addgene#153434; pAAV-E14-ChR2GFP2x Addgene#153435; pAAV-E22-ChR2GFP2x Addgene#153436; pAAV-E29-ChR2GFP2x Addgene#153437).
Extended Data
Extended Data Fig. 1. Enhancer selection and top candidates.
(a) UMAP plot of 3500 neuronal nuclei collected from 4 Dlx6a-cre::Sun1-eGFP mice showing promoter accessibility of the indicated canonical interneuron markers. (b) Fluorescent images of sagittal sections from adult mice that were injected systemically with the indicated rAAV-E[x]-dTom and analyzed 3 weeks post-injection with IHC for the viral reporter. Scale bar for left panels represents 500um; Scale bar for right panels represents 100um. See method section for details on the reproducibility of the representative images presented in panel b.
Extended Data Fig. 2. E2 regulatory element to drive expression of reporters.
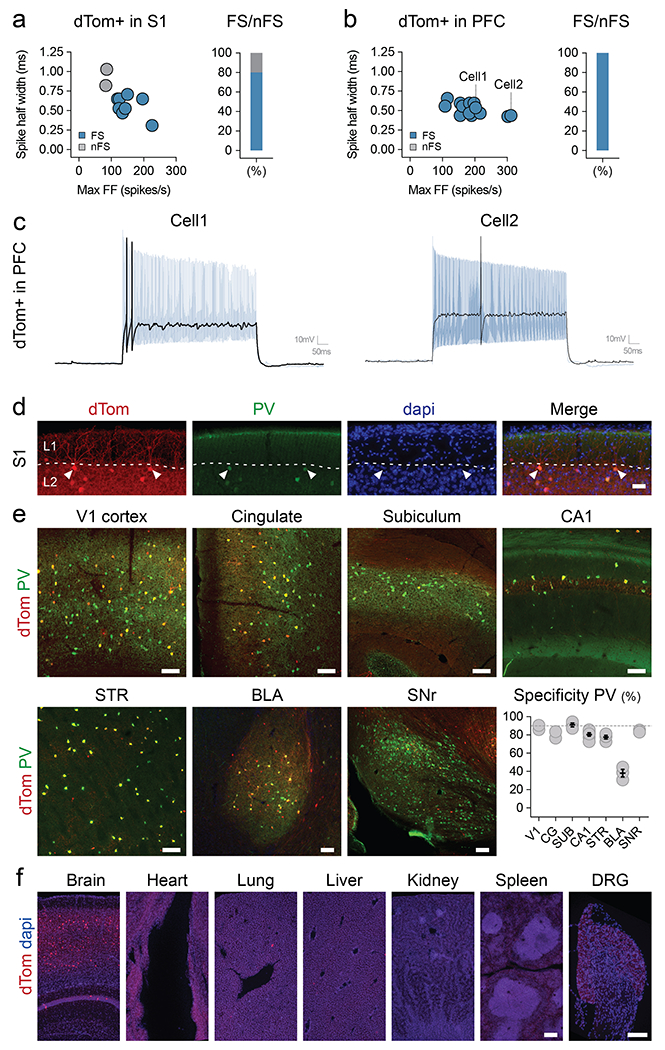
Adult mice were injected systemically with rAAV-E2-dTomato. (a,b) Slice recording of the intrinsic properties of virally labeled neurons in S1 cortex and PFC. The left panels show plots of recorded cells with the indicated intrinsic properties. The blue dots represent cells with stereotypical fast-spiking properties. The right panels indicate the proportion of fast spiking cells recorded. (c) Representative slice recording traces of cells indicated in (b). (d) Representative image of virally labeled chandelier cells. (e) Coronal and sagittal sections were analyzed with IHC for the viral reporter and PV, and the specificity to PV was reported across brain regions. (f) The native viral expression was analyzed from the indicated organs. Scale bars represent 50um (d), 100um (e) and 250um (f). On the graphs, dots represent individual measurements and the lines represent average +/− s.e.m. Values for specificity are listed in the supplementary table 2. See method section for details on the reproducibility of the representative images presented in panel d and f.
Extended Data Fig. 3. E2 regulatory element to drive expression of effectors.
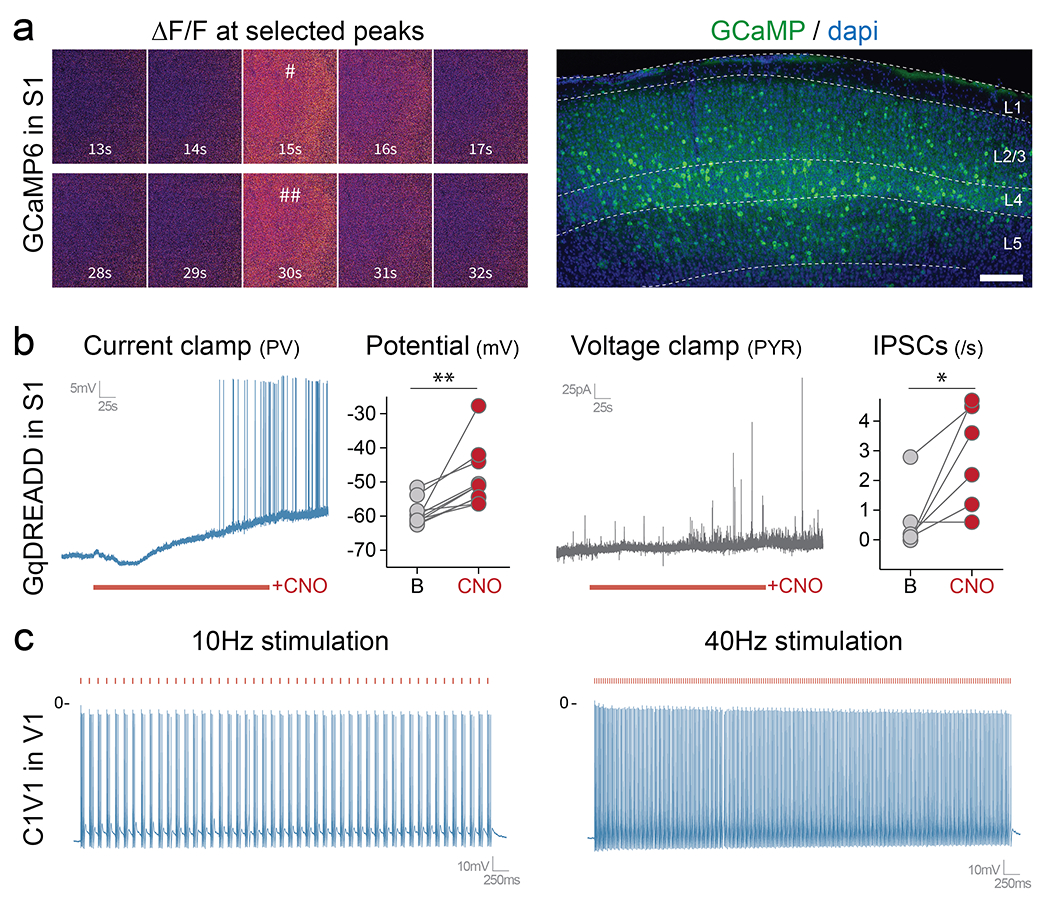
Mice were injected locally with the following constructs (a - P14 injection with rAAV-E2-GCaMP6f; b – rAAV-E2-C1V1-eYFP; c – rAAV-E2-GqDREADD). (a) Mice were analyzed 1-week post-injection. The left panel shows widefield images of two representative peaks shown by the pound signs in figure 3. The right panel shows a fluorescent image taken after GCaMP recordings. (b) Slice electrophysiology current clamp recordings were performed 1-week post-injection. Cells expressing the viral reporter were targeted with either 10Hz or 40Hz laser stimulation (550nm) while the voltage was recorded over 3 seconds. (c) Slice electrophysiology current clamp recordings were performed 1-week post-injection. The voltage was recorded before and after bath application of CNO. Scale bars represent 500um. The red bars represent laser stimulation. On the graphs, dots represent individual measurements. c right panel: p-value = 0.0039; t = 3.859; df = 9; c right panel: p-value = 0.0258; t = 3.135; df = 5); *, ** and *** correspond to a p-value < 0.01, <0,001 and < 0,0001 respectively. See method section for details on the reproducibility of the representative images presented in panel a.
Extended Data Fig. 4. E2 regulatory element works across species.
(a) Human brain tissue obtained from surgical resection that was exposed to rAAV-E2-dTomato and maintained in culture for 7-14 days. Left - Representative image of the dendrites of virally labeled cells filled with Biocytin during the recording session. Right - Slice recording of the intrinsic properties of virally labeled neurons. The quantifications show the indicated parameters. Scale bars represent 100um for the left images and 2um for the right images. (b) Adult mice were injected with the indicated modified rAAV-E2-dTomato construct and analyzed 3 weeks post-injection with IHC for the viral reporter and PV. The corresponding specificity is shown in the right panel. Scale bars represent 100um. On the graphs, dots represent individual measurements and the lines represent average +/− s.e.m. Values for specificity are listed in the supplementary table 2.
Extended Data Fig. 5. Enhancer screen applied to additional genes.
Adult macaques were injected locally in the prefrontal or S1 cortex with the indicated rAAV-E[x]-eGFP and analyzed 8 weeks post-injection with immunohistochemistry for the reporter and indicated markers. The right panels display the injection sites (above), and the boxed quantified regions (below). The corresponding sensitivity is shown in the bottom left. Scale bars represent 25um (lower panels) and 50um (upper panels). On the graphs, dots represent individual measurements and the lines represent average +/− s.e.m. Values for sensitivity are listed in the supplementary table 2.
Extended Data Fig. 6. Transcription factor binding site enrichment.
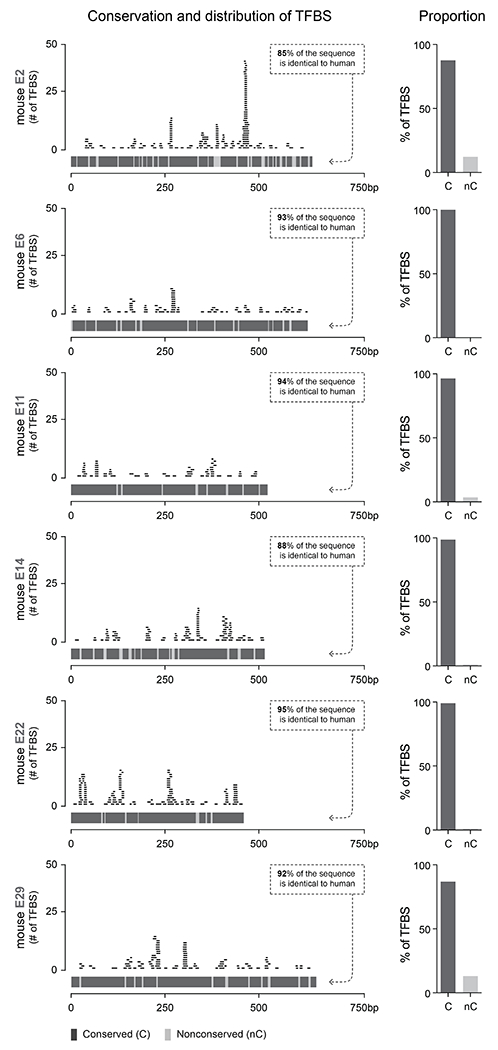
Each panel shows the indicated enhancer sequence displayed on a fixed region of 750bp, where each block of the lower part of the left graph shows conserved (dark gray) and non-conserved (light gray) regions of the enhancer. On the upper part of the left graph, each trace shows an individual transcription factor binding site mapped using CiiiDER (see methods). The blue traces represent TFBS found only in mice and the orange traces represent the TFBS found both in mice and humans. The two bar charts show the proportion of the TFBS found either on conserved or non-conserved regions of the enhancer, for all TFBS and for the subset of conserved TFBS, respectively.
Supplementary Material
ACKNOWLEDGEMENT
We thank Stephanie Gerard, Pierre Delvenne and Celine Parotte for their useful comments on the manuscript. JD is supported by NIH grants R01-MH111529 and UG3MH120096, as well as support from the Simons Foundation Award 566615 and a gift from the Friends-Of-FACES foundation. TPF is supported by fellowships from the Belgian American Educational Foundation and the George E. Hewitt Foundation for Medical Research, a NARSAD Young Investigator Grant from the Brain & Behavior Research Foundation and a Kavli Institute for Brain and Mind Innovative Research Grant. IRP of NINDS and a Eunice Kennedy Shriver NICHD Intramural Grant awarded to CJM. JSmith is supported by National Institute of Neurological Disorders and Stroke Grant No. K99 NS106528. GFishell is supported by NINDS grants NS081297, NS074972, NIMH grant MH071679 and NIH grant UG3MH120096, the Harvard’s Dean Initiative, as well as support from the Simons Foundation Award 566615. We are indebted to all of patients who have selflessly volunteered to participate in this study.
Footnotes
COMPETING INTEREST STATEMENT
The authors declare competing financial interests: The Broad Institute of MIT and Harvard has filed patent applications related to this work with Gord Fishell and Jordane Dimidschstein listed as inventors.
REFERENCES
- 1.Skene NG et al. Genetic identification of brain cell types underlying schizophrenia. Nat. Genet 50, 825–833 (2018). [DOI] [PMC free article] [PubMed] [Google Scholar]
- 2.Voineagu I et al. Transcriptomic analysis of autistic brain reveals convergent molecular pathology. Nature 474, 380–384 (2011). [DOI] [PMC free article] [PubMed] [Google Scholar]
- 3.Parikshak NN et al. Integrative functional genomic analyses implicate specific molecular pathways and circuits in autism. Cell 155, 1008–1021 (2013). [DOI] [PMC free article] [PubMed] [Google Scholar]
- 4.Camp JG, Platt R & Treutlein B Mapping human cell phenotypes to genotypes with single-cell genomics. Science 365, 1401–1405 (2019). [DOI] [PubMed] [Google Scholar]
- 5.Bedbrook CN, Deverman BE & Gradinaru V Viral Strategies for Targeting the Central and Peripheral Nervous Systems. Annu. Rev. Neurosci 41, 323–348 (2018). [DOI] [PubMed] [Google Scholar]
- 6.Dimidschstein J et al. A viral strategy for targeting and manipulating interneurons across vertebrate species. Nat. Neurosci 12, 1743–1749 (2016). [DOI] [PMC free article] [PubMed] [Google Scholar]
- 7.Hrvatin S et al. A scalable platform for the development of cell-type-specific viral drivers. Elife 8, e48089 (2019). [DOI] [PMC free article] [PubMed] [Google Scholar]
- 8.Deverman BE, Ravina BM, Bankiewicz KS, Paul SM & Sah DWY Gene therapy for neurological disorders: progress and prospects. Nat. Rev. Drug. Discov 9, 641–659 (2018). [DOI] [PubMed] [Google Scholar]
- 9.de Leeuw CN et al. rAAV-compatible Mini-Promoters for restricted expression in the brain and eye. Mol. Brain 9, 52 (2016). [DOI] [PMC free article] [PubMed] [Google Scholar]
- 10.Jüttner J, et al. Targeting neuronal and glial cell types with synthetic promoter AAVs in mice, non-human primates and humans. Nat. Neurosci 22, 1345–1356 (2019). [DOI] [PubMed] [Google Scholar]
- 11.Blankvoort S, Witter MP, Noonan J, Cotney J, Kentros C Marked Diversity of Unique Cortical Enhancers Enables Neuron-Specific Tools by Enhancer-Driven Gene Expression. Curr. Biol 13, 2103–2114 (2018). [DOI] [PMC free article] [PubMed] [Google Scholar]
- 12.Mehta P et al. Functional Access to Neuron Subclasses in Rodent and Primate Forebrain. Cell. Rep 26, 2818–2832 (2019). [DOI] [PMC free article] [PubMed] [Google Scholar]
- 13.Griffin A et al. Preclinical Animal Models for Dravet Syndrome: Seizure Phenotypes, Comorbidities and Drug Screening. Front. Pharmacol 9, 573 (2018). [DOI] [PMC free article] [PubMed] [Google Scholar]
- 14.Ogiwara I et al. Nav1.1 localizes to axons of parvalbumin-positive inhibitory interneurons: a circuit basis for epileptic seizures in mice carrying an Scn1a gene mutation. J. Neurosci 27, 5903–14 (2007). [DOI] [PMC free article] [PubMed] [Google Scholar]
- 15.Favero M, Sotuyo NP, Lopez E, Kearney JA & Goldberg EM A Transient Developmental Window of Fast-Spiking Interneuron Dysfunction in a Mouse Model of Dravet Syndrome. J. Neurosci 38, 7912–7927 (2018). [DOI] [PMC free article] [PubMed] [Google Scholar]
- 16.Goff KM & Goldberg EM Vasoactive intestinal peptide-expressing interneurons are impaired in a mouse model of Dravet syndrome. Elife 8, e46846 (2019). [DOI] [PMC free article] [PubMed] [Google Scholar]
- 17.Cheah CS et al. Specific deletion of Nav1.1 sodium channels in inhibitory interneurons causes seizures and premature death in a mouse model of Dravet Syndrome. PNAS 109, 14646–51 (2012). [DOI] [PMC free article] [PubMed] [Google Scholar]
- 18.Dutton SB et al. Preferential inactivation of Scn1a in parvalbumin interneurons increases seizure susceptibility. Neurobiol. Dis 49, 211–20 (2013). [DOI] [PMC free article] [PubMed] [Google Scholar]
- 19.Yu FH et al. Reduced sodium current in GABAergic interneurons in a mouse model of severe myoclonic epilepsy in infancy. Nat. Neurosci 9, 1142–9 (2006). [DOI] [PubMed] [Google Scholar]
- 20.Fulco CP et al. Systematic mapping of functional enhancer-promoter connections with CRISPR interference. Science 354, 769–773 (2016). [DOI] [PMC free article] [PubMed] [Google Scholar]
- 21.Mo A et al. Epigenomic Signatures of Neuronal Diversity in the Mammalian Brain. Neuron 86, 1369–1384 (2015). [DOI] [PMC free article] [PubMed] [Google Scholar]
- 22.Luo C et al. Robust single-cell DNA methylome profiling with snmC-seq2. Nat. Commun 9, 3824 (2018). [DOI] [PMC free article] [PubMed] [Google Scholar]
- 23.Buenrostro JD et al. Single-cell chromatin accessibility reveals principles of regulatory variation. Nature 523, 486–90 (2015). [DOI] [PMC free article] [PubMed] [Google Scholar]
- 24.Cusanovich DA et al. Epigenetics. Multiplex single-cell profiling of chromatin accessibility by combinatorial cellular indexing. Science 348, 910–4 (2015). [DOI] [PMC free article] [PubMed] [Google Scholar]
- 25.Bejerano G et al. Ultraconserved elements in the human genome. Science 304, 1321–5 (2004). [DOI] [PubMed] [Google Scholar]
- 26.Dimitrieva S & Bucher P UCNEbase--a database of ultraconserved non-coding elements and genomic regulatory blocks. Nucleic Acids Res. (Database issue) 101–9 (2013). [DOI] [PMC free article] [PubMed] [Google Scholar]
- 27.Andersson R et al. An atlas of active enhancers across human cell types and tissues. Nature 507, 455–461 (2014). [DOI] [PMC free article] [PubMed] [Google Scholar]
- 28.Dousse A, Junier T & Zdobnov EM CEGA--a catalog of conserved elements from genomic alignments. Nucleic Acids Res. 44, 96–100 (2016). [DOI] [PMC free article] [PubMed] [Google Scholar]
- 29.Dickel DE et al. Ultraconserved Enhancers Are Required for Normal Development. Cell 172, 491–499 (2018). [DOI] [PMC free article] [PubMed] [Google Scholar]
- 30.Chan KY et al. Engineered AAVs for efficient noninvasive gene delivery to the central and peripheral nervous systems. Nat. Neurosci 20, 1172–1179 (2017). [DOI] [PMC free article] [PubMed] [Google Scholar]
- 31.Batista-Brito R et al. The Cell-Intrinsic Requirement of Sox6 for Cortical Interneuron Development. Neuron 63, 466–481 (2009). [DOI] [PMC free article] [PubMed] [Google Scholar]
- 32.Rossignol E, Kruglikov I, van den Maagdenberg AM, Rudy B & Fishell G CaV2.1 ablation in cortical interneurons selectively impairs fast-spiking basket cells and causes generalized seizures. Ann. Neurol 74, 209–222 (2013). [DOI] [PMC free article] [PubMed] [Google Scholar]
- 33.Gandal MJ, Nesbitt AM, McCurdy RM & Alter MD Measuring the Maturity of the Fast-Spiking Interneuron Transcriptional Program in Autism, Schizophrenia, and Bipolar Disorder. PLoS one 7, e41215, (2012). [DOI] [PMC free article] [PubMed] [Google Scholar]
- 34.Barnes SA et al. Disruption of mGluR5 in parvalbumin-positive interneurons induces core features of neurodevelopmental disorders. Mol. Psychiatr 20, 1161–1172 (2015). [DOI] [PMC free article] [PubMed] [Google Scholar]
- 35.Tremblay R, Lee S & Rudy B GABAergic Interneurons in the Neocortex: From Cellular Properties to Circuits. Neuron 91, 260–292 (2016). [DOI] [PMC free article] [PubMed] [Google Scholar]
- 36.Daigle TL A Suite of Transgenic Driver and Reporter Mouse Lines with Enhanced Brain-Cell-Type Targeting and Functionality. Cell 174, 465–480 (2018). [DOI] [PMC free article] [PubMed] [Google Scholar]
- 37.Chen TW et al. Ultrasensitive fluorescent proteins for imaging neuronal activity. Nature 499, 295–300 (2013). [DOI] [PMC free article] [PubMed] [Google Scholar]
- 38.Magnus CJ et al. Ultrapotent chemogenetics for research and potential clinical applications. Science 364, eaav5282 (2019). [DOI] [PMC free article] [PubMed] [Google Scholar]
- 39.Armbruster BN, Li X, Pausch MH, Herlitze S & Roth BL Evolving the lock to fit the key to create a family of G protein-coupled receptors potently activated by an inert ligand. PNAS 104, 5163–5168 (2007). [DOI] [PMC free article] [PubMed] [Google Scholar]
- 40.Yizhar O et al. Neocortical excitation/inhibition balance in information processing and social dysfunction. Nature 477, 171–8 (2011). [DOI] [PMC free article] [PubMed] [Google Scholar]
- 41.Eugène E et al. An organotypic brain slice preparation from adult patients with temporal lobe epilepsy. J. Neurosci. Meth 235, 234–44 (2014). [DOI] [PMC free article] [PubMed] [Google Scholar]
- 42.Gearing LJ et al. CiiiDER: A tool for predicting and analyzing transcription factor binding sites. PLoS one 14, e0215495 (2019). [DOI] [PMC free article] [PubMed] [Google Scholar]
- 43.Fornes O et al. JASPAR 2020: update of the open-access database of transcription factor binding profiles. Nucleic Acids Res. 48, D87–D92 (2020). [DOI] [PMC free article] [PubMed] [Google Scholar]
- 44.Hodge RD et al. Conserved cell types with divergent features in human versus mouse cortex. Nature 573, 61–68 (2019). [DOI] [PMC free article] [PubMed] [Google Scholar]
- 45.Boldog E et al. Transcriptomic and morphophysiological evidence for a specialized human cortical GABAergic cell type. Nat. Neurosci 21, 1185–1195 (2018). [DOI] [PMC free article] [PubMed] [Google Scholar]
- 46.Feenstra B et al. Common variants associated with general and MMR vaccine-related febrile seizures. Nat. Genet 46, 1274–82 (2014). [DOI] [PMC free article] [PubMed] [Google Scholar]
- 47.International League Against Epilepsy Consortium on Complex Epilepsies. Genetic determinants of common epilepsies: a meta-analysis of genome-wide association studies. Lancet Neurol. 13, 893–903 (2014). [DOI] [PMC free article] [PubMed] [Google Scholar]
- 48.International League Against Epilepsy Consortium on Complex Epilepsies. Genome-wide megaanalysis identifies 16 loci and highlights diverse biological mechanisms in the common epilepsies. Nat. Commun 9, 5269 (2018). [DOI] [PMC free article] [PubMed] [Google Scholar]
- 49.GTEx Consortium. The Genotype-Tissue Expression (GTEx) pilot analysis: Multitissue gene regulation in humans. Science 348, 648–660 (2015). [DOI] [PMC free article] [PubMed] [Google Scholar]
- 50.Walker MC & Kullmann DM Optogenetic and chemogenetic therapies for epilepsy. Neuropharmacology 107751 (2019). [DOI] [PubMed] [Google Scholar]
Associated Data
This section collects any data citations, data availability statements, or supplementary materials included in this article.
Supplementary Materials
Data Availability Statement
The data that support the findings of this study are available from the corresponding author upon reasonable request. The scATAC datasets presented in the study are available on GEO with the accession number GSE152449. All AAV plasmids and their corresponding sequences are available on Addgene (pAAV-S5E2-dTom-nlsdTom Addgene#135630; pAAV-S5E2-GFP-fGFP Addgene#135631; pAAV-S5E2-GCaMP6f Addgene#135632; pAAV-S5E2-C1V1-eYFP Addgene#135633; pAAV-S5E2-ChR2-mCherry Addgene#135634; pAAV-S5E2-Gq-P2A-dTomato-short Addgene#135635; pAAV-S5E1-dTom-nlsdTom Addgene#135637; pAAV-S5E3-dTom-nlsdTom Addgene#135638; pAAV-S5E4-dTom-nlsdTom Addgene#135639; pAAV-S5E5-dTom-nlsdTom Addgene#135640; pAAV-S5E6-dTom-nlsdTom Addgene#135641; pAAV-S5E7-dTom-nls-dTom Addgene#135642; pAAV-S5E8-dTom-nlsdTom Addgene#135643; 018_pAAV-S5E9-dTom-nls-dTom Addgene#135644; pAAV-S5E10-dTom-nlsdTom Addgene#135645; pAAV-E11-ChR2GFP2x Addgene#153434; pAAV-E14-ChR2GFP2x Addgene#153435; pAAV-E22-ChR2GFP2x Addgene#153436; pAAV-E29-ChR2GFP2x Addgene#153437).