Abstract
In addition to fatty acids, glucose and lactate are important myocardial substrates under physiological and stress conditions. They are metabolized to pyruvate that enters mitochondria via the mitochondrial pyruvate carrier (MPC) for citric acid cycle (CAC) metabolism. Here, we show that MPC-mediated mitochondrial pyruvate utilization is essential for the partitioning of glucose-derived cytosolic metabolic intermediates, which modulate myocardial stress adaptation. Mice with cardiomyocyte-restricted deletion of subunit 1 of MPC (cMPC1−/−) developed age-dependent pathologic cardiac hypertrophy, transitioning to a dilated cardiomyopathy and premature death. Hypertrophied hearts accumulated lactate, pyruvate, and glycogen and displayed increased protein O-GlcNacylation (O-GlcNAc), which was prevented by increasing availability of non-glucose substrates in vivo by ketogenic (KD) or high-fat (HFD) diets, which reversed the structural, metabolic and functional remodeling of non-stressed cMPC1−/− hearts. While concurrent short-term KD did not rescue cMPC1−/− hearts from rapid decompensation and early mortality following pressure overload, 3-week of KD prior to TAC was sufficient to rescue this phenotype. Together, our results highlight the centrality of pyruvate metabolism to myocardial metabolism and function.
Introduction
Altered cardiac metabolism may contribute to the complex pathophysiology and inexorable progression of heart failure (HF)1. Metabolic flexibility enables the healthy heart to effectively utilize multiple substrates to sustain ATP generation based on substrate availability and hemodynamic conditions. Fatty acid oxidation (FAO) contributes about 70% of baseline myocardial energy requirements2 with important contribution from glucose and lactate, which are crucial substrates for anaplerosis3–5. The heart also metabolizes amino acids and ketones, the importance of which might increase under certain pathological conditions such as heart failure4,6–11. In response to stimuli that induce physiologic or pathologic cardiac hypertrophy such as exercise training or pressure overload respectively, glucose and lactate assume increased importance as an energy source12,13. The majority of glucose enters glycolysis following conversion by hexokinase to glucose 6-phosphate (G6P). A smaller fraction is converted by aldose reductase to sorbitol in the polyol pathway. Additional metabolic fates of G6P include the pentose phosphate pathway (PPP), the hexosamine biosynthesis pathway (HBP) and glycogen synthesis14,15. Pathological cardiac remodeling is associated with increased glycolysis, that might not be matched by increased glucose oxidation16–18. This metabolic imbalance has been hypothesized to contribute to impaired myocardial contractility in pathologic cardiac hypertrophy and heart failure17.
Pyruvate is the key metabolite connecting glycolysis and glucose oxidation. After entering the mitochondria, pyruvate undergoes decarboxylation (PDC: oxidation) to acetyl-CoA by the pyruvate dehydrogenase complex (PDH), which then enters the CAC. Pyruvate is also carboxylated, supporting CAC anaplerosis, by pyruvate carboxylation (PC) to oxaloacetate (OAA) via carboxylation by pyruvate carboxylase or by cytosolic malic enzyme 1 (ME1), which in the heart, is more abundant than pyruvate carboxylase5,19–22. Decarboxylation is the dominant fate of pyruvate in mitochondria of healthy myocardium23–25 and anaplerosis from pyruvate carboxylation represents 10% or less of total CAC flux21,22.
The discovery of the high-affinity mitochondrial pyruvate carrier (MPC) complex, has advanced the understanding of mitochondrial pyruvate partitioning and its metabolic consequences26–28. The MPC is a mitochondrial inner membrane protein complex composed of two subunits, MPC1 and MPC2. Both are essential for maintaining normal function of MPC and loss of either subunit impairs mitochondrial pyruvate transport and pyruvate-supported oxygen consumption26,28. Embryonic deletion of MPC is incompatible with embryonic survival29. MPC deficiency in mouse liver reduced pyruvate-driven gluconeogenesis and these animals resisted high fat diet-induced hyperglycemia, insulin resistance and hepatic fibrosis30–32. Disrupting MPC in skeletal muscle increased muscle glucose uptake and whole-body energy expenditure33. The contribution of mitochondrial pyruvate uptake and metabolism in normal and failing hearts is incompletely understood, although induction of MPC expression in peri-infarct zones from patients with ischemic cardiomyopathy has been proposed to represent an adaptive response that promotes cardioprotection34.
The present study undertook detailed characterization of a mice with cardiomyocyte-selective deletion of MPC1 under stressed and non-stressed conditions (cMPC1−/−). Initial mitochondrial adaptations included MPC-independent pathways for acetyl-CoA generation from pyruvate via PDC but not for anaplerosis. Although associated with increased left ventricular (LV) contractility, increased relative contribution to CAC from pyruvate and preserved CAC intermediates, FAO was increased and acyl-carnitines, glycogen, pyruvate, lactate and O-linked N-Acetylglucosamine (O-GlcNAc) modifications were accumulated. These initial adaptations paralleled pathological LV hypertrophy and rapid progression to heart failure with pressure overload. They also developed an age-dependent dilated cardiomyopathy in concert with declining acetyl CoA, citrate and ATP. Increasing the dietary supply of alternative metabolic substrates such as ketones, fatty acids or triglycerides prevented the accumulation of lactate and pyruvate and reversed pathological remodeling. These data indicate an essential role for MPC-derived pyruvate for sustaining CAC function (oxidation and anaplerosis) in response to hemodynamic stress and reveal potential cardiac toxicity of accumulated glycolytic intermediates.
Results
Generation of cMPC1−/− mice
MPC1 cardiomyocyte-specific knockout mice (cMPC1−/− mice) were generated by crossing MPC1 floxed mice with mice expressing Cre recombinase controlled by the alpha myosin heavy chain (αMHC) promoter30,35. cMPC1−/− mice were viable at birth and developed normally. MPC1 RNA was decreased in whole heart homogenates, whereas MPC2 mRNA remained unaltered (Fig 1a). Western blot analysis in isolated cardiomyocytes revealed no detectable MPC1 and MPC2 protein in cMPC1−/− (Fig 1b,c). Residual MPC protein in whole heart homogenates likely reflect MPC expression in non-cardiomyocytes (Extended Data Fig 1a,b). Pyruvate uptake in cMPC1−/− mitochondria was reduced by 75% relative to wildtype (WT) controls (Fig 1d). Basal and maximal pyruvate-supported mitochondrial oxygen consumption was also reduced by 32% and 43 %, respectively (Fig 1e). Basal or maximal glutamate or palmitoyl-carnitine-supported respiration rates were not impaired (Fig 1f, Extended Data Fig 1c). Mitochondrial ultrastructure, electron transport chain subunit content and DNA copy number were unchanged in hearts of 4 or 8-week-old cMPC1−/− mice (Extended Data Fig 1d–g).
Figure 1. Generation and phenotype of cMPC1−/− mice.
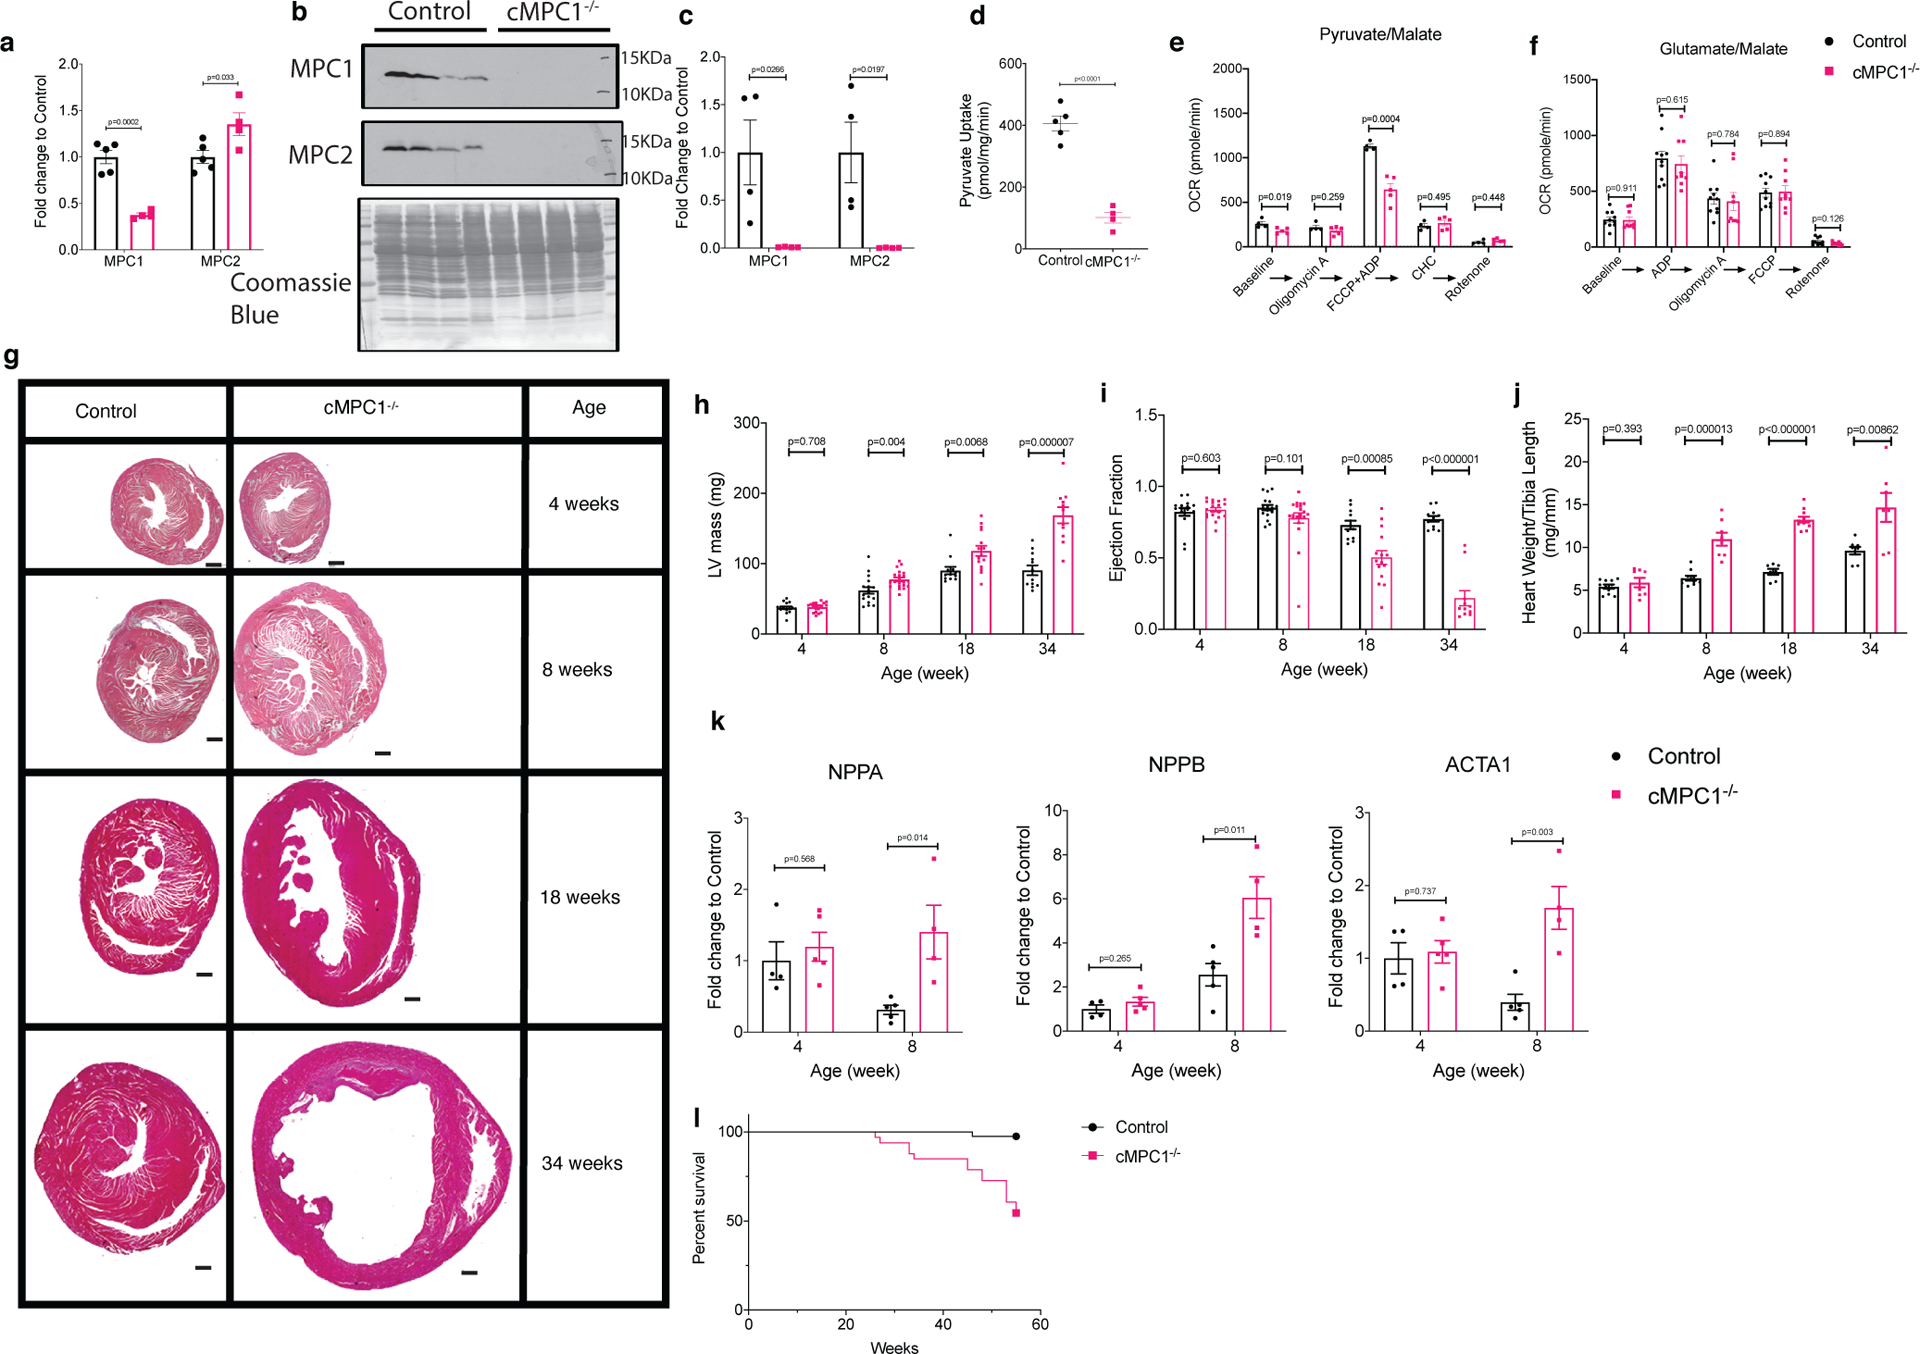
(a-c) Loss of MPC1 was confirmed by qPCR (a) in heart lysates of 4-week-old cMPC1−/− (Sample size (n): Control, 5; cMPC1−/−, 4) and Western blot (b-c) in isolated cardiomyocytes from 8-week-old cMPC1−/− mice (n: Control, 4; cMPC1−/−, 5). (d) Mitochondrial pyruvate uptake was performed in mitochondria isolated from 8-week-old cMPC1−/− hearts (n: Control, 5; cMPC1−/−, 4). (e-f) Oxygen consumption rates (OCR) were determined by Seahorse respirometry in isolated mitochondria from 8-week-old cMPC1−/− hearts in the presence of pyruvate (1 mmol/L)/malate (0.25 mmol/L) (e) (n: Control, 4; cMPC1−/−, 4) and glutamate (1mmol/L)/malate (0.25 mmol/L) (f) (n: Control, 10; cMPC1−/−, 9). Concentration of the MPC inhibitor, CHC was 1mM. See methods for concentrations of other inhibitors. (g) Midventricular cross sections of cMPC1 and control hearts at the ages as shown. Scale bar, 500 μm. Images are representative of n= 3 per group. (h-i) LV Mass and Ejection Fraction by echocardiography (j) Heart weight to tibia length ratio (HW/TL) at the ages as shown. Sample size (n) is represented as Control/cMPC1−/−. For h-i, 4-week-old and 8-week-old: 17/21; 18-week-old: 12/15; 34-week-old: 12/12. For j, 4-week-old: 11/8; 8-week-old: 10/8; 18-week-old: 7/11; 34-week-old: 8/7.) (k) mRNA levels of hypertrophic genes, ANP (NPPA), BNP (NPPB) and ACTA1 were determined by qPCR in 4- and 8-week-old cMPC1−/− hearts. For k, 4-week-old: 4/5; 8-week-old: 5/4. (l) Survival curves of control and cMPC1−/− mice over a 1-year period (Control, 34; cMPC1−/−, 30). Data are presented as mean ± SEM and analyzed by two-tailed unpaired Student’s t-test.
cMPC1−/− mice develop age-dependent cardiac hypertrophy and cardiac dysfunction.
No significant difference was observed in cardiac structure, ejection fraction, LV chamber mass or heart weight normalized to tibia length in cMPC1−/− at the age of 4 weeks (Fig 1g–j). By 8-weeks of age, cMPC1−/− mice developed concentric LV hypertrophy (LVH) with preserved ejection fraction (Fig 1g–j). LV function progressively declined thereafter, as evidenced by LV dilatation and reduced ejection fraction that was clearly evident in 18-week-old mice and inexorably progressing until death (Fig 1g–j, 1l). Consistent with pathologic LVH, expression of the hypertrophic markers, ANP, BNP and acta1 (Fig 1k), were dramatically induced at the age of 8 weeks.
Metabolic characterization of cMPC1−/− hearts.
To further explore metabolic changes that could inform mechanisms underlying cardiac dysfunction in the absence of MPC, a detailed characterization of myocardial substrate metabolism was undertaken in hearts of 8-week-old cMPC1−/− mice at the stage of compensated pathological LVH.
Substrate Oxidation in Isolated Working Hearts:
Glucose oxidation was reduced by 50% but glycolysis was not altered in cMPC1−/− hearts (Fig 2a,b). FAO was increased by ~ 55% in cMPC1−/− hearts, while MVO2 was decreased by ~ 28% (Fig 2c,d). Cardiac power was increased by ~ 2.4-fold and cardiac efficiency was significantly increased by 8% in cMPC1−/− hearts (Fig 2e,f).
Figure 2. Substrate Metabolism and Partitioning in cMPC1−/− hearts.
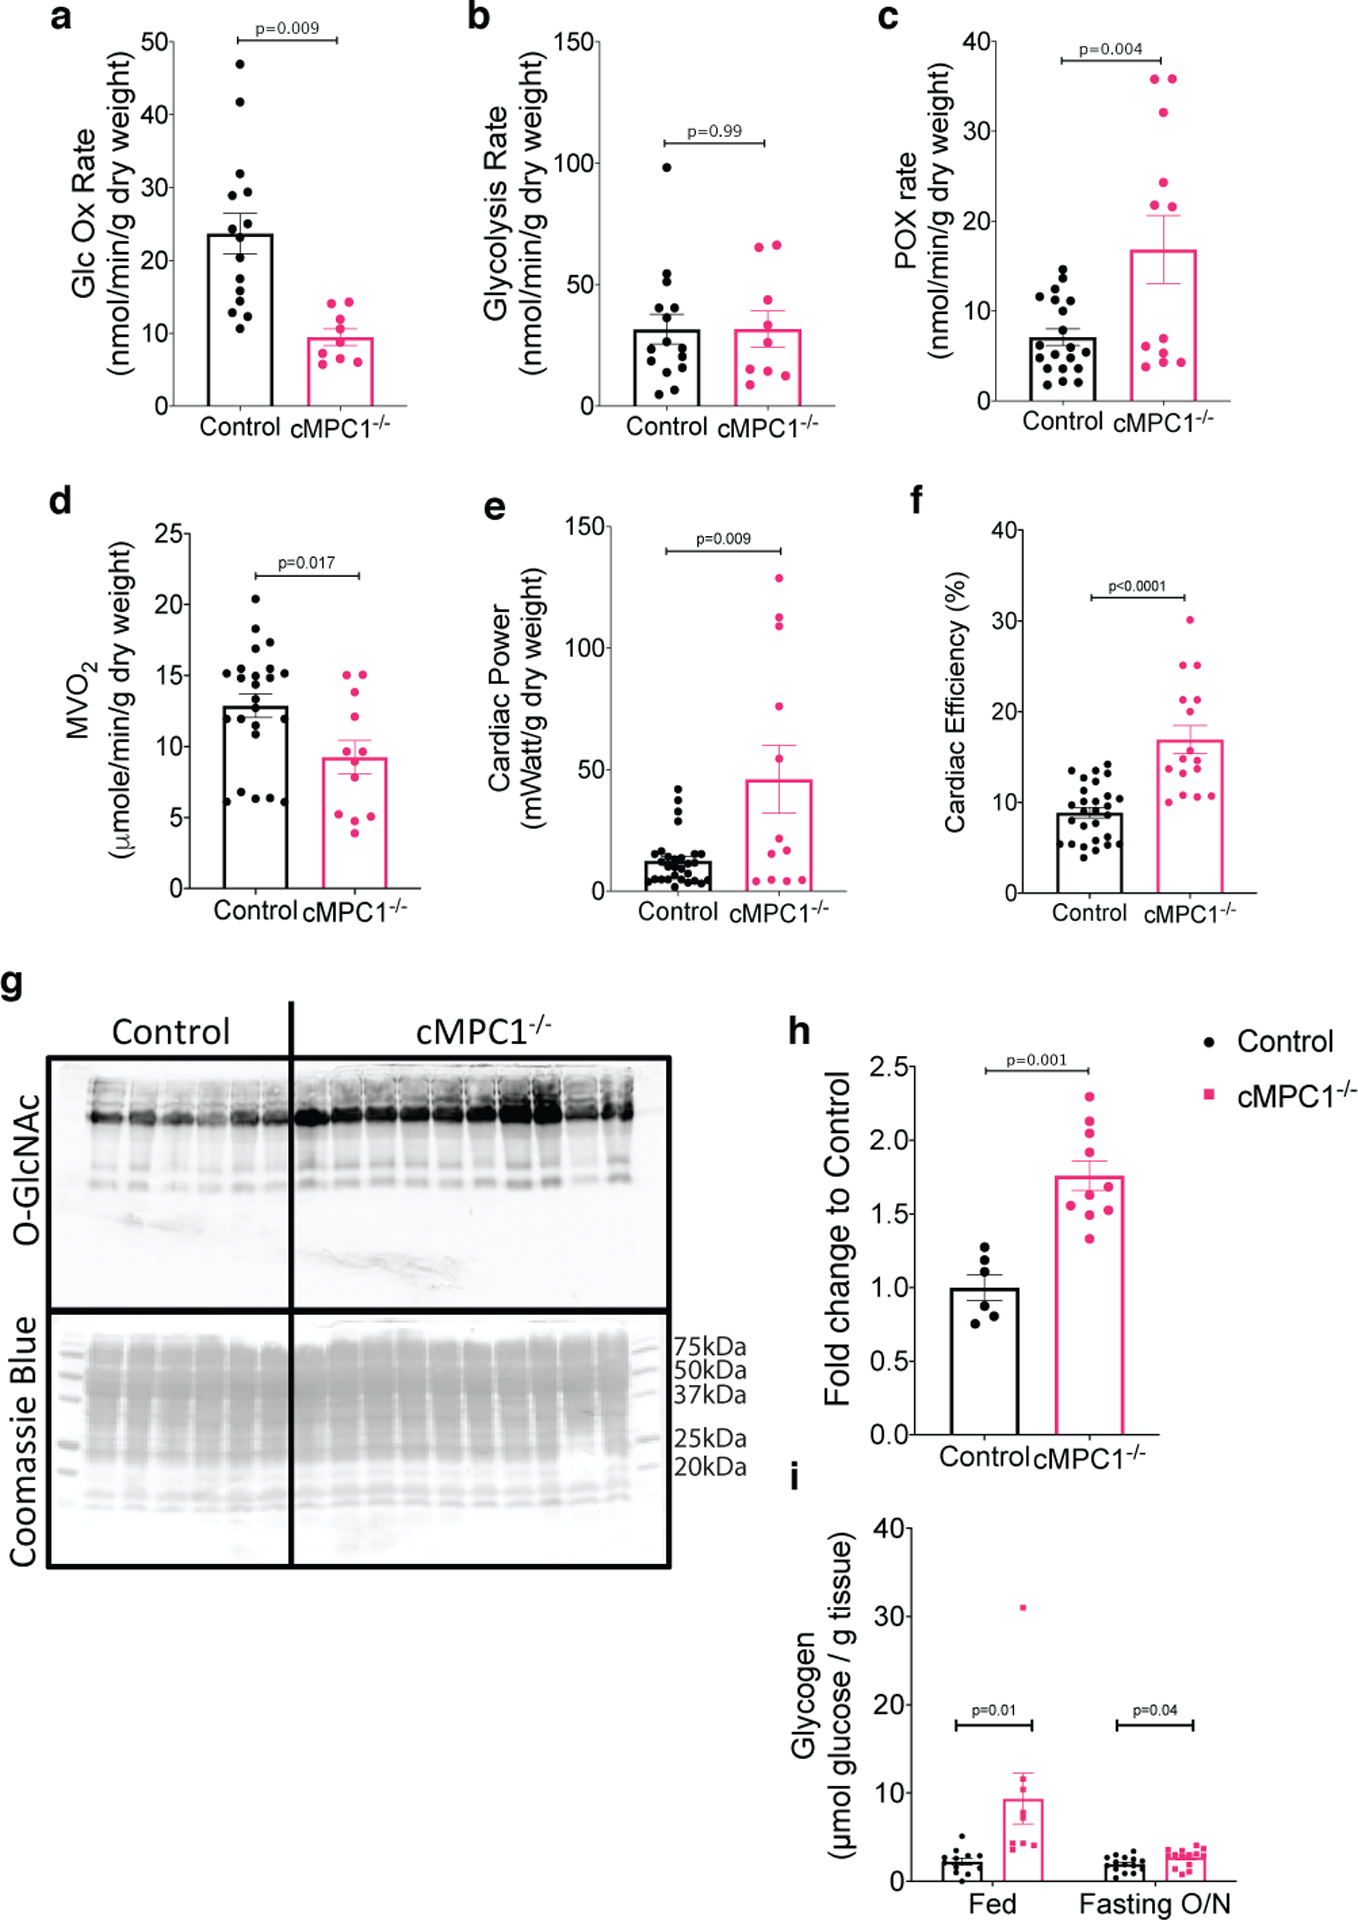
(a-f) Hearts from 8-week-old control and cMPC1−/− mice were perfused with either 14C-/3H-glucose (5mM) or 3H-palmitate (0.4mM) with unlabeled pyruvate (0.5mM) and lactate (1mM), in the working heart mode to determine glucose oxidation (a), glycolysis (b) and fatty acid oxidation (c) respectively. MVO2 (d), cardiac power (e) and cardiac efficiency (f) were also determined in the 3H-palmitate perfused hearts shown in panel c. Three replicates were obtained in each heart for panels a-f (Control, 7; cMPC1−/−, 4). (g-h) HBP flux was estimated by quantifying O-linked N-Acetylglucosamine modifications by western blot in hearts from 8-week-old control and cMPC1−/− mice (Control, 6; cMPC1−/−, 10). (i) Glycogen content was measured in the hearts from 8-week-old control and cMPC1−/− mice under fed and overnight fasting conditions (Fed: Control, 12; cMPC1−/−, 9. Fasting: Control, 15; cMPC1−/−, 14). Data are presented as mean ± SEM and analyzed by two-tailed unpaired Student’s t-test.
Fate of Glycolytic Intermediates:
Although glycolytic flux in isolated working hearts was not increased, glycolytic intermediates determined by gas chromatography-mass spectrometry (GC-MS) analysis were increased in cMPC1−/− hearts collected by freeze clamping in situ. Glucose-6-phosphate, glucose-1-phosphate and pyruvate were increased by ~ 2.6-fold, ~ 1.8-fold and ~ 1.8-fold respectively (Extended Data Fig 2a). Protein levels of glycolysis enzymes (hexokinase I and GAPDH) isolated from cardiomyocytes were increased by ~ 1.4-fold and ~ 1.3-fold respectively in cMPC1−/− hearts (Extended Data Fig 2b). The intermediate of the PPP, sedoheptulose-7-phosphate (S7P), was also increased by ~ 2.1-fold (Extended Data Fig 2a). O-GlcNAc protein modifications - a proxy of flux through the HBP, and glycogen content were determined in hearts from 8-week-old control and cMPC1−/− mice. cMPC1−/− hearts exhibited a 76% increase in total O-GlcNAc protein modification (Fig 2g,h) and a 70% increase in levels of the enzyme O-GlcNAc transferase (Extended Data Fig 2b). Under both fed and overnight fasting (18 hours fasting) conditions, glycogen storage was increased by ~ 4.2-fold and ~ 1.4-fold in cMPC1−/− hearts, respectively (Fig 2i). In addition, total glycogen synthase protein and its phosphorylation level were increased in cMPC1−/− hearts (Extended Data Fig 2b). These data indicate that glucose is shunted into alternative glucose metabolic pathways such as the PPP, the HBP and glycogen in cMPC1−/− hearts.
Metabolomics Analysis in Perfused cMPC1−/− hearts:
To evaluate metabolite partitioning in cMPC1−/− hearts in greater detail, an independent cohort of hearts from 8-week-old control and cMPC1−/− mice were perfused with unlabeled substrates in the Langendorff mode and subjected to metabolomics analysis using GC-MS. Tissue levels of pyruvate, alanine and serine were increased in cMPC1−/− hearts, but lactate and ketone bodies (β-hydroxybutyrate: β-HB; Acetoacetate: AcAc) concentrations were unchanged (Fig 3a–f). The increase in pyruvate is consistent with restricted mitochondrial pyruvate entry and increased alanine suggests increased conversion of accumulated pyruvate to alanine by alanine transaminase (ALT). Tissue concentrations of the CAC intermediates citrate, α-ketoglutarate (α-KG), succinate, fumarate and malate were not significantly changed in cMPC1−/− hearts (Fig 3g). The ratio of lactate/pyruvate and β-HB/AcAc reflects the ratio of NADH/NAD+ in the cytosol and mitochondria respectively23,36. In cMPC1−/− hearts, the lactate/pyruvate ratio was reduced but the β-HB/AcAc was unchanged (Fig 3h,i), which suggests the redox state was maintained in mitochondria, but not in the cytosol. The lower lactate/pyruvate ratio reflects increased NAD+ relative to NADH, which suggests the cytoplasmic redox state became more oxidized in cMPC1−/− hearts.
Figure 3. Concentrations of metabolic intermediates in perfused cMPC1−/− hearts.
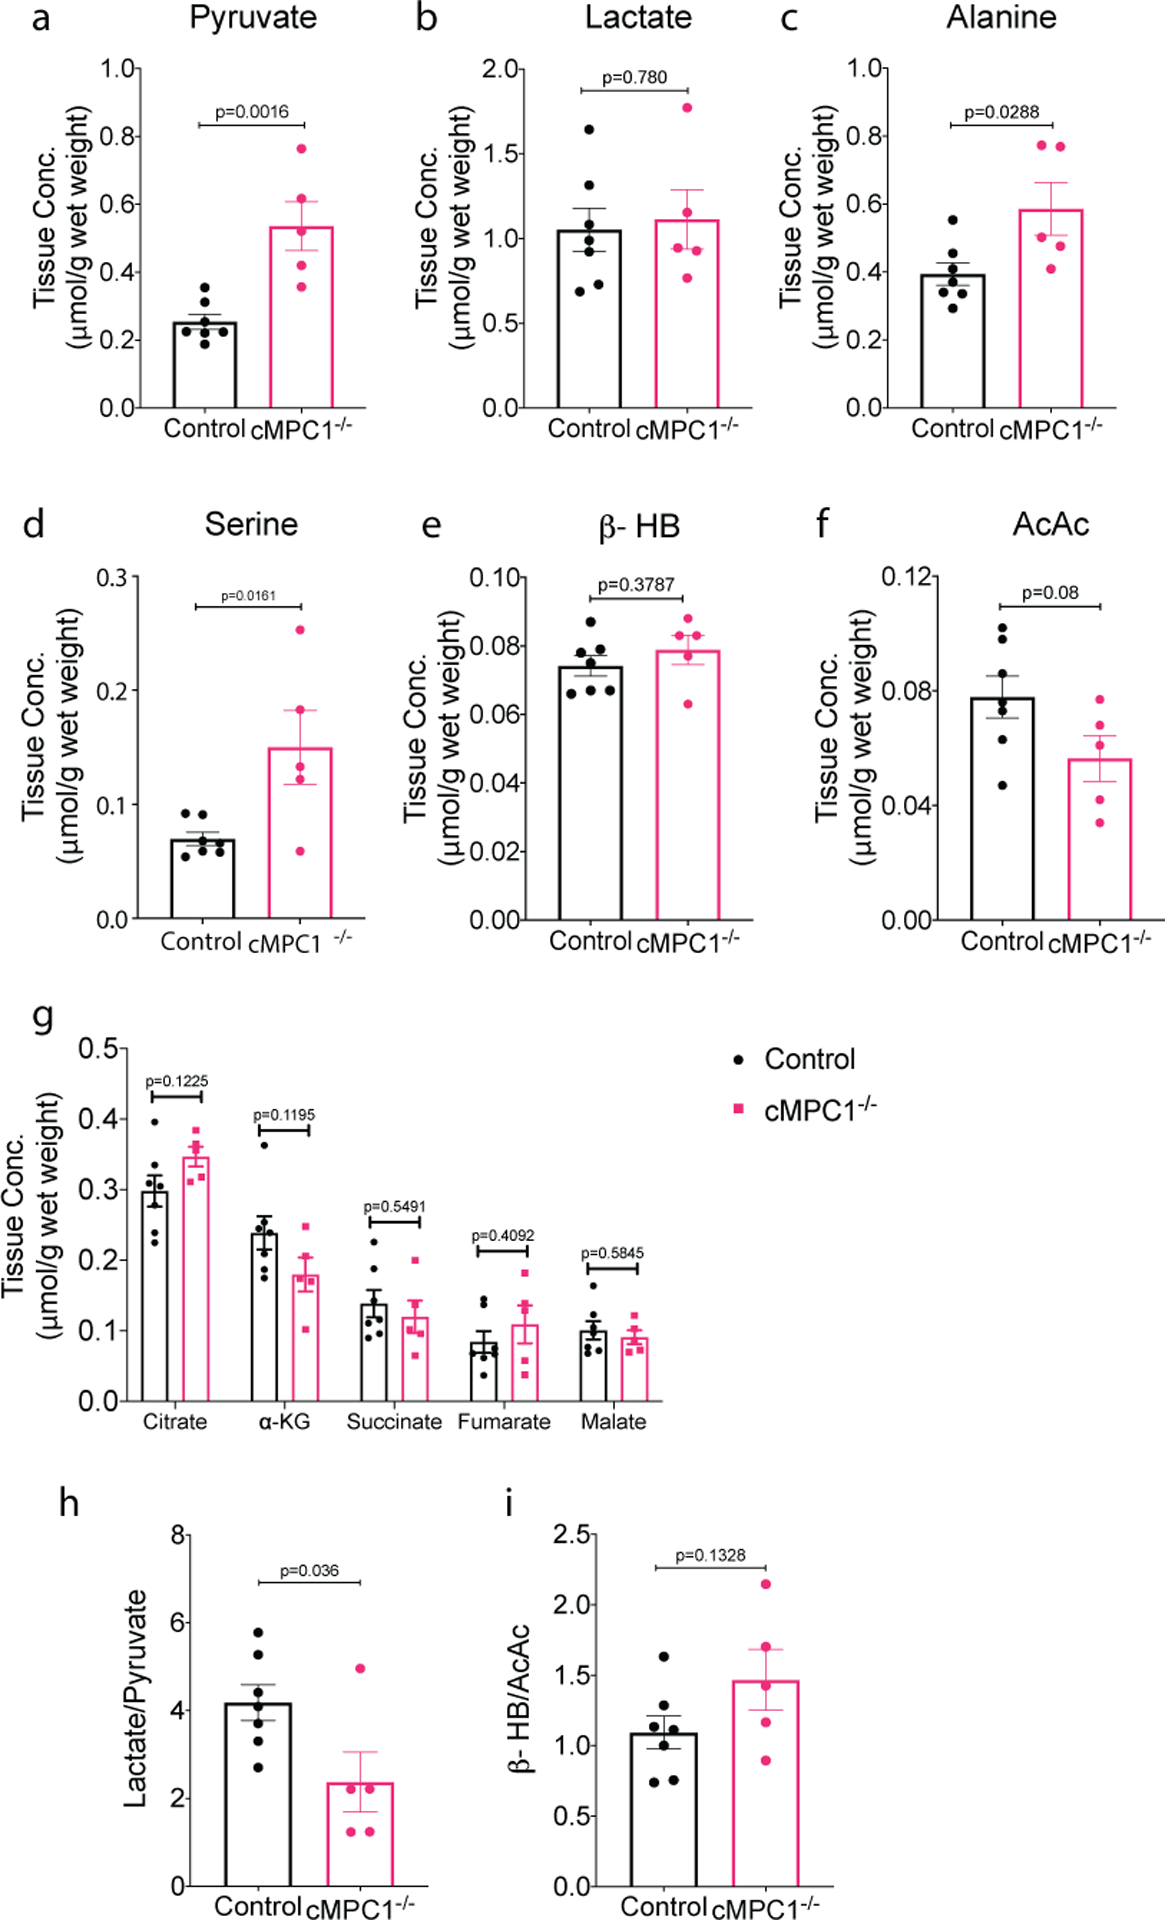
Metabolite concentrations determined in Langendorff-perfused 8-week-old hearts perfused with unlabeled substrates (10mM glucose, 0.4mM palmitate, 0.5mM lactate, 0.1mM b-hydroxybutyrate (β-HB) and 0.5mM glutamine). Tissue concentration of pyruvate (a), lactate (b), alanine (c), serine (d), ketones (e-f), and citric acid cycle (CAC) intermediates (g) were determined by GC-MS (Control, 7; cMPC1−/−, 5). The ratio of lactate/pyruvate (h) and β-HB/AcAc (i) were calculated using tissue concentrations of lactate(b), pyruvate (a), β-HB (e) and AcAc (f). Data are presented as mean ± SEM and P values were determined by two-tailed unpaired Student’s t-test.
Carbon Isotopomer Flux Analysis in cMPC1−/− Hearts:
To further determine the metabolic fate of glucose-derived carbons, Langendorff perfusions were conducted using a modified Krebs buffer containing a mixture of substrates at physiological concentrations including [U-13C6]-glucose (Extended Data Fig 3). 13C-Molar Percentage Enrichment (MPE) of pyruvate, lactate and alanine but not serine was increased in cMPC1−/− mouse hearts (Fig 4a, Extended Data Fig 4a–d). The increased 13C-MPE of pyruvate and lactate supports accumulation of glycolytic intermediates and flux into pyruvate and lactate versus conversion from lactate to pyruvate via lactate dehydrogenase. Increased 13C-MPE of alanine is consistent with increased relative flux of accumulated pyruvate into alanine by ALT. No changes were observed in the MPE of M+2 pyruvate (Extended Data Fig 4a), suggesting that the proportional contribution from the PPP to pyruvate was not increased relative to glycolytic flux. In addition, the MPE of M+3 serine was not significantly changed between control and cMPC1−/− hearts (Extended Data Fig 4d), suggesting the relative flux into the serine biosynthesis pathway (SBP) of glycolytic intermediates derived from exogenous glucose was not increased in cMPC1−/− hearts.
Figure 4. 13C-enrichment of metabolites in 13C-labeled substrate-perfused cMPC1−/− hearts.

(a-d) Metabolic flux analysis of Langendorff hearts from 8-week-old mice perfused with 10mM [U-13C6]-glucose and unlabeled substrates (0.4mM palmitate, 0.5mM lactate, 0.1mM β-HB and 0.5mM glutamine). (a-b) Total molar percentage enrichment (MPE) of all 13C-labeled isotopomers of tissue pyruvate, lactate, alanine, serine and citric acid cycle (CAC) intermediates were determined by GC-MS (Control, 6; cMPC1−/−, 9). (c-f) The flux ratio of pyruvate dehydrogenase/citrate synthase (PDC/CS), pyruvate carboxylation/citrate synthase (PC/CS), PC/PDC and percentage of 13C-labeled citrate recycling into CAC were calculated from tissue 13C-MPE of isotopomers of citrate, OAA moiety of citrate (OAACIT), pyruvate and succinate (Control, 6; cMPC1−/−, 9). (g) Fractional enrichment (FE) analysis of 13C-glutamate performed on neutralized acid extracts of Langendorff hearts perfused with 10mM [1,6-13C2]-glucose, 0.5mM [3-13C]-pyruvate and 1mM [3-13C]-lactate, in addition to 0.4mM unlabeled palmitate (Control, 7; cMPC1−/−, 8). (h) Ratio of anaplerosis to citrate synthase flux (y) was determined in neutralized acid extracts of Langendorff hearts perfused with 0.4mM U-13C-palmitate, in addition to unlabeled substrates (10mM glucose, 0.5mM pyruvate and 1mM lactate) (Control, 9; cMPC1−/−, 4). (i) Langendorff perfusion was performed with 0.5mM [2,4-13C2]-β-HB (β-hydroxybutyrate) and unlabeled substrates (10mM glucose, 0.4mM palmitate, 0.5mM pyruvate and 1mM lactate) (Control, 3; cMPC1−/−, 5). Neutralized acid extracts were analyzed by NMR to determine fractional 13C-enrichment of acetyl-CoA entering the CAC from oxidation of 13C-β-HB, (Fcβ-HB→Acetyl-CoA). Data are presented as mean ± SEM and P values were determined by two-tailed unpaired Student’s t-test.
Although tissue concentrations of CAC intermediates were maintained in cMPC1−/− hearts, the 13C-MPE of these CAC intermediates was increased (Fig 4b). PC flux (contributed by both pyruvate carboxylase and ME1) and PDC flux relative to citrate synthase (CS) were calculated from tissue 13C-MPE of isotopomers of citrate, pyruvate, OAA moiety of citrate (OAACIT) and succinate37. Although PC/CS and PDC/CS flux ratio were not significantly changed in cMPC1−/− hearts (Fig 4c,d), the flux ratio of PC/PDC was significantly reduced in cMPC1−/− hearts (Fig 4e), indicating that PDC flux is maintained or increased in cMPC1−/− hearts, without a concurrent increase in PC flux. Consistent with the reduced PC/PDC flux ratio, the percentage of recycled 13C-labeled citrate metabolized into the CAC (% citrate recycling), ( calculated from the tissue 13C-MPE of isotopomers of citrate, succinate and OAACIT 25) was increased in cMPC1−/− hearts (Fig 4f). These observations were independently validated by NMR analysis of Langendorff-perfused hearts supplemented with [1,6-13C2]-glucose and [3-13C]-pyruvate/lactate, in addition to unlabeled palmitate. The fractional enrichment of 13C-labeled glutamate was increased in cMPC1−/− hearts (Fig 4g). Anaplerosis contributed by unlabeled carbohydrate, determined as the ratio of anaplerosis to citrate synthase (y) was not increased (Fig 4h) when analyzed by NMR in hearts perfused with [U-13C16]-palmitate, in addition to unlabeled substrates. These results identify potential MPC-independent auxiliary pathways by which pyruvate-derived carbons enter the mitochondria to generate acetyl-CoA, and changes in CAC intermediate metabolism or flux that increases the contribution of carbohydrate-derived acetyl-CoA carbons to the CAC, when MPC content is reduced. Notably, increased anaplerotic flux does not account for the MPC-independent increase in the relative contribution of glucose-derived acetyl-CoA carbons to the CAC in cMPC1−/− hearts at the compensated hypertrophy stage.
Increased 13C-enrichment of acetyl-CoA (Fig 4i) in hearts perfused with [2,4-13C2]-β-hydroxybutyrate revealed increased ketone oxidation in cMPC1−/− hearts. Liquid chromatography mass spectrometry (LC-MS) revealed increased 13C-labeling of isotopomers of CAC intermediates (Extended Data Fig 5), consistent with elevated utilization of ketones.
A ketogenic diet reverses structural and functional remodeling in non-stressed cMPC1−/− hearts
Given the evidence for increased ketone oxidation in cMPC1−/− hearts and published evidence that a ketogenic diet (KD) rescued embryonic lethality in germline MPC-deficient mice29, we tested the hypothesis that increasing the delivery of ketones to cMPC1−/− hearts could ameliorate cardiac dysfunction. The first experiments used a KD that significantly raised circulating concentrations of the ketone body β-hydroxybutyrate (β-HB) by 10-fold (Fig 5a) and FGF21 (Fig 5b). Four protocols for KD feeding were used, with mice placed on the KD at varying ages, characterized by progressive degrees of cardiac dysfunction. In protocol 1, KD was initiated at the time of weaning (3-week-old). Cardiac hypertrophy, LV dysfunction and the induction of pathologic hypertrophy genes were completely prevented after 15 weeks of KD feeding (Fig 5d–g). No fibrosis was observed in either control or cMPC1−/− hearts on the control diet or KD (Fig 5c). Thus, a KD prevents cardiac dysfunction induced by loss of MPC. In protocol 2, 10-week-old cMPC1−/− mice with established cardiac hypertrophy were placed on the KD, which reversed LVH and hypertrophic gene induction after 8-weeks of feeding (Fig 6a–b, Extended Data Fig 6). Thus, a KD leads to regression of LVH in cMPC1−/− mice with compensated LVH. In protocol 3, 18-week-old cMPC1−/− mice with reduced ejection fraction were placed on a KD. The increased LV mass and decreased ejection fraction were reversed by KD feeding for 8 weeks (Fig 6c–d). However, in protocol 4, the dilated cardiomyopathy in 24-week-old cMPC1−/− mice was only partially reversed by KD feeding (Fig 6e–f). The earliest evidence for interfibrillar fibrosis was observed in cMPC1−/− hearts at the age of 22 weeks (Fig 6g–h). Taken together, KD reversed heart failure in cMPC1−/− mice prior to the development of fibrosis.
Figure 5. Ketogenic diet feeding prevents cardiac dysfunction in cMPC1−/− mice.
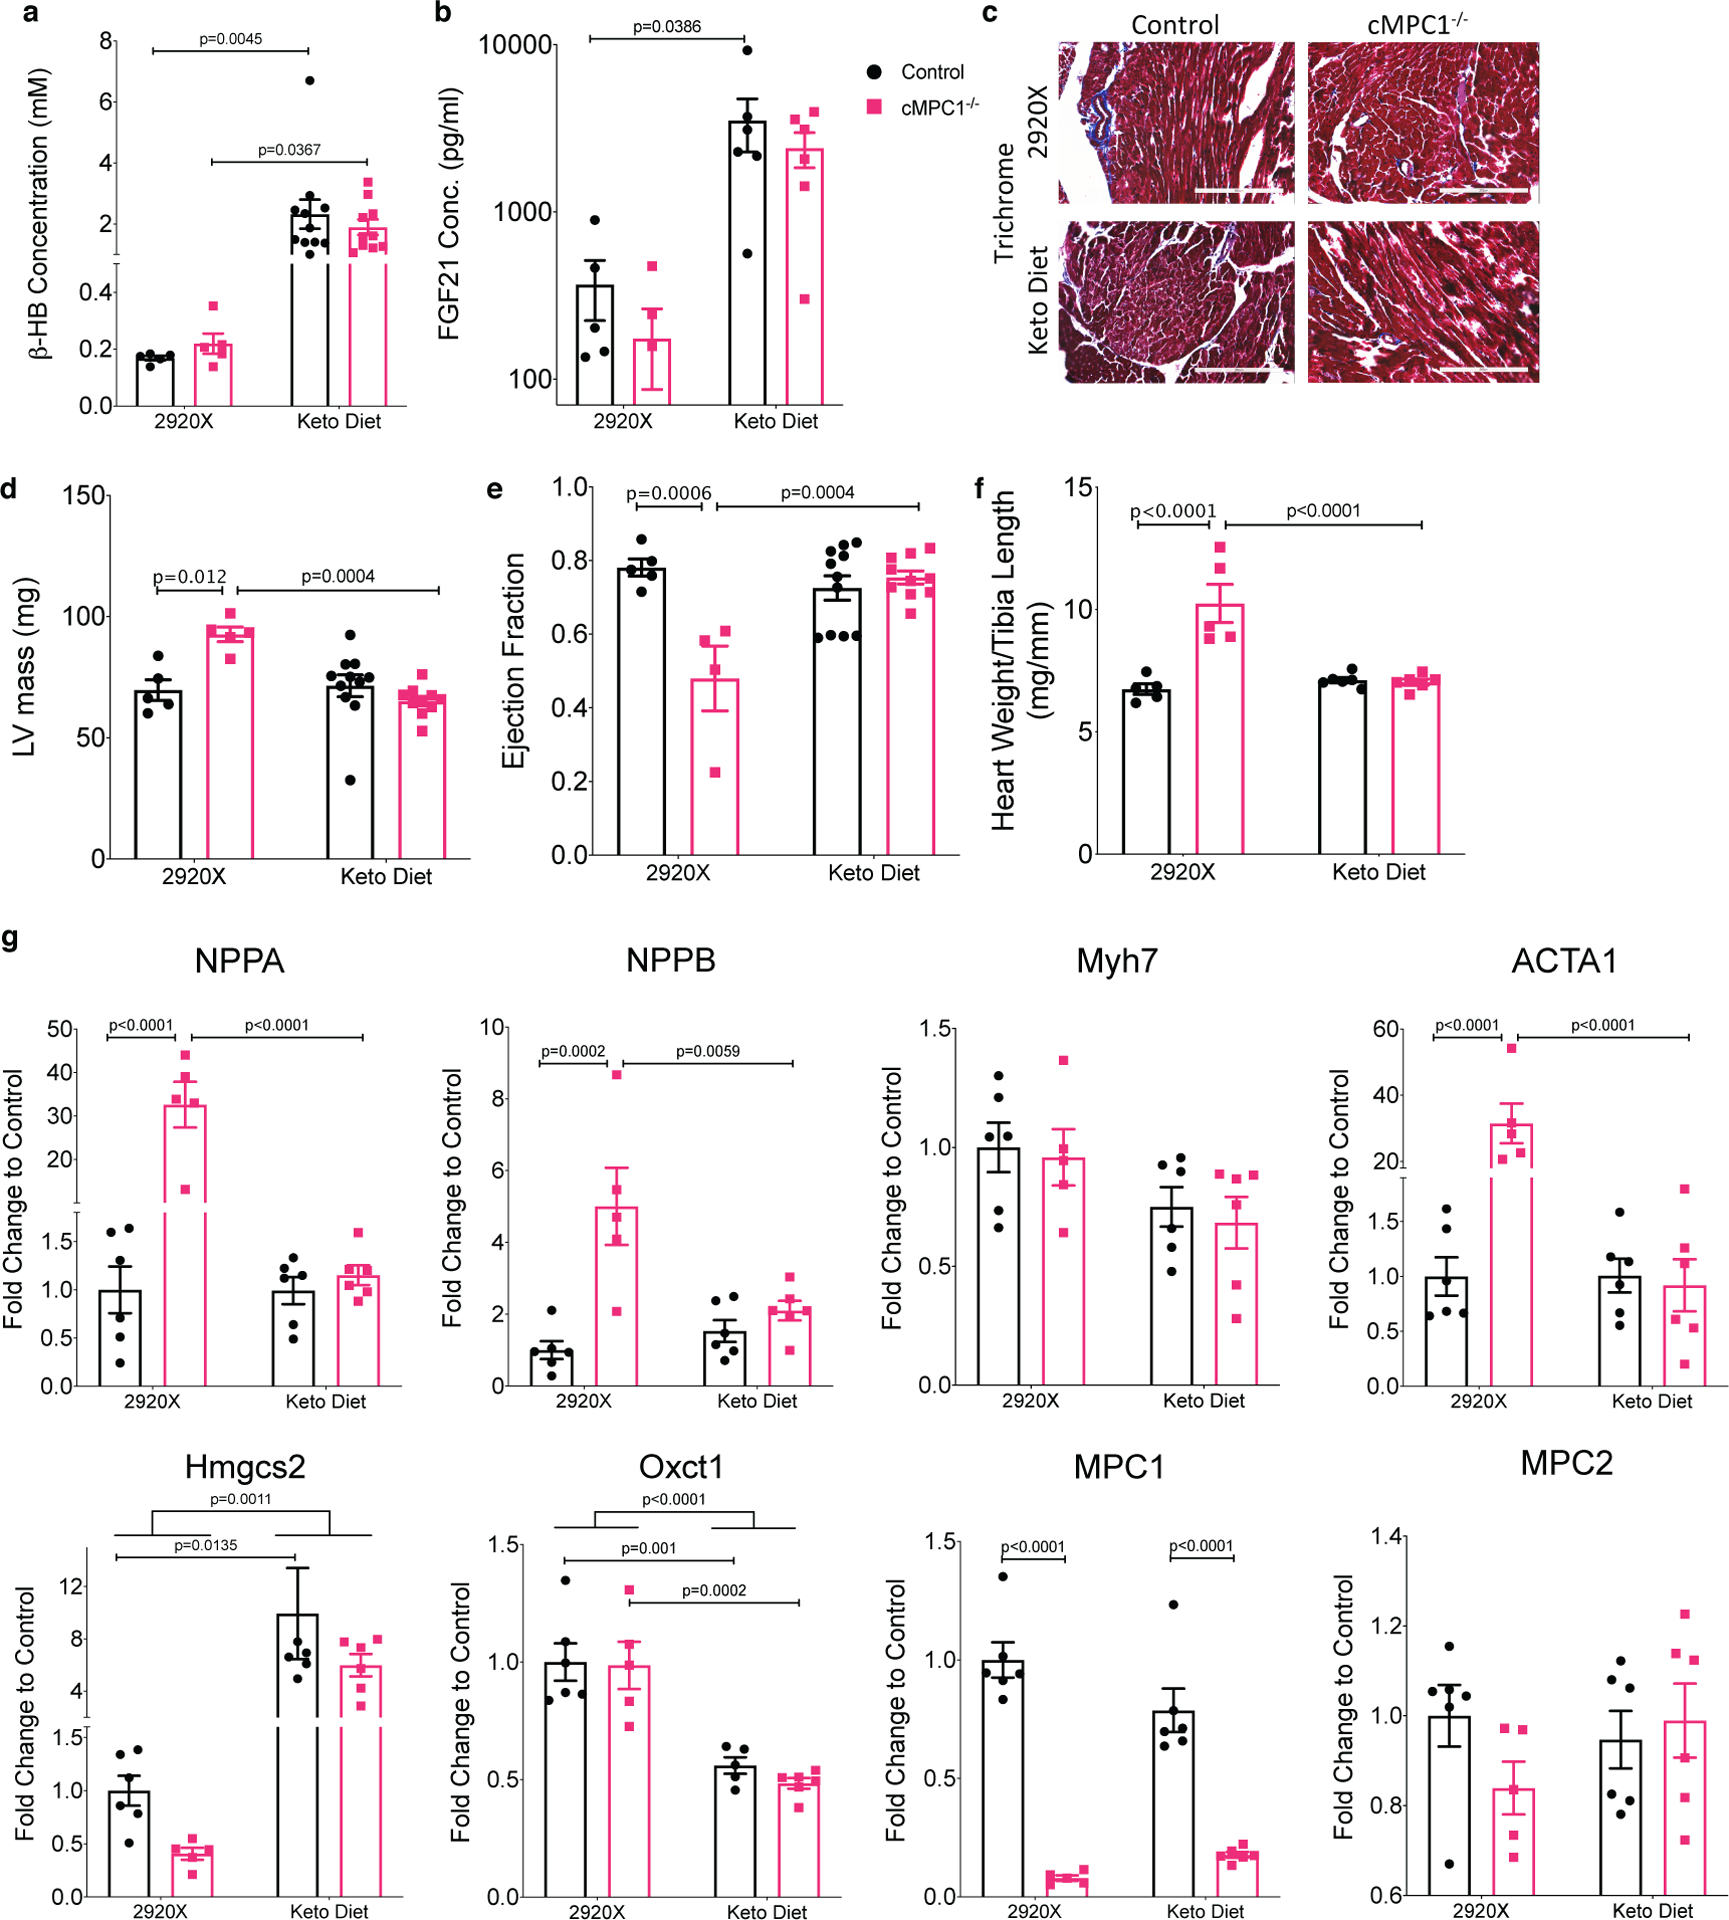
Control and cMPC1−/− mice were fed with normal chow (2920X) or a ketogenic diet at the age of 3 weeks. (a-b) serum concentration of β-HB (a) and FGF21 (b) after 8 weeks of feeding. (c) Trichrome staining reveals no increase in cardiac fibrosis in cMPC1−/− mouse hearts. Scale bar, 200 μm. Images are representative of n= 3 per group. (d-e) LV mass (d) and ejection fraction (e) were determined by echocardiography after 15 weeks of feeding. (f-g) Heart weight/Tibia length (f) and gene expression analysis (g) were determined at the time of sacrifice after 18 weeks of feeding. For panels a and d-f, n=5 (Control-2920X), n=5 (cMPC1−/−−2920X), n=11 (Control-Keto), n=10 (cMPC1−/−-Keto); for panel b, n=5 (Control-2920X), n=5 (cMPC1−/−−2920X), n=6 (Control-Keto), n=6 (cMPC1−/−-Keto); for panel g, n=6 (Control-2920X), n=5 (cMPC1−/−−2920X), n=6 (Control-Keto), n=6 (cMPC1−/−-Keto). Data are presented as mean ± SEM and P value was determined by two-way ANOVA followed by Tukey multiple comparison test.
Figure 6. Alternative substrates feeding reverses cardiac dysfunction in cMPC1−/− mice.
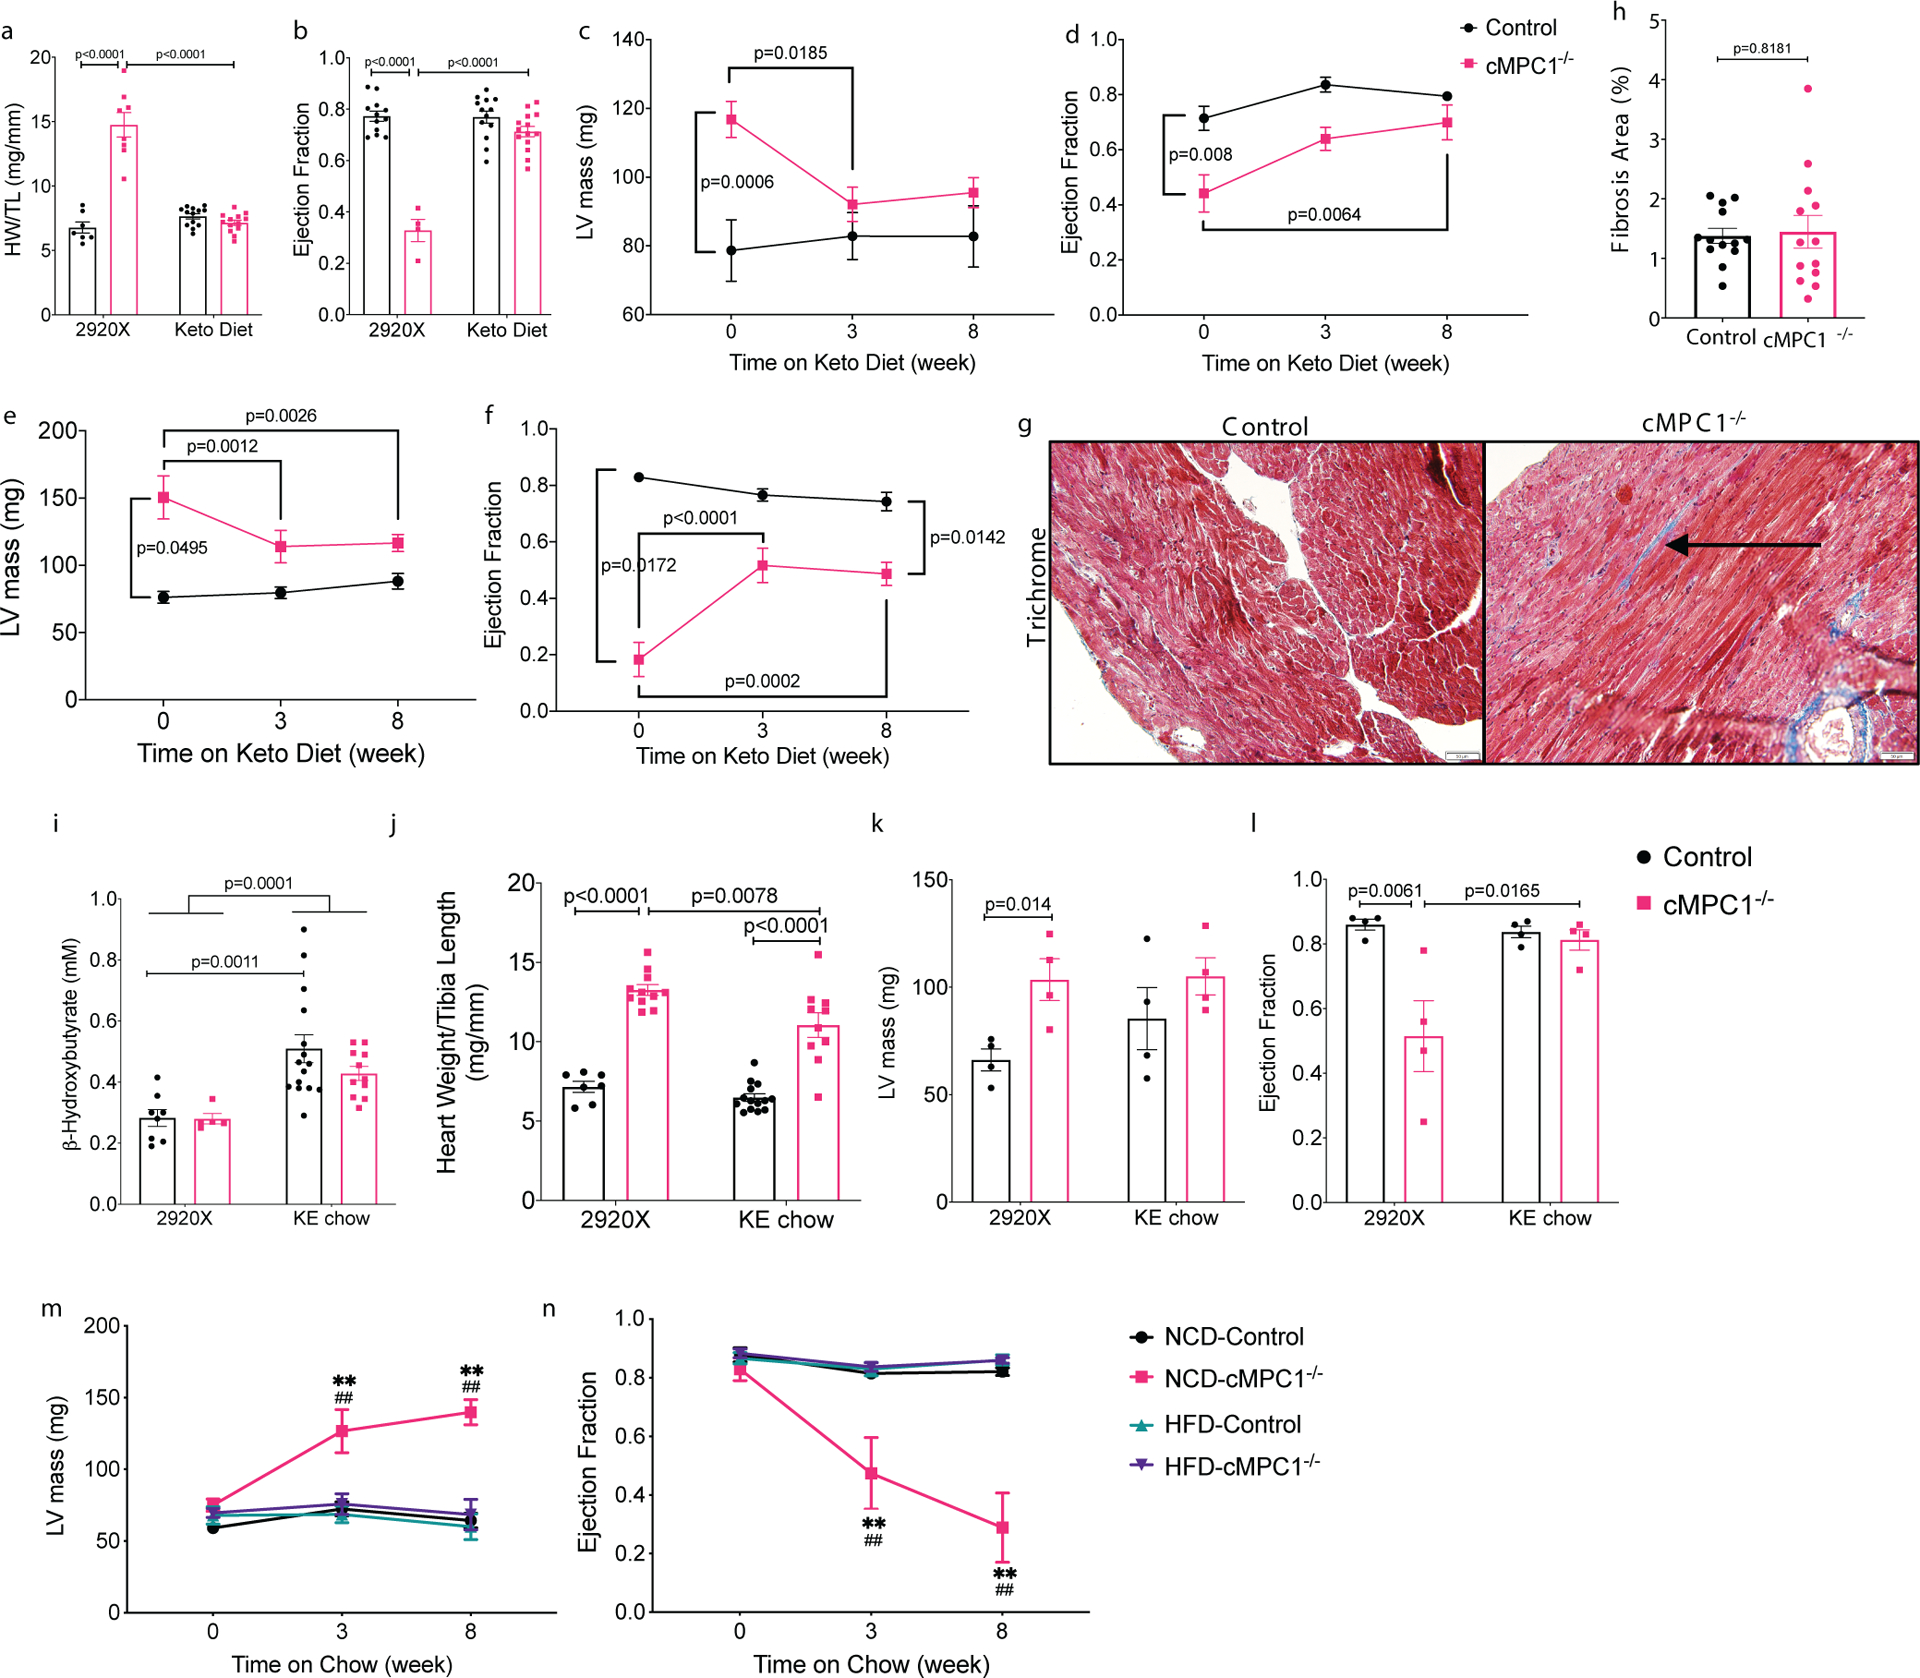
Three different cohorts of mice were fed with ketogenic diet at the age of 10 (a-b), 18 (c-d) and 24 (e-f) weeks. (a) Heart weight/Tibia length (HW/TL) and (b) ejection fraction were determined after 8 weeks of ketogenic diet in the 10-week-old cohort. (c-f) LV mass (c, e) and ejection fraction (d, f) were measured by echocardiography after 8 weeks in the 18- and 24-week-old cohorts respectively. (g-h) Trichrome stained sections reveal mild cardiac interfibrillar fibrosis in the 24-week-old cMPC1−/− mice. Scale bar, 50 μm. Images are representative of n= 7(control)/6(cMPC1−/−). For panels a-b, n=7 (Control-2920X), n=8 (Control-Keto), n=13 (cMPC1−/−−2920X), n=14 (cMPC1−/−-Keto); for the other panels, sample sizes (n) of Control/cMPC1−/−: 7/4 (c-d); 10/3 (e-f); 7/6 (h). Control and cMPC1−/− mice were fed with ketone ester (KE) chow at the age of 10 weeks and serum concentration of β–Hydroxybutyrate (i) was determined after 2 weeks of feeding. Heart weight/Tibia length (j), LV mass (k) and ejection fraction (l) were determined after 8 weeks of KE chow feeding. Another cohort of mice were fed a normal chow diet (NCD) or a 60% high fat diet (HFD) at the age of 10 weeks and LV mass (m) and ejection fraction (n) were measured after 8 weeks of feeding by echocardiography. For panels i-j, n=8 (Control-2920X), n=5 (cMPC1−/−−2920X), n=15 (Control-KE), n=11(cMPC1−/−-KE); for panels k-l, n=4 (all groups); for panels m-n, n=6 (Control-NCD), n=4 (Control-HFD), n=4(cMPC1−/−-NCD), n=5 (cMPC1−/−-HFD). Data are presented as mean ± SEM and P value was determined by two-way ANOVA followed by Tukey multiple comparison test. Control vs cMPC1−/−: **P < 0.01. Treatment vs baseline: ##P < 0.01.
To examine the durability of KD protection, another cohort of 10-week-old mice were started on KD for 8 weeks and then 50% of mice for each genotype were then randomized to remain on the ketogenic diet or switched back to normal chow (2920X). Cardiac hypertrophy and heart failure re-developed in cMPC1−/− mice when placed back on normal chow (Extended Data Fig 7). These results clearly indicate that the protection from KD are present only as long mice are consuming KD.
High fat diet or ketone ester diet reverses cardiac structural remodeling in non-stressed cMPC1−/− hearts
The KD is a low carbohydrate and high-fat diet, which increases fatty acid and ketone availability to the heart. To test if the protective effects derived specifically from fat or ketone bodies, a high fat diet (HFD) or a ketone ester (KE) diet was used to determine the specific impact of these fuels on cardiac structure and function in cMPC1−/− mice. The KE diet increased circulating concentrations of β-HB by 2-fold (Fig 6i) and was employed in 10-week-old mice (similar to KD Protocol 2). Although cardiac hypertrophy was attenuated (Fig 6j–k), KE did not completely normalize heart weights. However, LV function was preserved (Fig 6l). The non-ketogenic HFD, which was matched for micronutrients with the normal control diet (NCD), was initiated in 10-week-old cMPC1−/− mice to mirror protocol 2. HFD fully rescued cardiac hypertrophy and heart failure in cMPC1−/− mice, relative to animals on NCD (Fig 6m–n).
Metabolic adaptations to ketogenic diet in non-stressed cMPC1−/− hearts
To explore potential mechanisms for the KD rescue, freeze-clamped hearts from both control and cMPC1−/− mice fed the control diet (2920X) or the KD were subject to metabolomics analysis. Data from both GC-MS and LC-MS were combined and depicted on a heat map (Fig 7a). The PCA plot revealed distinct metabolomics profiles between control and cMPC1−/− hearts in mice fed the 2920X chow. However, the metabolomics pattern became overlapping in control and cMPC1−/− when fed the KD (Fig 7b). The majority of acyl-carnitines with chain lengths from 3:0 to 20:4 were increased in cMPC1−/− hearts relative to controls when fed 2920X chow (Fig 7c). Moreover, on the KD, control hearts displayed increased acyl-carnitines accumulation. In contrast, cMPC1−/− hearts did not further increase acyl-carnitines on the KD but maintained levels that were equivalent to that of controls on the KD (Fig 7c). Accumulation of pyruvate and lactate in cMPC1−/− heart was reversed by KD feeding (Fig 7d). KD feeding also reduced the relative tissue concentration of glucose, glucose-6-phosphate and fructose-6-phosphate. Together these data suggest that glucose uptake and glycolysis were markedly repressed in both control and cMPC1−/− hearts on KD (Fig 7d). A reduction in some CAC intermediates (acetyl-CoA and citrate, Fig 7e) and ATP (Fig 7f) was observed in the 14-week-old cMPC1−/− hearts compared to control hearts on 2920X chow and these deficiencies were rescued by KD feeding (Fig 7e–f). Accumulation of the PPP intermediate (sedoheptulose-7-phosphate) and the SBP intermediate (serine and glycine) was reversed in the cMPC1−/− hearts fed with KD (Fig 7g). Some of the nucleotides, which were increased in cMPC1−/− hearts on 2920X chow, were normalized in cMPC1−/− hearts fed with KD (Fig 7h). Moreover, the increased glycogen storage and elevated protein O-GlcNAc modification in cMPC1−/− hearts were reversed by KD feeding (Fig 7i–k). In conclusion, KD feeding reversed the accumulation of pyruvate and lactate, the decline in citrate and the shunting of glucose into alternative pathways (PPP, SBP, HBP and glycogen storage) in cMPC1−/− hearts that correlate with reversal of the age-dependent structural remodeling.
Figure 7. Metabolite Profiles in KD hearts.
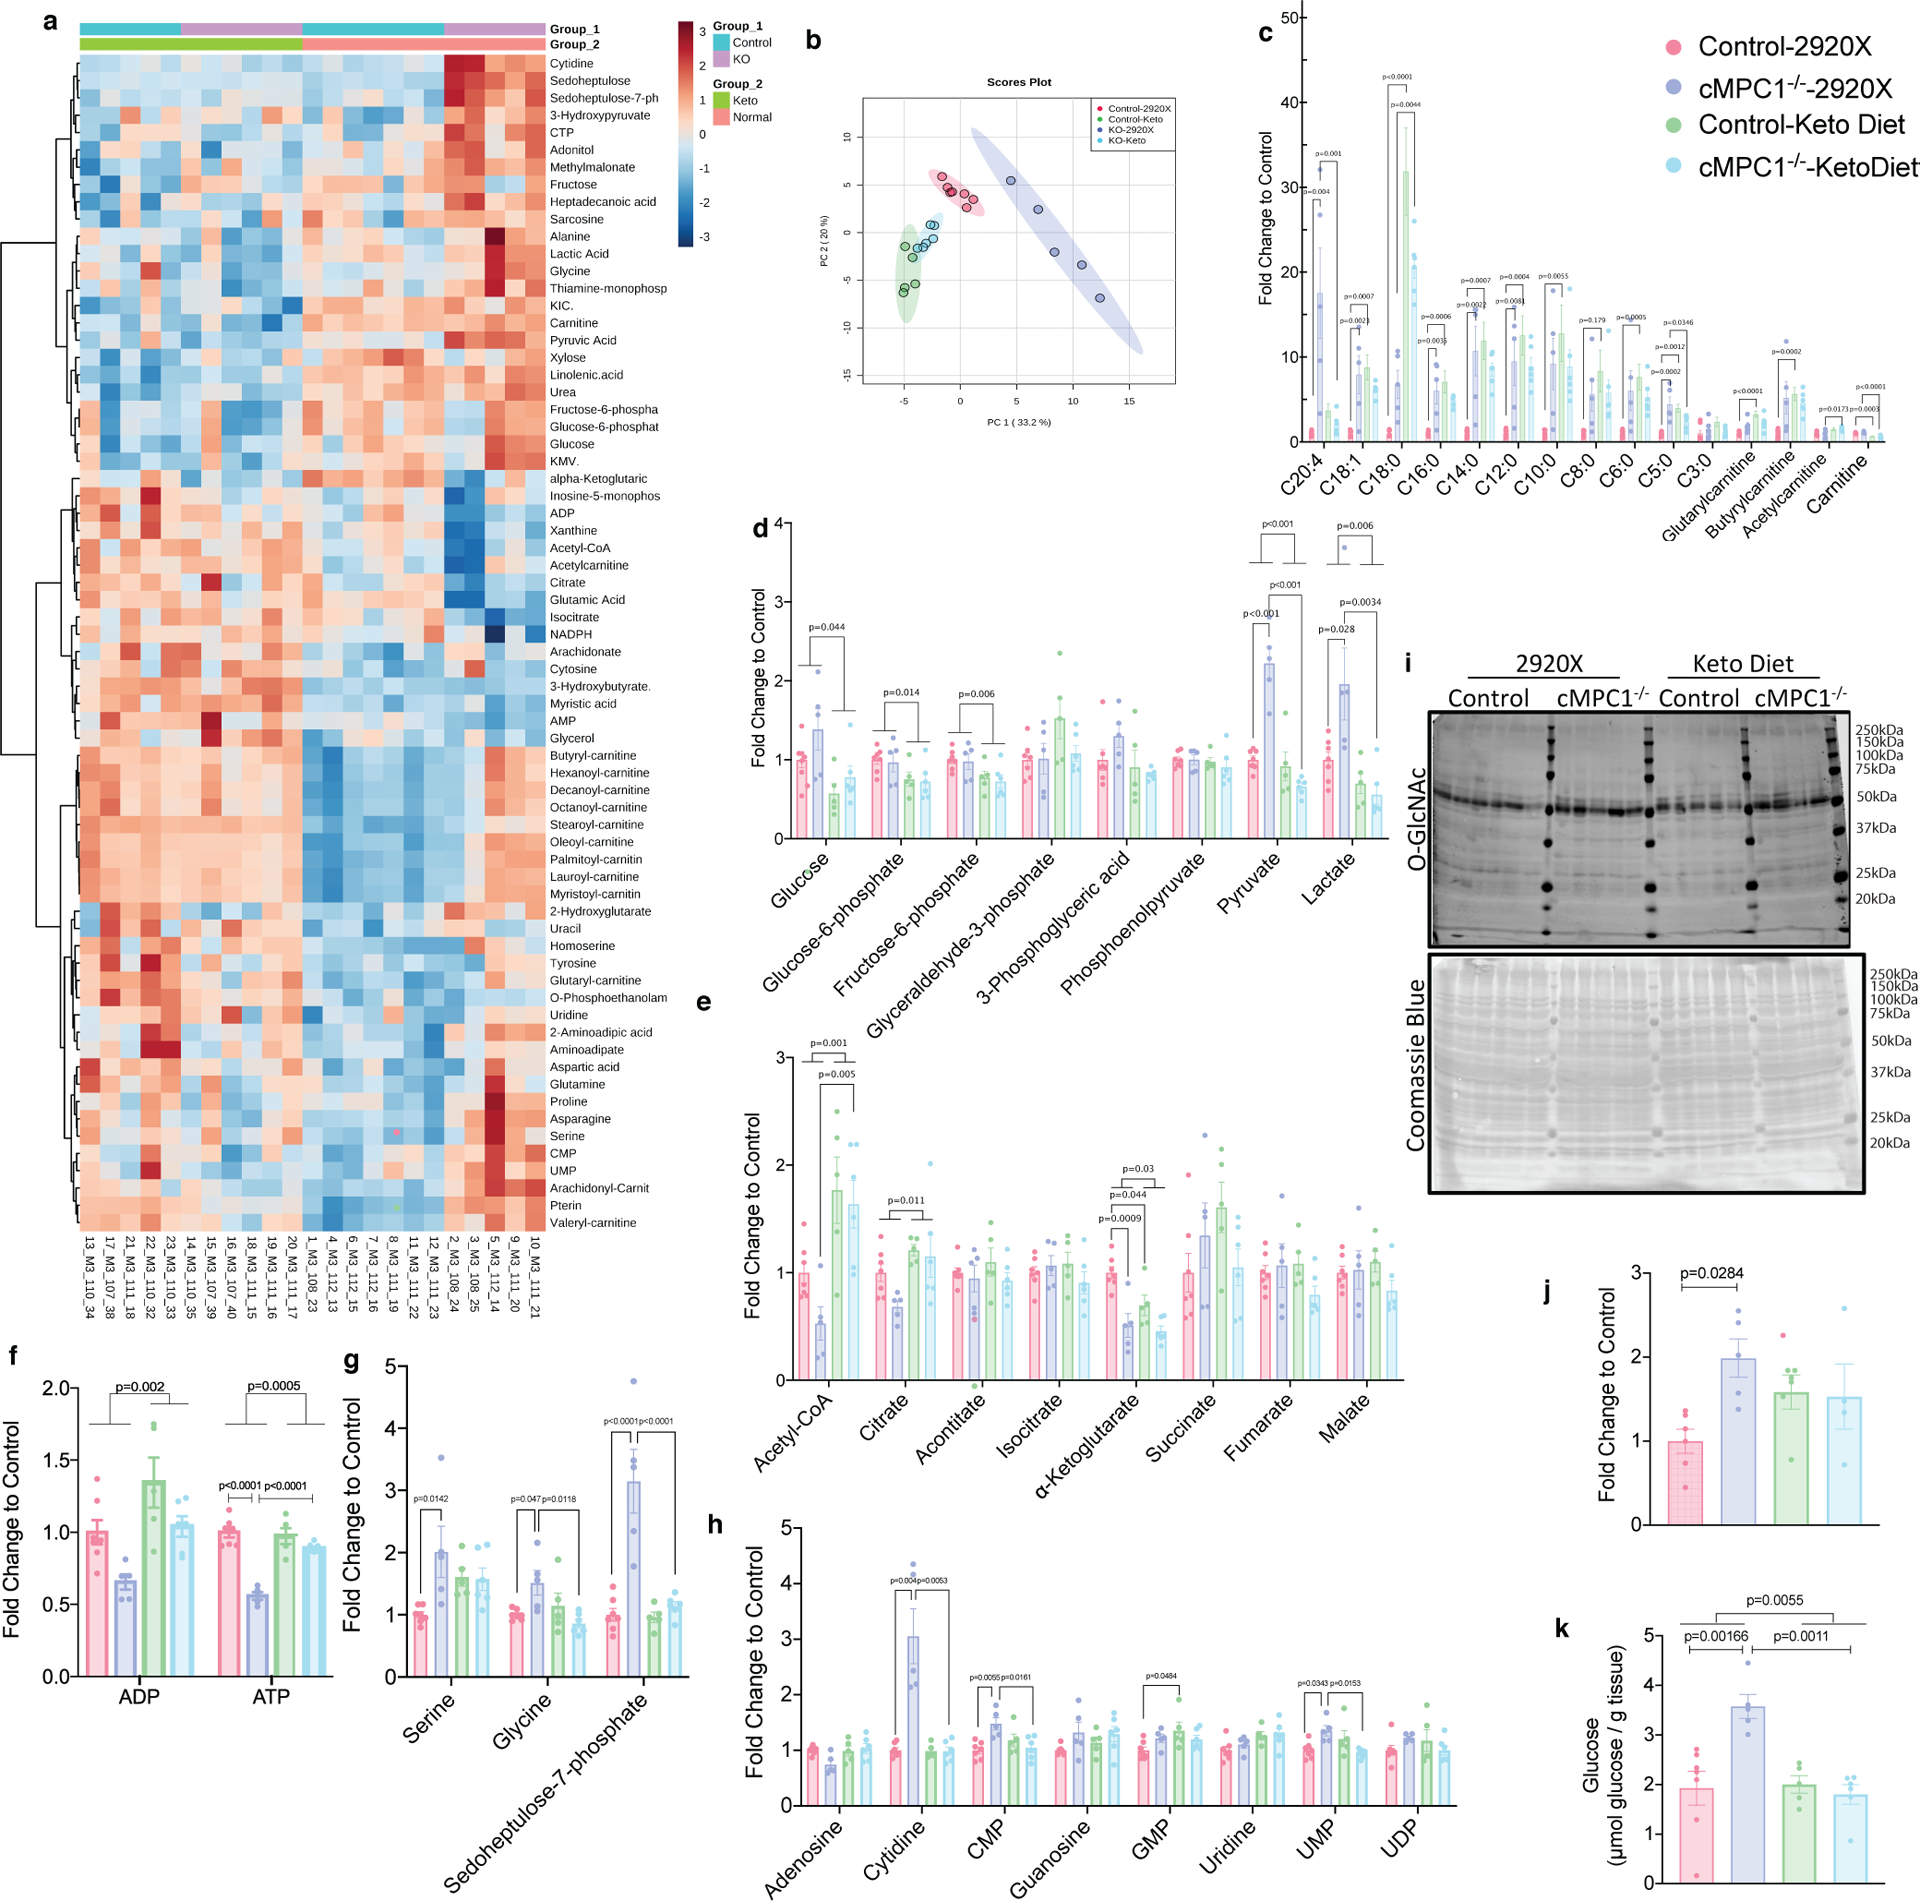
Control and cMPC1−/− mice were fed with ketogenic diet starting at the age of 8 weeks and hearts were freeze-clamped after 6 weeks of feeding. GC-MS and LC-MS were employed to determine levels of metabolites in the heart tissue. The fold change of all metabolites was normalized to control hearts fed on normal chow (2920X). Two-way heatmap (a) and Principal Component Analysis (PCA) (b) were analyzed and plotted by MetaboAnalyst. Acyl-carnitines(c), glycolysis intermediates (d), CAC intermediates (e), ADP and ATP (f), PPP and SBP intermediates (g) and nucleotides (h) were plotted and analyzed by two-way ANOVA followed by Tukey multiple comparison test. Sample sizes are as follows: n=7 (Control-2920X), n=5 (cMPC1−/−−2920X), n=5 (Control-Keto), n=6 (cMPC1−/−-Keto). O-GlcNAc blot (i) normalized to total Coomassie blue staining (i) and glycogen storage (k) was determined in 18-week-old control and cMPC1−/− mice after 8 weeks of KD (Protocol 2). For panel j, sample sizes are as follows: n=6 (Control-2920X), n=5 (cMPC1−/−−2920X), n=5 (Control-Keto), n=4 (cMPC1−/−-Keto). For panel k, sample sizes are as follows: n=7 (Control-2920X), n=5 (cMPC1−/−−2920X), n=5 (Control-Keto), n=6 (cMPC1−/−-Keto). Data are presented as mean ± SEM and analyzed by two-way ANOVA followed by Tukey multiple comparison test. All P values <0.05 are shown on the figure panels. If not indicated, then P values are >0.05.
Divergent effects of short-term versus long-term ketogenic diets on cMPC1−/− mice following pressure overload
Given the striking effect of KD to prevent or reverse LV remodeling in non-stressed cMPC1−/− hearts, we sought to determine if this would modify the response of these hearts to hemodynamic stress. cMPC1−/− mice were subjected to transverse aortic constriction (TAC) surgery. Young (6-week-old) control mice tolerate TAC and do not develop heart failure. However, 6-week-old cMPC1−/− mice exhibited accelerated LV remodeling and heart failure characterized by increased cardiac hypertrophy and fibrosis and greater reduction in ejection fraction (Fig 8a–e). To explore if short term KD feeding could ameliorate the exacerbated heart failure phenotype of cMPC1−/− mice under pressure overload, 8-week-old mice were placed on KD that was started at the time of TAC or maintained on control diet (2920X). cMPC1−/− mice on control diet all died within 6-days of TAC surgery, while the mortality of WT mice was 20%. In the KD cohort, survival of WT mice was 100% within 1 week. However, all cMPC1−/− mice on the KD died within 5-days of TAC (Fig 8f). Seeing that short term KD feeding did not rescue the heart failure induced by TAC in cMPC1−/− mice, a separate cohort of mice fed with KD starting at weaning (3-week-old) were subjected to TAC surgery at the age of 6 weeks to explore the effect of long-term KD feeding. 3-weeks post TAC, cMPC1−/− mice exhibited similar cardiac hypertrophy as control mice following TAC and ejection fraction was not decreased (Fig 8g–i). Thus, long-term KD feeding prevented heart failure in cMPC1−/− mice without attenuating the hypertrophic response. To further characterize the impact of KD in WT mice we compared the response to TAC in chow and KD-fed WT mice. Cardiac hypertrophy attenuation was detected in young WT mice (6-week-old) after TAC surgery (Extended Data Fig 8a–c) but not 10-week-old WT mice (Extended Data Fig 8d–f).
Figure 8. Divergent effects of ketogenic diet feeding on pressure overload-induced cardiac remodeling in cMPC1−/− mice.
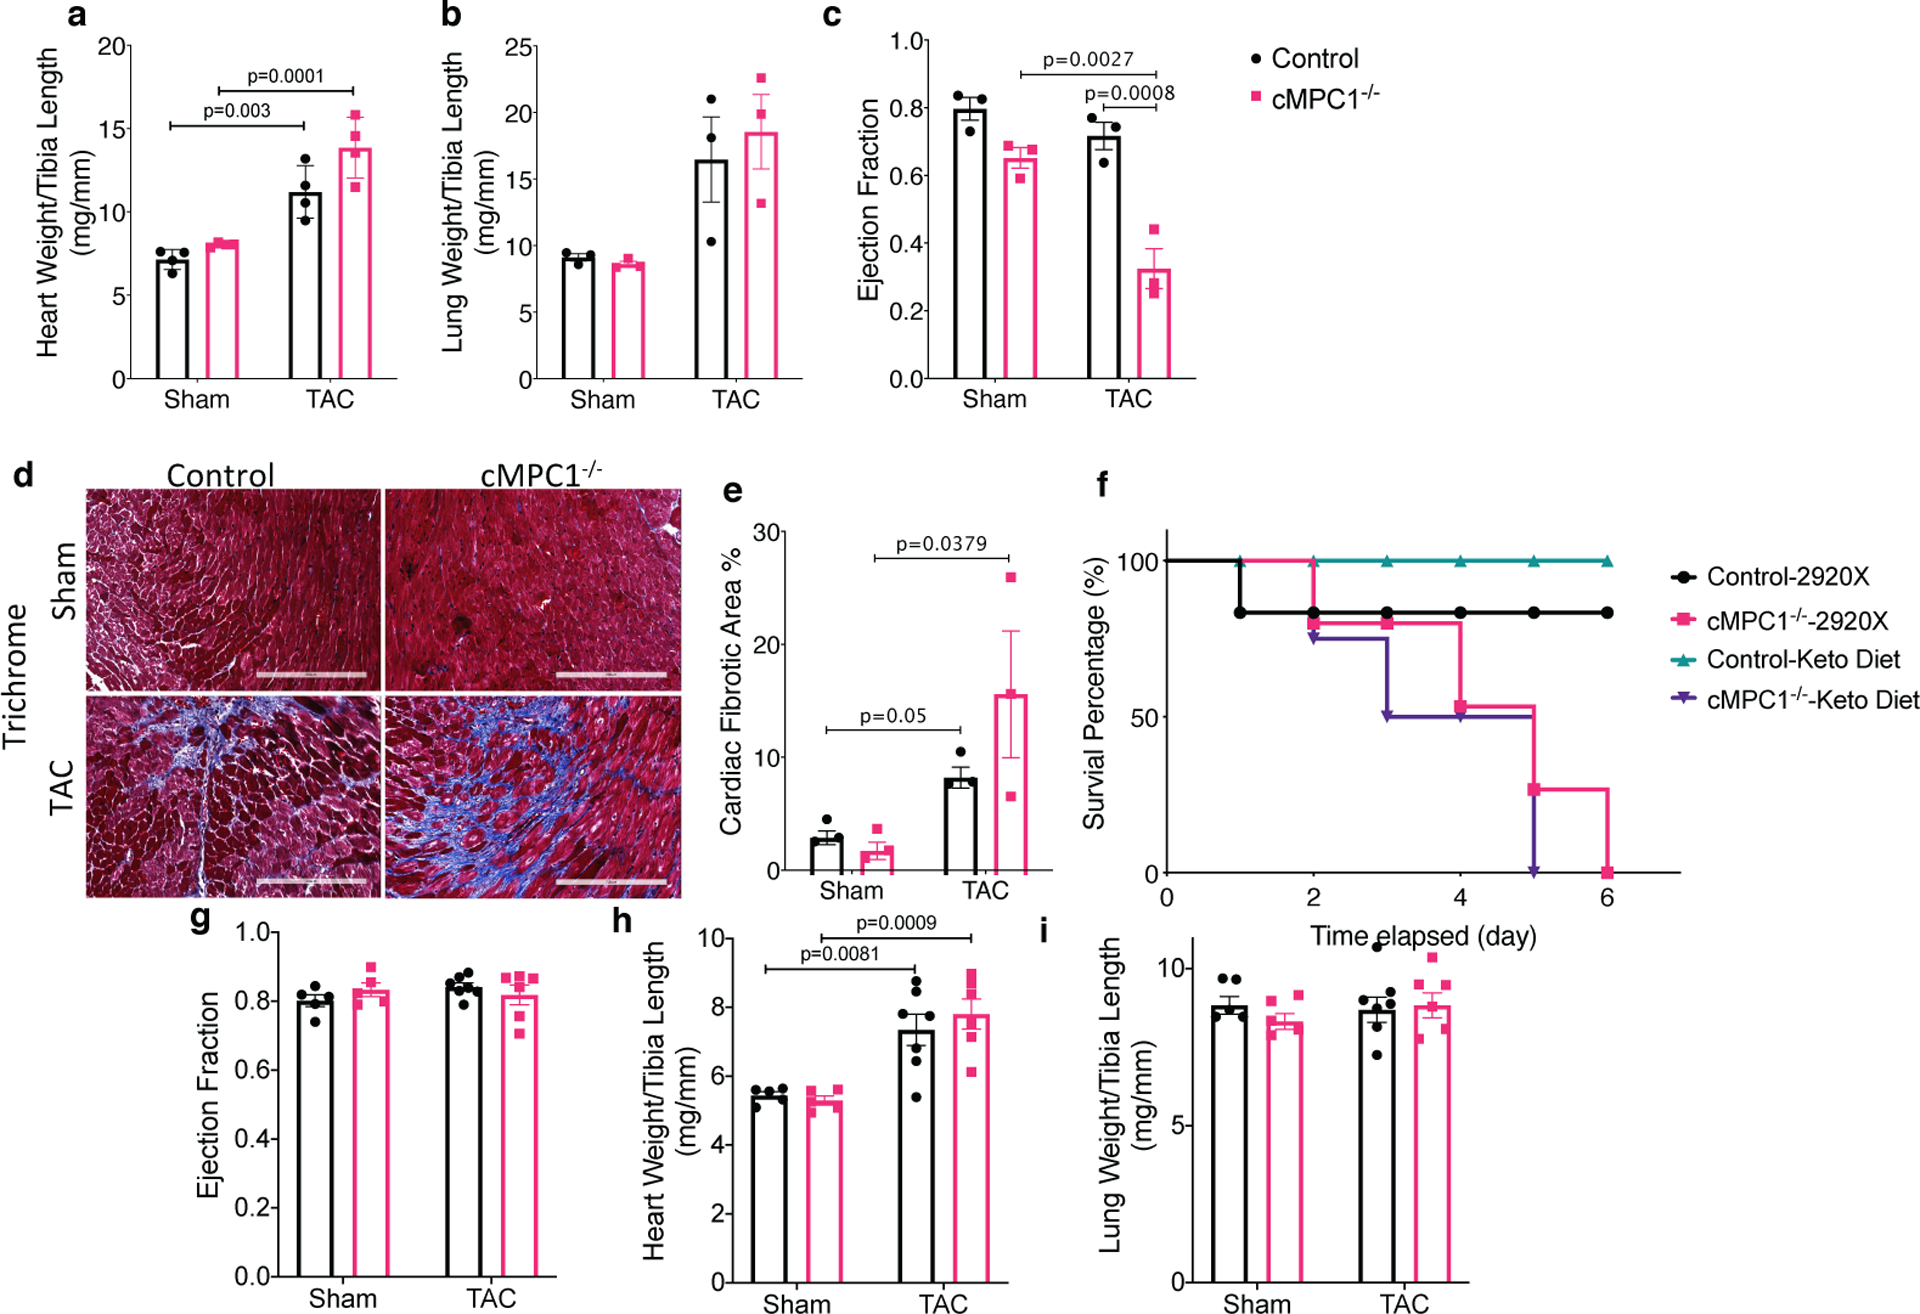
Control and cMPC1−/− mice were subjected to TAC surgery at the age of 6 weeks and heart weights or lung weights normalized to tibia length (a-b) and ejection fraction (c) were determined 3 weeks post TAC. Cardiac fibrosis was revealed by Trichrome staining (d-e) at time of sacrifice. Scale bar, 200 μm. Images are representative of n= 3 per group. Transverse aortic constriction surgery was performed on 8-week-old control and cMPC1−/− mice that were maintained on chow diet or initiated on a ketogenic diet (KD) at the time of TAC surgery. The survival curve following TAC is shown in panel f. Control and cMPC1−/− mice were fed with ketogenic diet at weaning and were subjected to TAC surgery at the age of 6 weeks. Ejection fraction (g) and heart weights or lung weights normalized to tibia length (h, i) were assessed at 3 weeks post TAC. For panels a-c and e, n=3 (all groups); for panel F, n=6 (Control-2920X), n=6 (Control-Keto), n=7 (cMPC1−/−−2920X), n=8 (cMPC1−/−-Keto); for panel g-i, n=5 (Control-2920X), n=5 (cMPC1−/−−2920X), n=7 (Control-Keto), n=6 (cMPC1−/−-Keto). Data are presented as mean ± SEM and P value was determined by two-way ANOVA followed by Tukey multiple comparison test.
Discussion
This study, demonstrating that loss of MPC in cardiomyocytes leads to age-dependent cardiac dysfunction and impaired substrate metabolism provides interesting insights into the physiological role of normal levels of MPC-dependent mitochondrial pyruvate uptake in the heart. First, we identified metabolic adaptations that develop in the heart including the existence of potential alternative pathways for pyruvate mitochondrial entry, independent of anaplerosis that are insufficient to maintain normal CAC activity in response to aging and hemodynamic stress. Second, we identified the existence of adaptive changes in fatty acid metabolism, that not only increase rates of fatty acid oxidation but also lead to accumulation of acyl-carnitines. Despite the existence of these adaptive mechanisms by which glucose-derived carbons could enter the CAC and an increased dependence on FA metabolism, cMPC1−/− hearts inexorably progress to failure. Reduced mitochondrial pyruvate uptake led to the accumulation of pyruvate and lactate in vivo and accumulation of pyruvate in perfused hearts, which recapitulate findings reported with chemical inhibitors of the MPC38. In addition, there was increased partitioning of glycolysis-derived metabolites into other cytosolic pathways such as glycogen synthesis, the HBP, the PPP and the SBP, which in concert with changes in mitochondrial substrate utilization likely contributed to cardiac dysfunction. All of these metabolic abnormalities were reversed when animals were presented with supra-physiological availability of alternative substrates such as ketones or fatty acids, which also prevented structural remodeling.
Determination of pyruvate uptake and respiration in isolated mitochondria in vitro, revealed residual potential MPC-like pyruvate uptake activity in MPC1 deficient mitochondria. This could reflect supra-physiological concentrations of pyruvate used in in vitro assays that could potentially lead to limited mitochondrial uptake via non-specific mechanisms such as carboxylate carriers with low affinity for pyruvate39, or from MPC in non-cardiomyocyte mitochondria (Extended Data Fig 1a). However, despite reduced mitochondrial pyruvate uptake, isotopomer analysis of [U-13C6]-glucose perfused hearts and fractional enrichment of 13C-glutamate from [1,6-13C2]-glucose and [3-13C]-pyruvate/lactate perfused hearts at the stage of compensated cardiac hypertrophy, revealed the existence of robust adaptations by which pyruvate-derived carbons were entering the CAC acetyl-CoA pool most likely via MPC-independent mechanisms as discussed below.
Cytosolic pyruvate can be converted to malate and alanine by ME1 and ALT1 respectively40,41, both of which then enter mitochondria via specific shuttles. Malic Enzyme 1 (ME1), catalyzes the conversion of cytosolic pyruvate to malate accompanied by NADPH consumption5,41,42. ME1 has been reported to be a significant source for anaplerosis and its expression level is significantly induced in rodent models of pressure overload-induced pathological hypertrophy5. In this context, cytosolic malate serves directly as an anaplerotic substrate via exchange with α-ketoglutarate. However, carbon from this cytosolic malate need not enter the TCA cycle solely through anaplerosis, because the mitochondrial isoforms of malic enzyme, ME2 and ME3 could reconvert malate into pyruvate within the mitochondria for oxidation via PDH. Indeed, in the absence of elevated anaplerosis and even at baseline levels of ME1 in the normal heart, the pathway converting cytosolic pyruvate into malate, which enters the mitochondria, remains a source of mitochondrial pyruvate, via the action of ME2 and ME3. The ME redox pair (malate/pyruvate) was decreased in cMPC1−/− hearts, suggesting that the accumulated pyruvate could potentially drive the ME1 reaction to generate malate. However, tissue pyruvate was predominantly labeled in the M+3. This pattern does not support this mechanism because if the transfer was occurring through malate, pyruvate should also be labeled at M+2 and M+1. M+3 labeling of pyruvate could predominate if there was no isotopic label randomization at fumarase, which is believed to be rapid and if there was no mixing of labeled malate coming from ME, with that derived from the recycling of labeled citrate in the CAC. Although unlikely, this possibility cannot be ruled out.
Alanine and α-KG can be converted to pyruvate and glutamate, respectively in mitochondria, by the enzyme ALT2, which is highly expressed in heart40. 13C enrichment and absolute concentration of alanine was increased in cMPC1−/− hearts, raising the possibility that glucose and pyruvate-derived carbons could enter the CAC in an MPC-independent manner via alanine, as was recently described in MPC deficient livers31. However, tissue levels of α-KG were repressed. Moreover, the expression level of the cytosolic alanine transaminase isoform ALT1 is low in hearts40 and the total ALT activity in cMPC1−/− hearts was not increased (Extended Data Fig 9b–c). Although these data suggest that bypass via ALT might not represent the mechanism that increases pyruvate contribution to CAC acetyl-CoA in cMPC1−/− hearts at the compensated cardiac hypertrophy stage, specific experiments to support this conclusion: such as reducing ALT activity or expression or perfusing hearts with [2-13C,U-2H3]-pyruvate43 to test for the role of alanine were not performed. As such this mechanism cannot be completely ruled out.
Increased flux via the SBP could represent an alternative pathway for pyruvate carbons to enter the CAC in an MPC-independent manner. Although the total serine pool determined by metabolomics in in cMPC1−/− hearts was increased, the M+3 enrichment of serine was <1%. Thus, while the SBP was activated in cMPC1−/− hearts, there is no evidence from the labeling pattern of serine that the exogenous labeled glucose was contributing increased CAC labeling of TCA intermediates via serine. An additional mechanism that was not directly tested in this study is the possibility of increased mitochondrial lactate uptake and an intramitochondrial lactate-pyruvate shuttle as recently proposed44–46.
The metabolic impact of MPC deficiency in the heart differs profoundly from all other tissues in which this has been previously examined. Specifically, the metabolic reprogramming in cMPC1−/− hearts does not result in increased use of glutamine carbons for CAC metabolism (oxidative glutaminolysis) (Extended Data Fig 10). This contrasts with other tissues such as liver, wherein the increased use of glutamine carbons for CAC metabolism was associated with higher pyruvate-alanine, among other pathways30,31.
Although the specific mechanisms by which pyruvate enters the CAC when MPC levels or activity are reduced remains to be definitively elucidated, our metabolic analyses indicate that these adaptations appear to initially increase cardiac efficiency and increase cardiac contractility in the short term, even when molecular evidence of pathological LVH is present. However, decreased CAC intermediates and ATP in 14-week-old cMPC1−/− hearts (Fig 7e–f) indicates that alternate routes or mechanisms for mitochondrial pyruvate utilization in the heart are insufficient in the long-term to sustain LV function as these mice age. The possibility of CAC impairment is also supported by the observation that pyruvate flux to anaplerosis was not increased in cMPC1−/− hearts. Without MPC-dependent anaplerosis, the CAC pool could be sustained by increasing the recycling of CAC intermediates (Fig 4f) in the short term but this compensation mechanism is insufficient during aging or in the face of an acute hemodynamic load. Together, these data suggest a specific requirement for MPC in channeling or maintaining pyruvate availability for anaplerotic pathways.
Loss of mitochondrial pyruvate uptake in cardiomyocytes increased the accumulation of glycolytic intermediates resulting in shunting of glucose into alternative pathways, such SBP, PPP, HBP and glycogen storage. In [U-13C6]-glucose perfused cMPC1−/− hearts, the relative enrichment of M+2 pyruvate and M+3 serine was unchanged (Extended Data Fig 4). However, total tissue levels of pyruvate and serine were increased in the perfused cMPC1−/− hearts (Fig 3a, 3d), indicating that absolute abundance of M+2 pyruvate and M+3 serine was increased. These data suggest increased PPP and SBP flux in ex vivo perfused cMPC1−/− hearts. Moreover, metabolomics analysis from in situ (non-perfused) hearts revealed accumulation of the PPP intermediate sedoheptulose-7-phosphate and SBP intermediates serine and glycine in cMPC1−/− hearts (Extended Data Fig 2a, Fig 7g); consistent with increased shunting of glycolytic intermediates into the PPP and SBP in vivo. Metabolomics analysis also revealed increased nucleotide synthesis, suggesting that increased PPP flux may be supporting increased nucleotide synthesis (Fig 7h). Increased glycogen (Fig 2i) and O-GlcNAc content (Fig 2g–h) in cMPC1−/− hearts indicate increased diversion of glucose into the HBP and glycogen synthesis, changes in which have been reported to correlate with pathological cardiac remodeling47,48.
The multiple metabolic and mitochondrial adaptations that develop in cMPC1−/− hearts inform potential mechanisms that may initially maintain cardiac function but also contribute to the ultimate decline in cardiac function on normal chow versus the beneficial effect of KD. Although the auxiliary pathways by which pyruvate-derived carbons may enter the CAC to support CAC function in cMPC1−/− hearts in the short term, they are insufficient, as evidenced by accumulation of lactate, pyruvate and increased diversion of glucose carbons into non-glycolytic pathways such as the HBP, glycogen and the PPP. In concert, cMPC1−/− hearts develop increased FAO and ketone body oxidation capacity, which could support mechanisms by which ketogenic diets or high fat diets (HFD) rescue their structural remodeling. A dramatic reduction in the accumulation of pyruvate, lactate, and glycogen storage correlated with reversal of structural remodeling on KD or HFD. This raises the possibility that mechanisms for cardiotoxicity could arise from accumulation of glucose-derived intermediates (e.g. O-GlcNAc and glycogen) and potentially, tissue acidosis secondary to increased lactate.
HFD was as effective as KD in reversing cardiac remodeling in cMPC1−/− hearts, whereas a ketone ester (KE) diet, that selectively increased ketone body availability had an attenuated effect. It is possible that the level of hyperketonemia following KE feeding might not have been elevated enough to overcome the CAC defect in cMPC1−/− hearts. Our observations that increasing the availability of ketones or FA substrates by dietary manipulation could prevent or reverse LV remodeling in non-stressed cMPC1−/− hearts, suggests that increasing the availability of alternative carbon sources could ameliorate the pathophysiologic consequences of altered CAC function or pyruvate partitioning in cMPC1−/− hearts. This is supported by our observation that protection by KD feeding in cMPC1−/− hearts was dependent on the continuity of KD feeding (Extended Data Fig 7). Additional mechanisms by which KD or HFD reverse cardiac structural, molecular and functional remodeling induced by MPC deficiency in non-stressed heart should also be considered. For example, in addition to metabolic changes such as increased ketone and FA oxidation, KD may also mediate some of its effect via alternative mechanisms such as epigenetic changes that alter myocardial gene expression49,50.
Normal hearts initially develop compensated cardiac hypertrophy following acute pressure overload (PO) and this adaptation to PO requires energetic adaptations to the increased energy demand. As discussed above, increased anaplerosis via pyruvate carboxylation from both ME1 and PC is an important aspect of this adaptation. Without a functional MPC, entry of pyruvate into the CAC by alternative mechanisms that exist in cMPC1−/− hearts is preferentially partitioned to PDC rather than entering CAC pool as OAA or malate. Thus, the high energy demand induced by pressure overload does not appear to be supported by increased ME1 flux into anaplerosis, leading to the rapid failure of MPC-deficient hearts. The failure of short-term KD to rescue cMPC1−/− hearts when subjected to pressure overload identifies an indispensable requirement for MPC delivered pyruvate to support CAC flux in the face of pathological stress. However, long-term KD leads to adaptations that reverse age-dependent ventricular remodeling via molecular and metabolic mechanisms discussed above. These adaptations restore the ability of cMPC1−/− hearts to respond to an added hemodynamic stress such as pressure overload. Thus, the protective impact of KD to restore the adaptive response to pressure overload, does not depend solely on the immediate availability of this alternative substrate, but also on the reversal of pathogenic and molecular abnormalities that require a longer time course to regress.
Although the protection by KD feeding in cMPC1−/− hearts was dramatic, a protective role for KD in murine models of heart failure remain to be definitively resolved. Mild protection of KD feeding on a heart failure model induced by TAC+MI were published recently51. Fatty acid oxidation rates in murine models of pressure overload-induced heart failure in mice are reported to be reduced or unchanged and remains repressed when these hearts are exposed to a more readily oxidized substrate like ketones52. This contrasts with cMPC1−/− hearts that reveal increased utilization of fatty acids and ketones. Additional metabolic changes in the pressure-overload heart are also distinct from what was observed in the compensated hypertrophy stage in cMPC1−/− mice. For example, pressure overload is characterized by elevated anaplerosis via the carboxylation of pyruvate mediated by ME15,41. In rodents and humans with heart failure ME1 expression is induced41, which contrasts with cMPC1−/− hearts where ME1 expression was unchanged. Although a mismatch between glycolysis and glucose oxidation has been described following TAC, increasing ketone body utilization does not reverse this pattern52. This contrasts with cMPC1−/− mutants, which exhibit regression of heart failure and LV remodeling in concert with reduced accumulation of glycolytic intermediates and an overall increased dependence on fatty acid oxidation on a KD. Taken together, these observations make it unlikely that altered MPC expression or function can account for the metabolic characteristics of pressure-overloaded (TAC) hearts or the partial effect of ketogenic diets on murine hearts following TAC.
In conclusion, despite evidence for short-term adaptive mechanisms by which glucose derived carbons could enter the CAC in cMPC1−/− hearts, these hearts inexorably progress to heart failure and this inevitable cardiac dysfunction can be prevented by dramatically increasing the delivery of FA and ketones. We identify a conserved role for mitochondrial pyruvate uptake in the myocardium to mobilize glycolysis-derived pyruvate for mitochondrial metabolism. Without MPC-mediated pyruvate uptake, the accumulation of potentially toxic glycolytic intermediates and their metabolic by-products likely contributes to the maladaptive pathological hypertrophy, leading to age-dependent heart failure or accelerated heart failure in response to a hemodynamic stress. The complete inhibition of glycolysis and prevention of glycolytic metabolite accumulation by feeding alternate substrates parallels the reversal or prevention of LV remodeling.
Methods
Animal Experiments and Generation of Cardiomyocyte-restricted MPC1 Knockout Mice
Animal work was performed in accordance with protocols approved by the University of Iowa Institutional Animal Care and Use Committee (IACUC). Mice were maintained on rodent diet and water available ad libitum in a vivarium with a 12-hour light/dark cycle at 22°C and 30%−70% humidity. MPC1 cardiomyocyte-restricted knockout mice (cMPC1−/−) were generated by interbreeding MPC1flox/flox mice, with mice hemizygous for Cre recombinase under control of the myosin heavy chain 6 (αMHC) promoter, which results in the recombination of the LoxP sites and removal of exons 3–5. Experimental cohorts were generated by crossing MPC1flox/flox and MPC1flox/+ :αMHC-Cre mice to generate Mpc1flox/flox :αMHC-Cre (cMPC1−/−) and Mpc1flox/flox (WT) littermates, which were used as controls. For the ketogenic diet study, mice were fed with Teklad 2920X diet (control chow) or ketogenic diet (Bio-Serv, AIN-76A-Modified, Flemington, NJ). For high fat diet feeding, the normal control diet (NCD, D12450J) and high-fat diet (HFD, D12492) were purchased from Research Diets (New Brunswick, NJ), and the ketone ester (KE) chow was prepared by Research Diets using 2920X mixed with the 10% (vol/weight) R,S-butanediol diacetoacetate (KE) purchased from Keto Research Chemicals (Chicago, IL). The KE diet was supplemented with the addition of 200mM potassium β-HB to the drinking water.
Transmission Electron Microscopy
LV tissue was isolated and cut into small pieces (less than 1 mm3) and fixed with 2.5% glutaraldehyde (in 0.1 M sodium cacodylate buffer [pH 7.4]) overnight at 4°C and then post-fixed with 1% osmium tetroxide for 1 hour. Following serial alcohol dehydration (50%, 75%, 95%, and 100%), the samples were embedded in Epon 12 (Ted Pella, Redding, CA). Ultramicrotomy was performed, and ultrathin sections (70 nm) were post-stained with uranyl acetate and lead citrate. Samples were examined with a JEOL 1230 transmission electron microscope (Tokyo, Japan). Mitochondrial volume density, number, and size were quantified in a grid system.
Echocardiography
Transthoracic echocardiograms were acquired from sedated (midazolam 0.1 mg subcutaneous injection) mice. The anterior chest hair was removed with Nair™ and warmed gel was applied. The mouse was held gently by the nape of the neck and positioned in the left lateral position. Cardiac images were obtained via a 30-MHz linear array transducer applied to the chest. The transducer was coupled to a Vevo 2100 imager (VisualSonics, Toronto, Canada). Images of the short and long axis were obtained with a frame rate of ~180–250 Hz. All image analysis was performed offline using Vevo 2100 analysis software (Version 1.5). Endocardial and epicardial borders were traced on the short axis view in diastole and systole. Left ventricular length was measured from endocardial and epicardial borders to the left ventricular outflow tract in diastole and systole. The biplane area-length method was then performed to calculate left ventricular mass and ejection fraction.
Mitochondrial Pyruvate Uptake
Mitochondria were isolated in buffer containing 70 mmol/L sucrose, 210 mmol/L D-mannitol, 1 mmol/L EGTA, 0.5% fatty acid-free BSA, and 5 mmol/L HEPES pH 7.2. Mitochondria were resuspended in 100 μL of Uptake Buffer (120 mmol/L KCl, 5 mmol/L KH2PO4, 1 mmol/L EGTA, 5 mmol/L HEPES, pH 7.4, 1 μmol/L Rotenone, and 1 μmol/L Antimycin A) and were aliquoted into two 30 μL aliquots. One aliquot was treated with 2 mM α-Cyano-4-hydroxycinnamic acid (CHC, Sigma-Aldrich 476870, St. Louis, MO) and the other was treated with a volume of uptake buffer equal to the volume of CHC added. The remaining untreated resuspension was used to perform a protein assay for normalization. 30 μL of treated mitochondria were rapidly mixed with 30 μL of 2X Pyruvate buffer (Uptake buffer, pH 6.1, containing 0.1 mM [2-14C]-pyruvate (Perkin Elmer NEC256050UC, Hebron, KY)), generating the pH gradient needed to initiate uptake. The final concentration of 14C-pyruvate was 0.05 mM. 100 μL of Stop buffer (Uptake Buffer, pH 6.8, supplemented with 10 mmol/L CHC) was added to halt uptake 60 seconds after uptake was initiated. Mitochondria were recovered by passing the solution through a 0.8 μm cellulose filter (Millipore AAWP-142–50, Burlington, MA) and a 0.45 μm nitrocellulose filter (Bio-Rad 162–0115, Hercules, CA). Filters were washed twice with 200 μL Wash buffer (Uptake Buffer, pH 6.8, supplemented with 2 mmol/L CHC and 5 mmol/L Pyruvate) and placed into scintillation vials for quantification. The assays were conducted with all buffers and reaction vessels cooled to 4°C and maintained throughout the assay period on wet ice. Mitochondria pre-treated with CHC were used as a negative control and counts were subtracted from non-pre-treated mitochondria. Although rotenone and antimycin A are included in assay buffer to ablate electron transport chain (ETC) activity, limited pyruvate oxidation via pyruvate dehydrogenase or other metabolic reactions may occur during the assay until cofactors are depleted or through trace residual ETC activity. However, because of the proton gradient experimentally generated by the ΔpH of 0.6 units between the mitochondria and the extra mitochondrial pyruvate containing media, pyruvate uptake, which is proton-dependent, is expected to remain rate-limiting during the linear phase of pyruvate uptake assay. In the event of limited pyruvate oxidation, the use of [2-14C]-pyruvate ensures that 14C persists within mitochondria for a full turn of the TCA cycle. Therefore, 14C counts were interpreted as mitochondrial pyruvate uptake.
Mitochondrial Respiration
Fresh whole hearts were used to isolate mitochondria. Mitochondria were isolated in buffer containing 70 mmol/L sucrose, 210 mmol/L D-mannitol, 1 mmol/L EGTA, 0.5% fatty acid-free BSA, and 5 mmol/L HEPES pH 7.2. Mitochondria were resuspended and protein concentration was determined by the Bradford method (ThermoFisher Scientific, 23236, Waltham, MA). OCR measurements were performed in isolated mitochondria using the Seahorse XFe24 (Agilent, Santa Clara, CA) according to the manufacturer’s instructions. Mitochondria were loaded into plates for the assays at a concentration of 10 μg/well. Isolation buffer was replaced by pre-warmed unbuffered DMEM (Sigma, St. Louis, MO) and equilibrated for 1 h at 37 °C. Oligomycin (2 μmol/L), FCCP (0.4 μmol/L), rotenone (0.5 μmol/L) and antimycin A (0.5 μmol/L) were dissolved in assay medium and loaded on sensor cartridge ports. Oxygen consumption was detected under basal conditions followed by the sequential addition of the indicated drugs.
Gene Expression Analysis
Hearts were excised, rinsed in ice-cold PBS and snap-frozen. RNA from ventricular tissue was extracted using TRIzol (Life Technologies, 15596018, Waltham, MA). The RNA was quantified with a Nanodrop 2000 Spectrophotometer (ThermoFisher Scientific, Waltham, MA). Complementary DNA was generated with the High-Capacity cDNA Reverse Transcription Kit (Applied Biosystems 4368814, Waltham, MA) using the oligo(dT)12–18 primer (ThermoFisher Scientific, Waltham, MA) and analyzed by real-time PCR using SYBR green chemistry (ThermoFisher Scientific, 4367659). Primers were designed using Primer-BLAST53 and are listed in Supplementary Table 1. QPCR standard curves were plotted using serial dilutions of cDNA of the analyzed samples. At least 4 dilution points were used to plot the standard curve and the efficiency of all primer sets was between 80 and 120%. The housekeeping gene RP16S was used as an internal control for cDNA quantification and normalization of the amplified products. All data are reported as mean ± SE.
Immunoblot Analysis
Heart tissue was homogenized in RIPA buffer (50 mmol/L Tris-HCl pH 8.0, 150 mmol/L NaCl, 0.5% sodium deoxycholate, 0.1% sodium dodecyl sulfate, 1.0% NP-40) with 1X protease inhibitor (ThermoFisher Scientific, 78440, Waltham, MA). Homogenates were incubated on ice for 30 minutes and centrifuged at 16,000g before the supernatants were collected. Protein concentration was determined using the BCA kit (ThermoFisher Scientific, 23225). Proteins were separated by tris-glycine gels, transferred to 0.22 μm PVDF membrane (Millipore, IPVH00010, Burlington, MA), and blocked with TBST (50 mmol/L Tris, 150 mmol/L NaCl, and 0.05% Tween-20) supplemented with 5% nonfat dry milk (Bio-Rad, 1706404XTU, Hercules, CA), incubated with primary antibodies at 4℃ overnight and fluorescent secondary antibodies (Cell Signaling Technology, 5366 & 5257, Danvers, MA) for 1 hour, and visualized using the LiCor Odyssey CLx system (LI-COR Biotechnology, Lincoln, NE). Primary antibody information is listed in Suppl. Table 2.
In-situ Metabolomics
Heart samples were freeze-clamped and stored at −80 ℃. Frozen tissue was lyophilized overnight and then extracted in 720μL of methanol, acetonitrile and water in a 2:2:1 ratio. The standards mixture (1mg/ml of D4-succinate, D8-valine, D4-citrate, 13C5-glutamine, 13C5-glutamate, 13C6-lysine, 13C5-methionine, 13C3-serine and 13C11-tryptophan) was added into the extraction buffer at a 1:1000 ratio before use. Tissues were placed in tubes with ceramic beads and extracted using a Bead Mill Homogenizer (Bead Ruptor Elite, Omni International, Kennesaw, GA) at 6.45 m/s for 30 sec. After rotating at −20 °C for 1 hour, sample tubes were centrifuged at 21,000 g for 10 minutes and then the supernatant (~400 μL) was transferred to a new tube to dry at room temperature in a Savant™ SPD131DDA SpeedVac™ Concentrator (ThermoFisher Scientific, Waltham, MA).
For liquid chromatography-mass spectrometry (LC-MS), 40 μL of acetonitrile/water (1:1) was added into the completely dried samples and vortexed to completely dissolve. After centrifuging at 21,000g for 5min, supernatants were transferred to the LC tube for the assay. LC-MS-based analyses were performed on a Millipore SeQuant ZIC-pHILIC (2.1 × 150 mm, 5 μm particle size) with a ZIC-pHILIC guard column (20 × 2.1 mm, Sigma-Aldrich, St. Louis, MO) coupled to a Thermo Q Exactive hybrid quadrupole Orbitrap mass spectrometer with a Vanquish Flex UHPLC system (ThermoFisher Scientific, Waltham, MA). The chromatographic gradient was run at a flow rate of 0.150 mL/min as follows: 0–20 min—linear gradient from 80 to 20% Buffer B (CH3CN, mixed with 20 to 80% of Buffer A: 20 mmol/L ammonium carbonate and 0.1% ammonium hydroxide respectively); 20–20.5 min—linear gradient from 20 to 80% Buffer B; and 20.5–28 min—hold at 80% Buffer B. The mass spectrometer was operated in full-scan, polarity-switching mode, with the spray voltage set to 3.0 kV, the heated capillary held at 275 °C, and the HESI probe held at 350 °C. The sheath gas flow was set to 40 units, the auxiliary gas flow was set to 15 units, and the sweep gas flow was set to 1 unit. MS data acquisition was performed in a range of m/z 70–1,000, with the resolution set at 70,000, the AGC target at 1 × 10⁶, and the maximum injection time at 20 ms.
For gas chromatography–mass spectrometry (GC-MS), samples were derivatized using a combination of methoxyamine and pyrimidine (MOX solution). MOX solution was made by adding methoxyamine in anhydrous pyridine to achieve 11.4mg/mL. The pyridine was extracted from the bottle under a continuous flow of nitrogen using a dry syringe and a nitrogen adapter. 30 μL of the MOX solution was added into the dried extracts, vortexed for 10 min and followed by heating at 60 °C for 1 hour. Then, 20 μL of N-Methyl-N-(trimethylsilyl) trifluoroacetamide reagent (TMS) was added to the 30 μL solution, vortexed for 1 min and heated at 60 °C for 30 min. The GC-MS data were acquired using a Trace 1310 Gas Chromatograph (ThermoFisher, Waltham, MA) coupled with an ISQ LT Single Quadrupole Mass Spectrometer (ThermoFisher, Waltham, MA). GC was performed using a TraceGOLD TG-5SilMS GC Column (30m × 0.25mm I.D., coated with a 0.25μm film, ThermoFisher, Waltham, MA). The GC conditions were as follows: initial oven temperature of 80ᵒC held for 3 minutes, followed by a temperature ramp of 20ᵒC/min to 280ᵒC with a final hold at 280ᵒC for 8 minutes. Helium was used as a carrier gas with a flow rate of 1.2mL/min. The mass spectrometer was operated by electron impact ionization at 70eV and the scan mode was selected ion monitoring (SIM).
Both LC-MS and GC-MS, data was collected using Xcalibur™ Software (ThermoFisher, Waltham, MA). Metabolite peak detection were performed by TraceFinder General Quant (Thermo Scientific, Waltham, MA). Metabolites were identified using an in-house library developed from purchased standards. Metabolomics data was analyzed by MetaboAnalyst (http://www.metaboanalyst.ca).
Isolated Working Heart Perfusion
Langendorff heart perfusion was initially prepared as previously described54. In brief, hearts from WT and cMPC1−/− mice were excised after isoflurane anesthesia, and then cannulated and retrogradely perfused with modified Krebs-Henseleit buffer (118.5 mmol/L NaCl, 4.7 mmol/L KCl, 2 mmol/L CaCl2, 1.2 mmol/L MgSO4, and 1.2 mmol/L KH2PO4, 17.3 mM NaHCO3). After a stable perfusion for 5min, the perfusion line was switched to the working heart mode (pre-load at 10 mmH2O and after-load at 60 mmH2O) with modified Krebs-Henseleit buffer equilibrated with 95% O2/5% CO2, containing 0.4 mmol/L palmitate bound to bovine serum albumin in a 3:1 ratio, 5 mmol/L glucose, 0.5 mmol/L sodium pyruvate and 1 mmol/L sodium lactate. Buffer temperature was maintained at 39℃. Glucose oxidation and glycolysis were measured in one cohort of perfused hearts, and palmitate oxidation was measured in the second cohort. Glucose oxidation was determined by capturing 14CO2 released from the oxidation of [U-14C6]-glucose (PerkinElmer, specific activity, 296 MBq/mol). Glycolytic flux was measured by the amount of 3H2O released from the metabolism of exogenous [5-3H]-glucose (PerkinElmer, specific activity, 177 MBq/mol). Palmitate oxidation was assessed from the amount of 3H2O oxidized from the [9,10-3H2]-palmitate (PerkinElmer, specific activity, 42 GBq/mol).
The perfusion lasted for 1 hour and buffer samples were collected from the circulating system every 20 min. Cardiac function, including heart rate (HR, in beat/min), and developed pressure (DevP, in mm Hg), was monitored by a Millar pressure catheter (Millar Instruments, Houston, TX). Oxygen content and coronary flow were recorded every 20 min throughout the 1-hour perfusion.
The oxygen content of freshly oxygenated buffer (arterial partial pressure of oxygen [PaO2]) and oxygen concentration in the pulmonary artery effluent (venous partial pressure of oxygen [PvO2]) were collected using a capillary tube and measured using a fiber optic oxygen sensor (Ocean Optics, Orlando, FL). Myocardial O2 consumption (MVO2), cardiac hydraulic work (CHW), and cardiac efficiency (CE) were calculated using the following formulas.
Myocardial O2 consumption, in μmole · min−1 · g−1 dry heart weight (DHW), was determined as follows: MVO2 = [(PaO2 − PvO2)/100] · (coronary flow/DHW) · 0.0393 · (1000 · C), where PaO2 is the arterial partial pressure of oxygen in mm Hg, PvO2 the venous partial pressure of oxygen in mm Hg and C is the Bunsen coefficient for plasma, i.e., 0.0212. MVO2 (ml/min) was converted to μmol/min by multiplying by the conversion factor 0.0393.
Cardiac hydraulic work, in J · min−1 · g−1 WHW, was determined as follows: CHW = CO · DevP · 1.33 · 10−4/g WHW, where CO is the cardiac output in ml/min.
Cardiac efficiency, as a percentage, was determined as follows: CE = CHW/MVO2 · 100.
MVO2 (ml/min) was converted to μmol/min by multiplying by the conversion factor 0.0393 and then to joules per min (J/min) using the conversion formula of 1 μmol O2 = 0.4478 J.
Metabolite concentration and 13C-flux analysis by GC-MS
GC‐MS was performed to measure the tissue concentration and 13C‐enrichment of CAC intermediates, pyruvate, lactate and intracellular free amino acids as described previously55,56. Hearts from both control and cMPC1−/− mice were perfused retrogradely through the aorta at a constant pressure of 70 mmHg with a nonrecirculating modified Krebs buffer containing (in mmol/L) 118.5 NaCl, 4.7 KCl, 1.5 CaCl2, 1.2 KH2PO4, 1.2 MgSO4, 17.3 mM NaHCO3 (pH 7.4) and various substrates (in mmol/L: glucose 10; lactate 0.5; palmitate bound BSA 0.4; β-hydroxybutyrate (β-HB) 0.1; glutamine 0.5; pyruvate 0.2). Cardiac function was monitored by LabChart system using a Millar catheter connected to a balloon filled with water. The balloon was inserted into left ventricle and the diastolic pressure was set to 5–10 mmHg. Hearts were perfused with unlabeled substrates, freeze-clamped and extracted with 70% methanol and 1 mol/L hydroxylamine (pH 7.6). Tissue lysate was mixed with the mixture containing internal and external standards. The mixture of organic acids (OA) standards included 200 nmol 13C3-lactic acid, 60 nmol 13C3-pyruvic acid, 30 nmol 13C4-β-hydroxybutyric acid, 20 nmol 13C4-α-ketobutyric acid, 20 nmol citrate, 20 nmol 13C4-α-ketoglutarate, 20 nmol D4-succinate and 20 nmol D3-malate. The mixture of amino acids (AA) external standards included 13C3-alanine, 13C2-glycine, 13C5-valine, 13C6,15N-leucine, 13C6-isoleucine, 13C5,15N-proline, 13C5-methionine, 13C5,15N-serine, 13C4,15N-threonine, D5-phenylalanine, 13C4,15N-aspartate, 13C5,15N-glutamate, 13C6-arginine, 13C9-tyrosine, 13C6-histidine. Samples were homogenized with 2.8 mm zirconium oxide beads (Omni International, Kennesaw, GA). Lysates were added with 1 mol/L hydrochloric acid (pH between 5 and 6) to incubate at 70 °C for 15 min and then centrifuged at 22,000 g for 10 min. The supernatant was evaporated, rinsed once with 100% methanol, and drained twice with ammonium sulfate. After a quick centrifugation at 7,000 g, the supernatant was evaporated again, samples were solubilized in 100% pyridine at 45 °C for 90 min and followed by derivatization using N-methyl-N-tertbutyldimethylsilyltrifluoroacetamide at 90 °C for 4 h. Samples were injected into an Agilent 6890N chromatograph coupled to a 5975N mass spectrometer operated in electronic ionization mode (helium gas) at a flow rate maintained throughout (OA: 23.3 ml/min and AA: 20.1 ml/min) in split mode (OA: 28:1 and AA: 23.2:1). The temperature program for OA was fixed as followed: 150 °C for 5min, increment of 10°C /min up to 300°C, and then 20 °C/min up to 320 °C. For AA, the temperature program was set as: 150 °C for 3min, increment of 7 °C/min up to 210 °C and maintained constant for 3min, increment of 7 °C/min up to 310 °C and maintained for 3min and then 10 °C/min up to 320 °C. Metabolites were identified according to m/z and retention time and quantified using internal or external standards and standard curves.
For 13C-labeling experiments, unlabeled glucose or glutamine was replaced by U-13C6-glucose or U-13C5-glutamine, respectively. The perfusate was gassed with 5% CO2-95% O2. The hearts were perfused with unlabeled substrates for 15 min to reach stabilization and then the buffer was switched to the labeled substrate and the perfusion continued for 30 min. Hearts were freeze-clamped and saved immediately after perfusion and analyzed via GC-MS. Procedures for determination of concentrations and 13C-labeling of metabolites (citrate, OAA, α-KG, succinate, malate, fumarate, pyruvate, lactate, alanine and serine) were performed as previously described56 with slight modifications. Briefly, metabolites were extracted from pulverized heart powder using 70% methanol. The 13C-labeling of the OAA moiety of citrate (OAACIT) was assessed as previously described55.
The absolute concentrations and 13C-enrichment of pyruvate, lactate, amino acids (alanine, serine, glutamate, glutamine, leucine, isoleucine and valine) and CAC intermediates (citrate, α‐KG, succinate, fumarate, and malate) in the extracted tissue was measured by GC‐MS using an Agilent 6890N gas chromatograph equipped with a HP‐5 column coupled to a 5975N mass spectrometer (Agilent Technologies, Santa Clara, CA) as described before55. Raw data was collected by GC/MSD ChemStation. Data are presented as molar percent enrichment (MPE).
where A represents the peak area of each fragmentogram, measured by computer integration and corrected for naturally occurring heavy isotopes and i ranges from 0 to n, where n stands for the number of carbon atoms. Mass isotopomers of metabolites containing 1 to n 13C‐labeled atoms were identified as M+i, with i=1, 2, … n.
The relative contribution of pyruvate to the formation of citrate via decarboxylation to acetyl-CoA (PDC) and via carboxylation (PC) to OAA or malate (via pyruvate carboxylase or NADP+-linked malic enzyme, respectively) is expressed relative to citrate synthase (CS) and was assessed from the 13C-labeling of tissue citrate, OAACIT, pyruvate and succinate as previously described in detail55. The percent 13C-labeled citrate recycling into the CAC (% citrate recycling) was estimated as previously reported55,57.
Briefly, the equations of PDC/CS and PC/CS were listed as equation 1 and 2, respectively.
| Equation 1: |
| Equation 2: |
The M+3 OAACIT were calculated as equation 3:
The DF and M+3 OAAPR were calculated as equation 4 and 5 respectively.
| Equation 4: |
| Equation 5: |
The % citrate recycling was calculated as equation 6:
In vitro NMR
Hearts from both control and cMPC1−/− mice were perfused retrogradely through the aorta at a constant pressure of 70 mmHg with a nonrecirculating modified Krebs buffer containing (in mmol/L) 118.5 NaCl, 4.7 KCl, 1.5 CaCl2, 1.2 KH2PO4, 1.2 MgSO4, 17.3 mM NaHCO3 (pH 7.4) and various substrates (in mmol/L): glucose 10; lactate 0.5; palmitate bound BSA 0.4; β-HB 0.1; glutamine 0.5; pyruvate 0.2. The perfusate was gassed with 5% CO2-95% O2 and the water-filled balloon was inserted into left ventricle and the pressure set to 5–10 mmHg. The hearts were perfused with unlabeled substrates for 15 min to reach stabilization and then the buffer was switched to the labeled substrate and the perfusion continued for 30 min. Hearts were snap-frozen and saved immediately after perfusion. Perfused hearts were extracted by perchloric acid, lyophilized and reconstituted in deuterium oxide. High-resolution proton-decoupled 13C NMR spectra were collected from acid extracts of hearts perfused with 13C enriched substrates in a 14.1 T NMR system (Bruker Instruments, Billerica, MA). Analysis of glutamate isotopomers and isotopologues from in vitro 13C NMR of acid extracts of myocardium perfused with 13C-enriched substrates provided the ratio of anaplerosis to citrate synthase (y) and the fractional 13C-enrichment of acetyl-CoA from 13C-β-HB (Fc) entering the CAC cycle. The fractional 13C-enrichment of glutamate in myocardium was quantified by signal intensity relative to a standard 13C NMR spectrum of 100 mmol/L glutamate and quantification of tissue glutamate via UV spectrophotometry58.
13C-labeled Metabolite Analyses in Perfused Hearts by LC-MS
Lyophilized heart extracts from hearts perfused with [2,4-13C2]-β-HB were analyzed by LC-MS as previously reported59. Briefly, the analysis was performed using a Dionex Ultimate 3000 RSLC liquid chromatograph with Thermo Q-Exactive Plus mass spectrometer equipped with a heated ESI source. Samples were injected and separated on a Luna Aminopropyl (100 × 1 mm, 3 μL) column using mobile phases A (10 mM ammonium acetate/10 mM ammonium hydroxide in 95% water), and B (10 mM ammonium acetate/10 mM ammonium hydroxide in 95% AcN). Separation was performed using binary gradient of 75–0% B for 45 min, then 0% B for 12 min, and 75% B for 13 min at flow rate 50 μL/min and column temperature at 30°C. The mass spectrometer was operated in negative mode (m/z 68–1020) with optimized HESI source conditions: auxiliary gas 10, sweep gas 1, sheet gas flow at 35 (arbitrary unit), spray voltage −3 kV, capillary temperature 275°C, S-lens RF 50, and auxiliary gas temperature 150°C. AGC target was set at 1e6 ions and Resolution at 70,000. Before analysis, the mass spectrometer was calibrated to fully optimize mass accuracy performance. Before and after sample analysis, the QC samples were analyzed to ensure high quality of the data. Samples within the sequence were injected in randomized order to minimize the possibility of column carry-over. The RAW files were collected and converted into mzXML format using Xcalibur™ software. The mzXML files were divided into two groups and analyzed using X13CMS R package. Metabolites were identified based on the m/z and retention times compared to standard counterparts analyzed using the same conditions. Data are presented as fractional enrichment.
Histology
Mouse hearts were fixed in 10% Zinc-formalin, embedded in paraffin, proportioned into 5-μm sections and stained with Hematoxylin and Eosin (H&E) and Trichrome under standard protocols. Images were obtained using the Olympus BX-61 microscope (Olympus, Center Valley, PA) and Leica Aperio Ariol Automated Slide Scanner (Leica Biosystems, Buffalo Grove, IL). Cardiac fibrosis area was quantified using ImageJ.
Glycogen Assay
Heart tissue from control and cMPC1−/− mice was freeze-clamped and extracted in ice-cold 0.3 mol/L perchloric acid solution. The extract was incubated with and without amyloglucosidase (Sigma-Aldrich A7095) in 50 mmol/L acetate (pH 5.5) and 0.02% BSA. Absorbance at 340 nm was compared with a series of standard samples (0–80 mmol/L glucose solution). Results are presented as glucose released from glycogen and normalized to tissue weight.
Transverse Aortic Constriction
Mice were anesthetized with ketamine/xylazine (100 mg/kg/5 mg/kg) via intraperitoneal injection, intubated with a 20-gauge poly-ethylene tube and ventilated with a small rodent ventilator (Harvard Apparatus, Holliston, MA). An opening was created between the second and third intercostal space where the aortic arch could be visualized. Transverse aortic constriction was performed by tightening a ligature with 7–0 PROLENE suture against a 27-gauge needle. The sham group was subjected to the same procedure but not banded. The skin was closed using 6–0 ETHILON nylon sutures. Mice were then removed from the ventilator, extubated and anesthesia stopped. Following recovery, mice were administered buprenorphine (1 mg/kg subcutaneous injection) twice a day for 48 hours.
Data Analysis
All data are presented as means ± standard error of the mean (SEM). Unpaired Student’s t-test was performed for the comparison of two groups (Control and cMPC1−/− groups). Two-way ANOVA was performed to analyze the differences by genotype and chow between 4 groups (such as Control and cMPC1−/− under regular chow and KD/HFD), followed by Tukey multiple comparison test. Statistical analysis was performed using the GraphPad Prism software (GraphPad, La Jolla, CA). For all analyses, a probability value of less than 0.05 was regarded as significantly different.
Data availability Statement
Source data for western blots are provided with this paper. All other data that support the findings of this study are available from the corresponding author upon reasonable request.
Extended Data
Extended Data Fig. 1. Mitochondrial Characterization of cMPC1−/− hearts.
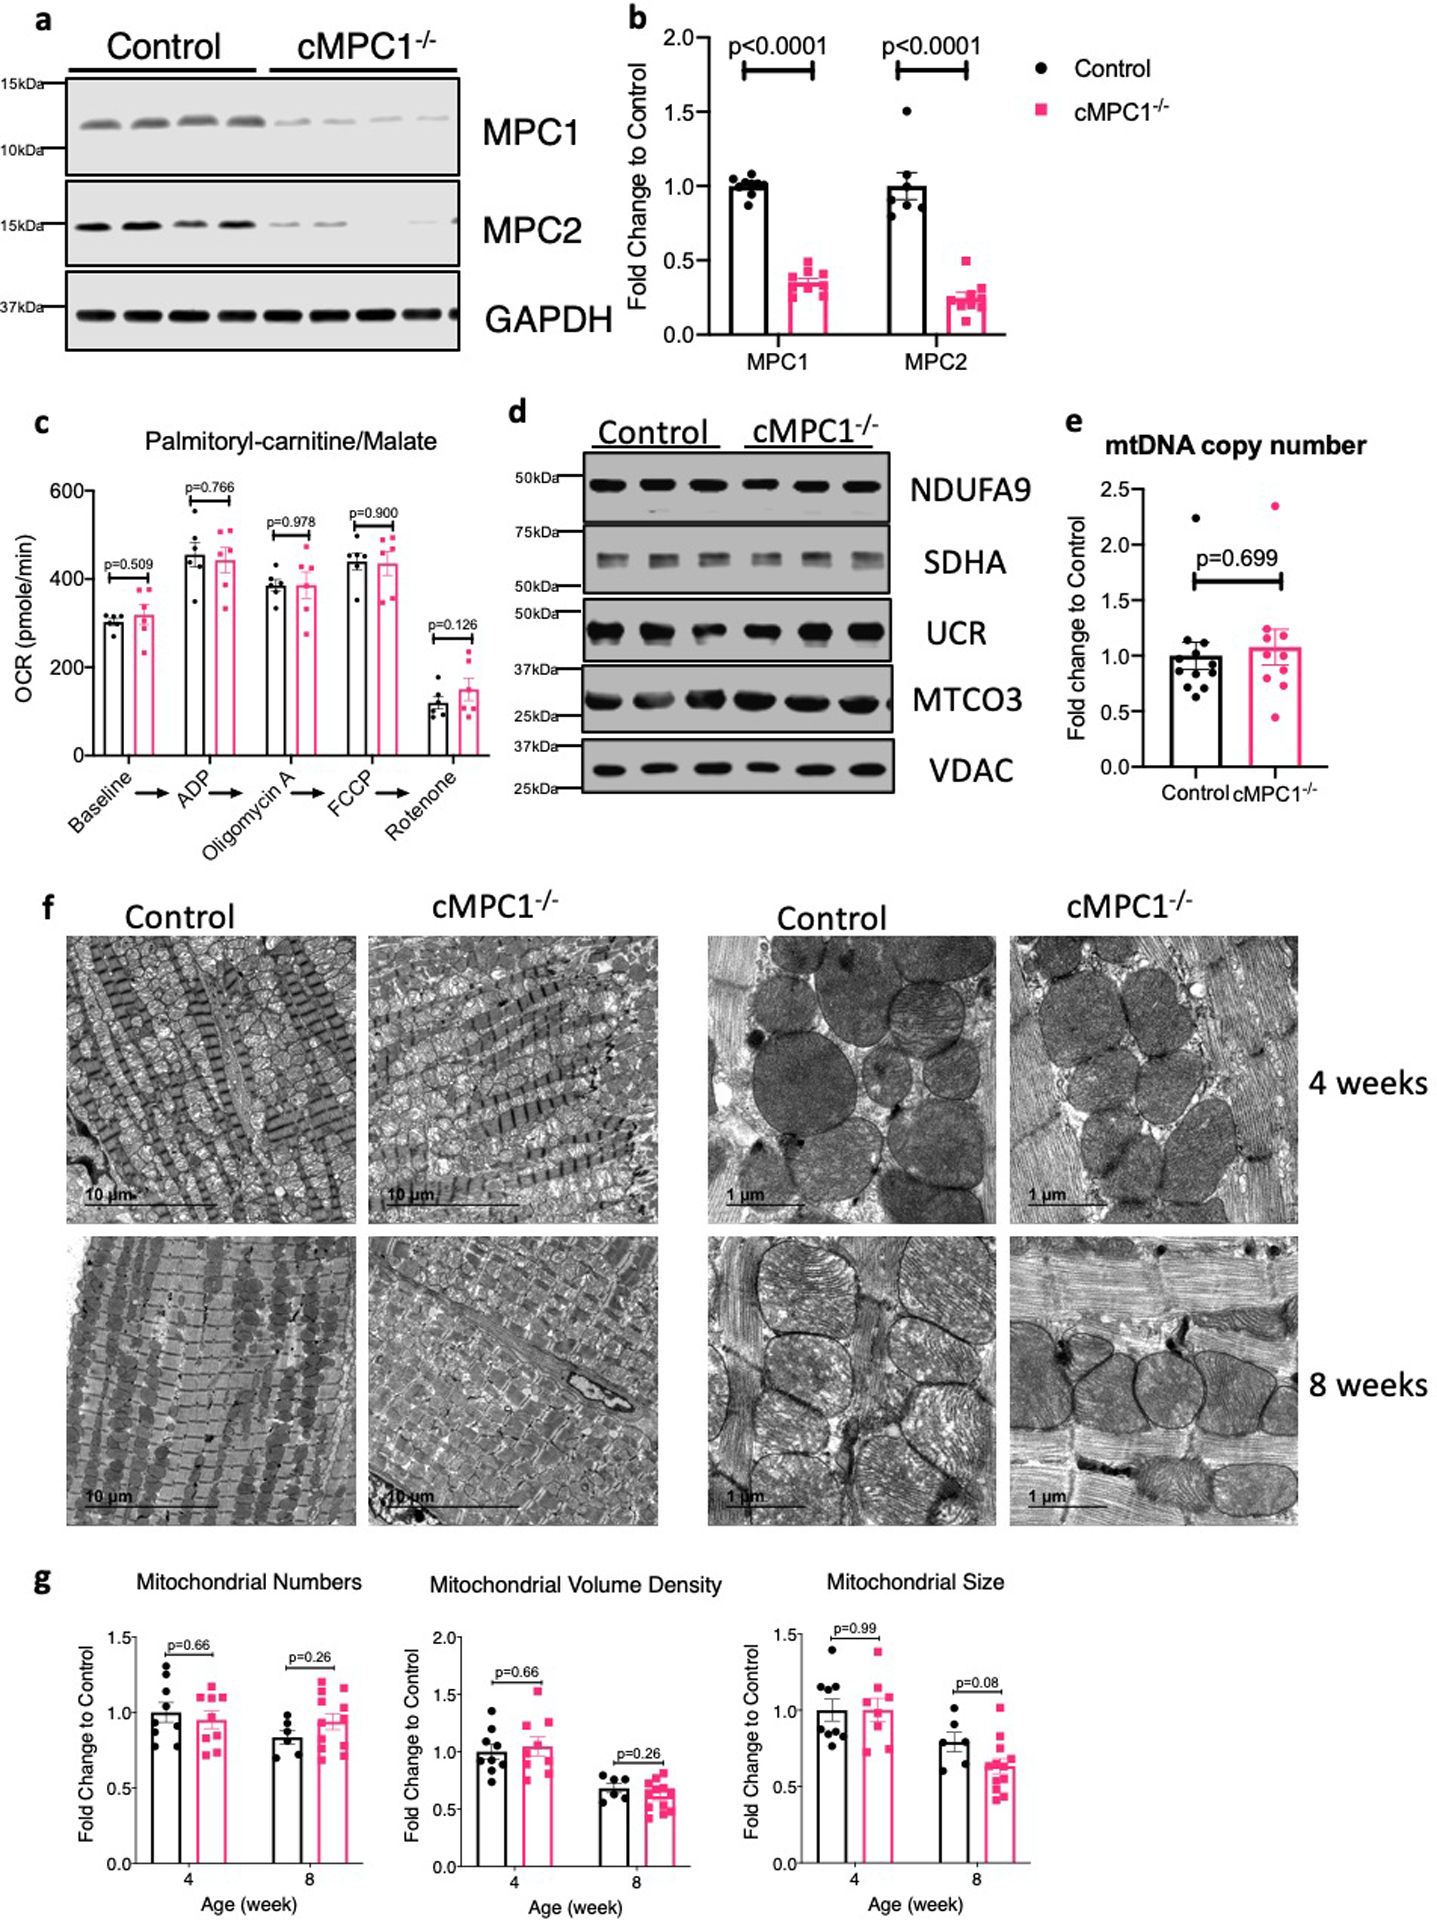
(a-b) MPC protein levels were determined by Western blots in whole heart lysates from 4-week-old cMPC1−/− mice. Images are representative of n=8 per group. (c) Palmitoyl-carnitine driven oxygen consumption by seahorse respirometry in isolated mitochondria (n=6 both groups). (d) Expression of selected electron transport chain (ETC) subunits (Complexes I–V) and VDAC by Western blot in heart lysates from control and cMPC1−/− mice. Images are representative of n=3 per group. (e) mtDNA copy number determined by qPCR analysis and normalized to the nuclear gene RPL13A in 8-week-old cMPC1−/− hearts (Control, 12; cMPC1−/−, 10). (f) Representative TEM images of cMPC1−/− hearts from 4 and 8-week-old mice. Images are representative of n=9 (4-week-old control and cMPC1−/−)/6(8-week-old control)/12(8-week-old cMPC1−/−). (g) Quantification of mitochondrial number, volume density and size (4 weeks: Control, 9; cMPC1−/−, 9; 8 weeks: Control, 6; cMPC1−/−, 12). Data are presented as mean ± SEM and analyzed by two-tailed unpaired Student’s t-test.
Extended Data Fig. 2. Glycolysis enzymes and intermediates in cMPC1−/− hearts.
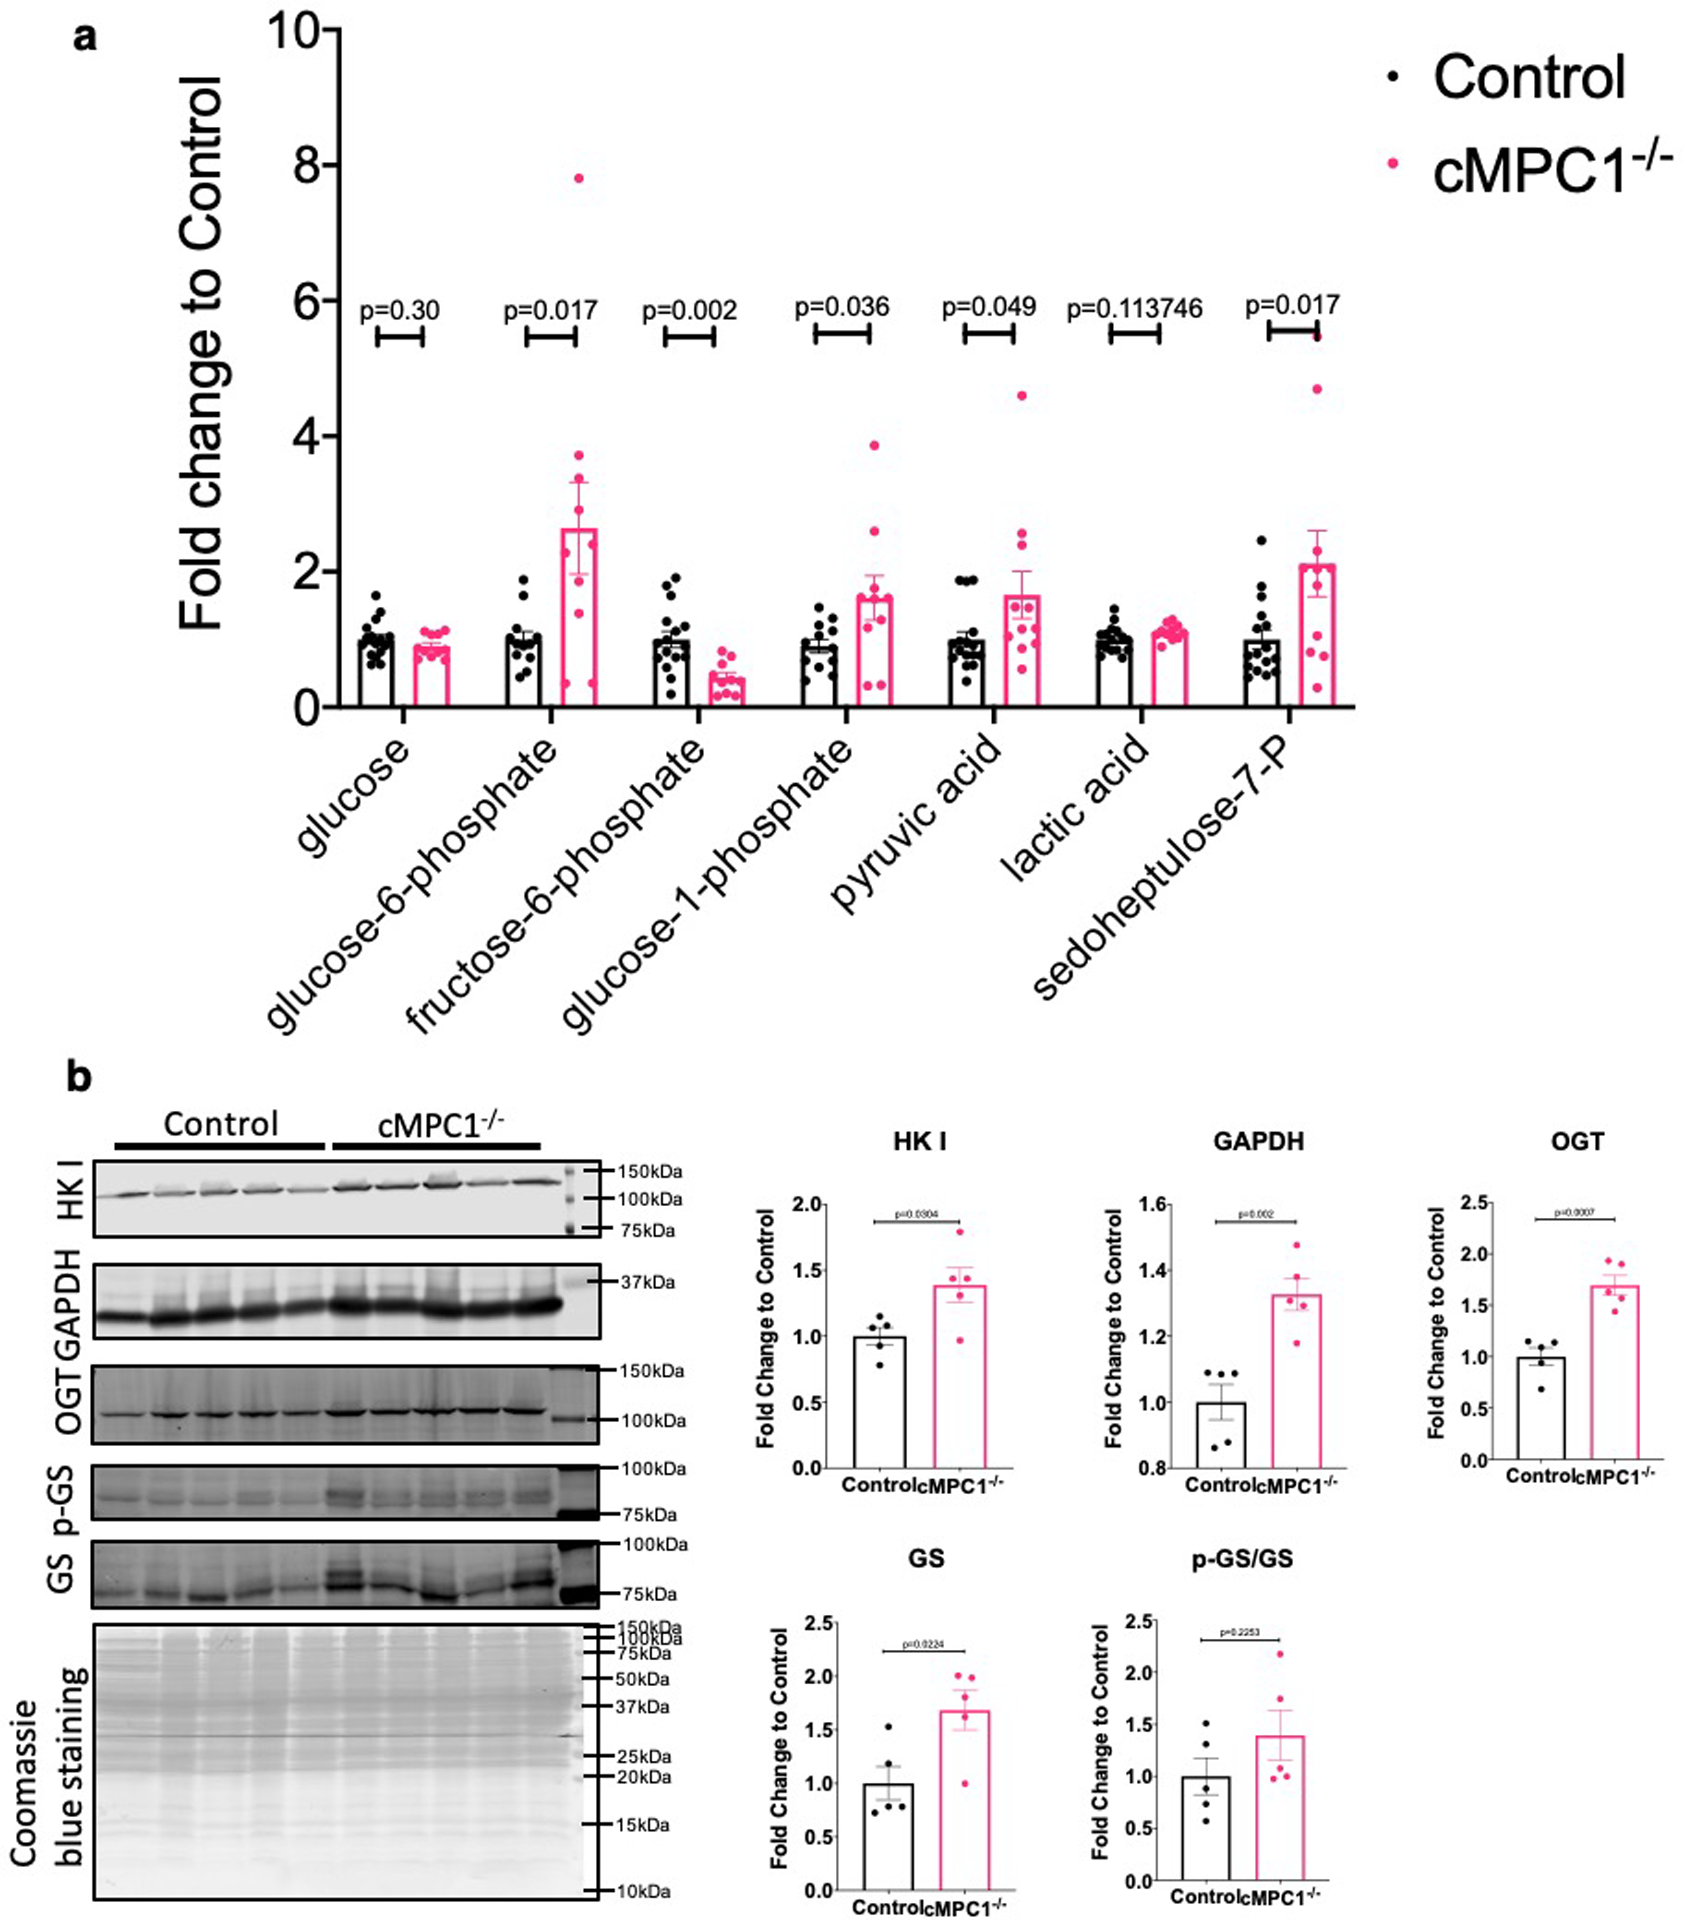
(a) Glycolysis-derived metabolic intermediates in 8-week-old control and cMPC1−/− hearts were determined by GC-MS. Mice were random fed before sacrifice. (Control, 15; cMPC1−/−, 11). (b) hexokinase I (HK I), GAPDH, O-GlcNAc transferase (OGT) and glycogen synthase (GS) blots were performed in lysates of cardiomyocytes isolated from 8-week-old control and cMPC1−/− mice. Protein quantification was normalized to total Coomassie blue staining. (n=5 both groups). Data are presented as mean ± SEM and analyzed by two-tailed unpaired Student’s t-test.
Extended Data Fig. 3. Flux scheme of 13C-labeled substrate utilization in cMPC1−/− hearts.
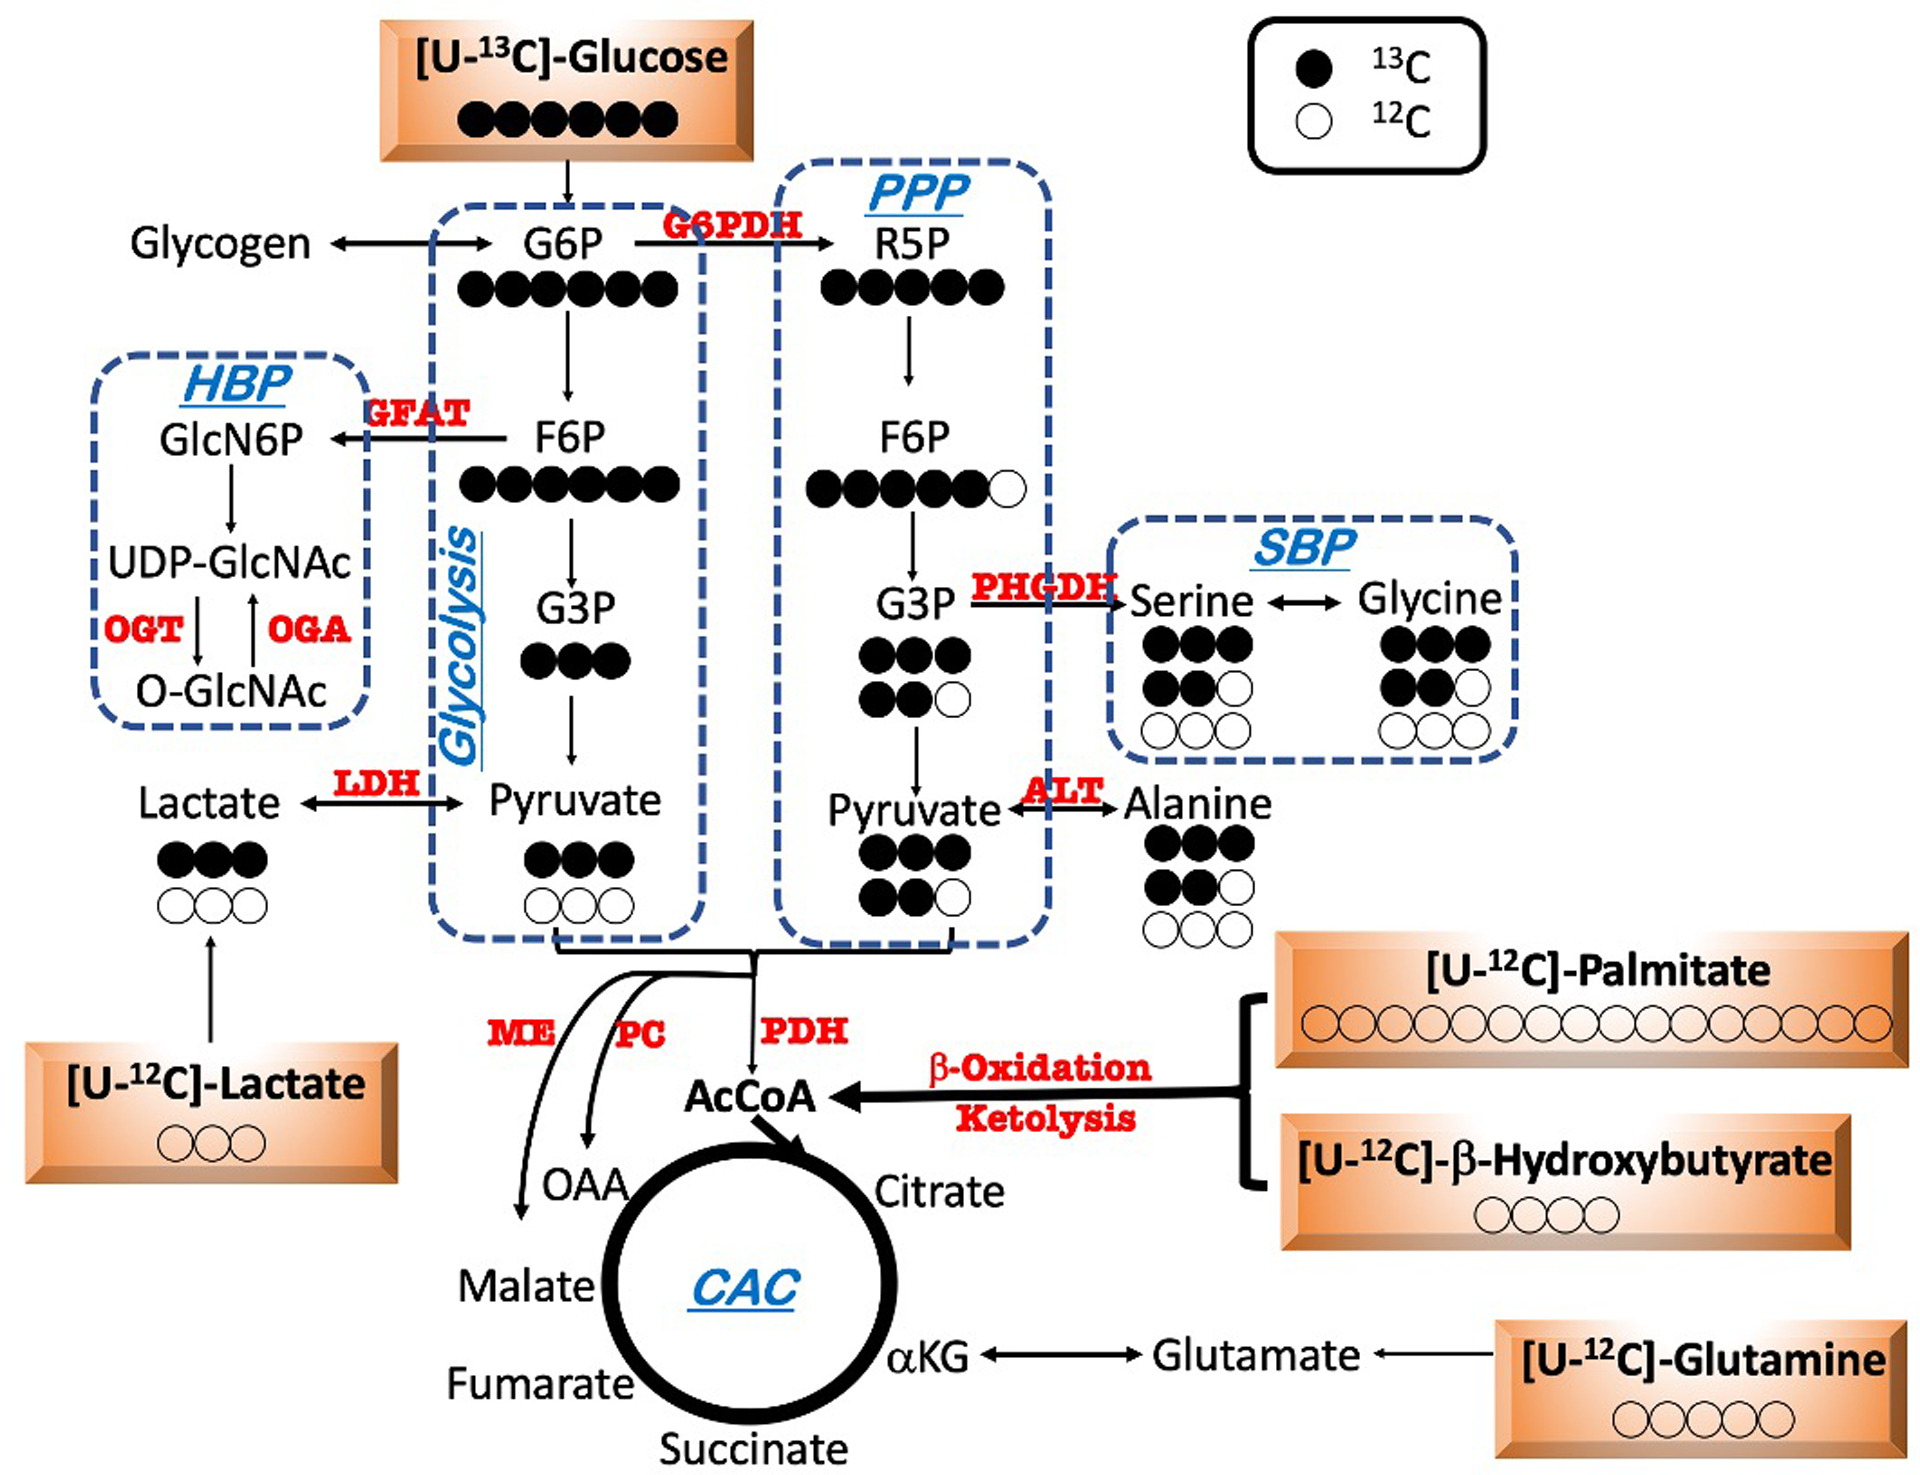
Schematic depicting metabolic fate of uniformly labeled glucose ([U-13C6]-glucose) into glycolysis, the pentose phosphate pathway (PPP), serine biosynthesis pathway (SBP) and the Citric Acid Cycle (CAC). Closed and open circles represent 13C-labeled and 12C-labeled carbons respectively.
Extended Data Fig. 4. 13C-MPE for pyruvate, lactate, alanine and serine from [U-13C6]-glucose perfusion.
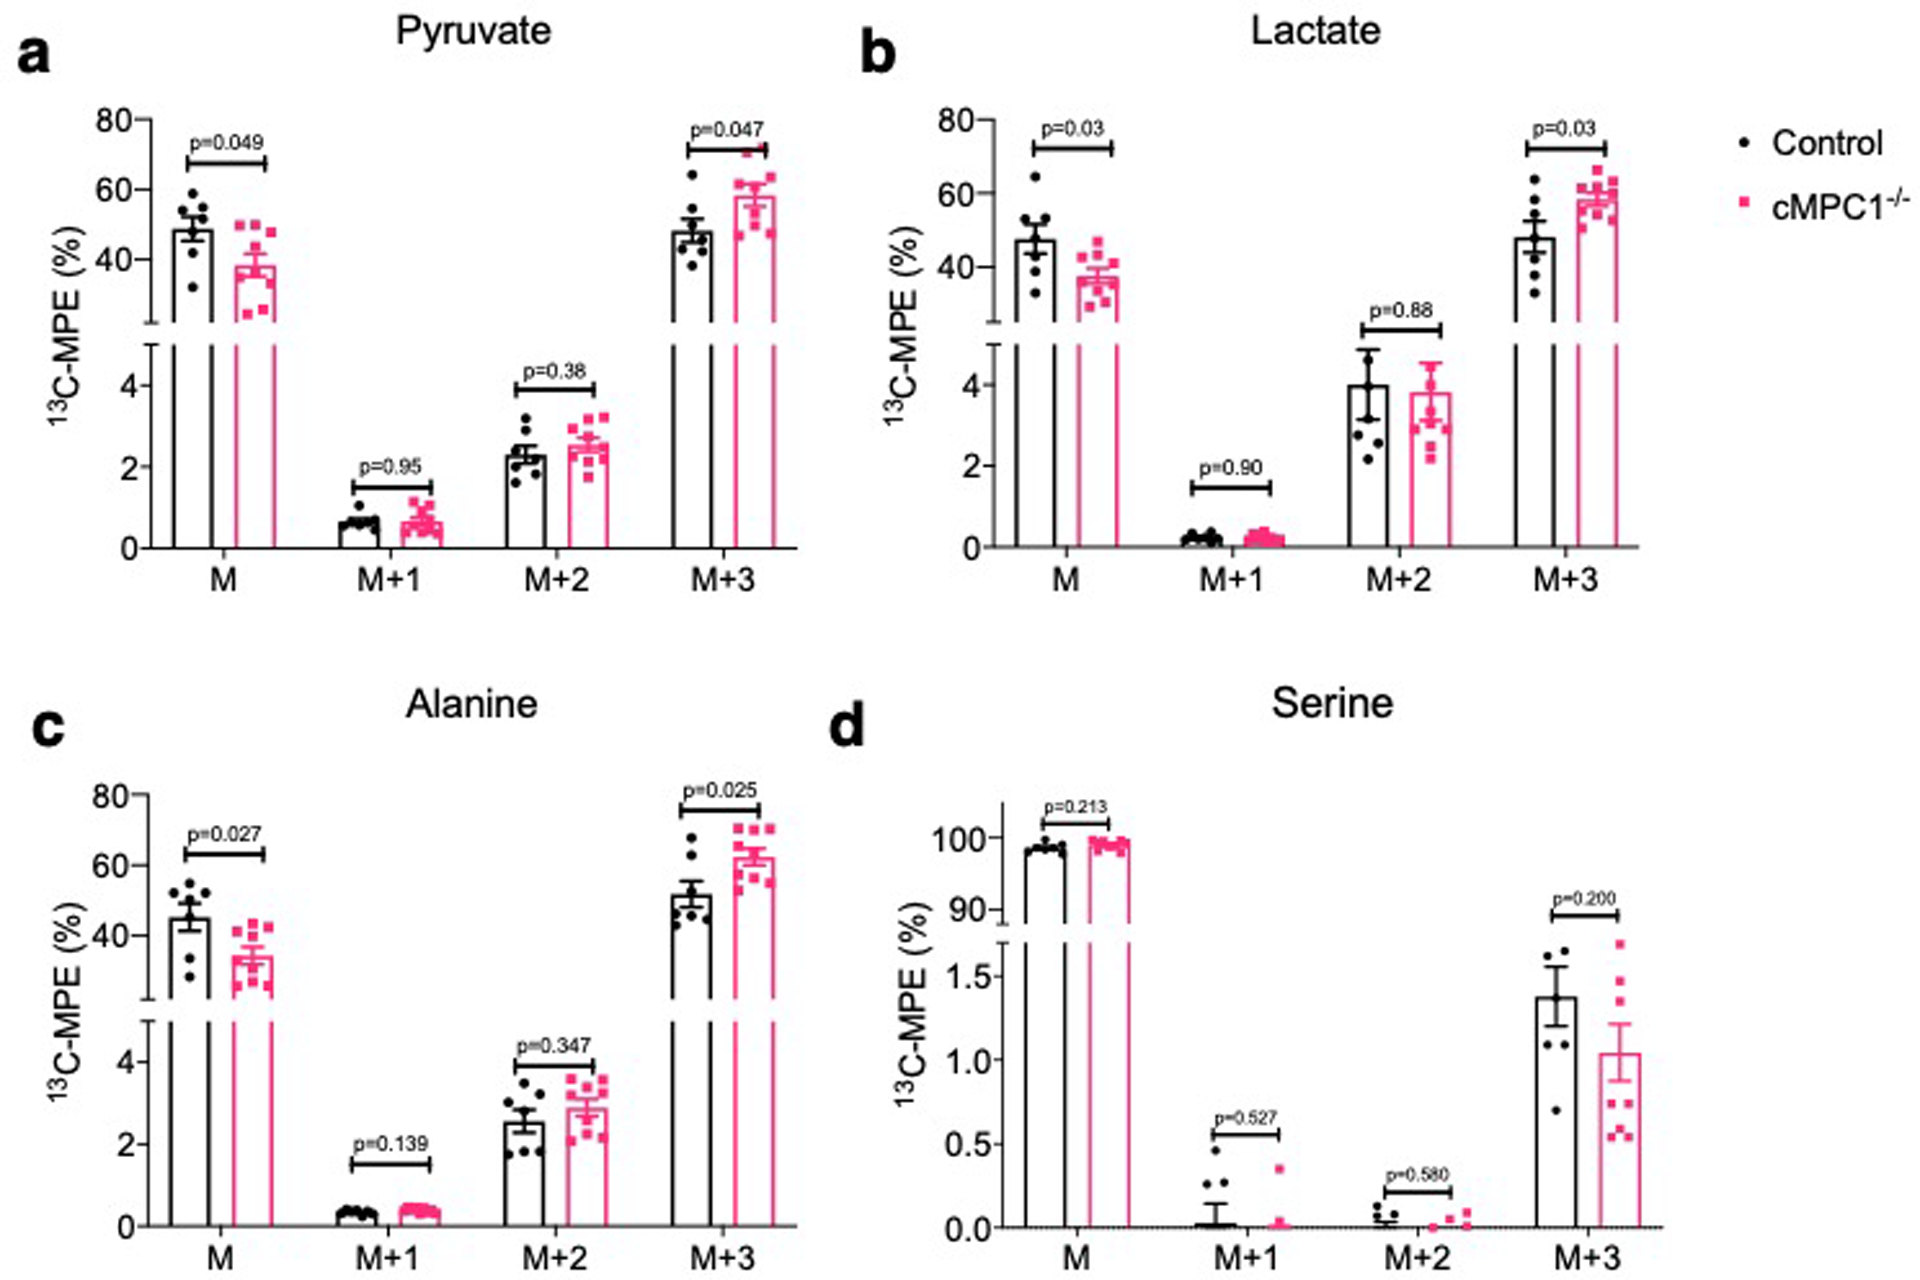
13C-isotopomer labeling pattern of pyruvate (a), lactate (b), alanine (c) and serine (d) following [U-13C6]-glucose perfusion (Control, 7; cMPC1−/−, 9). Data are presented as mean ± SEM and P values were determined by two-tailed unpaired Student’s t-test.
Extended Data Fig. 5. 13C-isotopomer labeling pattern of CAC intermediates from 13C-β-HB perfusion.
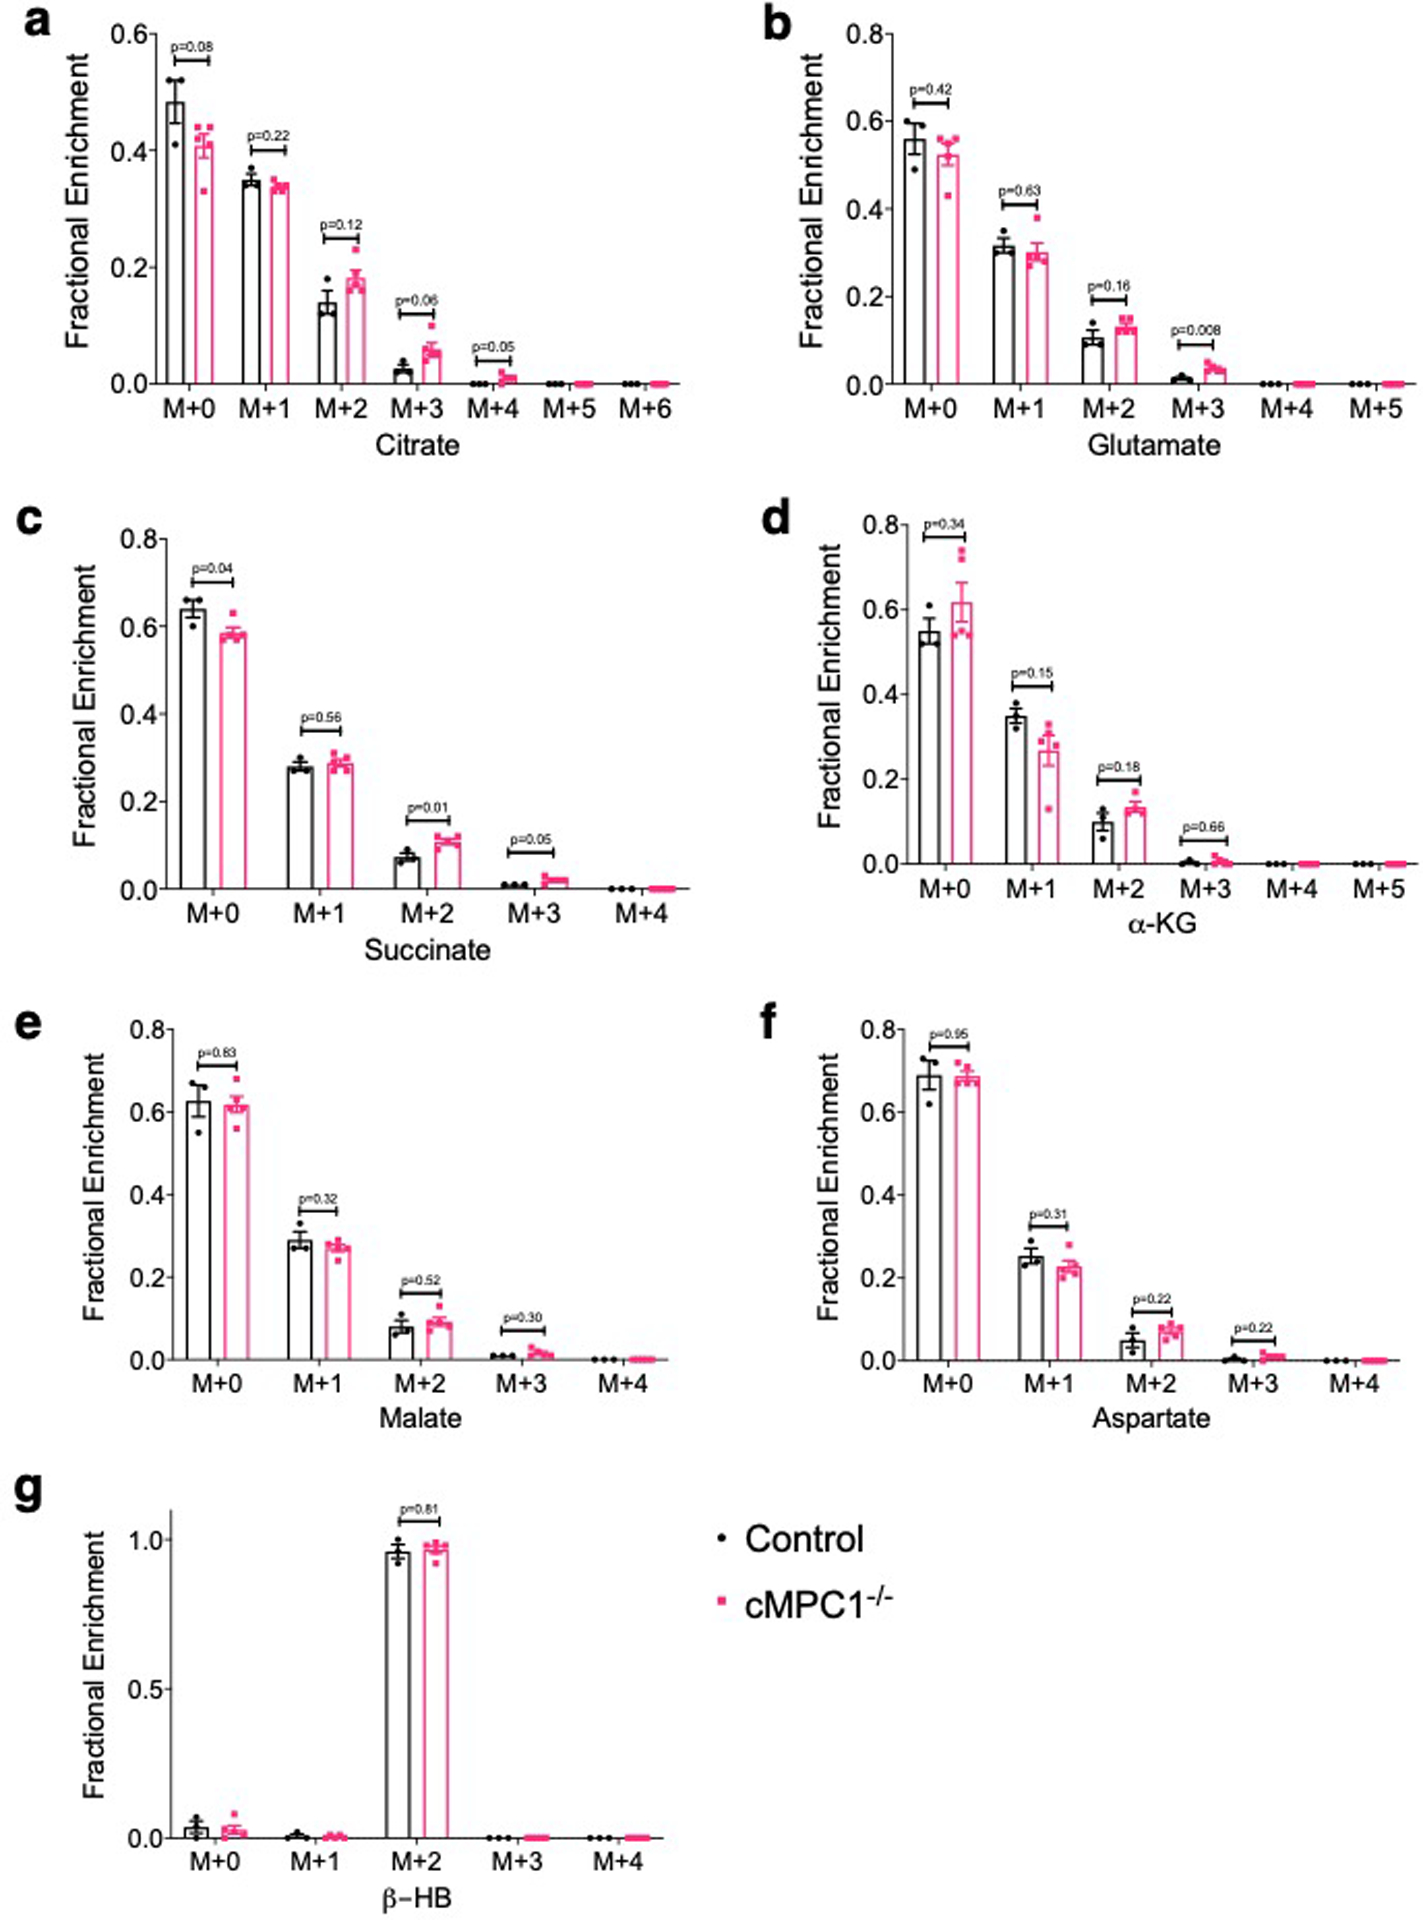
13C-labeled CAC intermediates analysis of Langendorff-perfused hearts perfused with [2,4-13C2]-β-HB and unlabeled glucose, palmitate and lactate. Fractional enrichment 13C-labeled isotopomers of citrate (a), glutamate (b), succinate (c), α-ketoglutarate (KG) (d), malate (e), aspartate (f) and β-hydroxybutyrate (HB) (g) were determined by LC-MS (Control, 3; cMPC1−/−, 5). Data are presented as mean ± SEM and P values were determined by two-tailed unpaired Student’s t-test.
Extended Data Fig. 6. Expression levels of hypertrophic markers and selected transcripts encoding metabolic genes in the cMPC1−/− hearts on 2920X and ketogenic diet.
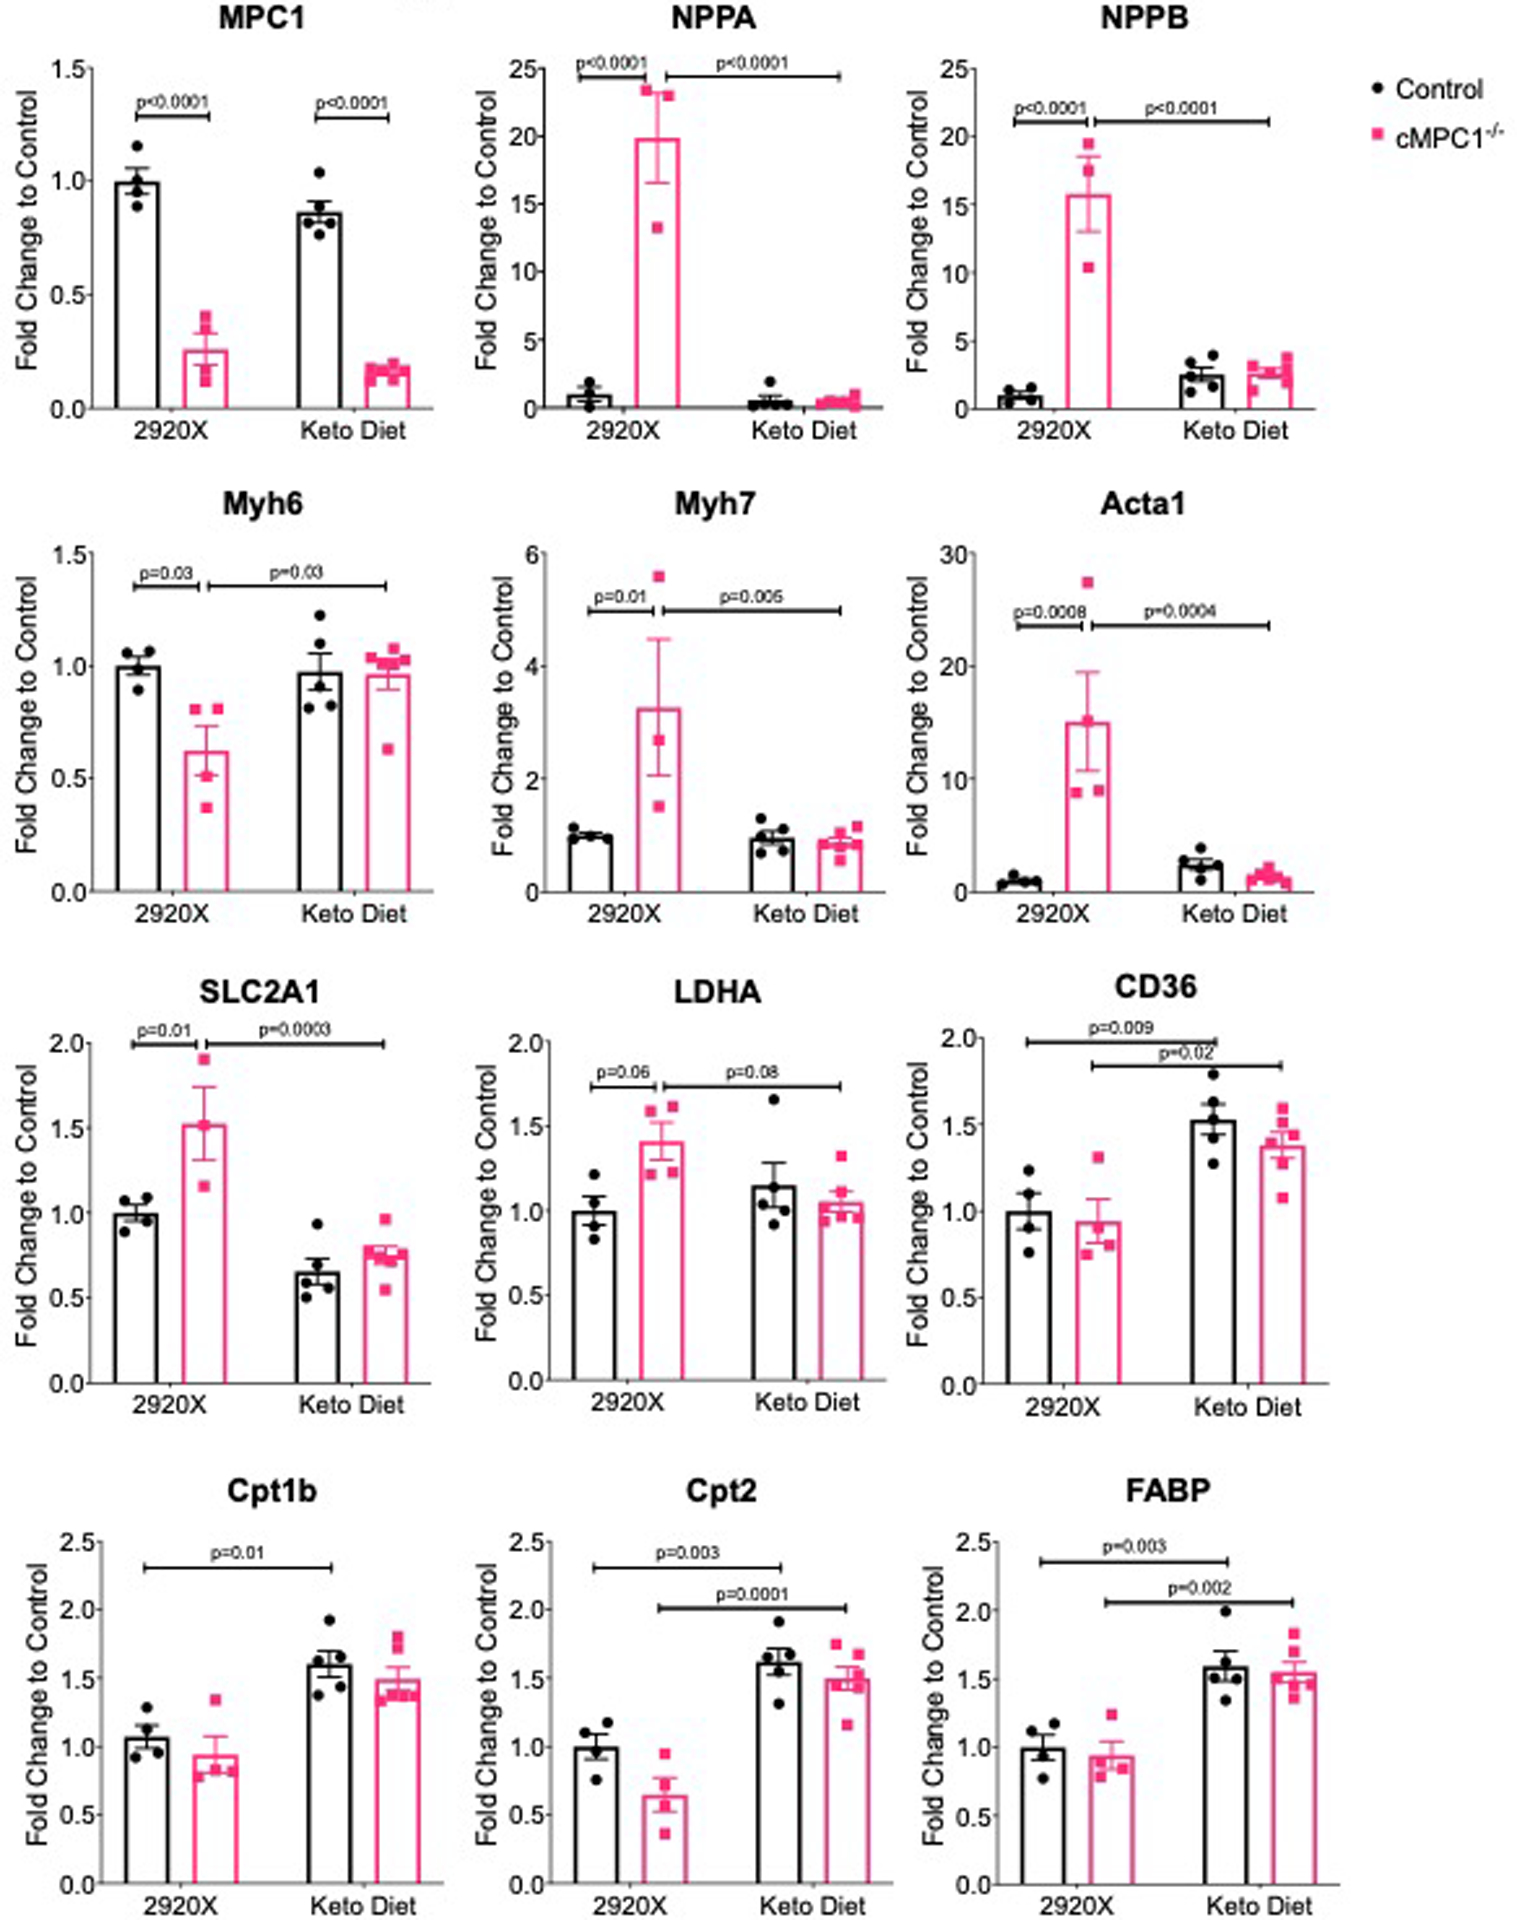
The cMPC1−/− mice under protocol 2 were analyzed for gene expression after 8-week-feeding on Ketogenic (Keto) Diet or control diet (2920X). Sample sizes: n=4 (Control-2920X), n=4 (cMPC1−/−−2920X), n=5 (Control-Keto), n=6 (cMPC1−/−-Keto). Data are presented as mean ± SEM and P values were determined by two-way ANOVA followed by Tukey multiple comparison test.
Extended Data Fig. 7. Cardiac function of cMPC1−/− after switching ketogenic diet to regular chow.

10-week-old control and cMPC1−/− mice were fed a Keto Diet for 8 weeks and then 50% of mice of each genotype were switched to regular chow for 6 weeks. The feeding scheme is shown in panel (a). LV mass (b) and ejection fraction (c) were determined via echocardiography at the age of 22 weeks (4 weeks after chow switch). Heart weight and tibia length (d) was determined at the age of 24 weeks. Sample sizes: n=10 (Control-2920X), n=8 (cMPC1−/−−2920X), n=9 (Control-Keto), n=8 (cMPC1−/−-Keto). Data are presented as mean ± SEM and P values were determined by two-way ANOVA followed by Tukey multiple comparison test.
Extended Data Fig. 8. Effects of ketogenic diet feeding on pressure overload-induced cardiac remodeling in WT mice.
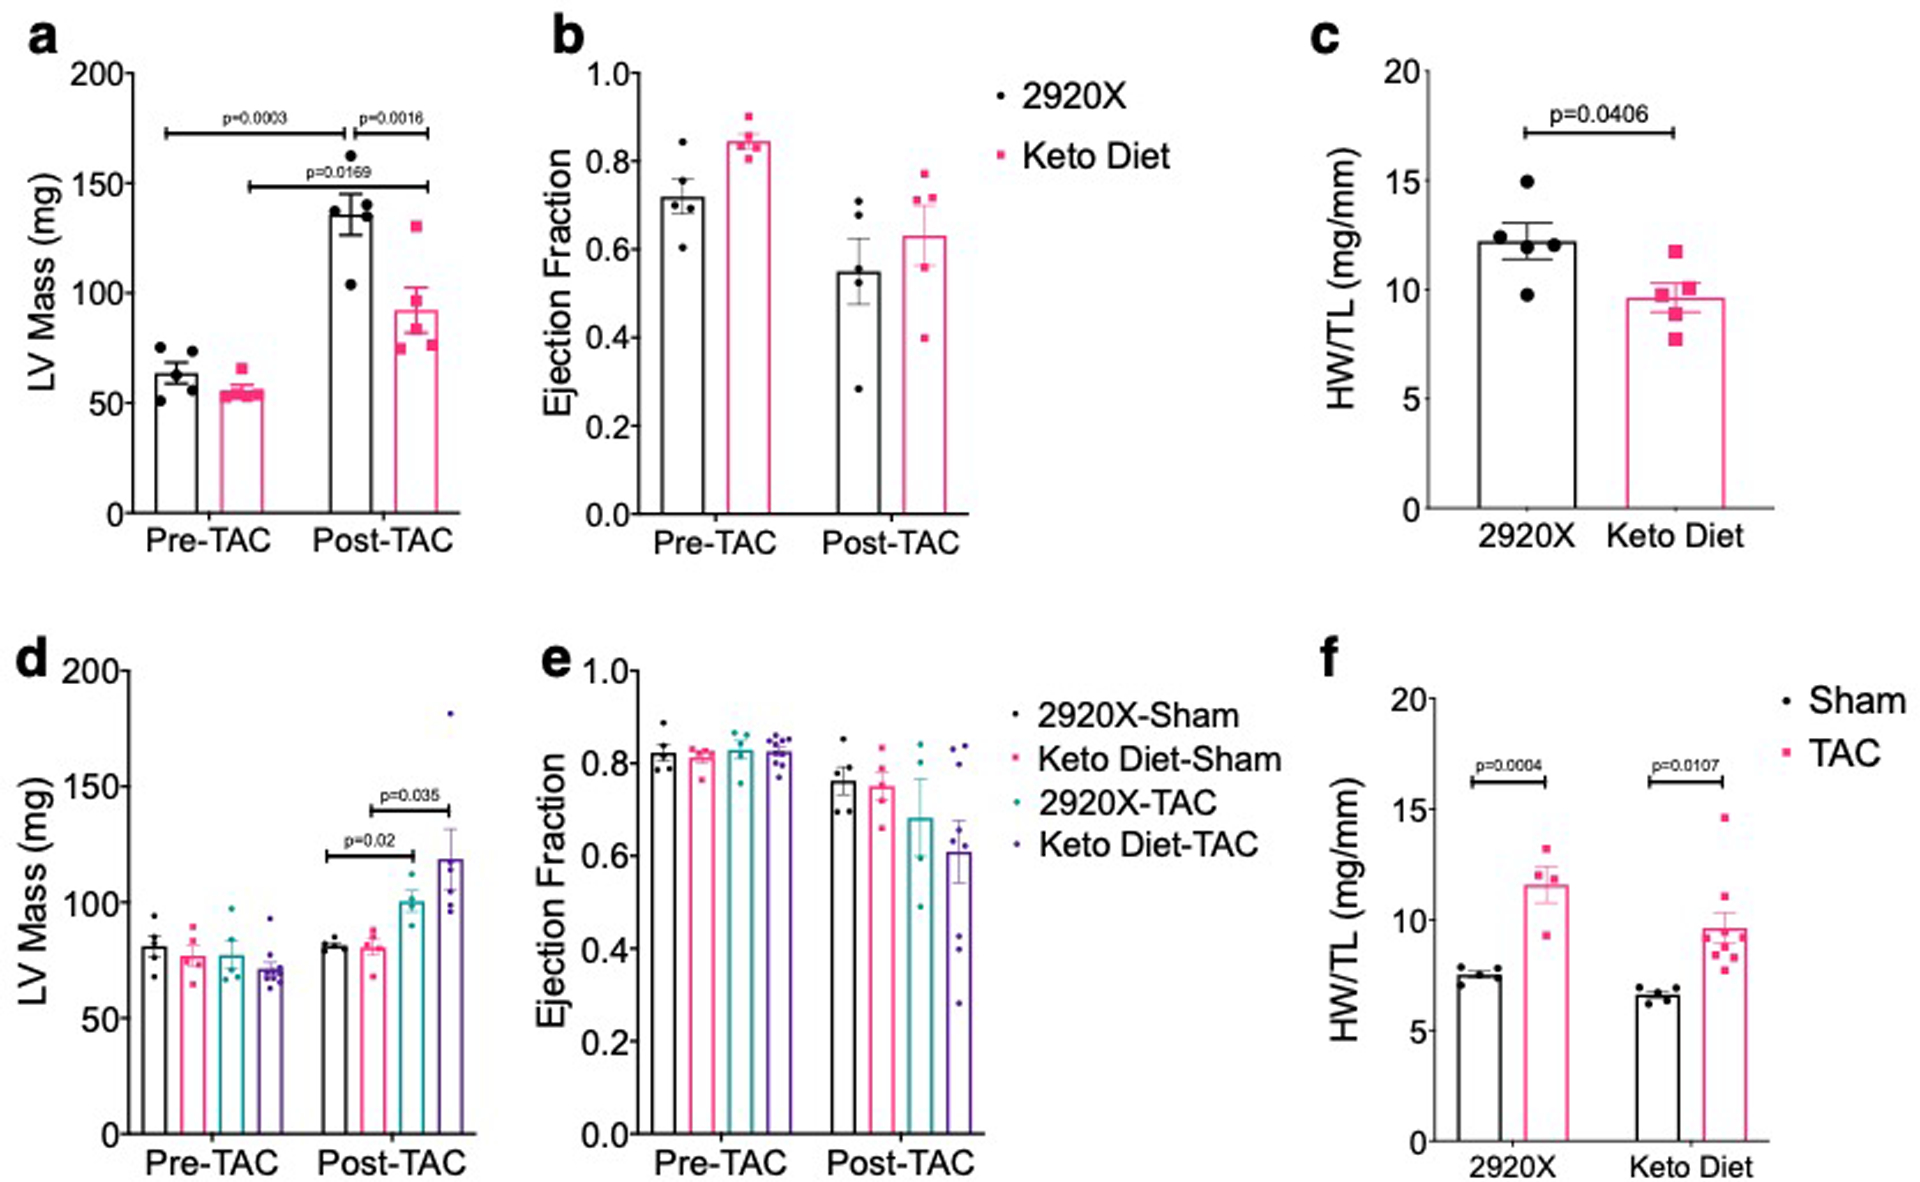
(a-c) 8-week-old WT C57Bl6/J mice were fed with chow and Keto Diet 1 day before TAC surgery. LV mass (a) and ejection fraction (b) were measured by echocardiography prior to surgery and 3 weeks post TAC. Heart weight normalized to tibia length (c) was determined at the time of sacrifice. (n=5 for both groups). (d-f) 12-week-old WT C57Bl6/J mice were fed with chow and Keto Diet 1 day before sham/TAC surgery. LV mass (d) and ejection fraction (e) were measured by echocardiography prior to surgery and 3 weeks post TAC. Heart weight normalized to tibia length (f) was determined at the time of sacrifice. (n=10 for Keto Diet-TAC group and n=5 for other groups). Data are presented as mean ± SEM and P value was determined by two-way ANOVA followed by Tukey multiple comparison test.
Extended Data Fig. 9. mRNA level of ME isoforms and ALT activity in cMPC1−/− hearts.
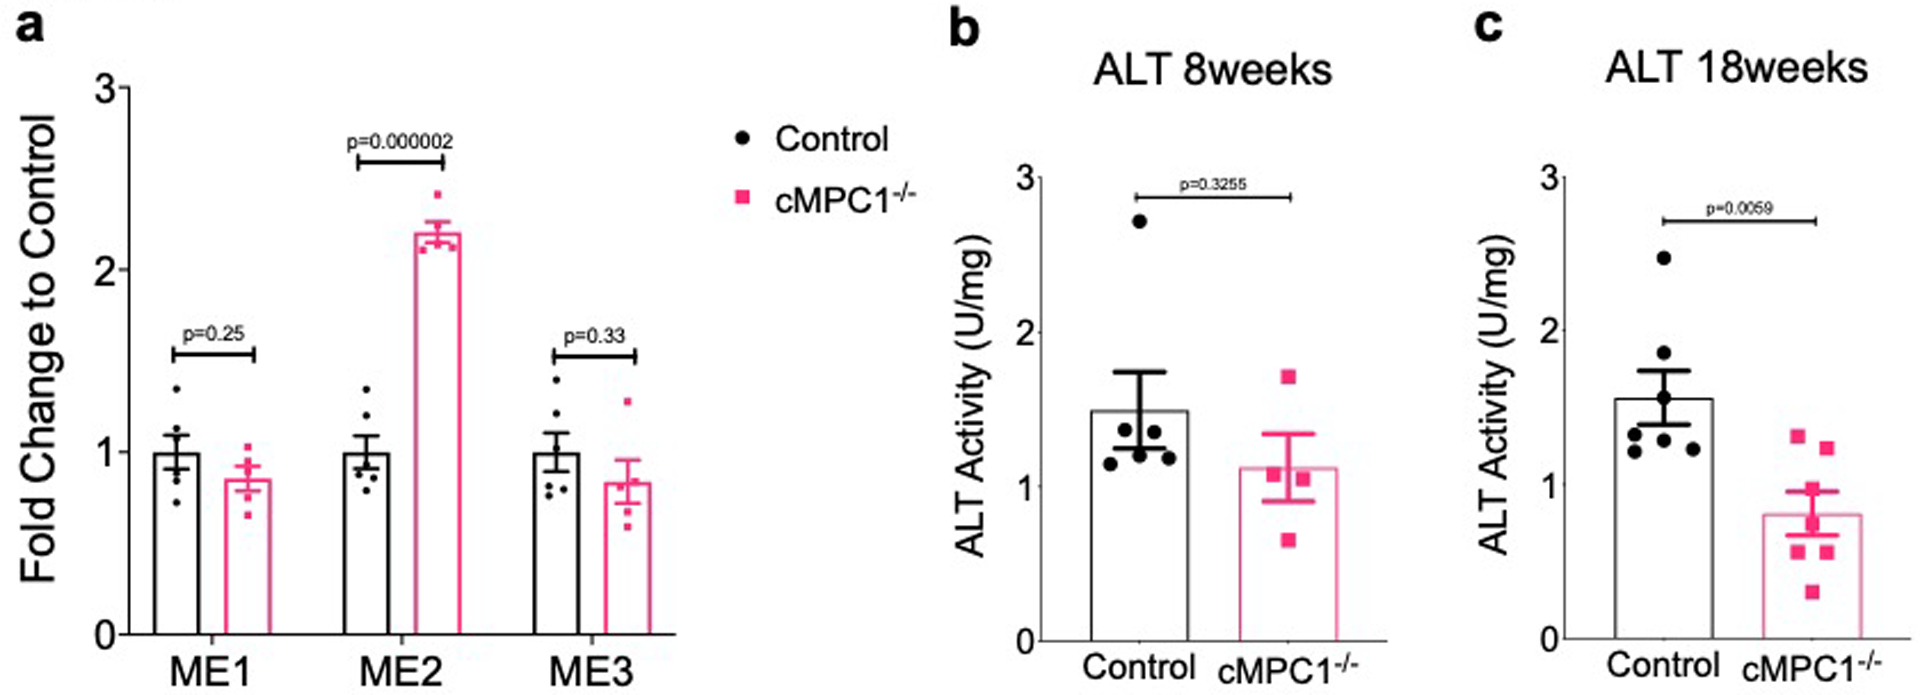
(a) mRNA level of three malic enzyme isoforms were determined by qPCR in the hearts from control and cMPC1−/− mice (Control, 6; cMPC1−/−, 5). (b-c) ALT activity (Cayman 700260) were determined in the hearts from 8-week-old and 18-week-old control and cMPC1−/− mice (8-week-old group: Control, 6; cMPC1−/−, 4. 18-week-old group: Control, 7; cMPC1−/−,7). Data are presented as mean ± SEM and P values were determined by two-tailed unpaired Student’s t-test.
Extended Data Fig. 10. 13C-labeled CAC intermediates analysis from [U-13C5]-glutamine perfusion.
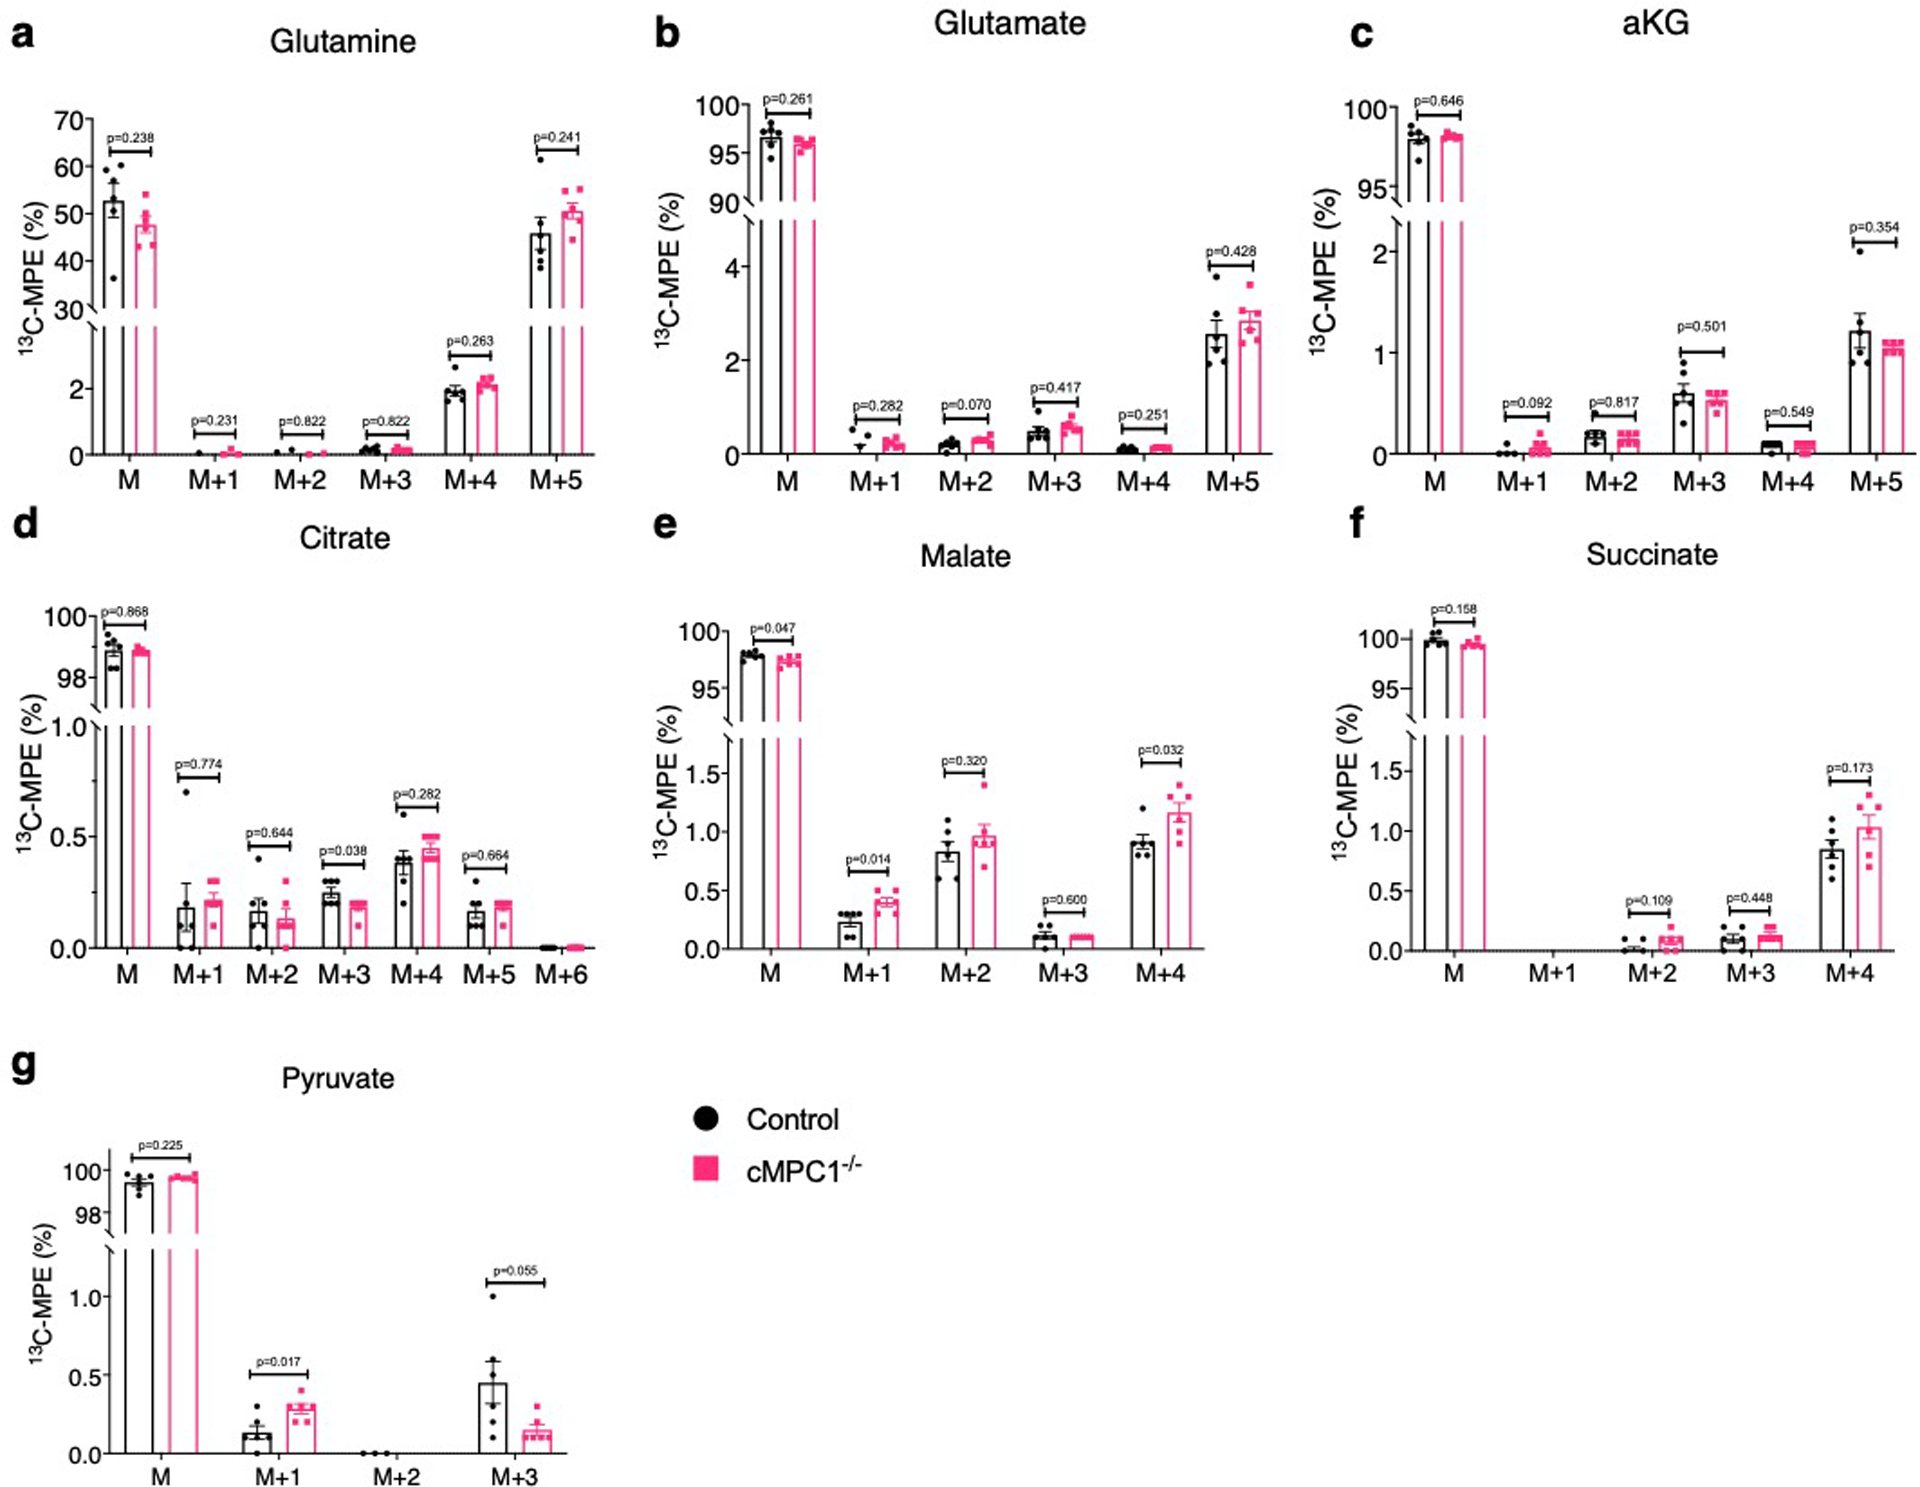
13C-labeled CAC intermediates analysis of Langendorff-perfused hearts perfused with 0.5mM [U-13C5]-glutamine and unlabeled substrates (10mM glucose, 0.4mM palmitate, 0.5mM lactate, and 0.1mM β-HB). 13C-MPE of glutamine (a), glutamate (b), alpha ketoglutarate (a-KG) (c), citrate (d), malate (e), succinate (f) and pyruvate (g) were determined by GC-MS (Control, 6; cMPC1−/−, 6). Data are presented as mean ± SEM and P values were determined by two-tailed unpaired Student’s t-test.
Supplementary Material
Acknowledgments
This work was supported by AHA 16SFRN31810000 (EDA); AHA 15POST22940024 (YZ); Montreal Heart Institute Foundation (CDR); NIH OD019941 (RMW); NIH R01 DK104998 and R00 AR059190 (EBT); T32 HL007638 (AJR); ADA 1-18-PDF-060 (AJR); NIH F32 DK101183 (LRG); NIH U54DK110858, 1S10OD021505 and 1S10OD018210 (JEC); NIH R01HL113057, R01HL132525, and R01HL049244 (EDL); NIH DK091538 (PAC).
Footnotes
Conflict of interest statement
The authors have declared that no conflict of interest exists.
References:
- 1.Wende AR, Brahma MK, McGinnis GR & Young ME Metabolic Origins of Heart Failure. JACC Basic Transl Sci 2, 297–310, doi: 10.1016/j.jacbts.2016.11.009 (2017). [DOI] [PMC free article] [PubMed] [Google Scholar]
- 2.Doenst T, Nguyen TD & Abel ED Cardiac metabolism in heart failure: implications beyond ATP production. Circ Res 113, 709–724, doi: 10.1161/CIRCRESAHA.113.300376 (2013). [DOI] [PMC free article] [PubMed] [Google Scholar]
- 3.Owen OE, Kalhan SC & Hanson RW The key role of anaplerosis and cataplerosis for citric acid cycle function. J Biol Chem 277, 30409–30412, doi: 10.1074/jbc.R200006200 (2002). [DOI] [PubMed] [Google Scholar]
- 4.Des Rosiers C, Labarthe F, Lloyd SG & Chatham JC Cardiac anaplerosis in health and disease: food for thought. Cardiovasc Res 90, 210–219, doi: 10.1093/cvr/cvr055 (2011). [DOI] [PMC free article] [PubMed] [Google Scholar]
- 5.Pound KM et al. Substrate-enzyme competition attenuates upregulated anaplerotic flux through malic enzyme in hypertrophied rat heart and restores triacylglyceride content: attenuating upregulated anaplerosis in hypertrophy. Circ Res 104, 805–812, doi: 10.1161/CIRCRESAHA.108.189951 (2009). [DOI] [PMC free article] [PubMed] [Google Scholar]
- 6.Lommi J et al. Blood ketone bodies in congestive heart failure. J Am Coll Cardiol 28, 665–672 (1996). [DOI] [PubMed] [Google Scholar]
- 7.Aubert G et al. The Failing Heart Relies on Ketone Bodies as a Fuel. Circulation 133, 698–705, doi: 10.1161/CIRCULATIONAHA.115.017355 (2016). [DOI] [PMC free article] [PubMed] [Google Scholar]
- 8.Ho KL et al. Increased ketone body oxidation provides additional energy for the failing heart without improving cardiac efficiency. Cardiovasc Res, doi: 10.1093/cvr/cvz045 (2019). [DOI] [PMC free article] [PubMed] [Google Scholar]
- 9.Huang Y, Zhou M, Sun H & Wang Y Branched-chain amino acid metabolism in heart disease: an epiphenomenon or a real culprit? Cardiovasc Res 90, 220–223, doi: 10.1093/cvr/cvr070 (2011). [DOI] [PMC free article] [PubMed] [Google Scholar]
- 10.Marazzi G, Rosanio S, Caminiti G, Dioguardi FS & Mercuro G The role of amino acids in the modulation of cardiac metabolism during ischemia and heart failure. Curr Pharm Des 14, 2592–2604, doi: 10.2174/138161208786071227 (2008). [DOI] [PubMed] [Google Scholar]
- 11.Drake KJ, Sidorov VY, McGuinness OP, Wasserman DH & Wikswo JP Amino acids as metabolic substrates during cardiac ischemia. Exp Biol Med (Maywood) 237, 1369–1378, doi: 10.1258/ebm.2012.012025 (2012). [DOI] [PMC free article] [PubMed] [Google Scholar]
- 12.Allard MF, Schonekess BO, Henning SL, English DR & Lopaschuk GD Contribution of oxidative metabolism and glycolysis to ATP production in hypertrophied hearts. Am J Physiol 267, H742–750, doi: 10.1152/ajpheart.1994.267.2.H742 (1994). [DOI] [PubMed] [Google Scholar]
- 13.Kagaya Y et al. Effects of long-term pressure overload on regional myocardial glucose and free fatty acid uptake in rats. A quantitative autoradiographic study. Circulation 81, 1353–1361, doi: 10.1161/01.cir.81.4.1353 (1990). [DOI] [PubMed] [Google Scholar]
- 14.Karwi QG, Uddin GM, Ho KL & Lopaschuk GD Loss of Metabolic Flexibility in the Failing Heart. Front Cardiovasc Med 5, 68, doi: 10.3389/fcvm.2018.00068 (2018). [DOI] [PMC free article] [PubMed] [Google Scholar]
- 15.Chandramouli C et al. Myocardial glycogen dynamics: new perspectives on disease mechanisms. Clin Exp Pharmacol Physiol 42, 415–425, doi: 10.1111/1440-1681.12370 (2015). [DOI] [PubMed] [Google Scholar]
- 16.Leong HS, Brownsey RW, Kulpa JE & Allard MF Glycolysis and pyruvate oxidation in cardiac hypertrophy--why so unbalanced? Comp Biochem Physiol A Mol Integr Physiol 135, 499–513 (2003). [DOI] [PubMed] [Google Scholar]
- 17.Lopaschuk GD, Wambolt RB & Barr RL An imbalance between glycolysis and glucose oxidation is a possible explanation for the detrimental effects of high levels of fatty acids during aerobic reperfusion of ischemic hearts. J Pharmacol Exp Ther 264, 135–144 (1993). [PubMed] [Google Scholar]
- 18.Nascimben L et al. Mechanisms for increased glycolysis in the hypertrophied rat heart. Hypertension 44, 662–667, doi: 10.1161/01.HYP.0000144292.69599.0c (2004). [DOI] [PubMed] [Google Scholar]
- 19.Comte B et al. A 13C mass isotopomer study of anaplerotic pyruvate carboxylation in perfused rat hearts. J Biol Chem 272, 26125–26131, doi: 10.1074/jbc.272.42.26125 (1997). [DOI] [PubMed] [Google Scholar]
- 20.Peuhkurinen KJ, Nuutinen EM, Pietilainen EP, Hiltunen JK & Hassinen IE Role of pyruvate carboxylation in the energy-linked regulation of pool sizes of tricarboxylic acid-cycle intermediates in the myocardium. Biochem J 208, 577–581, doi: 10.1042/bj2080577 (1982). [DOI] [PMC free article] [PubMed] [Google Scholar]
- 21.Pisarenko OI, Solomatina ES & Studneva IM The role of amino acid catabolism in the formation of the tricarboxylic acid cycle intermediates and ammonia in anoxic rat heart. Biochim Biophys Acta 885, 154–161, doi: 10.1016/0167-4889(86)90083-2 (1986). [DOI] [PubMed] [Google Scholar]
- 22.Gibala MJ, Young ME & Taegtmeyer H Anaplerosis of the citric acid cycle: role in energy metabolism of heart and skeletal muscle. Acta Physiol Scand 168, 657–665, doi: 10.1046/j.1365-201x.2000.00717.x (2000). [DOI] [PubMed] [Google Scholar]
- 23.Opie LH & Mansford KRL The Value of Lactate and Pyruvate Measurements in the Assessment of the Redox State of Free Nicotinamide-Adenine Dinucleotide in the Cytoplasm of Perfused Rat Heart. Eur J Clin Invest 1, 295–306, doi: 10.1111/eci.1971.1.4.295 (1971). [DOI] [PubMed] [Google Scholar]
- 24.Lazo PA & Sols A Pyruvate dehydrogenase complex of ascites tumour. Activation by AMP and other properties of potential significance in metabolic regulation. Biochem J 190, 705–710, doi: 10.1042/bj1900705 (1980). [DOI] [PMC free article] [PubMed] [Google Scholar]
- 25.Comte B, Vincent G, Bouchard B & Des Rosiers C Probing the origin of acetyl-CoA and oxaloacetate entering the citric acid cycle from the 13C labeling of citrate released by perfused rat hearts. J Biol Chem 272, 26117–26124, doi: 10.1074/jbc.272.42.26117 (1997). [DOI] [PubMed] [Google Scholar]
- 26.Bricker DK et al. A mitochondrial pyruvate carrier required for pyruvate uptake in yeast, Drosophila, and humans. Science 337, 96–100, doi: 10.1126/science.1218099 (2012). [DOI] [PMC free article] [PubMed] [Google Scholar]
- 27.Halestrap AP The mitochondrial pyruvate carrier: has it been unearthed at last? Cell Metab 16, 141–143, doi: 10.1016/j.cmet.2012.07.013 (2012). [DOI] [PubMed] [Google Scholar]
- 28.Herzig S et al. Identification and functional expression of the mitochondrial pyruvate carrier. Science 337, 93–96, doi: 10.1126/science.1218530 (2012). [DOI] [PubMed] [Google Scholar]
- 29.Vanderperre B et al. Embryonic Lethality of Mitochondrial Pyruvate Carrier 1 Deficient Mouse Can Be Rescued by a Ketogenic Diet. PLoS Genet 12, e1006056, doi: 10.1371/journal.pgen.1006056 (2016). [DOI] [PMC free article] [PubMed] [Google Scholar]
- 30.Gray LR et al. Hepatic Mitochondrial Pyruvate Carrier 1 Is Required for Efficient Regulation of Gluconeogenesis and Whole-Body Glucose Homeostasis. Cell Metab 22, 669–681, doi: 10.1016/j.cmet.2015.07.027 (2015). [DOI] [PMC free article] [PubMed] [Google Scholar]
- 31.McCommis KS et al. Loss of Mitochondrial Pyruvate Carrier 2 in the Liver Leads to Defects in Gluconeogenesis and Compensation via Pyruvate-Alanine Cycling. Cell Metab 22, 682–694, doi: 10.1016/j.cmet.2015.07.028 (2015). [DOI] [PMC free article] [PubMed] [Google Scholar]
- 32.Rauckhorst AJ et al. The mitochondrial pyruvate carrier mediates high fat diet-induced increases in hepatic TCA cycle capacity. Mol Metab 6, 1468–1479, doi: 10.1016/j.molmet.2017.09.002 (2017). [DOI] [PMC free article] [PubMed] [Google Scholar]
- 33.Sharma A et al. Impaired skeletal muscle mitochondrial pyruvate uptake rewires glucose metabolism to drive whole-body leanness. Elife 8, doi: 10.7554/eLife.45873 (2019). [DOI] [PMC free article] [PubMed] [Google Scholar]
- 34.Fernandez-Caggiano M et al. Analysis of Mitochondrial Proteins in the Surviving Myocardium after Ischemia Identifies Mitochondrial Pyruvate Carrier Expression as Possible Mediator of Tissue Viability. Mol Cell Proteomics 15, 246–255, doi: 10.1074/mcp.M115.051862 (2016). [DOI] [PMC free article] [PubMed] [Google Scholar]
- 35.Abel ED et al. Cardiac hypertrophy with preserved contractile function after selective deletion of GLUT4 from the heart. J Clin Invest 104, 1703–1714, doi: 10.1172/JCI7605 (1999). [DOI] [PMC free article] [PubMed] [Google Scholar]
- 36.Krebs HA & Gascoyne T The redox state of the nicotinamide-adenine dinucleotides in rat liver homogenates. Biochem J 108, 513–520, doi: 10.1042/bj1080513 (1968). [DOI] [PMC free article] [PubMed] [Google Scholar]
- 37.Matthieu Ruiz R. G. l., Fanny Vaillant, Benjamin Lauzier, Christine Des Rosiers. in Methods in Enzymology Vol. 561 (ed Metallo Christian M.) Ch. 3, 107–147 (Elsevier, 2015). [DOI] [PubMed] [Google Scholar]
- 38.Halestrap AP & Denton RM The specificity and metabolic implications of the inhibition of pyruvate transport in isolated mitochondria and intact tissue preparations by alpha-Cyano-4-hydroxycinnamate and related compounds. Biochem J 148, 97–106, doi: 10.1042/bj1480097 (1975). [DOI] [PMC free article] [PubMed] [Google Scholar]
- 39.Contreras-Baeza Y et al. Monocarboxylate transporter 4 (MCT4) is a high affinity transporter capable of exporting lactate in high-lactate microenvironments. J Biol Chem 294, 20135–20147, doi: 10.1074/jbc.RA119.009093 (2019). [DOI] [PMC free article] [PubMed] [Google Scholar]
- 40.Lindblom P et al. Isoforms of alanine aminotransferases in human tissues and serum--differential tissue expression using novel antibodies. Arch Biochem Biophys 466, 66–77, doi: 10.1016/j.abb.2007.07.023 (2007). [DOI] [PubMed] [Google Scholar]
- 41.O’Donnell JM, Kalichira A, Bi J & Lewandowski ED In vivo, cardiac-specific knockdown of a target protein, malic enzyme-1, in rat via adenoviral delivery of DNA for non-native miRNA. Curr Gene Ther 12, 454–462 (2012). [DOI] [PMC free article] [PubMed] [Google Scholar]
- 42.Lahey R et al. Enhanced Redox State and Efficiency of Glucose Oxidation With miR Based Suppression of Maladaptive NADPH-Dependent Malic Enzyme 1 Expression in Hypertrophied Hearts. Circ Res 122, 836–845, doi: 10.1161/CIRCRESAHA.118.312660 (2018). [DOI] [PMC free article] [PubMed] [Google Scholar]
- 43.Funk AM et al. Effects of deuteration on transamination and oxidation of hyperpolarized (13)C-Pyruvate in the isolated heart. J Magn Reson 301, 102–108, doi: 10.1016/j.jmr.2019.03.003 (2019). [DOI] [PMC free article] [PubMed] [Google Scholar]
- 44.Brooks GA The Science and Translation of Lactate Shuttle Theory. Cell Metab 27, 757–785, doi: 10.1016/j.cmet.2018.03.008 (2018). [DOI] [PubMed] [Google Scholar]
- 45.Chen YJ et al. Lactate metabolism is associated with mammalian mitochondria. Nat Chem Biol 12, 937–943, doi: 10.1038/nchembio.2172 (2016). [DOI] [PMC free article] [PubMed] [Google Scholar]
- 46.Taylor EB Functional Properties of the Mitochondrial Carrier System. Trends Cell Biol 27, 633–644, doi: 10.1016/j.tcb.2017.04.004 (2017). [DOI] [PMC free article] [PubMed] [Google Scholar]
- 47.Ferron M, Denis M, Persello A, Rathagirishnan R & Lauzier B Protein O-GlcNAcylation in Cardiac Pathologies: Past, Present, Future. Front Endocrinol (Lausanne) 9, 819, doi: 10.3389/fendo.2018.00819 (2018). [DOI] [PMC free article] [PubMed] [Google Scholar]
- 48.Arad M et al. Glycogen storage diseases presenting as hypertrophic cardiomyopathy. N Engl J Med 352, 362–372, doi: 10.1056/NEJMoa033349 (2005). [DOI] [PubMed] [Google Scholar]
- 49.Puchalska P & Crawford PA Multi-dimensional Roles of Ketone Bodies in Fuel Metabolism, Signaling, and Therapeutics. Cell Metab 25, 262–284, doi: 10.1016/j.cmet.2016.12.022 (2017). [DOI] [PMC free article] [PubMed] [Google Scholar]
- 50.Ruan HB & Crawford PA Ketone bodies as epigenetic modifiers. Curr Opin Clin Nutr Metab Care 21, 260–266, doi: 10.1097/MCO.0000000000000475 (2018). [DOI] [PubMed] [Google Scholar]
- 51.Horton JL et al. The failing heart utilizes 3-hydroxybutyrate as a metabolic stress defense. JCI Insight 4, doi: 10.1172/jci.insight.124079 (2019). [DOI] [PMC free article] [PubMed] [Google Scholar]
- 52.Ho KL et al. Increased ketone body oxidation provides additional energy for the failing heart without improving cardiac efficiency. Cardiovasc Res 115, 1606–1616, doi: 10.1093/cvr/cvz045 (2019). [DOI] [PMC free article] [PubMed] [Google Scholar]
- 53.Ye J et al. Primer-BLAST: a tool to design target-specific primers for polymerase chain reaction. BMC Bioinformatics 13, 134, doi: 10.1186/1471-2105-13-134 (2012). [DOI] [PMC free article] [PubMed] [Google Scholar]
- 54.Riehle C et al. PGC-1beta deficiency accelerates the transition to heart failure in pressure overload hypertrophy. Circ Res 109, 783–793, doi: 10.1161/CIRCRESAHA.111.243964 (2011). [DOI] [PMC free article] [PubMed] [Google Scholar]
- 55.Ruiz M, Gelinas R, Vaillant F, Lauzier B & Des Rosiers C Metabolic Tracing Using Stable Isotope-Labeled Substrates and Mass Spectrometry in the Perfused Mouse Heart. Methods Enzymol 561, 107–147, doi: 10.1016/bs.mie.2015.06.026 (2015). [DOI] [PubMed] [Google Scholar]
- 56.Vaillant F et al. Ivabradine and metoprolol differentially affect cardiac glucose metabolism despite similar heart rate reduction in a mouse model of dyslipidemia. Am J Physiol Heart Circ Physiol 311, H991–H1003, doi: 10.1152/ajpheart.00789.2015 (2016). [DOI] [PubMed] [Google Scholar]
- 57.Comte B, Vincent G, Bouchard B & Des Rosiers C Probing the origin of acetyl-CoA and oxaloacetate entering the citric acid cycle from the 13C labeling of citrate released by perfused rat hearts. J Biol Chem 272, 26117–26124, doi: 10.1074/jbc.272.42.26117 (1997). [DOI] [PubMed] [Google Scholar]
- 58.Lahey R et al. Enhanced Redox State and Efficiency of Glucose Oxidation With miR Based Suppression of Maladaptive NADPH-Dependent Malic Enzyme 1 Expression in Hypertrophied Hearts. Circ Res 122, 836–845, doi: 10.1161/CIRCRESAHA.118.312660 (2018). [DOI] [PMC free article] [PubMed] [Google Scholar]
- 59.Huang X et al. X13CMS: global tracking of isotopic labels in untargeted metabolomics. Anal Chem 86, 1632–1639, doi: 10.1021/ac403384n (2014). [DOI] [PMC free article] [PubMed] [Google Scholar]
Associated Data
This section collects any data citations, data availability statements, or supplementary materials included in this article.
Supplementary Materials
Data Availability Statement
Source data for western blots are provided with this paper. All other data that support the findings of this study are available from the corresponding author upon reasonable request.


