Abstract
Mitochondria are the site of aerobic respiration, producing ATP via oxidative phosphorylation as protons flow down their electrochemical gradient through ATP synthase. This negative membrane potential across the inner mitochondrial membrane (ΔΨm) represents a fundamental biophysical parameter central to cellular life. Traditional, electrode-based methods for recording membrane potential are impossible to implement on mitochondria within intact cells. Fluorescent ΔΨm indicators based on cationic, lipophilic dyes are a common alternative, but these indicators are complicated by concentration-dependent artifacts and the requirement to maintain dye in the extracellular solution to visualize reversible ΔΨm dynamics. Here, we report the first example of a fluorescent ΔΨm reporter that does not rely on ΔΨm-dependent accumulation. We redirected the localization of a photoinduced electron transfer (PeT)-based indicator, Rhodamine Voltage Reporter (RhoVR), to mitochondria by masking the carboxylate of RhoVR 1 as an acetoxy methyl (AM) ester. Once within mitochondria, esterases remove the AM-ester, trapping RhoVR inside of the mitochondrial matrix, where it can incorporate within the inner membrane and reversibly report on changes in ΔΨm. We show that this Small molecule, Permeable, Internally Redistributing for Inner membrane Targeting Rhodamine Voltage reporter, or SPIRIT RhoVR, localizes to mitochondria across a number of different cell lines and responds reversibly to changes in ΔΨm induced by exceptionally low concentrations of the uncoupler FCCP without the need for exogenous pools of dye (unlike traditional, accumulation-based rhodamine esters). SPIRIT RhoVR is compatible with multi-color imaging, enabling simultaneous, real-time observation of cytosolic Ca2+, plasma membrane potential, and reversible ΔΨm dynamics.
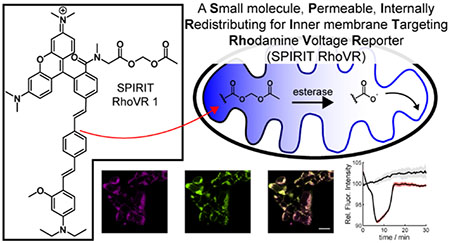
Graphical Abstract
Membrane-bound organelles maintain gradients of ions across their membranes resulting in a membrane potential (Vmem), or voltage, difference relative to the cytosol.1 Mitochondria are perhaps the most well-known example of this phenomenon: as the locus of oxidative phosphorylation,2 the chemical potential energy in cellular fuel sources is used to pump H+ across the mitochondrial inner membrane and into the intermembrane space. In normally respiring mitochondria, this results in a voltage gradient of approximately 160 mV with the matrix negative relative to the intermembrane space. The magnitude of this mitochondrial electrochemical potential (ΔΨm) profoundly influences the rate of ATP synthesis,3 is linked to calcium release,4 and is often misregulated in cancer metabolism.5
Traditionally, Vmem is measured using patch-clamp electrophysiology, but the invasive nature of this technique, the small size of mitochondria, and the sequestration of the mitochondrial inner membrane within both the plasma membrane and outer mitochondrial membrane make electrode-based methods impossible to implement for mitochondria inside of living cells. Optical methods are a promising route for studying voltage in membrane-bound organelles because a membrane-permeable dye can be used in intact cells to provide a minimally invasive readout of the membrane potential of an organelle in its physiological niche.6
The vast majority of reported fluorescent sensors of ΔΨm involve a lipophilic, cationic fluorophore that accumulates in mitochondria in proportion to the negative ΔΨm. The change in voltage is then read out by measuring the intensity of mitochondrial fluorescence,7 the change in color as the dye forms spectrally shifted aggregates,8–9 the FRET efficiency between a static donor and a mobile acceptor,10–11 or the physical partition of the dye between mitochondria and another subcellular compartment.12–13 A commonly used class of dye is rhodamine esters (Scheme S1) which report change in ΔΨm via the intensity of mitochondrial fluorescence. However, this approach has some technical limitations. First, at high concentrations, rhodamines and other lipophilic dyes will self-quench, confounding interpretation of intensity changes.14 Second, dye must be continuously present in the bath solution to compensate for diffusion out of the mitochondria that occurs when no dye is present extracellularly. It is impossible to leave dye solution on the sample in some experimental configurations. Finally, because all of the mechanisms listed above rely on diffusion, rapid voltage changes on timescales of milliseconds will not be observed.15
Voltage-sensitive fluorophores that sense changes in Vmem via a photoinduced electron transfer (PeT) mechanism,16 can address some of the limitations of diffusion-based rhodamine esters. The lipophilic molecular wire of VF dyes drives membrane localization, and anionic carboxylate or sulfonate groups prevent internalization. In the course of developing rhodamine based voltage-reporters (RhoVR dyes), we found that the tBu ester of RhoVR (Scheme 1) localized to internal structures, whereas the free carboxylate (RhoVR 1, Scheme 1) localized to plasma membranes.17
Scheme 1.

Imaging mitochondrial membrane potential dynamics with permeable SPIRIT RhoVR indicators
We hypothesized that RhoVR-tBu localized to mitochondria, on account of its overall cationic and lipophilic nature, and would show ΔΨm-dependent accumulation in these structures, similar to classic rhodamine esters. We wondered whether a labile ester, like acetoxymethyl (AM) esters, would allow RhoVR to accumulate in the mitochondria matrix, where esterases18 could hydrolyze the ester, trapping RhoVR 1 and enabling it to insert to the inner membrane. The revealed carboxylate would prevent it from acting like an “accumulation” type rhodamine ester, and it would then sense voltage via a PeT-based mechanism. This Small molecule, Permeable, Internally Redistributing for Inner membrane Targeting RhoVR, or SPIRIT RhoVR 1, represents the first of a new class of ΔΨm indicators that does not rely on molecular accumulation for voltage sensing.
SPIRIT RhoVR1 is synthesized in 3 steps (Scheme 2). Esterification of N-tert-butyloxycarbonyl sarcosine (Boc-sarc, 5) with bromomethylacetate provides the acetoxymethylester (AM ester) of 5 in 58% yield. Removal of the N-Boc protecting group with trifluoroacetic acid (TFA), followed immediately by peptide bond formation with carboxy-RhoVR (1) mediated by HATU produces SPIRIT RhoVR 1 (2) in 10% yield. A control compound, SPIRIT RhoVR 0 (4) is synthesized via a similar route from RhoVR 0 carboxylate 3 (Scheme S4). RhoVR 0 derivatives lack the aniline group required for voltage sensitivity. RhoVR 0, like RhoVR 1, localizes to the plasma membrane but is not voltage-sensitive.19 SPIRIT RhoVR 0 provides an important negative control for characterization of mitochondrial voltage responses in cells. The new SPIRIT RhoVR derivatives possess emssion and excitation profiles nearly identical to the parent RhoVR compounds (Figure S1, Table S1).
Scheme 2.
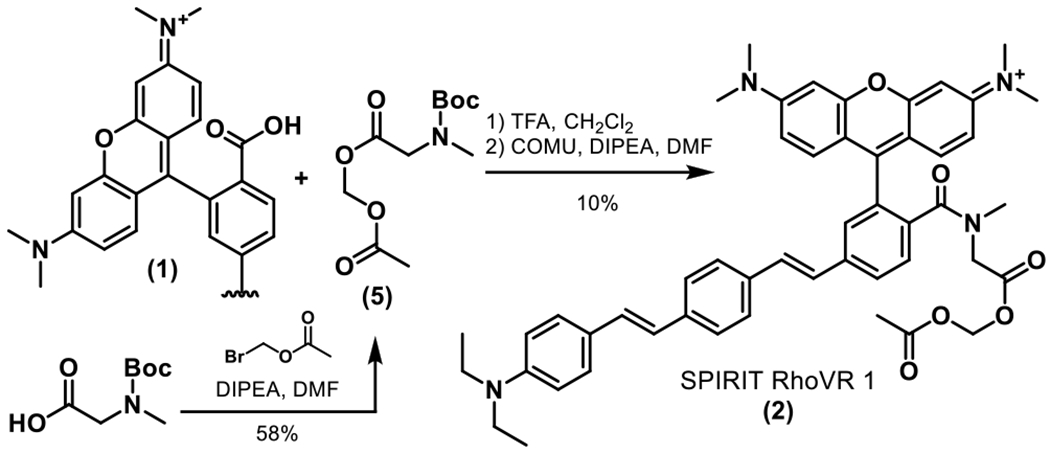
Synthesis of SPIRIT RhoVR
Both SPIRIT RhoVR 1 and RhoVR-tBu localize to mitochondria. Confocal imaging of HEK 293T cells stained with SPIRIT RhoVR 1 (Figure 1a–c) or RhoVR-tBu (Figure 1d–f) display punctate, intracellular staining that co-localizes with mitochondria-targeted rhodamine 123 (Movie S1) and possess near-unity Pearson correlation (Figure S2a). In contrast, RhoVR 1, which senses plasma membrane potential, does not co-localize with rhodamine 123 (Figure S2b–d) and has a low Pearson correlation coefficient of 0.28 ± 0.04 (Figure S2a). SPIRIT RhoVR 1 and 0 localization in mitochondria is generalizable across a range of cell lines (Figure S2e and f). SPIRIT RhoVR 1 (Figure S3).
Figure 1.
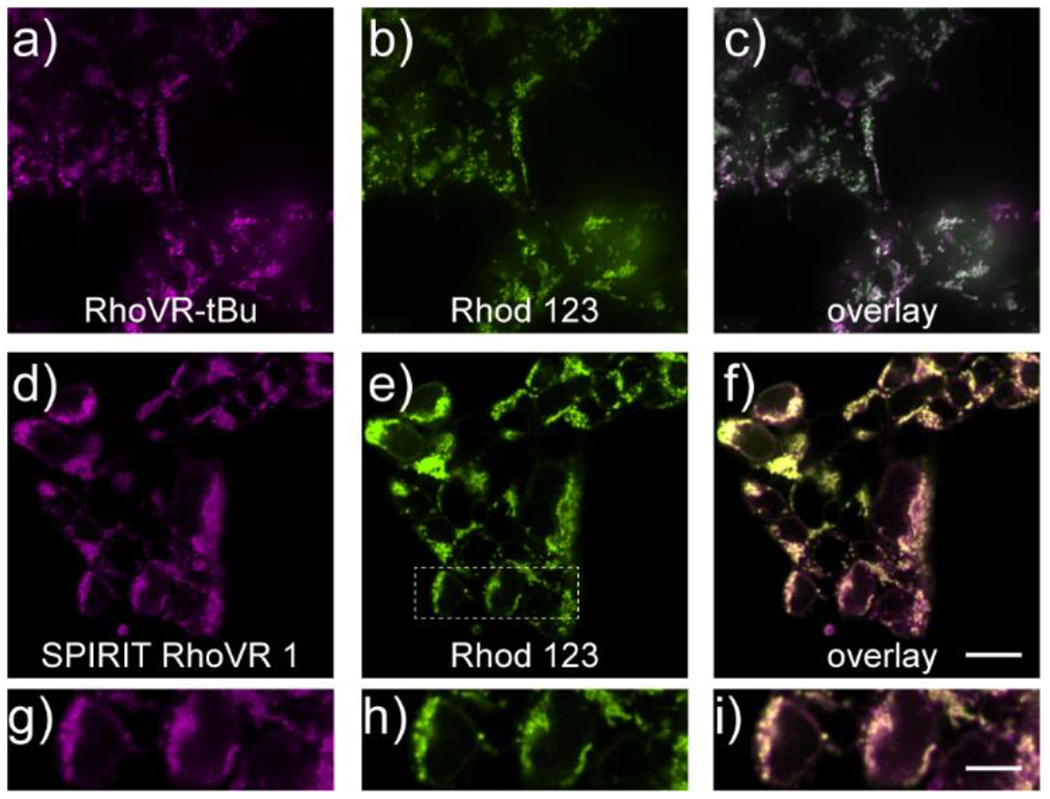
SPIRIT RhoVR 1 localizes to mitochondria in mammalian cells. Confocal fluorescence microscopy images of HEK cells stained with either a) RhoVR-tBu (250 nM) or d) SPIRIT RhoVR 1 (250 nM) and rhodamine 123 (250 nM, b and e). Overlay image of rhodamine 123 and either c) RhoVR-tBu or f) SPIRIT RhoVR 1. g-i) Expanded view of the boxed region in panel (e). Scale bar is 20 μm (a-f) or 10 μm (g-i)
Unlike traditional rhodamine esters, SPIRIT RhoVR 1 remains localized to mitochondria following depolarization. Mitochondrial depolarization causes accumulation-based dyes like rhodamine 123 to diffuse out of mitochondria,20 whereas SPIRIT RhoVR1 should be retained in mitochondria, since loss of AM ester reveals a charged carboxylate which prevents RhoVR-type molecules from crossing cellular membranes (Scheme 1).17 In contrast, intact esters of RhoVR-type molecules should accumulate in hyperpolarized mitochondria and diffuse out of depolarized mitochondria. We loaded HEK 293T cells with rhodamine esters rhodamine 123, RhoVR-tBu, and SPIRIT RhoVR 1 and induced mitochondrial membrane depolarization (Figure 2) with antimycin A21 (Figure S4). Antimycin A inhibits complex III, preventing electron transfer into cytochrome c and abolishing H+ transfer from the matrix to the inner membrane space, resuling in a loss of ΔΨm. Rhodamine 123 and RhoVR-tBu exhibit significant (p = 0.04 and 0.02, Figure S4e) washout from mitochondria and dilution into the dye-free external solution upon antimycin A treatment (Figure 2a/d and b/e), displaying fluorescence approximately 50% and 60% as bright as cells treated with vehicle (Figure S4e). By comparison, SPIRIT RhoVR 1 fluorescence is retained (Figure 2c/f) at levels nearly identical to vehicle controls (Figure S4e). SPIRIT RhoVR 1 remains localized to mitochondria, even after antimycin A-induced depolarization (Figure S4f–h).
Figure 2.
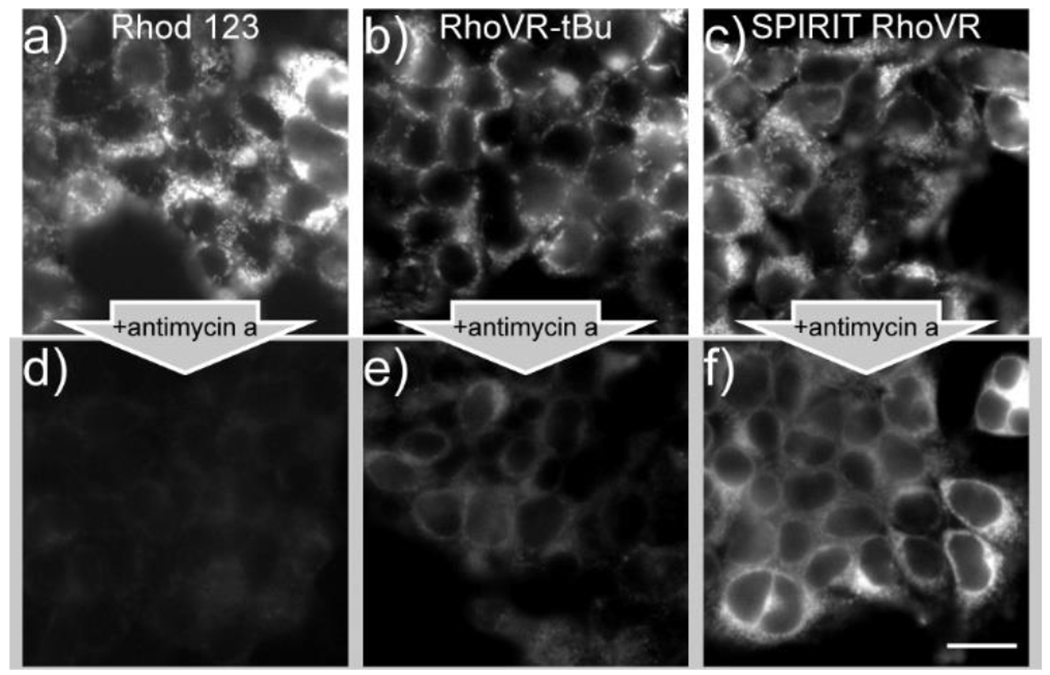
SPIRIT RhoVR1 is retained in mitochondria after dissipation of ΔΨm with antimycin A. Widefield fluorescence microscopy of rhodamine or RhoVR derivative (250 nM) in the a-c) absence or d-f) presence of antimycin A (5 μg/mL). Widefield fluorescence microscopy of SPIRIT RhoVR1 in the c) absence or d) presence of 5 μg/mL antimycin A for 90 min. Scale bar is 20 μm.
SPIRIT RhoVR 1 tracks depolarizations and hyperpolarizations in ΔΨm with high fidelity. HEK 293T cells loaded with SPIRIT RhoVR 1 and treated with the protonophore carbonyl cyanide 4-(trifluoromethoxy)phenylhydrazone22 (FCCP, 500 nM) to collapse the ΔΨm show a decrease in fluorescence (Figure 3a, red), consistent with a depolarization of the inner mitochondrial membrane, which results in an increased rate of PeT, and subsequent decrease in fluorescence intensity (Scheme 1). Fluorescence intensity is restored to baseline levels upon washout of FCCP (Figure 3a, c–e, Movie S2). Cells loaded with SPIRIT RhoVR 1 and treated identically, but with a vehicle control (EtOH), show no change in fluorescence intensity (Figure 3a, blue). Identical experiments using cells loaded with SPIRIT RhoVR 0 (which lacks an aniline and is therefore not voltage-sensitive via a PeT-based mechanism)17 show no change in fluorescence (Figure 3b, Movie S3), consistent with a PeT mechanism of voltage sensing. The slow decay of fluorescence, even in vehicle controls, is likely due to a combination of photobleaching and slow leakage of unhydrolyzed SPIRIT RhoVR. TMRM a traditional, accumulation-based ΔΨm indicator, cannot report on reversible changes under these conditions (Figure S5). Higher concentrations of FCCP (>500 nM) should not be used. The micromolar levels of FCCP reported in the literature14,23 may cause artifacts in dyes that should not have a voltage response (Figure S6). SPIRIT RhoVR 1 can track reversible changes in ΔΨm across several common cell lines, including COS7, MCF-7, and HeLa (Figure S7)
Figure 3.
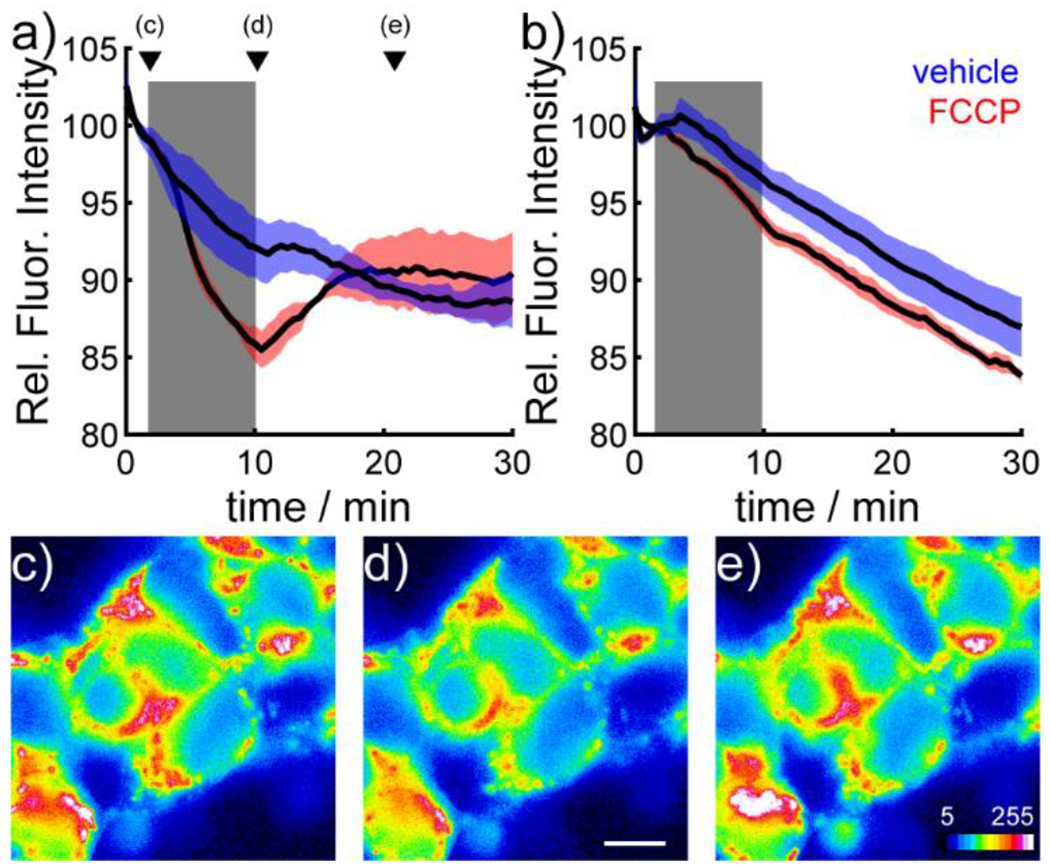
SPIRIT RhoVR 1 reports on ΔΨm dynamics in HEK cells. Plot of fluorescence intensity vs. time for HEK cells stained with a) SPIRIT RhoVR 1 (150 nM) or b) SPIRIT RhoVR 0(150 nM). At 2 minutes into the experiment (beginning of grey box) cells were perfused with either vehicle (ethanol, blue) or FCCP (500 nM, red). At 10 minutes (end of grey box) cells were perfused with HBSS. Data are mean (black line) ± S.E.M. (colored shading) for 3 separate experiments. Representative pseudocolor images of SPIRIT RhoVR 1-loaded HEK cells c) before, d) during, and e) after treatment with FCCP (500 nM). Scale bar is 10 μm for all images. Arrowheads in panel (a) indicate the timepoints of the representative images in panels c-e.
SPIRIT RhoVR 1 responds reversibly to changes in ΔΨm, allowing the real-time observation of voltage dynamics without the need for an extracellular pool of indicators and can be used to detect ΔΨm changes induced by nanomolar concentrations of FCCP. Because of its robust response to ΔΨm dynamics, we thought that SPIRIT RhoVR 1 could be an important component of methods to monitor multiple cellular physiological parameters simultaneously. We stained HEK 293T cells with Oregon Green BAPTA (OGB, to monitor intracellular Ca2+),24 BeRST 1, a far-red plasma Vmem indicator,25 and SPIRIT RhoVR 1. Cells loaded in this way show clear cytosolic fluorescence in the OGB channel (Figure 4a), mitochondrial-localized tetramethyl rhodamine fluorescence from SPIRIT RhoVR 1 (Figure 4b), and plasma membrane-localized fluorescence in the far-red channel from BeRST 1 (Figure 4c), Importantly, we are able to isolate the excitation and emission spectrum of each indicator, minimizing excitation and emission cross-talk (Figure S8) to allow real-time, three-color imaging (Figure 4d, Movie S4).
Figure 4.
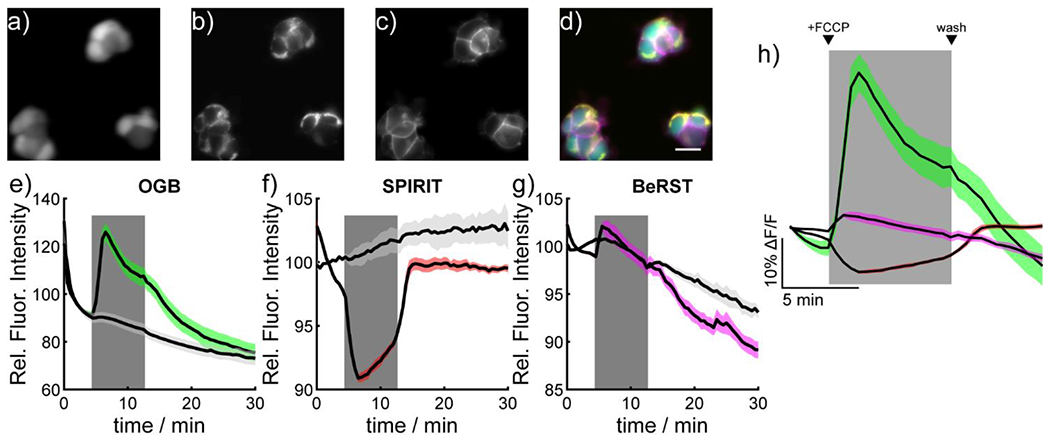
Simultaneous, multicolor imaging of mitochondrial membrane potential, cytosolic Ca2+, and plasma membrane potential in mammalian cells. Widefield epifluorescence image of HEK cells stained with a) Oregon Green BAPTA-AM (OGB, 500 nM), b) SPIRIT RhoVR 1 (SPIRIT, 150 nM), c) and BeRST 1 (50 nM). d) An overlay of the images cytosolic localization of OGB (green), mitochondrial localization of SPIRIT RhoVR 1 (yellow), and plasma membrane localization of BeRST (magenta). Scale bar is 20 μm. Plots of fluorescence vs. time from HEK cells stained with e) OGB, f) SPIRIT RhoVR 1, or g) BeRST. At 4 minutes into the experiment (beginning of grey box) cells were perfused with either vehicle (ethanol, light grey) or FCCP (500 nM, colored trace). At 4 minutes (end of grey box) cells were recovered by perfusion with HBSS. Data are mean (black line) ± S.E.M. (colored shading) for 3 separate experiments. h) Shows a zoomed-in plot of the response of OGB (green), SPIRIT RhoVR 1 (red), and BeRST 1 (magenta). The grey box indicates the start and end of FCCP perfusion.
FCCP perfusion of cells with the three indicators gives an increase in OGB fluorescence with a peak change of nearly 30% over baseline, followed by a decay to steady-state levels of ~20% before returning to baseline upon removal of FCCP (Figure 4e), consistent with reports of Ca2+ release from mitochondrial stores in response to FCCP.26 Perfusion of vehicle control gives no change to OGB fluorescence (Figure 4e, light grey). The increase in cytosolic Ca2+ occurs simultaneously with the depolarization of ΔΨm, as measured by SPIRIT RhoVR 1 (Figure 4f,h), At the same time, BeRST fluorescence indicates a small FCCP-induced depolarization at the plasma membrane (Figure 4g, magenta).27‘28 Analysis of individual cell responses allows examination of the similarity of responses across all imaged cells (Figure S9).
In summary, we present the design, synthesis, and application of SPIRIT RhoVR 1, the first in its class of voltage-sensitive fluorophores that report on changes to ΔΨm via a PeT-based mechanism. SPIRIT RhoVR 1 shows excellent localization to mitochondria, is retained within the mitochondria even after the dissipation of ΔΨm, and can reversibly respond to both hyper- and depolarization of ΔΨm without the need for exogenous pools of dye in solution. In the future, we envision a palette of mitochondrial-targeted indicators, pairing with non-native enzymes to achieve enhanced targeting to mitochondria and other organelles, and development of indicators with improve brightness for monitoring rapid organelle membrane potential changes.
Supplementary Material
ACKNOWLEDGMENT
Research in the Miller lab is supported by the NIH (R35GM119855). EWM acknowledges support from the Camille Dreyfus Teacher Scholar Awards program. PEZK and JGM were supported in part by a training grant from the NIH (T32GM066698). Confocal imaging experiments were conducted at the CRL Molecular Imaging Center, supported by the Gordon and Betty Moore Foundation. We would like to thank Holly Aaron and Feather Ives for their microscopy training and assistance. We thank Hasan Celik and the staff of the College of Chemistry NMR facility for their assistance. Instruments in CoC-NMR are supported in part by NIH S10OD024998.
Footnotes
Supporting Information. Synthetic details, supporting figures, and data. This material is available free of charge via the Internet at http://pubs.acs.org.
REFERENCES
- 1.Grabe M; Oster G, Regulation of Organelle Acidity. Journal of General Physiology 2001,117 (4), 329–344. [DOI] [PMC free article] [PubMed] [Google Scholar]
- 2.Lehninger AL; Cox ΜM; Nelson DL, Lehninger Principles of Biochemistry. W.H. Freeman: New York, 2008. [Google Scholar]
- 3.Nicholls DG, Mitochondrial membrane potential and aging. Aging Cell 2004, 3, 35–40. [DOI] [PubMed] [Google Scholar]
- 4.Hoppe UC, Mitochondrial calcium channels. FEBS Letters 584,1975–1981. [DOI] [PubMed] [Google Scholar]
- 5.Summerhayes IC; Lampidid TJ; Bernal SD; Nadakavukaren JJ; Nadakavukaren KK; Sheperd EL; Chen LB, Unusual retention of rhodamine 123 by mitochondria in muscle and carcinoma cells. Proceedings of the National Academy of Sciences 1982, 79, 5292–5296. [DOI] [PMC free article] [PubMed] [Google Scholar]
- 6.Johnson LV; Walsh ML; Chen LB, Localization of mitochondria in living cells with rhodamine 123. Proceedings of the National Academy of Sciences 1980, 77 (2), 990–994. [DOI] [PMC free article] [PubMed] [Google Scholar]
- 7.Scaduto RC; Grotyohann LW, Measurement of Mitochondrial Membrane Potential Using Fluorescent Rhodamine Derivatives. Biophysical Journal 1999, 76, 469–477. [DOI] [PMC free article] [PubMed] [Google Scholar]
- 8.Reers M; Smith TW; Chen LB, J-Aggregate Formation of a Carbocyanine as a Quantitative Fluorescent Indicator of Membrane Potential. Biochemistty 1991, 30, 4480–4486. [DOI] [PubMed] [Google Scholar]
- 9.Zhao N; Li M; Yan Y; Lam JWY; Zhang YL; Zhao YS; Wong KS; Tang BZ, A tetraphenylethene-substituted pyridinium salt with multiple functionalities: synthesis, stimuli-responsive emission, optical waveguide and specific mitochondrion imaging. Journal of Materials Chemistry C 2013, 1, 4640–4646. [Google Scholar]
- 10.Elmore SP; Nishimura Y; Qian T; Herman B; Lemasters JJ, Discrimination of depolarized from polarized mitochondria by confocal fluorescence resonance energy transfer. Biochemistry and Biophysics 2004, 422,145–152. [DOI] [PubMed] [Google Scholar]
- 11.Feng R; Guo L; Fang J; Jia Y; Wang X; Wei Q; Yu X, Construction of the FRET Pairs for the Visualization of Mitochondria Membrane Potential in Dual Emission Colors. Analytical Chemistry 2019, 91, 3704–3709. [DOI] [PubMed] [Google Scholar]
- 12.Li X; Tian M; Zhang G; Zhang R; Feng R; Guo L; Yu X; Zhao N; He X, Spatially Dependent Fluorescent Probe for Detecting Different Situations of Mitochondrial Membrane Potential Conveniently and Efficiently. Analytical Chemistry 2017, 89, 3335–3344. [DOI] [PubMed] [Google Scholar]
- 13.Li X; Zhang R; Guo L; Zhang H; Meng F; Yang R; Li C; Liu Z; Yu X, Colocalization Coefficients of a Target-Switchable Fluorescent Probe Can Serve As an Indicator of Mitochondrial Membrane Potential. Analytical Chemistry 2019, 91, 2672–2677 [DOI] [PubMed] [Google Scholar]
- 14.Putti Perry SW; Norman JP; Barbieri J; Brown EB; Gelbard HA, Mitochondrial membrane potential probes and the proton gradient: a practical usage guide. Biotechniques 2006, 50 (2), 98–115. [DOI] [PMC free article] [PubMed] [Google Scholar]
- 15.Lemasters JJ; Ramshest VK, Imaging of Mitochondrial Polarization and Depolarization with Cationic Fluorophores. Methods in Cell Biology 2007, 80, 283–295. [DOI] [PubMed] [Google Scholar]
- 16.Liu P; Miller EW, Electrophysiology, Unplugged: Imaging Membrane Potential with Fluorescent Indicators. Acc Chem Res 2020, 53 (1), 11–19. [DOI] [PMC free article] [PubMed] [Google Scholar]
- 17.Deal PE; Kulkarni RU; Al-Abdullatif SH; Miller EW, Isomerically Pure Tetramethylrhodamine Voltage Reporters. Journal of the American Chemical Society 2016, 138 (29), 9085–9088. [DOI] [PMC free article] [PubMed] [Google Scholar]
- 18.Rutter GA; Burnett P; Rizzuto R; Brini M; Murgia M; Pozzan T; Tavare JM; Denton RM, Subcellular imaging of intramitochondrial Ca2+ with recombinant targeted aequorin: significance for the regulation of pyruvate dehydrogenase activity. Proceedings of the National Academy of Sciences 1996, 93 (11), 5489–5494. [DOI] [PMC free article] [PubMed] [Google Scholar]
- 19.Deal PE; Liu P; Al-Abdullatif SH; Muller VR; Shamardani K; Adesnik H; Miller EW, Covalently Tethered Rhodamine Voltage Reporters for High Speed Functional Imaging in Brain Tissue. Journal of the American Chemical Society 2020,142 (1), 614–622. [DOI] [PMC free article] [PubMed] [Google Scholar]
- 20.Johnson LV; Walsh ML; Bockus BJ; Chen LB, Monitoring of Relative Mitochondrial Membrane Potential in Living Cells by Fluorescence Microsocpy. Journal of Cell Biology 1981,88, 526–535. [DOI] [PMC free article] [PubMed] [Google Scholar]
- 21.Kim H; Esser L; Hossain ΜB; Xia D; Yu C; Riso J; van der Helm D; Deisenhofer J, Structure of Antimycin A1, a Specific Electron Transfer Inhibitor of Ubiquinol-Cytochrome c Oxidoreductase. Journal of the American Chemical Society 1999, 121 (20), 4902–4903. [Google Scholar]
- 22.Kalbáčová M; Vrbacký M; Drahota Z; Mĕlková Z, Comparison of the Effect of Mitochondrial Inhibitors on Mitochondrial Membrane Potential in Two Different Cell Lines Using Flow Cytometry and Spectrofluorometry. Cytometry A 2003, 52A, 110–116. [DOI] [PubMed] [Google Scholar]
- 23.Baracca A; Sgarbi G; Solaini G; Lenaz G, Rhodamine 123 as a probe of mitochondrial membrane potential: evaluation of proton flux through F0 during ATP synthesis. Biochimica et Biophysica Acta (BBA) - Bioenergetics 2003,1606 (1), 137–146. [DOI] [PubMed] [Google Scholar]
- 24.Gee KR; Poot M; Klaubert DH; Sun W-C; Haugland RP; Mao F Fluorinated xanthene derivatives as fluorescent dyes and their use in staining biological materials. WO9739064A1, 1997. [Google Scholar]
- 25.Huang YL; Walker AS; Miller EW, A Photostable Silicon Rhodamine Platform for Optical Voltage Sensing. J Am Chem Soc 2015,137 (33), 10767–76. [DOI] [PMC free article] [PubMed] [Google Scholar]
- 26.Luo Y; Bond JD; Ingram VM, Compromised mitochondrial function leads to increased cytosolic calcium and to activation of MAP kinases. Proceedings of the National Academy of Sciences 1997, 94 (18), 9705–9710. [DOI] [PMC free article] [PubMed] [Google Scholar]
- 27.Park KS; Jo I; Pak K; Bae SW; Rhim H; Suh SH; Park J; Zhu H; So I; Kim KW, FCCP depolarizes plasma membrane potential by activating proton and Na+ currents in bovine aortic endothelial cells. Pflugers Archiv : European journal of physiology 2002, 443 (3), 344–52. [DOI] [PubMed] [Google Scholar]
- 28.Kenwood BM; Weaver JL; Bajwa A; Poon IK; Byrne FL; Murrow BA; Calderone JA; Huang L; Divakaruni AS; Tomsig JL; Okabe K; Lo RH; Cameron Coleman G; Columbus L; Yan Z; Saucerman JJ; Smith JS; Holmes JW; Lynch KR; Ravichandran KS; Uchiyama S; Santos WL; Rogers GW; Okusa MD; Bayliss DA; Hoehn KL, Identification of a novel mitochondrial uncoupler that does not depolarize the plasma membrane. Molecular Metabolism 2014,3 (2), 114–123. [DOI] [PMC free article] [PubMed] [Google Scholar]
Associated Data
This section collects any data citations, data availability statements, or supplementary materials included in this article.


