

Abstract
Transcriptional enhancers are critical for development and phenotype evolution and are often mutated in disease contexts; however, even in well-studied cell types, the sequence code conferring enhancer activity remains unknown. To examine the enhancer regulatory code for pluripotent stem cells, we identified genomic regions with conserved binding of multiple transcription factors in mouse and human embryonic stem cells (ESCs). Examination of these regions revealed that they contain on average 12.6 conserved transcription factor binding site (TFBS) sequences. Enriched TFBSs are a diverse repertoire of 70 different sequences representing the binding sequences of both known and novel ESC regulators. Using a diverse set of TFBSs from this repertoire was sufficient to construct short synthetic enhancers with activity comparable to native enhancers. Site-directed mutagenesis of conserved TFBSs in endogenous enhancers or TFBS deletion from synthetic sequences revealed a requirement for 10 or more different TFBSs. Furthermore, specific TFBSs, including the POU5F1:SOX2 comotif, are dispensable, despite cobinding the POU5F1 (also known as OCT4), SOX2, and NANOG master regulators of pluripotency. These findings reveal that a TFBS sequence diversity threshold overrides the need for optimized regulatory grammar and individual TFBSs that recruit specific master regulators.
Sequence variation in transcriptional enhancers modulates inter- and intra-species phenotypic divergence due to changes in gene expression (McLean et al. 2011; Prescott et al. 2015; Kvon et al. 2016). These noncoding regulatory sequences are required to regulate tissue-specific gene expression during normal development, and genome-wide association studies (GWASs) reveal that disease-associated SNPs (single nucleotide polymorphisms) are more often found in noncoding regions of the genome displaying chromatin features associated with transcriptional enhancers (Visel et al. 2009b; The ENCODE Project Consortium 2012; Maurano et al. 2012). It is known that transcription factor binding site (TFBS) sequences are required for enhancer function and that transcription factors modulate enhancer activity in a cell type–specific manner; however, the precise sequence code conferring enhancer activity in each cell type remains unknown.
Extreme sequence conservation between mouse and human noncoding regions identifies active enhancers during development (Visel et al. 2008), but most mammalian enhancers do not display high sequence conservation. Enhancers active in specific cell types can be identified using chromatin features, for example, accessible chromatin, histone modifications, transcription factors, or co-activator binding (Chen et al. 2008, 2012; Visel et al. 2009a; Ernst and Kellis 2012; Libbrecht et al. 2019). Histone H3 K27 acetylation (H3K27ac) and H3 K4 monomethylation (H3K4me1) are enriched at enhancer regions, with increased H3K27ac signal associated with more active enhancers (Creyghton et al. 2010; Rada-Iglesias et al. 2011; Moorthy et al. 2017). However, predictions based on these chromatin features alone include ∼75% false positives (Farnham 2012; Visel et al. 2008, 2013; Kwasnieski et al. 2014; Barakat et al. 2018; Corces et al. 2018), and analysis of the identified enhancers has yet to reveal a DNA sequence code that determines enhancer function. Comparative chromatin analysis of liver from 20 mammals revealed that regions with conserved H3K27ac in multiple species (Villar et al. 2015) can be exploited to identify conserved enhancer sequence properties (Chen et al. 2018).
Regions bound by multiple transcription factors display increased regulatory activity by enhancer deletion, transgenic reporter assays, and massively parallel reporter assays (MPRAs), compared to regions bound by single transcription factors (Zinzen et al. 2009; Vanhille et al. 2015; Moorthy et al. 2017). In addition, regulatory activity is higher for synthetic heterotypic sequences constructed from four different TFBS sequences compared to homotypic sequences containing single repeated TFBS sequences (Smith et al. 2013; Fiore and Cohen 2016). However, the activity of these synthetic sequences has not been benchmarked against native enhancers. Combinatorial regulation by transcription factors is important for enhancer function; however, only 37% of genomic regions containing TFBS sequences for six different regulatory transcription factors display activity (Lloret-Fernández et al. 2018). Studies of specific native enhancers and MPRAs reveal that orientation and spacing of TFBS pairs, often referred to as a regulatory grammar, affects enhancer activity (Thanos and Maniatis 1995; Farley et al. 2016; Fiore and Cohen 2016). This regulatory grammar, in combination with TFBS sequence clustering, however, does not predict which regions exhibit enhancer activity in the genome, indicating we have an incomplete understanding of the regulatory code (Lusk and Eisen 2010; Smith et al. 2013; King et al. 2020). In this study, our aim is to identify sequence determinants of enhancer activity for naive pluripotent stem cells to provide a more comprehensive understanding of the transcriptional regulatory code that would allow for the construction of synthetic enhancers.
Comparative epigenomics reveals that pluripotent stem cell enhancers contain a conserved regulatory code
To decipher the regulatory code in pluripotent cells, we investigated regions bound by multiple transcription factors in mouse and human embryonic stem cells (ESCs) (* in Fig. 1A), as these regions are more likely to show enhancer activity (Ballester et al. 2014). To identify these regions, 1-kb segments bound by at least one transcription factor from the following set of nine transcription factors—POU5F1, SOX2, NANOG, KLF4, KLF2, ESRRB, SMAD1, STAT3, and TFCP2L1—in mouse were clustered based on active enhancer features. These 20 features included: H3K27ac and transcription factor binding determined by chromatin immunoprecipitation sequencing (ChIP-seq) data from both mouse and human ESCs (20 features indicated in Fig. 1B; Supplemental Table S1). The resulting clusters included regions with conserved high enhancer feature (CHEF), conserved medium enhancer feature (CMEF), mouse-specific high enhancer feature (msHEF), and six conserved low enhancer feature (CLEF) clusters, most of which were bound by only one transcription factor and displayed low H3K27ac in both species. The CHEF and msHEF clusters, containing the greatest enrichment for active validated enhancers (Schnetz et al. 2010; Zhou et al. 2014; Murtha et al. 2014; Moorthy et al. 2017), and increased association of the EP300 co-activator (Fig. 1C), make up only 17% of the total mouse transcription factor–bound regions, in accordance with a recent MPRA revealing that only 17%–26% of transcription factor–bound regions possess enhancer activity (Barakat et al. 2018). By starting with transcription factor–bound regions in mouse, we could not identify human-specific high enhancer feature (hsHEF) regions; however, clustering transcription factor–bound regions from human ESCs identified hsHEF regions and 86.5% of the same CHEF regions identified in mouse (Supplemental Fig. S1A).
Figure 1.

Conserved high enhancer feature (CHEF) regions contain a conserved regulatory code. (A) The Lefty1/Lefty2 locus in the mouse (top) and human (bottom) genomes. Transcription factor–bound regions from ChIP-seq (red bars), mouse and human syntenic regions (gray bars), and H3K27ac ChIP-seq data are displayed on the mm10 and hg19 assemblies of the University of California at Santa Cruz (UCSC) Genome Browser. * indicates regions with conserved binding of multiple transcription factors in mouse and human; # indicates regions with binding only in mouse ESCs. (B) Clustering of transcription factor–bound regions in mouse ESCs, using H3K27ac, transcription factor binding, and the number of transcription factors bound in a region (TF sum) at associated mouse and human regions. (C–E) Groups determined by one-way ANOVA to be significantly different (P < 0.05) are labeled with different letters; to indicate P > 0.05, groups are labeled with the same letter. In the violin plots, the white dot indicates the median; the red box indicates the mean; the dashed line indicates the mean for the CLEF cluster. (C) CHEF, CMEF, and msHEF regions display significantly increased EP300 association compared to CLEF regions. (D) CHEF regions display the highest overall percentage of sequence identity between mouse and human compared to other clusters and random regions not bound by transcription factors. (E) CHEF regions contain an increased number of unique TFBS sequences for ESC-expressed TFs compared to other clusters and random regions not bound by transcription factors. This was identified using MotEvo based on TFBS sequence conservation across six species.
We next identified features that distinguished CHEF sequences from other genomic regions. CHEF sequences had increased DNA sequence conservation between mouse and human species compared to other clusters (Fig. 1D) but could not be identified based on sequence conservation alone, as many other noncoding regions display this level of conservation. As MPRA has revealed that TFBS sequence conservation, rather than overall sequence conservation, is a determinant of enhancer activity (Kheradpour et al. 2013), we analyzed matches to known transcription factor binding motifs (TFBS) from the JASPAR database (Mathelier et al. 2016). CHEF mouse-human TFBS sequence conservation, in comparison to scrambled TFBS sequences, indicated several TFBSs are significantly conserved between these species (P < 2.2 × 10⁻¹⁶, Wilcoxon rank-sum test) (Supplemental Fig. S1B,C). We tested this further by evaluating TFBS sequence conservation in CHEF regions across six species (human, rhesus macaque, mouse, rat, cow, and pig) using MotEvo, which provides the posterior probability of functional sites based on both the degree to which the sequence matches the position weight matrix (PWM) and sequence conservation across species using a Bayesian model (Arnold et al. 2012). As the inclusion of multiple different TFBSs is important for activity of synthetic regulatory sequences (Smith et al. 2013; Fiore and Cohen 2016), and conserved TFBSs are more likely to be functional, we evaluated the number of conserved and unique TFBSs, corresponding to ESC-expressed transcription factors, in each of the sequences. From this set of 349 TFBSs, we found CHEF sequences contain on average 12.6 unique TFBS sequences for ESC-expressed TFs that are conserved across six species. This is a significantly higher number of conserved and unique TFBSs compared to all other groups (Fig. 1E). Even after removal of any TFBS associated with transcription factors for which binding data were used to identify CHEF regions, CHEF sequences contain an increased number of conserved TFBS sequences compared to all other groups, indicating that there are additional regulatory transcription factors important in pluripotent cells (Supplemental Fig. S1D).
Conserved enhancers contain a large repertoire of TFBS sequences and limited conserved regulatory grammar
To determine the importance of specific TFBS sequences, LASSO (least absolute shrinkage and selection operator) (Tibshirani 1996) logistic regression was used to identify the TFBS sequences enriched and conserved in CHEF regions compared to the NANOG-bound low enhancer feature cluster. The NANOG-bound cluster was chosen because this cluster displays the lowest H3K27ac enrichment and because NANOG lacks a specific TFBS in JASPAR ensuring that no specific TFBS motifs are artificially associated with inactive regions. This analysis identified 125 enriched and conserved TFBSs, which, based on high correlation between PWMs, could be reduced to 70 distinct TFBS sequences (PWM Pearson's correlation <0.65) (see Methods; Fig. 2A; Supplemental Fig. S2A; Supplemental Table S2). Ninety-three percent of the CHEF-enriched TFBS sequences identified using the NANOG-bound low enhancer feature cluster as the negative set also displayed enrichment when either the ESRRB- or TFCP2L1-bound clusters were used as the negative set (Supplemental Table S2).
Figure 2.

A large repertoire of transcription factor binding sequences contributes to enhancer activity. (A) Heat map indicating the TFBS sequences enriched (red) or depleted (blue) in conserved high enhancer feature regions (CHEF) compared to the NANOG-bound low enhancer feature regions. (B) Overlap between conserved high enhancer feature (CHEF) regions and ChIP-seq peaks for transcription factors predicted to bind these regions based on TFBS sequence enrichment in CHEF regions (PRDM14, E2F1, ZFX) or predicted not to bind CHEF regions based on TFBS sequence depletion (MTF2).
The CHEF-enriched TFBS sequences include those bound by well-characterized pluripotency-associated transcription factors (e.g., POU5F1:SOX2, KLF4, ESRRB) and those corresponding to ChIP-seq data used for clustering (Fig. 1B), as well as several TFs not usually associated with the pluripotency state. To test enhancer regions for enriched binding of transcription factors corresponding to novel CHEF-enriched TFBSs, we identified ChIP-seq data for PRDM14, ZFX, and E2F1 in ESCs. These data were not included in the initial clustering as these transcription factors are not considered core pluripotency regulators. PRDM14, ZFX, and E2F1 all display enriched binding in the regions enriched with enhancer features (CHEF, CMEF, and msHEF) compared to the negative CLEF regions (P < 0.0001, hypergeometric test) (Fig. 2B; Supplemental Fig. S2B). In addition, the CHEF regions bound by PRDM14, ZFX, or E2F1, as indicated by overlap to a ChIP-seq peak, are enriched in their respective TFBS sequences compared to the CHEF regions not overlapping a ChIP-seq peak (P < 0.05, hypergeometric test). In the case of MTF2, a known repressor (Zhang et al. 2011b), the TFBS was depleted from conserved enhancer regions. Consistent with this finding, ChIP-seq peaks for MTF2 are significantly depleted from CHEF regions compared to CLEF regions (P < 0.0001, hypergeometric test) (Fig. 2B). To evaluate conserved regulatory grammar in CHEF regions, we investigated orientation bias for pairs of TFBSs from the 70 different TFBS sequences which were enriched in CHEF regions (Supplemental Table S3). We determined that only 7.9% (191/2415) of enriched TFBS pairs displayed orientation bias in CHEF regions. These results indicate that individual CHEF regions are enriched with several conserved TFBS sequences but that TFBS pairs generally do not display relative orientation preferences.
Construction of synthetic enhancers reveals that TFBS diversity is required and sufficient for robust enhancer activity
As CHEF regions with conserved transcription factor binding in mouse and human ESCs contain more than 12 conserved TFBS sequences and little evidence of conserved regulatory grammar, we hypothesized that TFBS diversity within individual sequences is sufficient for enhancer activity. If this is the case, we should be able to construct synthetic enhancers based on this model. Synthetic sequences containing a consensus TFBS (the most favored sequence based on the PWM) separated by 2-bp spacers were constructed for evaluation in reporter assays (Supplemental Table S4). We first evaluated a construct containing 14 copies of the POU5F1:SOX2 TFBS (14OS), as this PWM was the most enriched in CHEF sequences. However, we determined that this construct had almost no enhancer activity, compared to the native Sox2 enhancer (Fig. 3A). To evaluate the role of TFBS sequences predicted to bind different transcription factors (TFBS diversity) within individual synthetic sequences, we selected TFBSs enriched in CHEF regions, using only those with a different PWM (PWM Pearson's correlation <0.65) (as indicated in Supplemental Table S2), which are therefore expected to recruit different transcription factors. We created three synthetic enhancers, each containing a different set of 14 TFBS (Supplemental Table S4). All three sequences displayed robust enhancer activity, comparable to the native Sox2 enhancer, and activity significantly higher than the synthetic sequence containing 14 copies of the POU5F1:SOX2 comotif (P < 0.001, ANOVA) (Fig. 3A). This finding supports a heterotypic enhancer model in which multiple different TFBSs are needed for robust enhancer activity, but sequences composed entirely of repeated TFBS should not act as enhancers. One of the synthetic sequences (14dTFBS_a) contains the POU5F1:SOX2 comotif; however, this motif is dispensable for enhancer activity as the other two synthetic enhancers (14dTFBS_b and 14dTFBS_c) lacked both POU5F1 and SOX2 motifs (Fig. 3A). Previous optimization of synthetic sequences, containing the KLF4, SOX2, POU5F1, and ESRRB TFBS, identified two ordered combinations with the highest activity by MPRA (ksOE and sOKE), although the activity of these was not compared to a native enhancer in those studies (Fiore and Cohen 2016; King et al. 2020). Compared to our synthetic enhancers containing 14 different TFBS and to the native enhancer, these optimized 4 TFBS sequences displayed significantly less activity (P < 0.01, ANOVA) (Fig. 3A). This finding suggests that 4 TFBS is below the threshold for robust enhancer activity even when an optimized regulatory grammar is used. To evaluate the role of spacer sequences in enhancer activity, we compared the 2-bp CC spacers we used to the longer spacers used in the Fiore and Cohen MPRA (ksOE[long] and sOKE[long]) and determined that the shorter CC spacer does not significantly affect enhancer activity in this context (Fig. 3A; Supplemental Table S4).
Figure 3.
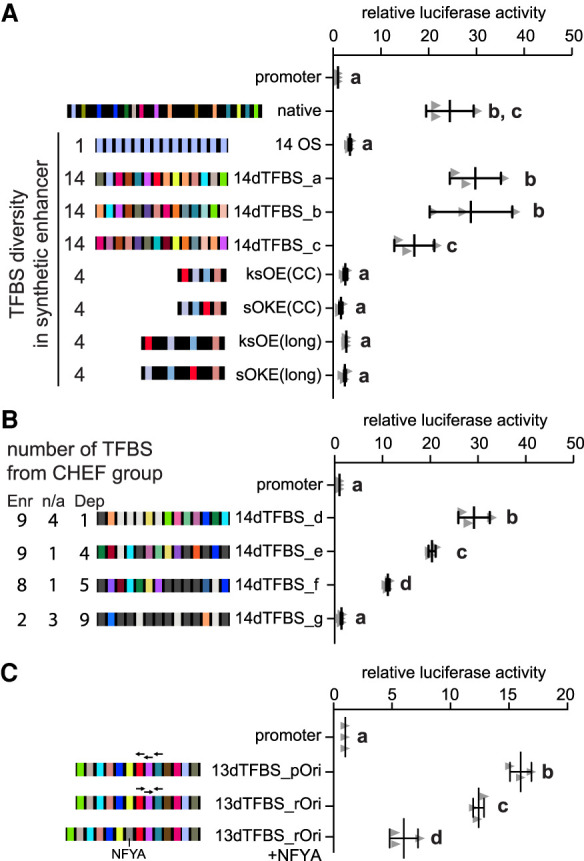
Synthetic sequences reveal that transcription factor binding site diversity is required and sufficient for robust enhancer activity. In panels A–C, error bars represent the standard deviation; groups determined by one-way ANOVA to be significantly different (P < 0.05) are labeled with different letters; to indicate P > 0.05, groups are labeled with the same letter. n ≥ 3 biological replicates. (A) Synthetic enhancers were evaluated in reporter assays and compared to the activity of the Sox2 enhancer (native). A sequence containing 14 POU5F1:SOX2 TFBS (14OS), 14 different TFBSs (14dTFBS_a, _b, _c) from the CHEF-enriched TFBS were evaluated. Optimized 4 TFBS sequences (ksOE, sOKE), with either CC or long spacers between motifs were also evaluated. (B) Enhancer activity is reduced when sequences contain fewer CHEF-enriched (Enr) and more CHEF-depleted (Dep) TFBSs. The number of TFBSs that are neither enriched or depleted is indicated by n/a. (C) The effect of motif orientation and repressor binding on enhancer activity. 13dTFBS_pOri contains the preferred orientation, 13dTFBS_rOri contains reversed TFBS. Addition of the repressor NFYA to 13dTFBS_rOri affects but does not abolish enhancer activity.
We hypothesized that a threshold of TFBS corresponding to those enriched in CHEF regions is required for enhancer activity and, furthermore, that TFBS substitution with TFBSs depleted from CHEF regions would interfere with activity. We tested this hypothesis with sequences constructed from 14 different TFBS sequences containing a varying number of TFBSs enriched, depleted, or neutral in CHEF sequences (Enr, Dep, n/a) (Fig. 3B; Supplemental Table S2). 14dTFBS_d to 14dTFBS_g have an increasing number of TFBSs from the CHEF-depleted set. Enhancer activity was found to be lower in constructs with an increased number of TFBSs from the CHEF-depleted set and fewer TFBSs from the CHEF-enriched set (Fig. 3B). In fact, 14dTFBS_g had no enhancer activity with 12 TFBSs from the CHEF-depleted or -neutral set and only two TFBSs from the CHEF-enriched set (Fig. 3B). All TFBS sequences included in our analysis corresponded to ECS-expressed transcription factors, indicating that, although there is flexibility in the specific TFBSs that contribute to activity, the combination of any 14 TFBSs corresponding to ESC-expressed transcription factors do not function as an enhancer.
Although we were able to construct active synthetic enhancers by randomly ordering the selected TFBS sequences, we also identified orientation bias for a limited subset of enriched TFBS pairs within CHEF sequences. For example, ZNF263 showed orientation bias with SP1 and KLF4 (P < 0.001, binomial test) (Supplemental Table S3). To evaluate the effect of orientation, a synthetic sequence containing 13 TFBSs with the preferred orientation for these TFBSs (13dTFBS_pOri) was compared to the reversed orientation (13dTFBS_rOri) (Fig. 3C). This comparison revealed that orientation has an effect on enhancer activity but is not a requirement, as activity was not abolished in the reversed orientation construct. We also observed that FOXJ3 and FOXH1 are more often distant from NFYA in CHEF sequences (Supplemental Table S3), suggesting that pairing the NFYA TFBS with FOXJ3 and FOXH1 could disrupt enhancer activity. This is supported by the observation that NFYA can act as a repressor in combination with specific interaction partners (Peng and Jahroudi 2002). We placed the NFYA binding sequence adjacent to FOXH1 and FOXJ3 (13dTFBS_rOri + NFYA) and observed a significant reduction in enhancer activity compared to 13dTFBS_rOri (Fig. 3C). These data indicate regulatory grammar can affect enhancer activity but has a subtle effect which may fine-tune gene expression.
Additional TFBS sequences confer gain-of-function to an inactive transcription factor–bound region
To test if a diversity of TFBS sequences could confer gain-of-function to a native inactive transcription factor–bound region, we evaluated a cluster of regions downstream of Sall1. Deletion of the entire cluster affected only Sall1 transcription determined by RNA-seq (Moorthy et al. 2017), indicating Sall1 is the only regulated gene for this cluster. Within the cluster (ΔEC), there are three separate transcription factor–bound regions designated as multiple transcription factor–bound loci (MTL) (Fig. 4A). Only two of these MTLs have enhancer activity in a reporter assay or by CRISPR-Cas9-mediated deletion from the genome (Fig. 4B/C). In addition, Sall1 transcript abundance after deletion of both MTL40 and 28 did not differ from deletion of the entire cluster, indicating MTL52 has no independent enhancer activity (Supplemental Fig. S3). Within a core region of MTL52, six different transcription factors bind at an overlapping region, whereas the active MTLs (40/28) are each bound by nine transcription factors. We hypothesized MTL52 remained below a required TFBS diversity threshold but that enhancer activity could be gained by adding a limited number of TFBS sequences. Addition of three TFBSs—ESRRB, TFCP2L1, and SMAD3 (Fig. 4D, +E+T+S) or TFCP2L1, SMAD3, and E2F1 (Fig. 4D, +T+S+E2F1)—to the MTL52 core region caused significantly increased enhancer activity, whereas addition of only two TFBSs was not sufficient (Fig. 4D, +T+S). These data indicate that diversity and abundance of different TFBS sequences are required for enhancer activity, but there is flexibility in TFBS usage.
Figure 4.
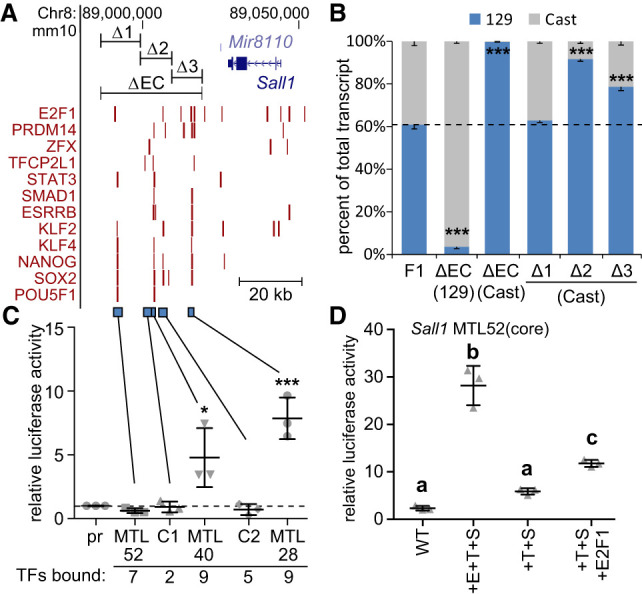
Addition of three different transcription factor binding sequences confers activity to an inactive region bound by six transcription factors. (A) Transcription factor–bound regions in the Sall1 locus from ChIP-seq (red bars) are displayed on the mm10 assembly of the UCSC Genome Browser. At the top, CRISPR deleted regions (ΔEC, Δ1, Δ2, Δ3) are displayed. At the bottom, regions tested for enhancer activity are displayed (blue bars). (B) Sall1 expression in wild-type F1 clones (F1) compared to clones with the indicated deletion. Allele-specific primers detect 129 or Cast RNA in RT-qPCR. Expression for each allele is shown relative to the total. Error bars represent SEM. n ≥ 3 biological replicates. (***) P < 0.001; significant differences from the F1 values. In C,D, error bars represent the standard deviation. n ≥ 3 biological replicates. (C) Luciferase activity at control (C1, C2) regions and multiple transcription factor–bound loci (MTL) 52, 40, and 28 kb downstream from Sall1. Significant differences from pr (promoter only) were determined by t-test and are indicated by (*) P < 0.05, (***) P < 0.001. (D) Luciferase activity for wild-type (WT) MTL52 core transcription factor–bound region, MTL52 core with ESRRB, TFCP2L1, and SMAD3 (+E+T+S) motifs mutated to the consensus TFBS sequence. From +E+T+S, ESRRB (+T+S) was removed. E2F1 was added to +T+S (+T+S+E2F1). Groups determined by one-way ANOVA to be significantly different (P < 0.05) are labeled with different letters.
A threshold number of TFBS sequences are required for native and synthetic enhancer activity
The number of conserved TFBS sequences in natural enhancers, activity of our synthetic enhancers with 14 different TFBSs compared to the 4 TFBS constructs, and the addition of TFBS to the Sall1 MTL52 all suggest that a threshold number of TFBS sequences are required for enhancer activity. To experimentally investigate this threshold more directly, we evaluated synthetic sequences with a decreasing number of different TFBS sequences (Fig. 5A; Supplemental Table S4). Sequential removal of TFBS from 14dTFBS_a revealed that sequences with 14 and 12 different TFBSs displayed significant enhancer activity whereas sequences with five, seven, and 10 different TFBSs did not display significant activity. Each of these sequences contains the POU5F1:SOX2 TFBS and although this TFBS is the most overrepresented in the CHEF regions, more than nine additional different TFBSs are required for robust activity (12dTFBS) (Fig. 5A; Supplemental Table S4), suggesting that 10 or more different TFBSs are required for robust enhancer activity, even when TFBSs bound by master regulatory transcription factors are present in the sequence.
Figure 5.

Ten or more different transcription factor binding sequences are required for enhancer activity. (A) Sequential removal of TFBS to form 14dTFBS_a revealed the importance of multiple TFBS sequences for enhancer activity and a threshold requirement of 10 TFBSs. Error bars represent the standard deviation; groups determined by one-way ANOVA to be significantly different (P < 0.05) are labeled with different letters. (B) Enhancers that regulate Sox2 or Med13l contain multiple conserved TFBSs (top) which are required for activity as demonstrated by TFBS mutagenesis (bottom). TFBSs indicated in blue were required for enhancer activity; TFBSs indicated in gray were not modified; yellow indicates TFBSs found not to be required for activity. Significant differences compared to the wild-type (WT) sequence are indicated by (*) P < 0.05, (***) P < 0.001, (ns) = not significant. Error bars represent the standard deviation. (C) Transcription factor–bound regions in mouse ESCs with >10 TFBSs have significantly higher enrichment of H3K27ac compared to transcription factor–bound regions with 8–10 and 1–7 TFBSs in the 700-bp sequence window. Groups determined by one-way ANOVA to be significantly different (P < 0.0001) are labeled with different letters. In the violin plots, the white dot indicates the median, the red box indicates the mean, and the dashed line indicates the average for the 1–7 TFBSs group. (D) Regions containing 10 or >10 CHEF-enriched TFBS sequences have significant enrichment of STARR-seq enhancers as indicated by (***) (P < 0.001, hypergeometric test). Regions containing 1–7 CHEF-enriched TFBS sequences are depleted in STARR-seq enhancers; (ns) indicates no significant enrichment of STARR-seq enhancers.
TFBS sequence removal from synthetic enhancers supported the hypothesis that TFBS diversity, above a threshold, confers enhancer activity. To investigate this threshold model in endogenous enhancers, and the TFBS repertoire we identified as enriched in CHEF sequences, we mutated identified conserved TFBS sequences in two validated ESC enhancers (Sox2 and Med13l enhancers) (Zhou et al. 2014; Moorthy et al. 2017), both of which are bound by six or more of the core pluripotency regulatory transcription factors, based on ChIP-seq (Supplemental Fig. S4A,B). In both enhancers, we determined that at least nine of the conserved TFBS sequences, enriched in CHEF regions, are required for enhancer activity (Fig. 5B). Although the Sox2 enhancer contained eight different conserved TFBS sequences confirmed to be important for activity, comutation of only two different TFBSs (TFAP2C and SP1) completely abolished enhancer activity (Fig. 5B). These data revealed that, in addition to TFBSs bound by the nine pluripotency transcription factors initially considered, additional TFBS sequences (those that bind TFAP2C, SP1, ZNF263, GBX2, ZIC3, TEAD4, and FOXH1) are important for enhancer activity, confirming that there is a large repertoire of TFBS sequences that contribute to enhancer activity in pluripotent cells.
To determine if the TFBS sequence diversity threshold model can identify regions of the genome with active enhancer features in mouse ESCs, we compared H3K27ac flanking the >18,000 transcription factor–bound regions to the number of different TFBS sequences contained within each sequence, considering the 70 different TFBS sequences enriched in CHEF regions (Supplemental Table S2). This analysis revealed that sequences with a greater number of different CHEF-enriched TFBSs display significantly higher H3K27ac (P < 0.0001, ANOVA) (Fig. 5C). Similarly, we found that regions containing an increased number of CHEF-enriched TFBSs display significantly increased sensitivity to DNase I (P < 0.0001, ANOVA) (Supplemental Fig. S5). We also found that regions containing an increased number of CHEF-enriched TFBSs display significantly increased enrichment for members of the mediator complex (MED12 and 23) and recruitment of RNA polymerase II (P < 0.01, ANOVA) (Supplemental Fig. S5). Although these features have been shown to correlate with enhancer activity, they can also be observed at nonfunctional regions. To obtain a clearer picture of enhancer activity, we investigated genome-scale STARR-seq data from naive embryonic stem cells (Peng et al. 2020). We observed that STARR-seq-identified positive enhancers are enriched in regions containing 10 and >10 TFBSs from the pluripotency repertoire we identified as enriched in CHEF regions (P < 0.0001, hypergeometric test) (Fig. 5D). In addition, STARR-seq-identified positive enhancers are significantly depleted in regions containing only 1–7 TFBSs from the repertoire (P < 0.0001, hypergeometric test) (Fig. 5D). To investigate the ability to drive transcription of a nearby gene, we examined the regulatory activity of these three TFBS classes (1–7, 8–10, and >10 CHEF-enriched TFBS) by comparing the expression of genes within a 200-kb window. We determined that genes with a >10 TFBSs region within 200 kb displayed significantly increased gene expression compared to both the 1–7 and 8–10 CHEF-enriched TFBS groups (P < 0.0001, ANOVA) (Supplemental Fig. S5). Together, these data indicate that highly heterotypic sequences containing a strong consensus for 10 or more TFBSs from the CHEF-enriched pluripotency repertoire are likely to be strong enhancers in ESCs.
Discussion
Based on these data, we propose a regulatory code for naive pluripotent stem cells that requires 10 or more TFBSs from the repertoire of 70 TFBS enriched in CHEF sequences. Transcription factors that bind this expanded TFBS repertoire are likely to be important regulators in pluripotent cells which could drive more efficient reprogramming in combination with conventional reprogramming factors. In support of this, SP5, TFAP2C, GBX2, E2F3, ZIC3, FOXP1/FOXO1, ZFX, and PRDM14 have recently been revealed as important regulators of pluripotency, self-renewal, or reprogramming and are able to bind a TFBS from the expanded repertoire we identified (Lim et al. 2007; Zhang et al. 2011a; Harel et al. 2012; Tai and Ying 2013; Tang et al. 2016, 2017; Pastor et al. 2018; Seki 2018).
TFBS sequence diversity above a threshold could facilitate recruitment of the large protein complexes required for transcriptional activation and elongation in mammalian cells. The mammalian mediator complex consists of 33 subunits and is required for RNA polymerase II transcription and gene expression in ESCs (El Khattabi et al. 2019). Furthermore, DNA sequences containing the POU5F1 TFBS act as a scaffold for phase-separated condensation of the mediator component MED1 in the nucleus (Shrinivas et al. 2019). In addition, within the set of transcription factors that bind the TFBS we identified as important for enhancer activity in pluripotent cells, individual transcription factors interact with different subcomponents of the mediator complex. SOX2 associates with MED22, NANOG with MED12, FOXJ3 with MED4 and 23, SMAD1 with MED6, 15, and 24, and ESRRB associates with several of the mediator complex proteins (Warde-Farley et al. 2010). Mediator recruitment could be facilitated by sequences that bind multiple different transcription factors, each able to associate with different components of the complex. In support of this, we identified increased association of MED12 and MED23 with sequences containing more than 10 TFBSs from the pluripotency repertoire compared to those containing fewer TFBSs.
Although examples exist where regulatory grammar is critical for activity as proposed by the enhanceosome model (Thanos and Maniatis 1995), our findings indicate TFBS diversity above a threshold has a greater impact on enhancer activity. Previous studies using synthetic sequences support the observation that heterotypic sequences have increased regulatory activity compared to sequences with fewer different TFBSs (Fiore and Cohen 2016; King et al. 2020). However, two studies assaying native sequences containing 4–6 different TFBSs found only 28%–37% of these possessed enhancer activity, suggesting that additional TFBSs present in the active sequences confer activity (Lloret-Fernández et al. 2018; King et al. 2020). The FOXP1 TFBS, a member of our pluripotency TFBS repertoire, was identified as one of the TFBSs enriched in the genomic sequences displaying enhancer activity in ESCs by King et al. (2020). Although we found that sequences in the genome with TFBS diversity in the range of 10 are significantly enriched in enhancer features and validated enhancers, there are likely to be special cases where fewer TFBSs can confer activity if a highly optimized grammar or specific TFBSs are present. Additional MPRA experiments using sequences containing 7–12 TFBSs from the repertoire could further clarify these rules. One aspect of the regulation of gene transcription in a genomic context that we have not investigated in this study is the interaction between distal enhancers and the gene proximal promoter region, as we have used a Pou5f1 minimal promoter region for all of our reporter assays. In future work, it will be important to determine to what extent different promoters modify the activity of distal enhancer sequences in a genome context and the role of the enhancer sequence in regulating chromatin architecture.
The observation that there is a large repertoire of TFBSs that can be flexibly used to support enhancer activity without the need for optimized regulatory grammar explains the difficulty in identifying a specific regulatory code in mammalian genomes. A recent study in B cells using STARR-seq coupled with FAIRE-seq identified 43 TFBSs significantly enriched in B cell enhancers (Chaudhri et al. 2020). Comparing these B cell TFBSs with the pluripotent cell TFBS repertoire we identified revealed only 14% overlap, suggesting that a large cell type–specific TFBS repertoire confers context-dependent enhancer activity. Similarly, MPRA analysis revealed that enhancer activity of PPARG-bound regions in adipocytes depends on additional flanking TFBSs from a repertoire of 33 TFBSs (Grossman et al. 2017), further supporting our findings. Similar to our CHEF regions, HOT sites display binding for multiple sequence-specific TFs, determined by ChIP-seq (Ramaker et al. 2020). The human CHEF regions we identified for pluripotent stem cells are significantly enriched in HOT sites identified for cancerous or transformed cell lines (13.6% overlap, P < 0.0001, hypergeometric test), suggesting that these cells may reactivate some of these conserved pluripotency-associated enhancers (Ramaker et al. 2020).
We also determined that there is flexibility in TFBS usage from this larger tissue-specific repertoire and that this can bypass the need for a specific individual TFBS, even the POU5F1:SOX2 comotif which binds the POU5F1, SOX2, and NANOG master regulators of pluripotency. This finding is supported by a recent study showing that POU5F1 can be excluded from the set of reprogramming transcription factors without limiting reprogramming efficiency (Velychko et al. 2019). Our work also reinforces the idea that master-regulator transcription factors are an oversimplification, and instead these regulators are part of a larger and complex “Gene Regulatory Network,” where inputs from all transcription factors in the network are similarly important (Singh et al. 2014).
Deciphering the TFBS repertoire in pluripotent stem cells supported the design of short synthetic enhancers which allow for fine-tuned control of gene expression in biotechnology and regenerative medicine contexts. Determining the repertoire of specific TFBSs important for enhancer activity in different cell types will inform a more mechanistic understanding of how specific enhancer SNPs affect gene expression and are linked to disease.
Methods
Clustering mouse and human transcription factor–bound regions
Transcription factor ChIP-seq data for mouse and human were obtained from ESCODE in the CODEX database and NCBI Gene Expression Omnibus (GEO; https://www.ncbi.nlm.nih.gov/geo/) (Supplemental Table S5; Sánchez-Castillo et al. 2014; Tsankov et al. 2015). Mouse transcription factor–bound regions were identified from 16 files representing binding of nine transcription factors (POU5F1, SOX2, NANOG, KLF4, KLF2, ESRRB, SMAD1, STAT3, and TFCP2L1). Human transcription factor–bound regions were obtained from nine files representing binding of seven transcription factors (POU5F1, SOX2, NANOG, KLF5, SMAD1, STAT3, and TCF4). The above-mentioned human TF-bound sequences determined by ChIP-seq were obtained from the CODEX database which uses alignment to hg19. As these regions displayed 99.7% sequence identity with GRCh38, we used the hg19 genome for the rest of the human sequence analysis. Overlapping transcription factor-bound regions were identified within 1-kb windows by overlap of the ChIP-seq peak regions. Mouse-human syntenic regions were identified using liftOver (-minMatch = 0.1) (Kuhn et al. 2013). The human sequences were extended by 1 kb from the midpoint to identify conserved transcription factor binding using BEDTools (Quinlan and Hall 2010). ChIP-seq data were retrieved for H3K27ac (GSE47949) (Wamstad et al. 2012) and EP300 (GSE24164) (Creyghton et al. 2010) in mouse ESCs or H3K27ac in naive human ESCs (GSE52824) (Gafni et al. 2013). The reads were mapped to respective genomes (mm10 and hg19) using Bowtie (Langmead et al. 2009). RPKM values for H3K27ac ChIP/input were calculated for 2-kb regions surrounding transcription factor–bound region midpoints. Venn diagrams were created using “eulerr” in R (Micallef and Rodgers 2014; R Core Team 2018).
To focus on conserved distal regulatory regions the 23,830 transcription factor–bound regions in mouse that aligned to the human genome after excluding promoters (transcription start site [TSS] −2 kb) were clustered into nine clusters. The H3K27ac ChIP-seq signal was assumed to follow a Gaussian distribution, whereas binding of transcription factor were assumed to follow Bernoulli distributions. The sums of mouse and human transcription factors (TF sum in Fig. 1) were assumed to follow Poisson distributions. To optimize parameters of the mixture model, we used the expectation maximization algorithm, which requires initial parameter values. We used Behrouz Babaki's implementation of constrained k-means (https://github.com/Behrouz-Babaki/COP-Kmeans) (Wagstaff et al. 2001) to generate initial clusters. Using the “pomegranate” package, “IndependentComponentsDistribution” was used to create a multivariate distribution using the initial clusters’ parameters and finally the “GeneralMixtureModel” function was used to fit and predict the clusters of enhancers (Schreiber 2018). For the cluster visualization, a heat map was generated using the “seaborn” package (https://zenodo.org/record/883859#.YDV0AthKhaQ), in which each feature is scaled from 0 to 1. The cluster output with the lowest Bayesian information criterion (BIC) was chosen as the final cluster.
TFBS conservation and enrichment analysis
TFBS analysis was carried out for sequences within each cluster and random inter-genic regions selected from regions not bound to a transcription factor in mouse or human ESCs based on the ChIP-seq data used in this analysis. Any region overlapping an exon or the 2 kb upstream of a TSS was removed, as these sequences are often highly conserved. Using 700 bp of sequence centered on the midpoint of the transcription factor–bound region (or sequence midpoint for regions not bound by transcription factors) in the mouse genome, the corresponding syntenic regions in the human, rhesus macaque, rat, cow, and pig genomes were identified using liftOver. After liftOver, the sequence was expanded to 2 kb prior to multisequence alignment (MSA). MSA was performed using Mafft (Katoh and Standley 2013) E-INS-I (Iterative refinement method) with the “adjustdirectionaccurately” feature. MSA was trimmed on both the 5′ and 3′ ends to best match the 700-bp mouse reference sequence with respective aligned sequences from the other five species. The mouse sequence was scanned for TFBSs with a relative profile threshold of 90% for all 519 nonredundant JASPAR profiles by using “searchSeq” in “TFBSTools” (Tan and Lenhard 2016) and the “JASPAR2016” (Mathelier et al. 2016) package in R. For purifying selection pressure analysis of the CHEF cluster, putative sites with a score >11 for each JASPAR PWM were evaluated, which represent strong motif matches for each TFBS sequence. Human-mouse percent identity for each TFBS was calculated using TFBSTools-identified motifs in the mouse sequence and the corresponding sequences for human based on the MSA. TFBS conservation between species was calculated as the average percentage identity between mouse and human of all motifs for each individual PWM. Scrambled PWMs for all 519 JASPAR profiles were created using “permuteMatrix” in TFBSTools (Tan and Lenhard 2016), and those scrambled PWMs were scanned in the mouse sequence and mouse-human percent identity was calculated as described above to identify scrambled TFBS conservation between mouse and human species.
The 700-bp trimmed six species MSA for each of the regions in the nine clusters and random regions was used as input for MotEvo (Arnold et al. 2012) with mouse as the reference sequence. Input parameters for MotEvo included nucleotide percentage and averaged phylogenetic tree for all six species which were calculated using the MSA of CHEF regions. Phylogenetic trees were generated using PhyML (Guindon et al. 2010) for those MSAs with liftOver sequences in all six species. MotEvo analysis was performed using refspecies Mouse; Mode: TFBS; EMprior: 0; markovorderBG: 0; minposterior: 0.2. MotEvo output resulted in posterior probabilities for each of the 349 redundant PWMs belonging to expressed transcription factors in ESCs (log RPKM ≥ 0.025, RNA-seq using GEO accession number GSE63831), which were used as features in machine learning to distinguish CHEF sequences from the NANOG cluster. To rank and select important features, LASSO was used with the Scikit-learn (Pedregosa et al. 2011) Python module. LassoLarsCV with 10-fold cross-validation was used to identify the parameter (−log[alpha]), which generated the highest classification accuracy which was then used for feature selection.
To determine the number of conserved different TFBSs present in cluster regions, the number of different MotEvo-identified motifs, from the set of 349 TFBSs, were counted in each sequence. To determine if conserved TFBSs are present in addition to any corresponding to the nine transcription factors used for cluster analysis, the number of different MotEvo-identified motifs, from a reduced set of 309 TFBS, were counted in each sequence.
Three hundred forty-nine TFBSs belonging to transcription factors expressed in ESCs were reduced to 137 TFBSs significantly different from each other (Pearson's correlation coefficient <0.65), which included 70 TFBSs enriched in CHEF (LASSO > 0) using TFBSTools (Tan and Lenhard 2016). This set of enriched TFBSs was used to identify the number of different TFBSs present within a 700-bp window for all transcription factor–bound regions (>18,000). Motifs with score >11 as described above were identified using TFBSTools. The relationship between the increasing number of different TFBSs from the enriched TFBS set and enhancer features H3K27ac, DHS (GSE37074), MED12, MED23, and RNA polymerase II, in the 2-kb flanking regions, was analyzed. Respective accession numbers for the GEO data used are given in Supplemental Table S5.
STARR-seq data analysis
STARR-seq input DNA and RNA for mESC 2iL (cells maintained in two inhibitor LIF media) were obtained from GEO (Supplemental Table S8; Peng et al. 2020). The reads were mapped to the mm10 reference genome using BWA-MEM (Li 2013). Reads were processed using SAMtools (Li et al. 2009) and Picard (http://broadinstitute.github.io/picard) to remove reads with low quality (MAPQ < 10; f = 2) and duplication, respectively. STARR-seq peaks (12,025) were called using MACS2 (Zhang et al. 2008) with the RNA replicates as “treatment” and the input DNA replicates as “control” (-g mm -f BAMPE ‐‐bw 800). The top 5000 STARR-seq enhancer peaks, displaying the greatest enrichment compared to the control in the 700-bp window centered on the peak summit (RNA/DNA ratio, calculated using featureCounts) (Liao et al. 2014), were chosen for the TFBS repertoire enrichment analysis. Similarly, 5000 regions having the lowest nonzero RNA/DNA ratio were chosen as STARR-seq negatives. The relationship between the log enrichment ratio of STARR-seq positives to negatives and the number of different TFBSs from the CHEF-enriched TFBS repertoire in 700-bp sequences was performed using TFBSTools as mentioned above.
Site-directed mutagenesis
For the analysis of conserved TFBSs in the Sox2 and Med13l enhancers, the two nucleotides in the motif with the highest score in the consensus were mutated to nonconsensus nucleotides. The effect of the mutation was tested using TFBSTools to confirm that it disrupted the reference TFBS without creating another TFBS for an ESC-expressed TF. Mutations in enhancer sequences in the pGL4.23 vector were introduced using the QuikChange Lightning kit (Agilent) with the primers described in Supplemental Table S6. For the gain-of-function analysis in the Sall1 MTL52 sequence, we focused on the smaller core region bound by six transcription factors (MTL52core). We identified motifs with the closest match to the desired TFBS, as these all had a low consensus match score; the identified motifs were mutated in the MTL52core sequence using Gibson Assembly to produce the consensus sequence for ESRRB, TFCP2L1, and SMAD3 (+E+T+S). In the +E+T+S sequence, the ESRRB motif was mutated to nonconsensus nucleotides preventing binding of any other transcription factor at this region to create +T+S. Another gain-of-function construct +T+S+E2F1 was created by adding a strong consensus motif for E2F1 to the +T+S construct using the QuikChange Lightning kit (Agilent). For the gain-of-function TFBS analysis, a maximum of six mutations were introduced, using the primers described in Supplemental Table S6, to convert a nonconsensus motif into a strong consensus motif for the desired TFBS.
Cell culture and CRISPR deletion
F1 mouse ES cells (M. musculus129 × M. castaneus, obtained from Barbara Panning) were cultured on 0.1% gelatin-coated plates in ESC media (DMEM containing 15% FBS, 0.1 mM MEM nonessential amino acids, 1 mM sodium pyruvate, 2 mM GlutaMAX, 0.1 mM 2-mercaptoethanol, 1000 U/mL LIF, 3 µM CHIR99021 [GSK3β inhibitor; Biovision], and 1 µM PD0325901 [MEK inhibitor; Sigma-Aldrich]), to maintain the naive state. Cas9 targeting guides flanking Sall1 proximal transcription factor–bound regions were selected (Supplemental Table S7). Only gRNAs predicted to have no off-target binding in the mouse genome were chosen. Guide RNA plasmids were assembled in the gRNA empty vector (Addgene ID#41824) using the protocol described by Mali et al. (2013) and confirmed by sequencing. Following the protocol described in Moorthy et al. (2016), 5 µg each of the indicated gRNAs targeting the 5′ and 3′ ends of the transcription factor–bound region were transfected in ESCs with pCas9_GFP (Addgene ID#44719) (Ding et al. 2013) using the Neon Transfection System (Thermo Fisher Scientific). FACS sorting 48 h posttransfection isolated GFP-positive cells, which were collected and seeded on 10-cm gelatinized culture plates. Genotyping of enhancer deletions was done by qPCR with allele-specific primers. All deletions were confirmed by sequence analysis using primers 5′ of and 3′ from the gRNA target sites; SNPs within the amplified product confirmed the genotype of the deleted allele. Gene expression was monitored by RT-qPCR using allele-specific primers (Sall1_129, Sall1_Cast) that distinguish 129 from castaneus alleles (Supplemental Table S6). The standard curve method was used to calculate expression levels, with mouse F1 genomic DNA used to generate the standard curves.
Synthetic sequences, enhancers, and luciferase assay
Synthetic enhancer sequences as described in Supplemental Table S4 were generated as GenPart DNA Fragments (GenScript). These sequences contained 2-bp CC spacers between each TFBS. All the 349 TFBSs belonging to ESC-expressed transcription factors were clustered to 137 diverse TFBS sets with one or more TFBSs in each set with significantly similar PWMs to each other (Pearson's correlation coefficient ≥0.65). Based on the LASSO coefficients of the representative TFBS from each of these 137 diverse TFBS sets, they were classified into three classes (Enr, n/a, and Dep). For the creation of 14dTFBSa–c, all 14 unique TFBSs were chosen from the Enr class, whereas for 14dTFBSd–g, an increasing number of TFBS from the Dep and n/a class were chosen. Using the conserved motifs for selected TFBSs identified from the MotEvo analysis, the distance and orientation between each pair of TFBSs was averaged over all CHEF sequences to identify the average co-occurrence distance and preferred orientation between each TFBS pair. If more than one motif per TFBS was present, the orientation present in ≥66% motifs was chosen as reference; otherwise, it was excluded. Significance of orientation bias was calculated by a binomial test, with the null hypothesis being no bias, 50% occurrence probability for either orientation.
To evaluate enhancer activity, synthetic sequences or native transcription factor–bound regions were cloned downstream from the firefly luciferase gene at the NotI site in the pGL4.23 vector containing a Pou5f1 minimal promoter as described in Moorthy et al. (2017). Mouse F1 ESCs were seeded on gelatin coated 96-well plates at a density of 10,000 cells per well. After 24 h, the cells were cotransfected using jetPRIME (VWR International) with pGL4.23 vectors and a Renilla luciferase encoding plasmid (pGL4.75) at a 50:1 molar ratio. The Renilla plasmid was transfected as a control for transfection efficiency in each well. ESC media was replaced with fresh ESC media after 24 h. Luciferase activity was assayed 48 h posttransfection using a dual luciferase reporter assay (Promega), and the firefly/Renilla ratio was measured on the Fluoroskan Ascent FL plate reader. All experiments were done in ≥3 biological replicates with each experiment having ≥3 technical transfection replicates.
Competing interest statement
The authors declare no competing interests.
Supplementary Material
Acknowledgments
We thank all the members of the Mitchell and Moses labs for helpful discussions. We also thank Virlana M. Shchuka who performed the experiment in Figure 4C and Nakisa Malek-Gilani who contributed to Figure 5B. This work was supported by the Natural Sciences and Engineering Research Council of Canada (2020-05972), the Canada Foundation for Innovation, and the Ontario Ministry of Research and Innovation (operating and infrastructure grants held by J.A.M.). Studentship funding to support this work was provided by Connaught International Scholarships and Ontario Graduate Scholarship (G.S.). Salary support for S.D.M. was provided by Canadian Institutes of Health Research Project Grant (FRN 153186).
Author contributions: G.S. and J.A.M. conceived the project, designed the experiments, and analyzed all experimental data. A.M.M. contributed to the design and analysis for computational approaches. G.S. performed the experiments in Figures 1A–E, 2A,B, 3A–C, 5A–D, Supplemental Figures S1A–D, S2A,B, S4A,B, and S5A–E. S.M. performed the experiments in Figures 3A and 4D. S.D.M. performed the experiments in Figure 4B and Supplemental Figure S3B. R.Z. performed the experiments in Figure 5B. T.M. performed the experiments in Figure 1B. R.T. performed the experiments in Figure 4D. A.G.D. performed the experiments in Figure 5D. G.S. and J.A.M. wrote the manuscript, which was approved by all co-authors.
Footnotes
[Supplemental material is available for this article.]
Article published online before print. Article, supplemental material, and publication date are at https://www.genome.org/cgi/doi/10.1101/gr.272468.120.
References
- Arnold P, Erb I, Pachkov M, Molina N, van Nimwegen E. 2012. MotEvo: integrated Bayesian probabilistic methods for inferring regulatory sites and motifs on multiple alignments of DNA sequences. Bioinformatics 28: 487–494. 10.1093/bioinformatics/btr695 [DOI] [PubMed] [Google Scholar]
- Ballester B, Medina-Rivera A, Schmidt D, Gonzàlez-Porta M, Carlucci M, Chen X, Chessman K, Faure AJ, Funnell APPW, Goncalves A, et al. 2014. Multi-species, multi-transcription factor binding highlights conserved control of tissue-specific biological pathways. eLife 3: e02626. 10.7554/eLife.02626 [DOI] [PMC free article] [PubMed] [Google Scholar]
- Barakat TS, Halbritter F, Zhang M, Rendeiro AF, Perenthaler E, Bock C, Chambers I. 2018. Functional dissection of the enhancer repertoire in human embryonic stem cells. Cell Stem Cell 23: 276–288.e8. 10.1016/j.stem.2018.06.014 [DOI] [PMC free article] [PubMed] [Google Scholar]
- Chaudhri VK, Dienger-Stambaugh K, Wu Z, Shrestha M, Singh H. 2020. Charting the cis-regulome of activated B cells by coupling structural and functional genomics. Nat Immunol 21: 210–220. 10.1038/s41590-019-0565-0 [DOI] [PubMed] [Google Scholar]
- Chen X, Xu H, Yuan P, Fang F, Huss M, Vega VB, Wong E, Orlov YL, Zhang W, Jiang J, et al. 2008. Integration of external signaling pathways with the core transcriptional network in embryonic stem cells. Cell 133: 1106–1117. 10.1016/j.cell.2008.04.043 [DOI] [PubMed] [Google Scholar]
- Chen CY, Morris Q, Mitchell JA. 2012. Enhancer identification in mouse embryonic stem cells using integrative modeling of chromatin and genomic features. BMC Genomics 13: 152. 10.1186/1471-2164-13-152 [DOI] [PMC free article] [PubMed] [Google Scholar]
- Chen L, Fish AE, Capra JA. 2018. Prediction of gene regulatory enhancers across species reveals evolutionarily conserved sequence properties. PLoS Comput Biol 14: e1006484. 10.1371/journal.pcbi.1006484 [DOI] [PMC free article] [PubMed] [Google Scholar]
- Corces MR, Granja JM, Shams S, Louie BH, Seoane JA, Zhou W, Silva TC, Groeneveld C, Wong CK, Cho SW, et al. 2018. The chromatin accessibility landscape of primary human cancers. Science 362: eaav1898. 10.1126/science.aav1898 [DOI] [PMC free article] [PubMed] [Google Scholar]
- Creyghton MP, Cheng AW, Welstead GG, Kooistra T, Carey BW, Steine EJ, Hanna J, Lodato MA, Frampton GM, Sharp PA, et al. 2010. Histone H3K27ac separates active from poised enhancers and predicts developmental state. Proc Natl Acad Sci 107: 21931–21936. 10.1073/pnas.1016071107 [DOI] [PMC free article] [PubMed] [Google Scholar]
- Ding Q, Regan SN, Xia Y, Oostrom LA, Cowan CA, Musunuru K. 2013. Enhanced efficiency of human pluripotent stem cell genome editing through replacing TALENs with CRISPRs. Cell Stem Cell 12: 393–394. 10.1016/j.stem.2013.03.006 [DOI] [PMC free article] [PubMed] [Google Scholar]
- El Khattabi L, Zhao H, Kalchschmidt J, Young N, Jung S, Van Blerkom P, Kieffer-Kwon P, Kieffer-Kwon K-R, Park S, Wang X, et al. 2019. A pliable mediator acts as a functional rather than an architectural bridge between promoters and enhancers. Cell 178: 1145–1158.e20. 10.1016/j.cell.2019.07.011 [DOI] [PMC free article] [PubMed] [Google Scholar]
- The ENCODE Project Consortium. 2012. An integrated encyclopedia of DNA elements in the human genome. Nature 489: 57–74. 10.1038/nature11247 [DOI] [PMC free article] [PubMed] [Google Scholar]
- Ernst J, Kellis M. 2012. ChromHMM: automating chromatin-state discovery and characterization. Nat Methods 9: 215–216. 10.1038/nmeth.1906 [DOI] [PMC free article] [PubMed] [Google Scholar]
- Farley EK, Olson KM, Zhang W, Rokhsar DS, Levine MS. 2016. Syntax compensates for poor binding sites to encode tissue specificity of developmental enhancers. Proc Natl Acad Sci 113: 6508–6513. 10.1073/pnas.1605085113 [DOI] [PMC free article] [PubMed] [Google Scholar]
- Farnham PJ. 2012. Thematic minireview series on results from the ENCODE Project: integrative global analyses of regulatory regions in the human genome. J Biol Chem 287: 30885–30887. 10.1074/jbc.R112.365940 [DOI] [PMC free article] [PubMed] [Google Scholar]
- Fiore C, Cohen BA. 2016. Interactions between pluripotency factors specify cis-regulation in embryonic stem cells. Genome Res 26: 778–786. 10.1101/gr.200733.115 [DOI] [PMC free article] [PubMed] [Google Scholar]
- Gafni O, Weinberger L, Mansour AA, Manor YS, Chomsky E, Ben-Yosef D, Kalma Y, Viukov S, Maza I, Zviran A, et al. 2013. Derivation of novel human ground state naive pluripotent stem cells. Nature 504: 282–286. 10.1038/nature12745 [DOI] [PubMed] [Google Scholar]
- Grossman SR, Zhang X, Wang L, Engreitz J, Melnikov A, Rogov P, Tewhey R, Isakova A, Deplancke B, Bernstein BE, et al. 2017. Systematic dissection of genomic features determining transcription factor binding and enhancer function. Proc Natl Acad Sci 114: E1291–E1300. 10.1073/pnas.1621150114 [DOI] [PMC free article] [PubMed] [Google Scholar]
- Guindon S, Dufayard J-F, Lefort V, Anisimova M, Hordijk W, Gascuel O. 2010. New algorithms and methods to estimate maximum-likelihood phylogenies: assessing the performance of PhyML 3.0. Syst Biol 59: 307–321. 10.1093/sysbio/syq010 [DOI] [PubMed] [Google Scholar]
- Harel S, Tu EY, Weisberg S, Esquilin M, Chambers SM, Liu B, Carson CT, Studer L, Reizis B, Tomishima MJ. 2012. ZFX controls the self-renewal of human embryonic stem cells. PLoS One 7: e42302. 10.1371/journal.pone.0042302 [DOI] [PMC free article] [PubMed] [Google Scholar]
- Katoh K, Standley DM. 2013. MAFFT multiple sequence alignment software version 7: improvements in performance and usability. Mol Biol Evol 30: 772–780. 10.1093/molbev/mst010 [DOI] [PMC free article] [PubMed] [Google Scholar]
- Kheradpour P, Ernst J, Melnikov A, Rogov P, Wang L, Zhang X, Alston J, Mikkelsen TS, Kellis M. 2013. Systematic dissection of regulatory motifs in 2000 predicted human enhancers using a massively parallel reporter assay. Genome Res 23: 800–811. 10.1101/gr.144899.112 [DOI] [PMC free article] [PubMed] [Google Scholar]
- King DM, Hong CKY, Shepherdson JL, Granas DM, Maricque BB, Cohen B. 2020. Synthetic and genomic regulatory elements reveal aspects of cis-regulatory grammar in mouse embryonic stem cells. eLife 9: e41279. 10.7554/elife.41279 [DOI] [PMC free article] [PubMed] [Google Scholar]
- Kuhn RM, Haussler D, Kent WJ. 2013. The UCSC genome browser and associated tools. Brief Bioinform 14: 144–161. 10.1093/bib/bbs038 [DOI] [PMC free article] [PubMed] [Google Scholar]
- Kvon EZ, Kamneva OK, Melo US, Barozzi I, Osterwalder M, Mannion BJ, Tissières V, Pickle CS, Plajzer-Frick I, Lee EA, et al. 2016. Progressive loss of function in a limb enhancer during snake evolution. Cell 167: 633–642.e11. 10.1016/j.cell.2016.09.028 [DOI] [PMC free article] [PubMed] [Google Scholar]
- Kwasnieski JC, Fiore C, Chaudhari HG, Cohen BA. 2014. High-throughput functional testing of ENCODE segmentation predictions. Genome Res 24: 1595–1602. 10.1101/gr.173518.114 [DOI] [PMC free article] [PubMed] [Google Scholar]
- Langmead B, Trapnell C, Pop M, Salzberg SL. 2009. Ultrafast and memory-efficient alignment of short DNA sequences to the human genome. Genome Biol 10: R25. 10.1186/gb-2009-10-3-r25 [DOI] [PMC free article] [PubMed] [Google Scholar]
- Li H. 2013. Aligning sequence reads, clone sequences and assembly contigs with BWA-MEM. [arXiv:1303.3997 q-bio.GN].
- Li H, Handsaker B, Wysoker A, Fennell T, Ruan J, Homer N, Marth G, Abecasis G, Durbin R, 1000 Genome Project Data Processing Subgroup. 2009. The Sequence Alignment/Map format and SAMtools. Bioinformatics 25: 2078–2079. 10.1093/bioinformatics/btp352 [DOI] [PMC free article] [PubMed] [Google Scholar]
- Liao Y, Smyth GK, Shi W. 2014. featureCounts: an efficient general purpose program for assigning sequence reads to genomic features. Bioinformatics 30: 923–930. 10.1093/bioinformatics/btt656 [DOI] [PubMed] [Google Scholar]
- Libbrecht MW, Rodriguez OL, Weng Z, Bilmes JA, Hoffman MM, Noble WS. 2019. A unified encyclopedia of human functional DNA elements through fully automated annotation of 164 human cell types. Genome Biol 20: 180. 10.1186/s13059-019-1784-2 [DOI] [PMC free article] [PubMed] [Google Scholar]
- Lim LS, Loh Y-H, Zhang W, Li Y, Chen X, Wang Y, Bakre M, Ng H-H, Stanton LW. 2007. Zic3 is required for maintenance of pluripotency in embryonic stem cells. Mol Biol Cell 18: 1348–1358. 10.1091/mbc.E06-07-0624 [DOI] [PMC free article] [PubMed] [Google Scholar]
- Lloret-Fernández C, Maicas M, Mora-Martínez C, Artacho A, Jimeno-Martín Á, Chirivella L, Weinberg P, Flames N. 2018. A transcription factor collective defines the HSN serotonergic neuron regulatory landscape. eLife 7: e32785. 10.7554/eLife.32785 [DOI] [PMC free article] [PubMed] [Google Scholar]
- Lusk RW, Eisen MB. 2010. Evolutionary mirages: selection on binding site composition creates the illusion of conserved grammars in Drosophila enhancers. PLoS Genet 6: e1000829. 10.1371/journal.pgen.1000829 [DOI] [PMC free article] [PubMed] [Google Scholar]
- Mali P, Yang L, Esvelt KM, Aach J, Guell M, DiCarlo JE, Norville JE, Church GM. 2013. RNA-guided human genome engineering via Cas9. Science 339: 823–826. 10.1126/science.1232033 [DOI] [PMC free article] [PubMed] [Google Scholar]
- Mathelier A, Fornes O, Arenillas DJ, Chen C, Denay G, Lee J, Shi W, Shyr C, Tan G, Worsley-Hunt R, et al. 2016. JASPAR 2016: a major expansion and update of the open-access database of transcription factor binding profiles. Nucleic Acids Res 44: D110–D115. 10.1093/nar/gkv1176 [DOI] [PMC free article] [PubMed] [Google Scholar]
- Maurano MT, Humbert R, Rynes E, Thurman RE, Haugen E, Wang H, Reynolds AP, Sandstrom R, Qu H, Brody J, et al. 2012. Systematic localization of common disease-associated variation in regulatory DNA. Science 337: 1190–1195. 10.1126/science.1222794 [DOI] [PMC free article] [PubMed] [Google Scholar]
- McLean CY, Reno PL, Pollen AA, Bassan AI, Capellini TD, Guenther C, Indjeian VB, Lim X, Menke DB, Schaar BT, et al. 2011. Human-specific loss of regulatory DNA and the evolution of human-specific traits. Nature 471: 216–219. 10.1038/nature09774 [DOI] [PMC free article] [PubMed] [Google Scholar]
- Micallef L, Rodgers P. 2014. eulerAPE: drawing area-proportional 3-Venn diagrams using ellipses. PLoS One 9: e101717. 10.1371/journal.pone.0101717 [DOI] [PMC free article] [PubMed] [Google Scholar]
- Moorthy SD, Mitchell JA. 2016. Generating CRISPR/Cas9 mediated monoallelic deletions to study enhancer function in mouse embryonic stem cells. J Vis Exp e53552. 10.3791/53552 [DOI] [PMC free article] [PubMed] [Google Scholar]
- Moorthy SD, Davidson S, Shchuka VM, Singh G, Malek-Gilani N, Langroudi L, Martchenko A, So V, Macpherson NN, Mitchell JA. 2017. Enhancers and super-enhancers have an equivalent regulatory role in embryonic stem cells through regulation of single or multiple genes. Genome Res 27: 246–258. 10.1101/gr.210930.116 [DOI] [PMC free article] [PubMed] [Google Scholar]
- Murtha M, Tokcaer-Keskin Z, Tang Z, Strino F, Chen X, Wang Y, Xi X, Basilico C, Brown S, Bonneau R, et al. 2014. FIREWACh: high-throughput functional detection of transcriptional regulatory modules in mammalian cells. Nat Methods 11: 559–565. 10.1038/nmeth.2885 [DOI] [PMC free article] [PubMed] [Google Scholar]
- Pastor WA, Liu W, Chen D, Ho J, Kim R, Hunt TJ, Lukianchikov A, Liu X, Polo JM, Jacobsen SE, et al. 2018. TFAP2C regulates transcription in human naive pluripotency by opening enhancers. Nat Cell Biol 20: 553–564. 10.1038/s41556-018-0089-0 [DOI] [PMC free article] [PubMed] [Google Scholar]
- Pedregosa F, Varoquaux G, Gramfort A, Michel V, Thirion B, Grisel O, Blondel M, Prettenhofer P, Weiss R, Dubourg V, et al. 2011. Scikit-learn: machine learning in Python. J Mach Learn Res 12: 2825–2830. [Google Scholar]
- Peng Y, Jahroudi N. 2002. The NFY transcription factor functions as a repressor and activator of the von Willebrand factor promoter. Blood 99: 2408–2417. 10.1182/blood.V99.7.2408 [DOI] [PubMed] [Google Scholar]
- Peng T, Zhai Y, Atlasi Y, Ter Huurne M, Marks H, Stunnenberg HG, Megchelenbrink W. 2020. STARR-seq identifies active, chromatin-masked, and dormant enhancers in pluripotent mouse embryonic stem cells. Genome Biol 21: 243. 10.1186/s13059-020-02156-3 [DOI] [PMC free article] [PubMed] [Google Scholar]
- Prescott SL, Srinivasan R, Marchetto MC, Grishina I, Narvaiza I, Selleri L, Gage FH, Swigut T, Wysocka J. 2015. Enhancer divergence and cis-regulatory evolution in the human and chimp neural crest. Cell 163: 68–83. 10.1016/J.CELL.2015.08.036 [DOI] [PMC free article] [PubMed] [Google Scholar]
- Quinlan AR, Hall IM. 2010. BEDTools: a flexible suite of utilities for comparing genomic features. Bioinformatics 26: 841–842. 10.1093/bioinformatics/btq033 [DOI] [PMC free article] [PubMed] [Google Scholar]
- Rada-Iglesias A, Bajpai R, Swigut T, Brugmann SA, Flynn RA, Wysocka J. 2011. A unique chromatin signature uncovers early developmental enhancers in humans. Nature 470: 279–283. 10.1038/nature09692 [DOI] [PMC free article] [PubMed] [Google Scholar]
- Ramaker RC, Hardigan AA, Goh ST, Partridge EC, Wold B, Cooper SJ, Myers RM. 2020. Dissecting the regulatory activity and sequence content of loci with exceptional numbers of transcription factor associations. Genome Res 30: 939–950. 10.1101/gr.260463.119 [DOI] [PMC free article] [PubMed] [Google Scholar]
- R Core Team. 2018. R: a language and environment for statistical computing. R Foundation for Statistical Computing, Vienna. https://www.R-project.org/. [Google Scholar]
- Sánchez-Castillo M, Ruau D, Wilkinson AC, Ng FSL, Hannah R, Diamanti E, Lombard P, Wilson NK, Gottgens B. 2014. CODEX: a next-generation sequencing experiment database for the haematopoietic and embryonic stem cell communities. Nucleic Acids Res 43: D1117–D1123. 10.1093/nar/gku895 [DOI] [PMC free article] [PubMed] [Google Scholar]
- Schnetz MP, Handoko L, Akhtar-Zaidi B, Bartels CF, Pereira CF, Fisher AG, Adams DJ, Flicek P, Crawford GE, LaFramboise T, et al. 2010. CHD7 targets active gene enhancer elements to modulate ES cell-specific gene expression. PLoS Genet 6: e1001023. 10.1371/journal.pgen.1001023 [DOI] [PMC free article] [PubMed] [Google Scholar]
- Schreiber J. 2018. pomegranate: fast and flexible probabilistic modeling in Python. J Mach Learn Res 18: 1–6. [Google Scholar]
- Seki Y. 2018. PRDM14 is a unique epigenetic regulator stabilizing transcriptional networks for pluripotency. Front Cell Dev Biol 6: 12. 10.3389/fcell.2018.00012 [DOI] [PMC free article] [PubMed] [Google Scholar]
- Shrinivas K, Sabari BR, Coffey EL, Klein IA, Boija A, Zamudio A V, Schuijers J, Hannett NM, Sharp PA, Young RA, et al. 2019. Enhancer features that drive formation of transcriptional condensates. Mol Cell 75: 549–561.e7. 10.1016/J.MOLCEL.2019.07.009 [DOI] [PMC free article] [PubMed] [Google Scholar]
- Singh H, Khan AA, Dinner AR. 2014. Gene regulatory networks in the immune system. Trends Immunol 35: 211–218. 10.1016/j.it.2014.03.006 [DOI] [PubMed] [Google Scholar]
- Smith RP, Taher L, Patwardhan RP, Kim MJ, Inoue F, Shendure J, Ovcharenko I, Ahituv N. 2013. Massively parallel decoding of mammalian regulatory sequences supports a flexible organizational model. Nat Genet 45: 1021–1028. 10.1038/ng.2713 [DOI] [PMC free article] [PubMed] [Google Scholar]
- Tai C-I, Ying Q-L. 2013. Gbx2, a LIF/Stat3 target, promotes reprogramming to and retention of the pluripotent ground state. J Cell Sci 126: 1093–1098. 10.1242/jcs.118273 [DOI] [PubMed] [Google Scholar]
- Tan G, Lenhard B. 2016. TFBSTools: an R/bioconductor package for transcription factor binding site analysis. Bioinformatics 32: 1555–1556. 10.1093/bioinformatics/btw024 [DOI] [PMC free article] [PubMed] [Google Scholar]
- Tang X, Liu H, Srivastava A, Pécot T, Chen Z, Wang Q, Huang K, Sáenz-Robles MT, Cantalupo P, Pipas J, et al. 2016. Transcriptome regulation and chromatin occupancy by E2F3 and MYC in mice. Sci Data 3: 160008. 10.1038/sdata.2016.8 [DOI] [PMC free article] [PubMed] [Google Scholar]
- Tang L, Wang M, Liu D, Gong M, Ying QL, Ye S. 2017. Sp5 induces the expression of Nanog to maintain mouse embryonic stem cell self-renewal. PLoS One 12: e0185714. 10.1371/journal.pone.0185714 [DOI] [PMC free article] [PubMed] [Google Scholar]
- Thanos D, Maniatis T. 1995. Virus induction of human IFNβ gene expression requires the assembly of an enhanceosome. Cell 83: 1091–1100. 10.1016/0092-8674(95)90136-1 [DOI] [PubMed] [Google Scholar]
- Tibshirani R. 1996. Regression shrinkage and selection via the lasso. J R Stat Soc Ser B 58: 267–288. 10.2307/2346178 [DOI] [Google Scholar]
- Tsankov AM, Gu H, Akopian V, Ziller MJ, Donaghey J, Amit I, Gnirke A, Meissner A. 2015. Transcription factor binding dynamics during human ES cell differentiation. Nature 518: 344–349. 10.1038/nature14233 [DOI] [PMC free article] [PubMed] [Google Scholar]
- Vanhille L, Griffon A, Maqbool MA, Zacarias-Cabeza J, Dao LTM, Fernandez N, Ballester B, Andrau JC, Spicuglia S. 2015. High-throughput and quantitative assessment of enhancer activity in mammals by CapStarr-seq. Nat Commun 6: 6905. 10.1038/ncomms7905 [DOI] [PubMed] [Google Scholar]
- Velychko S, Adachi K, Kim KP, Hou Y, MacCarthy CM, Wu G, Schöler HR. 2019. Excluding Oct4 from Yamanaka cocktail unleashes the developmental potential of iPSCs. Cell Stem Cell 25: 737–753.e4. 10.1016/j.stem.2019.10.002 [DOI] [PMC free article] [PubMed] [Google Scholar]
- Villar D, Berthelot C, Aldridge S, Rayner TF, Lukk M, Pignatelli M, Park TJ, Deaville R, Erichsen JT, Jasinska AJ, et al. 2015. Enhancer evolution across 20 mammalian species. Cell 160: 554–566. 10.1016/j.cell.2015.01.006 [DOI] [PMC free article] [PubMed] [Google Scholar]
- Visel A, Prabhakar S, Akiyama JA, Shoukry M, Lewis KD, Holt A, Plajzer-Frick I, Afzal V, Rubin EM, Pennacchio LA. 2008. Ultraconservation identifies a small subset of extremely constrained developmental enhancers. Nat Genet 40: 158–160. 10.1038/ng.2007.55 [DOI] [PMC free article] [PubMed] [Google Scholar]
- Visel A, Blow MJ, Li Z, Zhang T, Akiyama JA, Holt A, Plajzer-Frick I, Shoukry M, Wright C, Chen F, et al. 2009a. ChIP-seq accurately predicts tissue-specific activity of enhancers. Nature 457: 854–858. 10.1038/nature07730 [DOI] [PMC free article] [PubMed] [Google Scholar]
- Visel A, Rubin EM, Pennacchio LA. 2009b. Genomic views of distant-acting enhancers. Nature 461: 199–205. 10.1038/nature08451 [DOI] [PMC free article] [PubMed] [Google Scholar]
- Visel A, Taher L, Girgis H, May D, Golonzhka O, Hoch RV, McKinsey GL, Pattabiraman K, Silberberg SN, Blow MJ, et al. 2013. A high-resolution enhancer atlas of the developing telencephalon. Cell 152: 895–908. 10.1016/j.cell.2012.12.041 [DOI] [PMC free article] [PubMed] [Google Scholar]
- Wagstaff K, Cardie C, Rogers S, Schroedl S. 2001. Constrained K-means clustering with background knowledge. In Proceedings of the Eighteenth International Conference on Machine Learning, pp. 577–584. Williamstown, MA. [Google Scholar]
- Wamstad JA, Alexander JM, Truty RM, Shrikumar A, Li F, Eilertson KE, Ding H, Wylie JN, Pico AR, Capra JA, et al. 2012. Dynamic and coordinated epigenetic regulation of developmental transitions in the cardiac lineage. Cell 151: 206–220. 10.1016/j.cell.2012.07.035 [DOI] [PMC free article] [PubMed] [Google Scholar]
- Warde-Farley D, Donaldson SL, Comes O, Zuberi K, Badrawi R, Chao P, Franz M, Grouios C, Kazi F, Lopes CT, et al. 2010. The GeneMANIA prediction server: biological network integration for gene prioritization and predicting gene function. Nucleic Acids Res 38: W214–W220. 10.1093/nar/gkq537 [DOI] [PMC free article] [PubMed] [Google Scholar]
- Zhang Y, Liu T, Meyer CA, Eeckhoute J, Johnson DS, Bernstein BE, Nusbaum C, Myers RM, Brown M, Li W, et al. 2008. Model-based Analysis of ChIP-Seq (MACS). Genome Biol 9: R137. 10.1186/gb-2008-9-9-r137 [DOI] [PMC free article] [PubMed] [Google Scholar]
- Zhang X, Yalcin S, Lee D-F, Yeh T-YJ, Lee S-M, Su J, Mungamuri SK, Rimmelé P, Kennedy M, Sellers R, et al. 2011a. FOXO1 is an essential regulator of pluripotency in human embryonic stem cells. Nat Cell Biol 13: 1092–1099. 10.1038/ncb2293 [DOI] [PMC free article] [PubMed] [Google Scholar]
- Zhang Z, Jones A, Sun C-W, Li C, Chang C-W, Joo H-Y, Dai Q, Mysliwiec MR, Wu L-C, Guo Y, et al. 2011b. PRC2 complexes with JARID2, MTF2, and esPRC2p48 in ES cells to modulate ES cell pluripotency and somatic cell reprograming. Stem Cells 29: 229–240. 10.1002/stem.578 [DOI] [PMC free article] [PubMed] [Google Scholar]
- Zhou HY, Katsman Y, Dhaliwal NK, Davidson S, Macpherson NN, Sakthidevi M, Collura F, Mitchell JA. 2014. A Sox2 distal enhancer cluster regulates embryonic stem cell differentiation potential. Genes Dev 28: 2699–2711. 10.1101/gad.248526.114 [DOI] [PMC free article] [PubMed] [Google Scholar]
- Zinzen RP, Girardot C, Gagneur J, Braun M, Furlong EEM. 2009. Combinatorial binding predicts spatio-temporal cis-regulatory activity. Nature 462: 65–70. 10.1038/nature08531 [DOI] [PubMed] [Google Scholar]
Associated Data
This section collects any data citations, data availability statements, or supplementary materials included in this article.