Abstract
Purpose:
Dose calculation during optimization of volumetric modulated arc therapy (VMAT) is necessarily simplified to keep computation time manageably low; however the approximations used in the scatter dose calculation lead to discrepancy with more accurate dose calculation following optimization. The purpose of this study is to develop a dose correction strategy in optimization that can minimize the disagreement.
Methods:
VMAT delivery is modeled using a number of static equispaced beams. Dose correction factors are associated with each beam and point inside the region of interest. is calculated as the ratio of dose obtained from the full scatter dose calculation over that from the partial scatter dose calculation in optimization. VMAT optimization algorithm is a multiple resolution approach. The dose correction factors are calculated at the beginning of each resolution and applied as multiplicative corrections to the partial scatter dose during optimization. Clinical cases for brain, prostate, paraspinal, and esophagus are utilized to evaluate the method. Treatment plans created with and without the correction scheme are normalized such that the complication rates of organs at risk (OARs) are comparable. The resulting planning target volume (PTV) mean doses are used to compare plan quality.
Results:
The difference between the dose calculated at the end of optimization and at the end of the final forward dose calculation is reduced from 7% and 5% for the PTV and OAR mean doses without correction to approximately 1% with correction. Applying dose correction during optimization saves planners 2–4 h in average in treatment planning, and has a positive impact on plan quality, evidenced by a noticeably higher PTV mean dose: 2.1%, 2.4%, 0.5%, and 9.3% of the corresponding prescription dose in the brain, esophagus, prostate, and paraspinal cases, respectively.
Conclusions:
When dose correction is applied during optimization, dose discrepancies between optimization and full dose calculation are reduced. Integrating dose correction in VMAT optimization allows planners to adjust the optimization constraints more easily and confidently during optimization and has the potential to improve plan quality.
Keywords: volumetric arc modulated therapy, treatment planning, dose calculation
I. INTRODUCTION
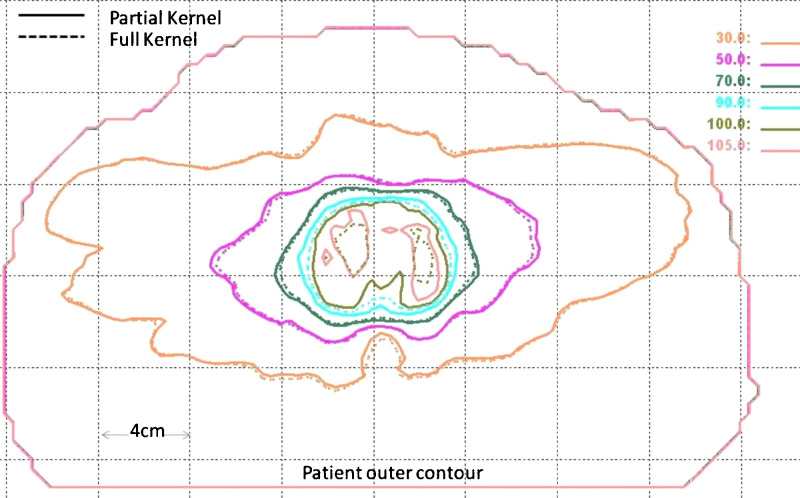
Compared to intensity modulated radiation therapy (IMRT), intensity modulated arc therapy1–6 or volumetric modulated arc therapy (VMAT)7–11 offers similar tumor coverage and organs at risk sparing, but greatly reduced treatment delivery time. One major obstacle to widespread clinical use of VMAT is its much longer treatment planning time compared to IMRT. Any algorithmic improvements that shorten treatment planning time and simplify the planning process are desirable in the context of VMAT optimization. Generally, there are hundreds of beams involved in VMAT optimization and the majority of the computation time is spent on dose calculation. In our VMAT implementation,11 the dose deposition coefficients are precalculated and stored in memory for the dose engine inside the optimization algorithm. The major difference between the dose calculation method used in this precalculation phase and the one used for final dose calculation prior to plan evaluation is that the pencil beam dose kernel is truncated to a radius of 5 mm. This modification saves computer memory and speeds up optimization significantly. As a consequence, however, there exist noticeable discrepancies between dose distributions and dose volume histograms (DVHs) presented to the user at the end of optimization and those available for the final plan evaluation as shown in Fig. 1. Because there is no longer an accurate relationship between the two dose calculations, planners must complete the final dose calculation, normalize the dose to meet clinical constraints, evaluate the dose to target and organs at risk, and then decide whether or not to adjust the optimization constraints and repeat the process. A much simpler and more time efficient approach would be to present the planners an accurate representation of dose at the end of optimization, allowing them to do a quick evaluation of the most relevant plan parameters and then modify the constraints and reoptimize if necessary. Furthermore, inaccurate dose calculation during optimization in all likelihood compromises the quality of the actual dose distribution itself.
FIG. 1.
Comparison of isodose distributions calculated using partial kernel in optimization (solid line) and full kernel in plan evaluation (dashed line).
The Memorial Sloan-Kettering Cancer Center (MSKCC) IMRT planning system handles this dose discrepancy problem using a technique referred to as “multiple loops.”12 In this method, the partial scatter kernel is applied during the calculation of the dose deposition kernels and the first optimization loop. After the first round of optimization is completed and the intensity distribution is produced, the dose distribution is recalculated with full scatter. The relative difference between the two dose distributions (one with full scatter and the other with partial scatter) is then applied as a correction to the next round of optimization. Three to four rounds using this corrective process lead to an accurate accounting of scatter dose. Although the approach works well for IMRT, it is not suitable for VMAT because of differences in both the dose calculation and optimization algorithms. For example, frequent adjustment of the MLC apertures during VMAT optimization complicates dose calculation compared to IMRT where dose is determined only by the contribution of each beamlet. More frequent dose corrections are necessary in VMAT to minimize the discrepancy and guide the optimization toward the optimal plan. In this paper, we describe a dose correcting strategy that can be applied in the framework of a multiresolution VMAT optimization approach and tests validating its usefulness and accuracy.
II. METHOD AND MATERIALS
II.A. Dose correction factor
During VMAT optimization, arc treatment is simulated using a large number of static beams. The dose for the point inside a region of interest is calculated during optimization as the weighted sum of the individual contributions from each beam
| (1) |
where NB is the number of beams, and and are the number of beamlets and weight for beam , respectively. Coefficient is the dose deposited to the point from a unit-weight beamlet in the beam . is a transmission factor for point at the beamlet in the beam owing to the presence of MLC and jaws.
All dose deposition coefficients are calculated prior to optimization using a pencil beam kernel truncated from its full radius of 2 cm to a radius of 5 mm. This simplification improves optimization speed and saved computer memory by a factor of at least 10. As a result of this truncation, a discrepancy is introduced between the optimization dose calculations and the final calculations performed with the full size kernel once optimization is complete. To address this problem, we perform a dose calculation with the full kernel at selected stages during optimization and from these calculations, determine correction factors which are then applied to the calculations with the truncated kernel. The dose correction factor associated with each beam and each point inside the region of interest is calculated as
| (2) |
where is the full dose calculation result. The dose correction factor is incorporated into the optimization dose calculation by
| (3) |
II.B. Dose correction: When and how often?
VMAT arc delivery is typically modeled by hundreds of static beams or control points. Our optimization algorithm, like others, handles this large number of beams by relying on a multiresolution approach.11 It starts with a small number of beams 16° apart at the first resolution. The number of beams is doubled at subsequent resolutions until all beams are optimized. Typically, four resolutions are used to model a full 360° VMAT delivery using control points at 2° intervals. Since execution of a full dose calculation for all 180 control points take 3–5 min depending on the number of points involved in optimization, the decision as to when and how often to apply the dose correction methodology described above must consider the tradeoff between dose accuracy and computation time. In our implementation, dose correction is applied at the start of each optimization resolution to the beams involved in that resolution. The overall overhead of the dose correction procedure is about 6–10 min. In order to use Eq. (3) for dose calculation in the optimization, should be first initialized to 1 at the start of each optimization resolution, calculated according to Eq. (2) after performing a full dose calculation, and maintained as a constant during optimization. During optimization at each resolution conjugate, gradient search for optimal beam weights and random sampling search for optimal MLC position alternatively repeat until the cost function value changes less than 1%.
II.C. Testing and evaluation
To evaluate the dose correction method, VMAT treatment plans were created with and without dose correction during optimization. Treatment plans for four cases consisting of brain, esophagus, prostate, and paraspinal tumors were created according to the standard clinical criteria at our institution. To facilitate comparisons, the plans for each site were normalized so that the complication rate for organs at risk is comparable. Planning target volume (PTV) mean dose is used to compare plan quality and evaluate the impact of dose correction on optimization.
III. RESULTS AND DISCUSSION
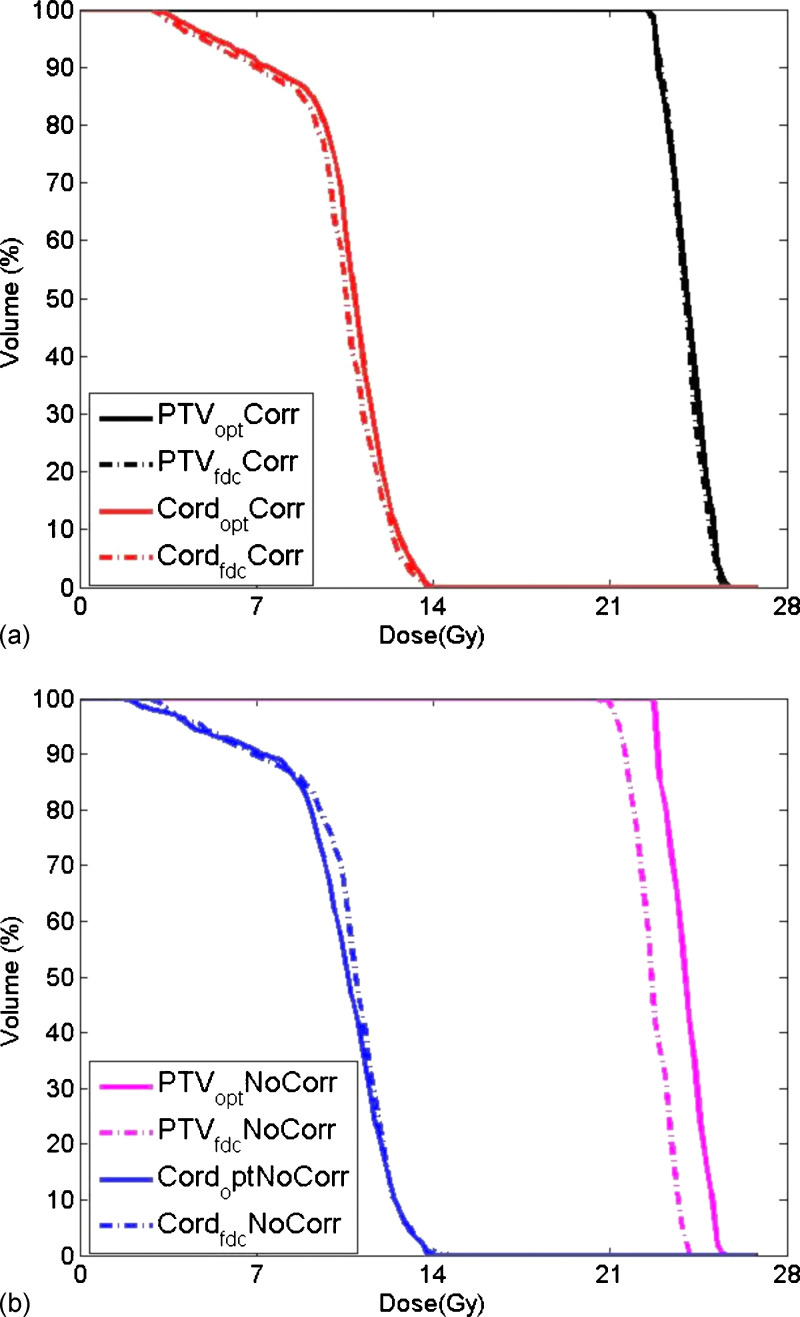
Applying dose correction during VMAT optimization reduces the dose discrepancy between the optimization and full dose calculations as evidenced by the DVH comparison illustrated in Fig. 2. For this paraspinal case, the goal is to deliver 24 Gy to the PTV and limit the maximum cord dose to 14 Gy following the MSKCC paraspinal protocol.13 When dose correction is built into the optimization, the PTV DVHs (black) are almost identical between optimization and full dose calculation [Fig. 2(a)].In contrast, a noticeable difference in PTV DVHs is evident in Fig. 2(b) where no dose correction has been applied. While the average dose correction factor for PTV is less than 1 due to the unaccounted scatter dose, the averaged dose correction factor for cord is closer to 1 because cord is very often blocked by the MLC in order to reduce the dose. The agreement in cord for this case is better with dose correction built in discrepancy is reduced to 0.3% from −2.5% in the cord maximum dose which is the most important index in paraspinal planning.
FIG. 2.
Dose volume histograms for a paraspinal tumor calculated at the end of optimization and after full dose calculation: (a) With dose correction applied during optimization; (b) without dose correction.
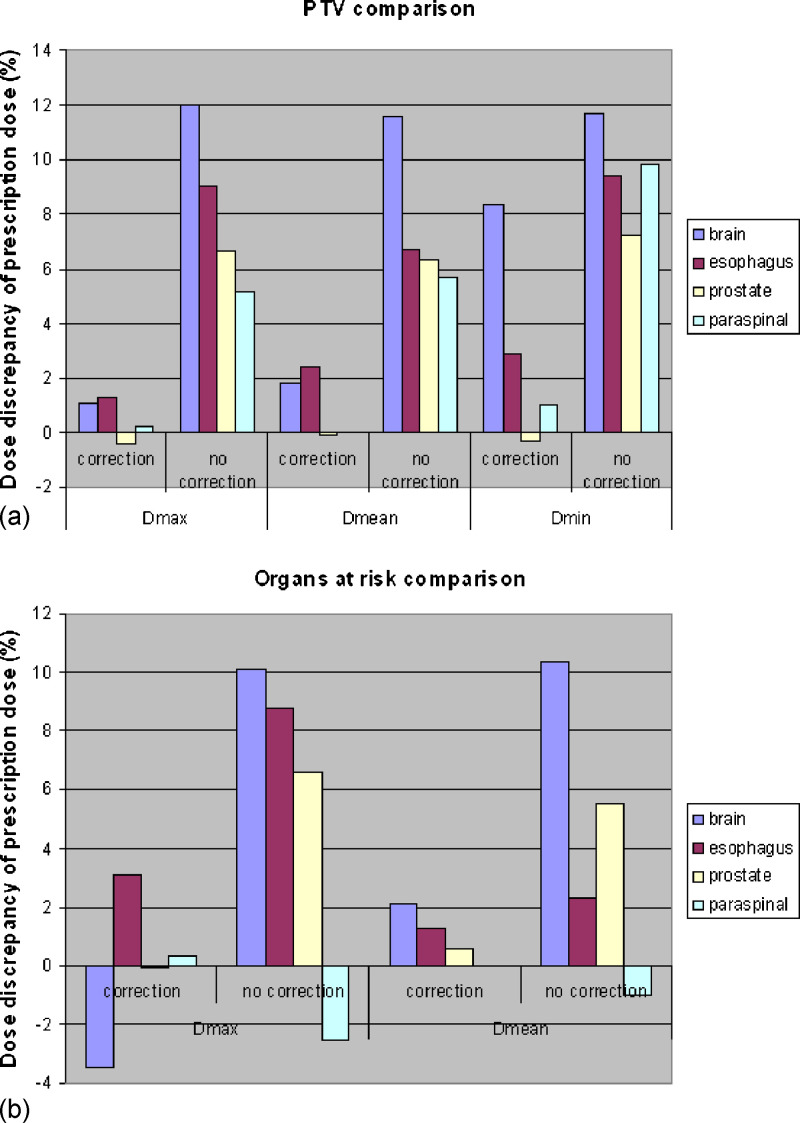
The dose discrepancies observed with and without the dose correction method are summarized for each of the four test cases in Fig. 3. On average, the discrepancy in PTV maximum, mean and minimum doses reduced from 8.2%, 7.6%, and 12.3% of the prescription dose to 0.6%, 1.2% and 3.0%, respectively. Average organs at risk maximum and mean dose discrepancies decreased from 5.8% and 4.3% to 0.1% and 1.3%.
FIG. 3.
Plans generated with dose-corrected optimization for four cases show reduced dose discrepancy: (a) Comparisons between maximum dose (Dmax), mean dose (Dmean), and minimum dose (Dmin) of PTV. (b) Comparisons between Dmax and Dmean of organs at risk.
The average number of iterations (change optimization constraints, reoptimize) spent to obtain a clinically acceptable treatment plan is reduced from 15–20 to around 10 if dose correction is applied in our observation. It saves planners 2–4 h. Applying dose correction during optimization also has the potential to improve the quality of the resultant plan. Before comparing the PTV coverage, the treatment plans in this study were normalized to the same level of optic nerve maximum dose, lung mean dose, rectal wall maximum dose, and spinal cord maximum dose, for the brain, esophagus, prostate, and paraspinal case, respectively. The treatment plans optimized with dose correction built in showed increases in the PTV mean dose of 2.1%, 2.4%, 0.5%, and 9.3% of the corresponding prescription dose in the brain, esophagus, prostate, and paraspinal cases, respectively.
IV. CONCLUSION
The proposed correction to scatter dose calculation yields dose distributions during VMAT optimization that more accurately represent those calculated with full scatter for plan evaluation. Integrating such a correction into VMAT optimization gives planners the ability to realistically evaluate dosimetric parameters at the end of optimization and adjust the optimization constraints and reoptimize immediately, if need be, thereby increasing planning efficiency. In addition, it appears that a dose correction such as the one implemented here has the potential to improve plan quality.
ACKNOWLEDGMENTS
The authors would like to thank Yves Archimbault from Varian Medical Systems, Palo Alto, CA for his help and discussion regarding Varian’s implementation of RapidArc.
Conflict of interest: Memorial Sloan-Kettering Cancer Center has a research agreement with Varian Medical Systems.
REFERENCES
- 1.Yu C. X., “Intensity-modulated arc therapy with dynamic multileaf collimation: An alternative to tomotherapy,” Phys. Med. Biol. 40, 1435–1449 (1995). 10.1088/0031-9155/40/9/004 [DOI] [PubMed] [Google Scholar]
- 2.Yu C. X. et al. , “Clinical implementation of intensity-modulated arc therapy,” Int. J. Radiat. Oncol., Biol., Phys. 53, 453–463 (2002). 10.1016/S0360-3016(02)02777-3 [DOI] [PubMed] [Google Scholar]
- 3.Wong E., Chen J. Z., and Greenland J., “Intensity-modulated arc therapy simplified,” Int. J. Radiat. Oncol., Biol., Phys. 53, 222–235 (2002). 10.1016/S0360-3016(02)02735-9 [DOI] [PubMed] [Google Scholar]
- 4.Earl M. A. et al. , “Inverse planning for intensity-modulated arc therapy using direct aperture optimization,” Phys. Med. Biol. 48, 1075–1089 (2003). 10.1088/0031-9155/48/8/309 [DOI] [PubMed] [Google Scholar]
- 5.Shepard D. M. et al. , “An arc-sequencing algorithm for intensity modulated arc therapy,” Med. Phys. 34, 464–470 (2007). 10.1118/1.2409239 [DOI] [PubMed] [Google Scholar]
- 6.Cao D. et al. , “Comparison of plan quality provided by intensity-modulated arc therapy and helical tomotherapy,” Int. J. Radiat. Oncol., Biol., Phys. 69, 240–250 (2007). 10.1016/j.ijrobp.2007.04.073 [DOI] [PubMed] [Google Scholar]
- 7.Crooks S. M. et al. , “Aperture modulated arc therapy,” Phys. Med. Biol. 48, 1333–1344 (2003). 10.1088/0031-9155/48/10/307 [DOI] [PubMed] [Google Scholar]
- 8.Cameron C., “Sweeping-window arc therapy: An implementation of rotational IMRT with automatic beam-weight calculation,” Phys. Med. Biol. 50, 4317–4336 (2005). 10.1088/0031-9155/50/18/006 [DOI] [PubMed] [Google Scholar]
- 9.Ulrich S., Nill S., and Oelfke U., “Development of an optimization concept for arc-modulated cone beam therapy,” Phys. Med. Biol. 52, 4099–4119 (2007). 10.1088/0031-9155/52/14/006 [DOI] [PubMed] [Google Scholar]
- 10.Otto K., “Volumetric modulated arc therapy: IMRT in a single gantry arc,” Med. Phys. 35, 310–317 (2008). 10.1118/1.2818738 [DOI] [PubMed] [Google Scholar]
- 11.Zhang P., Happersett L., and Mageras G., “Volumetric modulated arc therapy: Implementation and evaluation for prostate cancer cases,” Int. J. Radiat. Oncol., Biol., Phys. 76, 1456–1462 (2010). 10.1016/j.ijrobp.2009.03.033 [DOI] [PubMed] [Google Scholar]
- 12.Hong L., Alektiar K., Chui C., LoSasso T., Hunt M., Spirou S., Yang J., Amols H., Ling C., Fuks Z., and Leibel S., “IMRT of large fields: Whole-abdomen irradiation,” Int. J. Radiat. Oncol., Biol., Phys. 54(1), 278–289 (2002). 10.1016/S0360-3016(02)03298-4 [DOI] [PubMed] [Google Scholar]
- 13.Zhang P., Happersett L., Yang Y., Yamada J., Mageras G., and Hunt M., “Optimization of collimator trajectory in volumetric modulated arc therapy: Development and evaluation for paraspinal SBRT,” Int. J. Radiat. Oncol., Biol., Phys. (in press). [DOI] [PubMed]


