

Abstract
Background:
Evidence for indoor airborne transmission of SARS-CoV-2 is accumulating.
Objectives:
We assessed of the risk of illness due to airborne SARS-CoV-2 particles from breathing, speaking, singing, coughing, and sneezing in indoor environments.
Methods:
A risk assessment model, AirCoV2, for exposure to SARS-CoV-2 particles in aerosol droplets was developed. Previously published data on droplets expelled by breathing, speaking, singing, coughing, and sneezing by an infected person were used as inputs. Scenarios encompassed virus concentration, exposure time, and ventilation. Newly collected data of virus RNA copies in mucus from patients are presented.
Results:
The expelled volume of aerosols was highest for a sneeze, followed by a cough, singing, speaking, and breathing. After 20 min of exposure, at RNA copies/mL in mucus, all mean illness risks were largely estimated to be below 0.001, except for the “high” sneeze scenario. At virus concentrations above RNA copies/mL, and after 2 h of exposure, in the high and “low” sneeze scenarios, the high cough scenario and the singing scenario, risks exceeded 0.01 and may become very high, whereas the low coughing scenario, the high and low speaking scenarios and the breathing scenario remained below 0.1. After 2 h of exposure, singing became the second highest risk scenario. One air exchange per hour reduced risk of illness by about a factor of 2. Six air exchanges per hour reduced risks of illness by a factor of 8–13 for the sneeze and cough scenarios and by a factor of 4–9 for the other scenarios.
Discussion:
The large variation in the volume of expelled aerosols is discussed. The model calculations indicated that SARS-CoV-2 transmission via aerosols outside of the social distancing norm can occur. Virus concentrations in aerosols and/or the amount of expelled aerosol droplets need to be high for substantial transmission via this route. AirCoV2 is made available as interactive computational tool. https://doi.org/10.1289/EHP7886
Introduction
The fate of droplets in the air is mostly determined by their size; larger droplets deposit quickly, whereas smaller droplets can stay airborne for longer periods, in so-called aerosols (a suspension of droplets in air). Aerosols can arise from “violent expiratory events” such as coughing and sneezing (Bourouiba et al. 2014), but also from breathing and speech (Asadi et al. 2019; Leung et al. 2020). A dry cough is a predominant symptom of coronavirus (CoV) disease 2019 (COVID-19) (Wang et al. 2020). The WHO defines a cut-off of to distinguish airborne () from droplet () transmission (WHO 2014, 2020). The existence of a cut-off is contested; other organizations use different terminology and cut-off values (Kohanski et al. 2020; Tellier et al. 2019). Infectious particles can penetrate more deeply into the lungs (Milton 2020), whereas larger particles most likely affect the upper airways (Gralton et al. 2011; Tellier et al. 2019). Although it is true that the large majority of the volume of fluids expelled during, for example, coughing and sneezing, is in droplets that deposit quickly and ballistically, this does not imply that airborne transmission is highly unlikely (Nicas et al. 2005). Furthermore, research suggests that the cut-off size of droplets (aerodynamic diameter) that deposit quickly is larger than and not static but dependent on a number of factors, such as relative humidity (RH) (Liu et al. 2017). In the absence of turbulence, droplets with an initial diameter larger than will be deposited on the floor from an initial height of at a distance away from the mouth of (Liu et al. 2017). The droplet with an initial diameter of can reach about , with a size of 0.32 times its initial diameter at an RH of 0%, whereas it can travel a distance of at an RH of 90% due to its larger droplet size of 0.43 its initial diameter (Liu et al. 2017). In the case of turbulence, even initially larger particles could likely travel even farther. Therefore, airborne and droplet transmissions occur on a continuum, and airborne transmission can potentially occur in the size fraction of all particles less than (Gralton et al. 2011; Kohanski et al. 2020; Tellier et al. 2019).
Droplets and aerosols can harbor pathogens such as bacteria, e.g., Coxiella burnettii, and viruses such as influenza viruses (Milton et al. 2013; Stein et al. 2005). Evidence exists for airborne (bioaerosol) transmission of multiple viral respiratory diseases, including SARS, MERS, and influenza (Adhikari et al. 2019; Kulkarni et al. 2016; Weber and Stilianakis 2008; Yu et al. 2004; Zhang et al. 2013). Airborne transmission has also been suggested as probable for SARS-CoV-2 (Anderson et al. 2020; Asadi et al. 2020; Chia et al. 2020; Correia et al. 2020; Li et al. 2020; Morawska and Cao 2020; Richard et al. 2020; Setti et al. 2020; Shen et al. 2020; Stadnytskyi et al. 2020; Wang and Du 2020; Yao et al. 2020), although other studies contest this and suggest airborne transmission does not take place (Xu et al. 2020).
SARS-CoV-2 has been observed to be remarkably stable in aerosols generated under laboratory conditions (Fears et al. 2020), with little decline in infectivity after 16 h of aerosol suspension. Similarly, van Doremalen et al. (2020) also found that SARS-CoV-2 remained viable for hours in experimentally generated aerosols (reduction in infectious virus particles from 3,100 to 500 per liter of air in 3 h).
There is much discussion about the potential for airborne transmission of SARS-CoV-2. The World Health Organization has changed its standpoint during the course of 2020 from maintaining that COVID-19 is not airborne to acknowledging that airborne spread occurs but mainly under specific circumstances (particularly during spending prolonged periods of time in indoor, crowded, inadequately ventilated spaces) (WHO 2020).
The aim of this study was to assess the risk of illness due to airborne SARS-CoV-2 particles from breathing, speaking, singing, coughing and sneezing in an indoor environment. Figure 1 shows a schematic overview of the processes modeled in this study. The risk assessment entailed estimating the numbers of SARS-CoV-2 particles in aerosol droplets expelled during breathing, speaking, singing, coughing, and sneezing by an infected person in an unventilated indoor environment and subsequent inhalation by one or more persons in that environment. Estimates were included on the infectiousness of the virus (dose–response). Literature and laboratory data on SARS-CoV-2 virus concentrations from nasopharyngeal and oropharyngeal swab samples (hereafter, nasal and throat), numbers of expelled aerosol droplets and their size distributions were used as input for the model calculations. This study focused on modeling airborne transmission and thus did not model larger droplet transmission, e.g., the probability of coming into contact with large droplets that fall directly on mucosa or surfaces. Only the long-range airborne route, i.e., transmission of SARS-CoV-2 via aerosols outside the 1.5-m social distance, was considered.
Figure 1.

Overview of the processes modeled in this study.
Methods
Scenarios
Table 1 shows the scenarios that were applied. In all scenarios, an infectious, (a)symptomatic person entered a room of dimensions , which could be a large living room, a small meeting room, or a bus. The infectious person expelled virus particles through continuous breathing, speaking, or singing or through one cough or one sneeze. The person spent either 20 min or 2 h in the room. For the latter duration, a ventilation scenario was included: no ventilation, or replacing the room air volume once per hour or every 10 min (, respectively). It was assumed that the virus particles that are contained in aerosol droplets were evenly distributed in the rooms within a few minutes (Lindsley et al. 2012).
Table 1.
Selected scenarios for which aerosol exposure was quantified in a room of .
| Expelling of virus by one infected person | ||
|---|---|---|
| Abbreviation | Source | Reference of size distribution data |
| Breathe | Breathing | Fabian et al. (2011) |
| Speak-Lo | Speaking | Asadi (2019) |
| Speak-Hi | Speaking | Duguid (1946) |
| Sing | Singing | Alsved et al. (2020) and Mürbe et al. (2020) |
| Cough-Lo | One cough | Lindsley et al. (2012) |
| Cough-Hi | One cough | Duguid (1946) |
| Sneeze-Lo | One sneeze | Gerone et al. (1966) |
| Sneeze-Hi | One sneeze | Duguid (1946) |
Note: Lo and Hi denote low and high aerosol volume relative to each other; Fabian et al. (2011) concerned human rhinovirus-infected subjects, Gerone (1966) concerned coxsackievirus-infected subjects, Lindsley et al. (2012) concerned influenza virus-infected subjects, and all other studies listed in Table 1 concerned studies on healthy individuals. More details on the data used in this study can be found in Supplementary Material S1, specifically Table S1.
One reason for using different scenarios for expelling virus was because of inconsistencies in the literature regarding the number and size distribution of the aerosol droplets from speaking, singing, coughing, and sneezing. For speaking, two scenarios, “low” and “high,” included the data from size distributions in Asadi (2019), in the setting of reading an English passage aloud at intermediate loudness [85 decibels (dB)] and Duguid (1946), considering speaking loudly. For singing, the number distribution of aerosol droplets was taken from Mürbe et al. (2020), and the size distribution of aerosol droplets was taken from Alsved et al. (2020). Two scenarios encompassed the data from size distributions for coughing, denoted as low and high from Lindsley et al. (2012) and Duguid (1946), respectively. Likewise, two scenarios, low and high, encompassed the data from the size distributions in a sneeze as reported by Gerone et al. (1966) and Duguid (1946), respectively. In the selection of data from literature, studies concerning bacterial infections were not included. Size distribution data for breathing were based on the study by Fabian et al. (2011). Fabian et al. (2011) concerned human rhinovirus-infected subjects, Gerone (1966) concerned coxsackievirus–infected subjects, Lindsley et al. (2012) concerned influenza virus–infected subjects, and all other studies listed in Table 1 concerned studies on healthy individuals. The scenarios encompassed exposure of one or more uninfected persons as:
One exposed person in the room of for 20 min, no ventilation.
Ten exposed persons in the room for 2 h; no ventilation.
Ten exposed persons in the room for 2 h; ventilation rate equals 1 air exchange per hour.
Ten exposed persons in the room for 2 h; ventilation rate equals 6 air exchanges per hour.
Exposure assessment was conducted with each of the following virus concentration values in mucus: , , , , , , , and virus particles per milliliter. This range in virus concentrations as estimated from viral RNA detection reflects those observed in nasal and throat swabs (see next section).
Risk Assessment
Virus concentration.
Viral concentrations in throat and nasal swabs that were sent from municipal health services and hospitals to the National Institute for Public Health and the Environment of the Netherlands (RIVM) for COVID-19 diagnosis, were analyzed by us using real-time reverse transcription polymerase chain reaction (RT-PCR) as described in Corman et al. (2020). Virus concentrations were determined for the first 729 SARS-CoV-2 E-gen positive diagnostic samples. This analysis covered variants that were prevalent before July 2020 and not the later so-called United Kingdom (UK) variant SARS-CoV-2 VUI/VOC-202012/01. Most of the swabs contained mucus from throat and nose; those were considered here. Of those swabs, was diluted into sampling buffer/virus transport medium prior to analysis. For quantification, the RdRp gene fragment was used. For conversion of Ct values to the of the concentration in mucus, 20 control samples with 10–4,600 RNA were analyzed, and their Ct values and concentrations were subjected to linear regression:
| (1) |
where is the abscissa and the slope (time dependence).
The concentration data were fitted to a left-censored lognormal distribution using a Bayesian fit in RStan (R Development Core Team 2019; Stan Development Team 2020), in which the logarithm of the virus concentration was assumed to be normally distributed and from the onset of symptoms to decrease in time (Zou et al. 2020):
| (2) |
and
| (3) |
where c is the virus concentration [numbers per mL mucus] with mean , standard deviation (SD) , coefficients and , and time [days] from onset of symptoms.
Total volume of aerosol droplets.
The total initial volume of aerosol droplets per cough, sneeze, 20 min speaking, 20 min singing, and 20 min breathing was calculated from the number of aerosol droplets and their size distribution. Following Liu et al. (2017), in collecting literature data of the size distribution of expelled droplets by breathing, speaking, singing, coughing, and sneezing, expelled droplets smaller than were considered, when measured directly in front of the mouth, assuming little evaporation had happened. Liu et al. (2017) reported that the droplet nuclei size at an RH of 90% (25°C) could be 30% larger than the size of the same droplet at an RH of less than 67.3% (25°C). In the case of a distance of about or more, the size distribution of droplets of or smaller was considered, and for these droplets, their initial size distribution (at the point of leaving the mouth) was estimated by multiplying their diameter by a factor of three, to correct for evaporation (Liu et al. 2017).
For the total aerosol droplet volume by breathing, the data reported by Fabian et al. (2011) were used. Fabian et al. (2011) reported a box and whisker chart of the logarithm of the number of aerosol droplets per liter of exhaled air for 6 aerosol droplet size classes from to . For each size class, the average diameter was used; for the value of was chosen. From the box and whisker chart, the mean and quantile values were extracted by means of a plot digitizer to estimate the mean and SD of the logarithm of the number of aerosol droplets per liter of exhaled air for each of the six aerosol droplet size classes. It was realized that a correlation between the numbers of droplets expelled in the different size classes may exist that was not apparent from this chart (e.g., a subject that expels above-average droplets in one size class was perhaps likely to also expel above-average droplets in other size classes). The total volume of aerosol droplets per minute of exhaled air, was calculated as follows:
| (4) |
where is the diameter [micrometer ()] of aerosol droplets in the i-th class of six aerosol droplet diameters, of which the logarithm of their concentration in air is normally distributed with mean and SD . The volumes of each aerosol droplet size were summed, then converted from cubic micrometers to milliliters by a scaling factor of , and multiplied by the tidal breathing rate that is normally distributed on log-scale with mean and SD (Table 2).
Table 2.
Parameter values.
| Unit | Equation | Parameters | Reference | |
|---|---|---|---|---|
| from Ct |
|
1 |
|
Own data |
| (throat and nasal) |
|
3 |
|
Own data |
| Tidal breathing | L/min | 4 |
|
Fabian et al. (2011) |
| 4 |
|
Fabian et al. (2011) | ||
| — | 5 |
|
Duguid (1945); Asadi (2019) | |
| — | 5 |
|
Mürbe et al. (2020) | |
| — | 5 |
|
Duguid (1945); Lindsley et al. (2012) | |
| — | 5 |
|
Duguid (1945); Gerone et al. (1966) | |
| f | — | 14 | Own data | |
| — | 14 | Haas (2020) |
Note: —, dimensionless; min, minutes.
The of the numbers of expelled aerosol droplets during speaking, singing, coughing, or sneezing, respectively, were assumed to be normally distributed:
| (5) |
The addition of 0.5 within the brackets denotes rounding to the nearest integer values. Values of parameters and are given in Table 2. Using data of Asadi et al. (2019), for speaking, these needed numbers were scaled to the volume of air a person exhales during speaking per minute using the values for tidal breathing increased by 13.5% (Bunn and Mead 1971). Duguid reported data for subjects counting from 1 to 100; it was assumed this represented an observed speaking time of 1.5 min. Values of parameters and represent the range of numbers of aerosol droplets expelled by singing as reported by Mürbe et al. (2020), and those of and represent the number of coughed aerosol droplets as reported by Duguid (1945) and Lindsley et al. (2012). Values of parameters and represent the range of numbers of sneezed aerosol droplets as reported by Duguid (1945) and Gerone et al. (1966).
For each study, the total volume of aerosol droplets per 20 min of speaking, per 20 min of singing, per cough, and per sneeze, (milliliters) was calculated by summing samples of the volumes of each aerosol diameter from the aerosol diameter data set d as follows:
| (6) |
The size distributions of aerosol droplets expelled by speaking were from Duguid (1946) and Asadi et al. (2019). Asadi et al. counted particles of , with highest counts approximately , whereas Duguid reported underestimation of particles less than approximately , with highest counts approximately . The size distributions of aerosol droplets expelled by singing were taken from Alsved et al. (2020). The size distributions or aerosol droplets expelled by coughing where taken from Lindsley et al. (2012) and Duguid (1946). Both reported counts of particles for the various aerosol droplet diameters. The size distributions or aerosol droplets expelled by sneezing where taken from Gerone et al. (1966) and Duguid (1946). Gerone et al. (1966) did not count particles larger than , and Duguid reported underestimation of particles less than about .
See Supplementary Material for more detailed discussion on data selection, the counted aerosol droplet diameter ranges, method of counting, and subjects investigated in the selected studies (section S1, “Selection of expelled particle number and size distribution data”).
Numbers of expelled virus particles in a ventilated room.
Lindsley et al. (2012) showed that room air currents generated by the coughing of the patient and breathing of the worker dispersed the expelled cough particles throughout the room and that within several minutes anyone in the room would be exposed to these particles regardless of their location. Therefore, it was assumed that the expelled aerosol droplets were evenly dispersed in the room. Buonanno et al. (2020) and Nicas et al. (2005) also assumed well-mixed air in the room.
A contagious person was assumed to continuously expel virus particles by breathing, speaking, or singing in an indoor space. Consequently, the number of virus particles that were contained in aerosols in the indoor space were assumed to increase linearly in time. In the scenarios with a single cough or sneeze at the start of the exposure, virus particles were assumed to have also entered the room at that moment. The number of expelled virus particles contained in aerosols as a function of time (min), n(t), then decreased exponentially in time by inactivation, ventilation, and inhalation. These processes can be described by the following governing differential equation:
| (7) |
and initial condition:
| (8) |
where
| (9) |
and where is the virus concentration in mucus (number per milliliter); is a correction factor for evaporation [following Liu et al. (2017), the initial diameter of the aerosols reduce about 3 times at RH of less than 67%; therefore, the volume of the aerosols decreases 27 times, and the virus concentration in the aerosol increases as much]; is the rate of aerosols expelled by breathing, speaking, or singing (milliliter per minute); is the volume of expelled aerosols by a single cough or sneeze (milliliter); is the room volume (liter); is the virus inactivation rate coefficient [per minute, Schuit et al. (2020)]; is the ventilation rate (liter per minute); is the tidal inhalation rate (liter per minute); and is the number of exposed persons.
The analytical solution of Equation 7 with the initial condition in Equation 8 gives n(t):
| (10) |
Dose.
It was assumed that the expelled aerosol droplets were evenly dispersed in the room. The total number of expelled RNA copies of the virus was computed as follows:
| (11) |
where T is the duration of exposure.
Next, the dose D (RNA copies) was computed as:
| (12) |
where is the volume of the room (liters), and is the inhaled volume of an exposed person per minute using the same tidal breath rate as in Equation (4).
Risk of illness.
From characterizing a SARS-CoV-2 isolate (hCoV-19/Netherlands/Zuid-Holland_10003/2020), it was found that RdRp copies/mL corresponded to ( that infects 50% of the cells). Using these data, the fraction f of RNA virus copies that were able to infect a cell can be estimated:
| (13) |
In other words, 80 RdRp genome copies correspond to 1 plaque-forming unit (pfu).
Haas (2020) recommended to use the dose–response data for human coronavirus 229E as representative for SARS-CoV-2. For human coronavirus 229E, it was found that each pfu has a probability of of causing illness.
This implies, then, that, on average, RdRp copies are needed to cause illness.
Finally, the risk of illness, , was computed using the exponential dose response model:
| (14) |
Computation.
All volumes of aerosol droplets, the dose, and risk of illness were computed by drawing 10,000 Monte Carlo samples. All computations were conducted using Mathematica (version 12.0.0; Wolfram Research Inc.).
Additionally, all equations were implemented into a computational tool named AirCoV2 (see Supplementary Material, section S3. Computational tool AirCoV2) with interactive inputs for dimensions of the room, ventilation, duration of the exposure, number of exposed persons, and fractions f and r.
Results
Parameter Values
Table 2 shows the parameter values as obtained for the different equations. None of the particle size distributions could be described properly by a lognormal, gamma, or normal distribution as indicated by an Anderson–Darling test. Therefore, Monte Carlo simulation entailed direct random sampling from the size distribution data.
Exhaled Volumes of Aerosolized Droplets
The total volume of expelled aerosolized droplets as calculated for the different scenarios for breathing, speaking, singing, coughing, and sneezing (Equations 3 and 5) is shown in Figure 2. Variation was observed both within and between scenarios. For sneezing there was about one order of magnitude difference between the low and high scenarios (mean from 5,300 to 40,000 picoliters per sneeze). For coughing there were about two orders of magnitude difference between the low and high scenarios (mean from 47 to 4,900 pL per cough). For 20 min of singing, the mean volume was 4,300 pL. For speaking, the two scenarios were similar (mean from 260 to 360 pL per 20 min). The breathing scenario varied about seven orders of magnitude (mean 44, range from 0.004 to 18,000 pL per 20 min); the speaking and coughing scenarios varied about three orders of magnitude and the singing and sneezing scenarios varied about two orders of magnitude. The total aerosol volume from speaking loudly for 20 min was in between that of the low and high scenarios from one cough and that of singing was similar to that of a cough.
Figure 2.

Box-and-whisker chart of the total aerosol droplet volumes (pL) that are expelled in each scenario (Table 1), showing median values, quartiles (boxes) and minimum and maximum values (whiskers). Volumes in pL/20 min for breathing, singing, and speaking and in pL per cough and per sneeze; Lo and Hi denote low and high aerosol volume relative to each other. The numbers are based on the case of a virus-expelling person with a concentration of RNA copies/mL in the mucus. See numerical values of the total aerosol droplet volumes in pL in Table S2. Note: pL, picoliters.
Viral Concentration Data from Swabs
The values of coefficients and (Equation 1) and and (Equation 2) are listed in Table 2. Observed SARS-CoV-2 concentrations in mucus spanned a wide range, from to copies/mL (corresponding to a range of Ct values from 40 to 10.5). A decrease in concentration from the onset of symptoms was observed. This implies that the probability that a contagious person at the onset of symptoms is expelling at least , , , , , or RNA copies/mL is 88%, 66%, 36%, 13%, 2.7%, and 0.34%, respectively. This information is also included in the caption of Figure 4.
Figure 4.
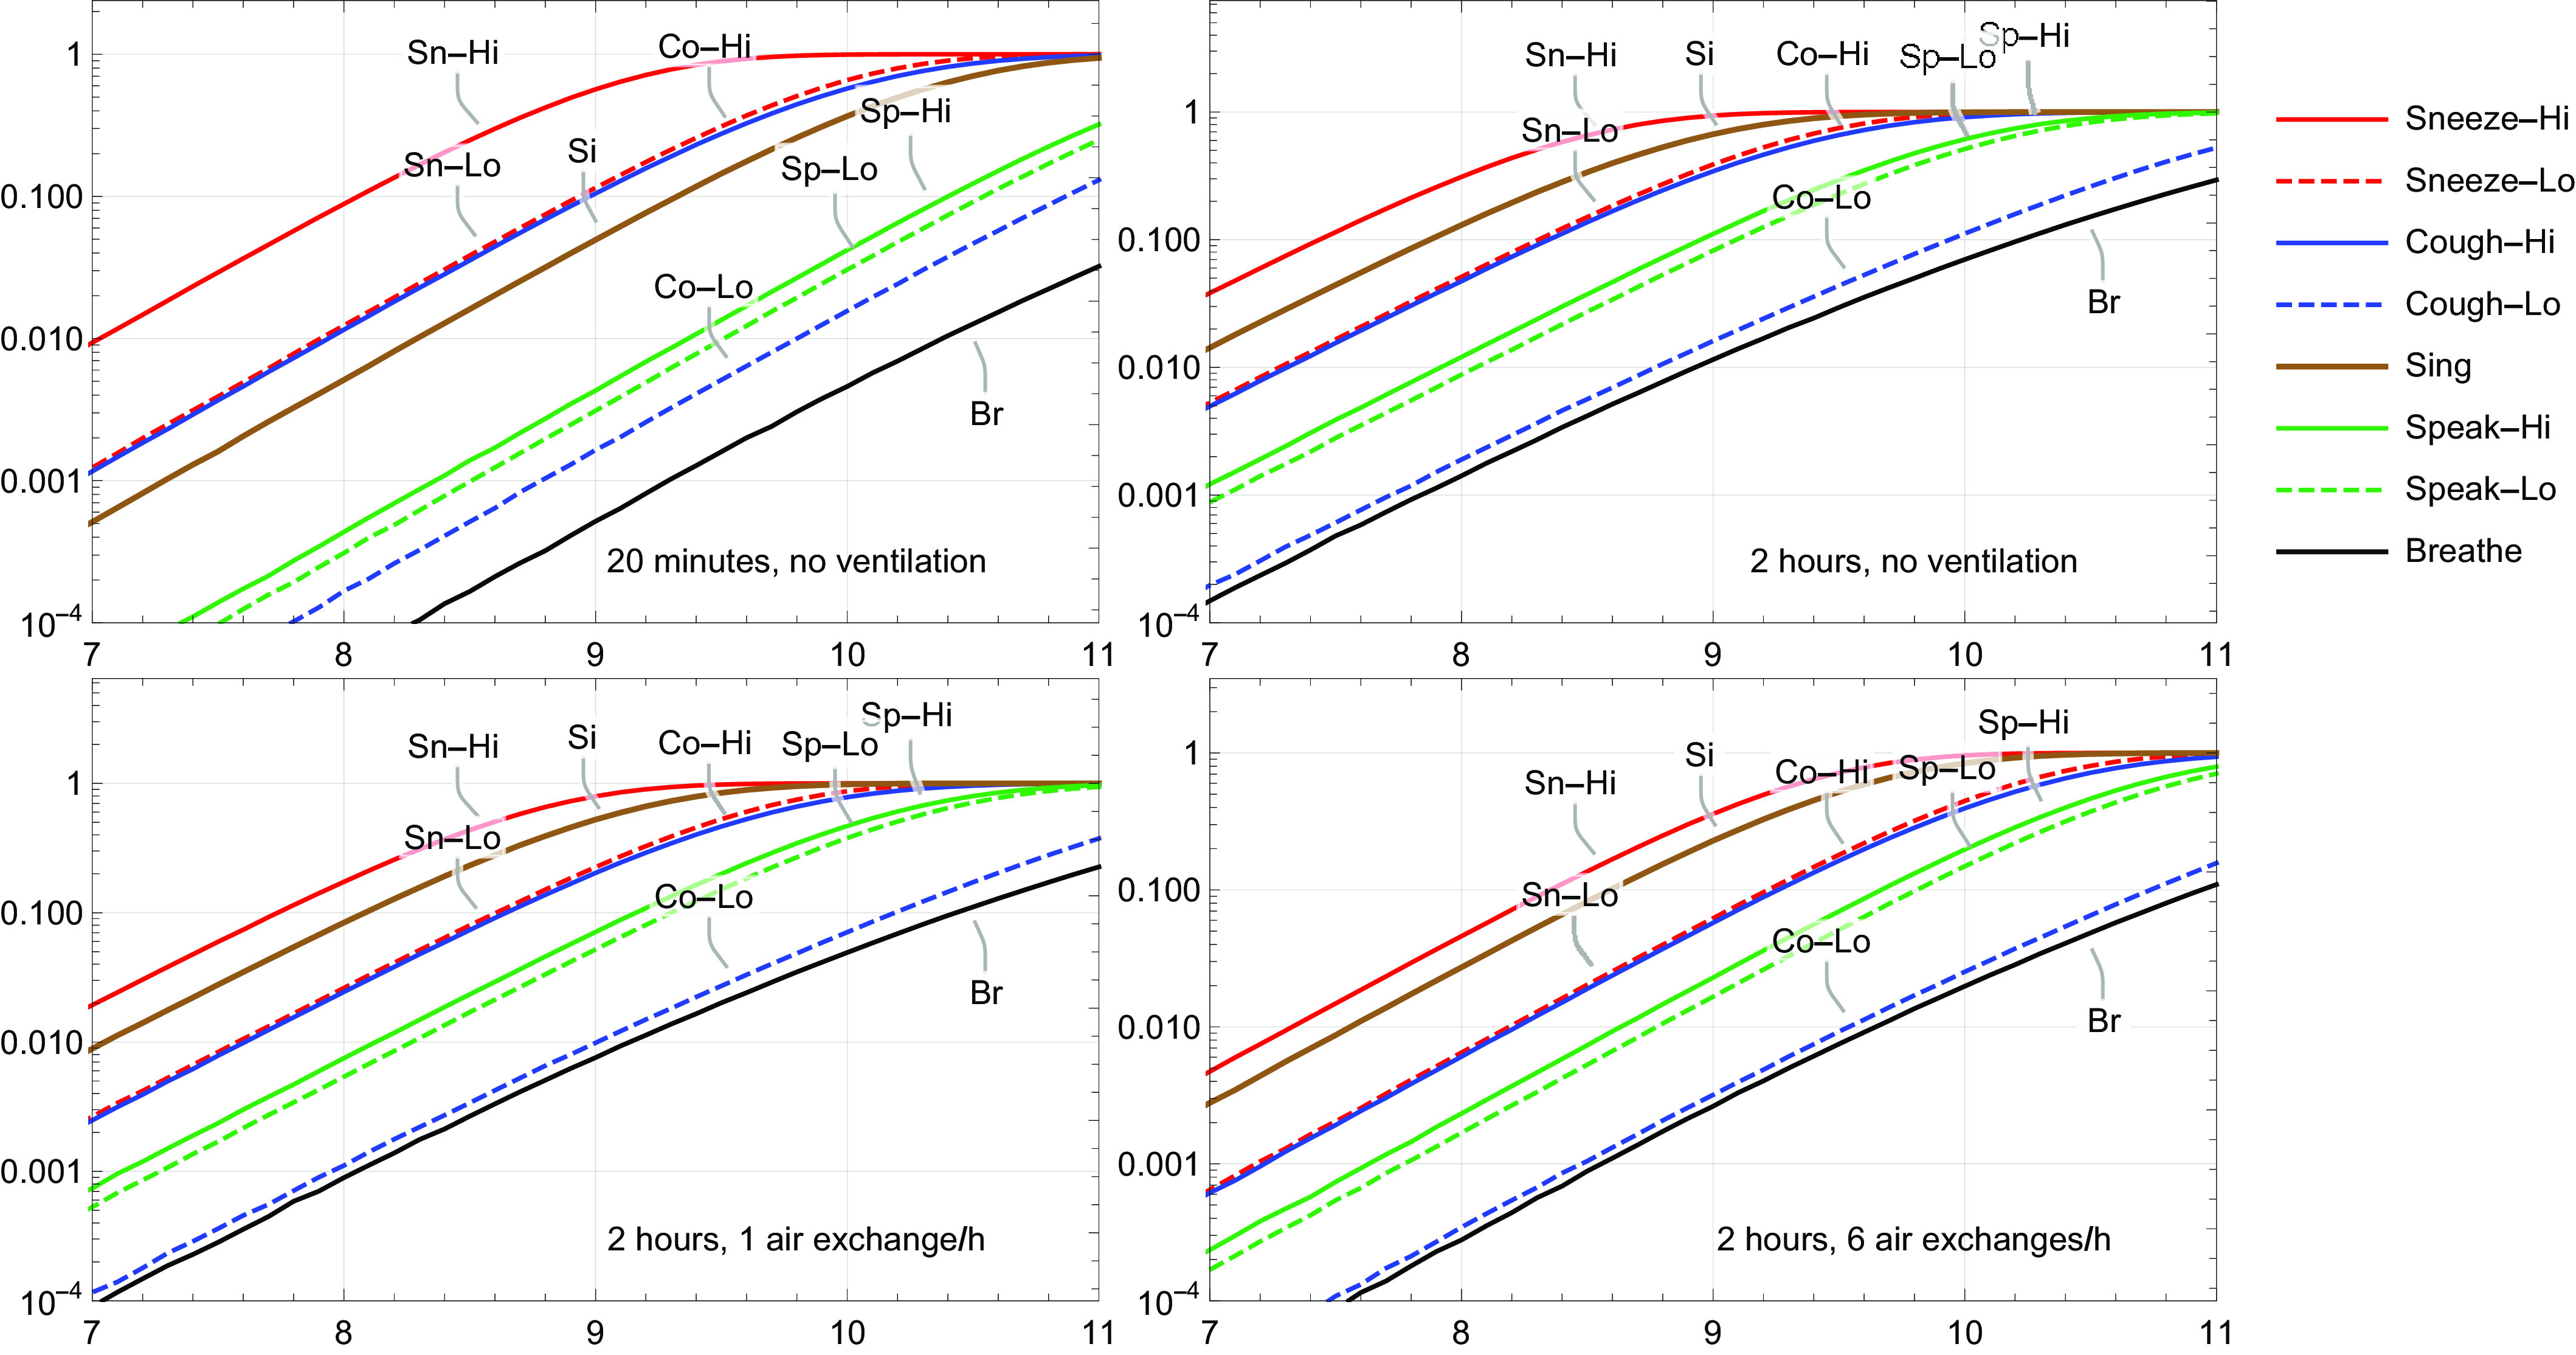
Mean risk of illness from SARS-CoV-2 for different scenarios, in which one infected person was expelling virus for 20 min or 2 h, without or with ventilation. The probability that a contagious person at the onset of symptoms is expelling at least , , , , or RNA copies/mL was estimated to be 88%, 66%, 36%, 13%, 2.7%, and 0.34%, respectively. Lo and Hi denote low and high aerosol volume relative to each other.
Numbers of Expelled Virus Particles and Dose
Figure 3 shows the numbers of SARS-CoV-2 RNA copies that were estimated to be expelled during 20 min by a contagious person, assuming RNA copies/mL in the mucus. The average numbers were 1,100; 6,600; 9,100; 11,000; 3,500; 25,000; 26,000; and RNA copies for breathing, speaking-lo, speaking-hi, singing, coughing-lo, coughing-hi, sneezing-lo, and sneezing-hi, respectively. In the room, the concentration of RNA copies therefore ranged from about to 1 per liter of air. At lower virus concentrations (e.g., copies/mL in the mucus), there was a large probability that no viruses were expelled, especially during breathing and speaking. The corresponding dose of RNA copies per exposed person was four orders of magnitude lower due to dilution (Equation 11). Variations in the numbers between and within breathing, speaking, singing, coughing, and singing were of similar orders of magnitude as those of the aerosol volumes.
Figure 3.

Box-and-whisker chart of the numbers of SARS-CoV-2 RNA copies expelled after 20 min of breathing, speaking, or singing, and after one cough or one sneeze, showing median values, quartiles (boxes) and minimum and maximum values (whiskers); Lo and Hi denote low and high aerosol volume relative to each other. The numbers are based on the case of a virus-expelling person with a concentration of RNA copies/mL in the mucus. See numerical values in Table S3.
Risk of Illness
Figure 4 summarizes the risks of illness for all scenarios. Note that the figure shows the mean risks, and these probabilities vary one to two orders of magnitude. In the 20-min scenario (Figure 4, top left), at RNA copies/mL, all mean illness risks were largely below 0.001, except the high sneeze scenario, and at RNA copies/mL, all mean illness risks were below 0.01, except the high sneeze scenario. At even higher virus concentrations, in both sneeze scenarios, the high cough scenario and the singing scenario, illness risks exceeded 0.01 and may become very high, whereas the low coughing scenario, both speaking scenarios and the breathing scenario largely remained below a risk of 0.1. Next, in the 2-h scenario without ventilation (Figure 4, top right), the number of expelled virus particles from one sneeze and one cough were the same as in the 20-min scenario, but, because of longer exposure, risks increased by about a factor of four. In the 2-h scenario without ventilation, more virus particles were expelled by singing, speaking, and breathing; consequently, risks in the singing, speaking, and breathing scenarios were higher by a factor of 20–30. In the 2-h scenario, singing became the second-highest risk scenario. At a concentration of RNA copies/mL, the mean risk of illness in the singing scenario equaled 0.13. Adding one air exchange per hour to the scenarios (Figure 4, bottom left) reduced risk of illness for all scenarios by about a factor of 2. Compared with no ventilation, six air exchanges per hour (Figure 4, bottom right) reduced risk of illness by a factor of 8–13 for the sneeze and cough scenarios and by a factor 4–9 for the singing, speaking, and breathing scenarios. Figure S1 in section S3 of Supplementary Material shows a screenshot of the computational tool AirCoV2 for the 2-h scenario with six air exchanges per hour. The numbers of expelled RNA copies in the room are depicted as functions of time. It shows that for the singing, speaking, and breathing scenarios, an equilibrium was reached after about 20 min, and that for the sneezing and coughing scenarios, the initial high concentrations of virus RNA copies in the air were reduced by two to three orders in magnitude, but this took about 1 h.
Discussion
The probability of illness per person per event due to exposure to SARS-CoV-2 particles contained in aerosol droplets that were expelled by one infected person was estimated in various scenarios wherein the infected person was expelling virus by breathing, speaking, coughing, or sneezing. Important assumptions were that the expelled initial aerosol droplets have the same virus concentration as measured in mucus from nasal and throat swab samples and that the numbers of virus particles in mucus were evenly distributed. Moreover, it was assumed that the expelled aerosol droplets were evenly distributed in the air of the room.
The observed of SARS-CoV-2 concentrations in swab samples at the onset of symptoms could be described with a normal distribution with parameters and . The corresponding median and 95th-percentile concentrations were and RNA copies/mL. From the onset of symptoms, the concentrations decreased with time, which is in agreement with the findings of van Kampen et al. (2020), Wölfel et al. (2020) and Zou et al. (2020). Jones et al. (2020), Kleiboeker et al. (2020), van Kampen et al. (2020), Wölfel et al. (2020), and Zou et al. (2020), all reported median virus concentrations of about RNA copies/mL in a range of about RNA copies/mL, when not accounting for the days since onset of symptoms.
The calculated range of viral concentrations in the air (from to 1 RNA copies per liter of air, as shown above) did encompass the values of observed airborne SARS-CoV-2 concentrations in hospital rooms with SARS-CoV-2 patients (Chia et al. 2020; Guo et al. 2020; Liu et al. 2020; Ong et al. 2020; Santarpia et al. 2020b). Chia et al. (2020) observed total airborne SARS-CoV-2 concentrations ranging from 1.8 to 3.4 RNA copies per liter of air. About half of the RNA was found in droplets sized , and the other half in particles sized . Santarpia et al. (2020b) similarly observed 0.98–8.7 copies per liter of air in hallway air samplers, and higher concentrations of 5.4–67 copies per liter of air with personal air samplers. From one of the samples, it was indicated that it contained culturable SARS-CoV-2. Santarpia et al. (2020a) collected aerosol samples with particles sizes of , , and from around six patients, and detected culturable SARS-CoV-2 virus in three samples of aerosol. The findings of both studies by Santarpia et al. suggest that not only RNA in inactivated virus was emitted to the air, but also infectious virus. Liu et al. (2020) measured air in COVID-19 patient areas, staff areas, and public areas in two Wuhan, China, hospitals. In all three areas, positive samples were found with low concentrations, ranging from to RNA copies/L for patient areas, to for staff areas, and to for public areas. Highest SARS-CoV-2 concentrations were detected in droplet size ranges of and . Guo et al. (2020) similarly found air samples positive for SARS-CoV-2 RNA both in patient isolation wards and the doctor’s office in a hospital. In contrast, Faridi et al. (2020) and Ong et al. (2020) were unable to detect SARS-CoV-2 RNA in the air in hospital wards. Ong et al. measured in well-ventilated airborne infection isolation rooms and their anterooms (12 air changes per hour). Although air samples were negative, the air outlet fan was found positive for SARS-CoV-2 RNA.
The assumption that expelled aerosol droplets are evenly distributed in the air of the room implies that there is an immediate dilution of the expelled virus concentration, which lowers its concentration in the air but also spreads the virus. Obviously, dilution will not really occur instantaneously; it highly depends on the movement of the air in the room. An exposed person directly in front of the infected person, or in a flow path of the contaminated air, may inhale a much larger dose than average. Clearly, air ventilation is very important. It may be surmised that in outdoor spaces exposure probability will be much less, due to much more dispersion and dilution.
For virus inactivation, an inactivation rate coefficient of 0.008/h was applied (Schuit et al. 2020), which implies that virus numbers decreased by 1.6% over a period of 2 h, which is negligible.
For a characterized SARS-CoV-2 isolate, it was found that 56 RdRp genome copies represented 1 (). This was the lowest number of genome copies found to produce culturable virus, and, therefore, a conservative estimate. On the one hand, van Kampen et al. (2020) found only a cytopathic effect on Vero cells if the swab sample from patients contained more than 7 RNA copies/mL, which is a totally different order of magnitude. On the other hand, Lednicky et al. (2020) collected aerosols containing SARS-CoV-2 in a room housing COVID-19 patients using air samplers that operated with a water vapor condensation mechanism and, therefore, collected virus particles without damaging them, and found on average 0.6 copy. The data of Fears et al. (2020) show an average of 0.003 in range from 0.0008 to 0.02 copy.
In the current study, the recommendation of Haas (2020) was followed for using the dose response data for human coronavirus 229E, i.e., . When combining f and r, the result is 1/1,440. Popa et al. (2020) reported that based on a transmission network with 39 transmission events that the number of viral genomes needed to initiate infection was on average about 1,000 (1–5,000), which matches really well. The location of infection, in relation to the size of the droplets might be of importance with respect to illness outcomes. Droplets can penetrate more deeply into the lungs, where SARS-CoV-2 can infect airway epithelia (Gralton et al. 2011; Milton 2020). SARS-CoV-2 entry factors were also found to be highly expressed in nasal epithelia, meaning that infection can likely establish there as well (Sungnak et al. 2020). Logically, SARS-CoV-2 prevalence in the population can influence the probability that an infected person is present in a bus or room, this probability was not accounted for in the model. Similarly, immunity in the population can influence the probability that susceptible persons are present.
The current study was entirely focused on estimating probabilities of exposure to SARS-CoV-2 in aerosolized droplets that are small enough to be distributed in the air farther than . From this study, the relative importance of aerosol and droplet transmission cannot be determined. To put this in perspective, Duguid (1946) also captured droplets with an initial diameter of from study subjects when they were speaking, coughing, or sneezing, of which the total volume could be 3–5 orders of magnitude higher than the total volume of the smaller droplets . However, for droplet transmission, different factors govern the probability of exposure, such as the probability of expelling droplets directly onto the mucosa of another person, hand hygiene, hand–mouth contact, virus transfer rates, etc. It should be noted that although transmission at short distances is commonly thought to be droplet transmission, Chen et al. (2020) found that the short-range airborne route actually dominates at most distances during both talking and coughing. Chen et al. studied airborne transmission in general, not specifically SARS-CoV-2 or another virus.
The highest numbers of viruses were expelled in aerosol droplets from a sneeze, followed by the high coughing scenario. Symptoms can start acutely, and the highest virus loads were found in naso-pharyngeal swabs the day before and during first days with symptoms (Kimball et al. 2020; Pan et al. 2020; Zou et al. 2020). Therefore, an occasional sneeze or cough could easily occur before a person with COVID-19 realizes that he or she should have stayed at home. As coughing is a predominant symptom of COVID-19 (Wang et al. 2020), it can be envisioned that the scenario of a single cough is not realistic, and a person may cough many times in a row. This would render coughing perhaps more important than sneezing. Furthermore, singing, speaking loudly, and breathing heavily because of intense activity may expel as many virus particles as coughing. High SARS-CoV-2 illness rates resulting from choir practices have been reported (Hamner et al. 2020). Singing is reportedly associated with tuberculosis outbreaks (Mangura et al. 1998), and Loudon and Roberts (1968) found the number of airborne droplet nuclei after singing to be higher than after talking and nearly as high as after coughing. Other studies also suggested that airborne transmission of infectious diseases is possible without coughing or sneezing simply from exhaled breath from individuals who barely show any symptoms (Asadi et al. 2019; Yan et al. 2018).
The observed droplet size distribution peak was different in studies measuring specifically in smaller size ranges () (Asadi et al. 2019; Fabian et al. 2011) from that in studies measuring in larger size ranges for both airborne and larger droplets (). Studies measuring in the small range generally reported the peak (highest numbers of particles) was , whereas studies measuring in the larger range reported the peak was (Chao et al. 2009; Duguid 1946). Difference in the sensitivity of the equipment for certain size classes might account for this discrepancy.
The aerosol droplet volume for breathing showed a much higher variation than did the other aerosol volumes (Figure 2). This finding may well be explained by the fact that the data on the size distribution of the expelled aerosols by breathing included between-person variation (Equation 3), whereas the data on the size distribution by speaking, singing, coughing, and sneezing were reported average values (Equation 5). This also suggests that the variation in aerosol volume from speaking, singing, coughing, and sneezing was much larger than depicted in Figure 2.
Various factors may potentially influence superspreading. A person producing high levels of virus in the (upper) respiratory system can be thought of as a superreplicator. If a superreplicator is average or above average in droplet and aerosol production, he or she may be a supershedder, not only producing high load of virus but also excreting high viral loads in transmittable form. If a supershedder does not follow the mitigation protocols (stay at home when sick, practice proper coughing and sneezing hygiene, etc.), a supershedder can become a superspreader, someone causing many more infections than anticipated based on the average . For many infectious diseases, it is thought that superspreaders drive a large part of the transmission in the population; for SARS-CoV-1 the 20% most infectious individuals were estimated to have caused 80%–90% of the transmission (Galvani and May 2005; Lloyd-Smith et al. 2005), and this estimate has been suggested also for SARS-CoV-2 (Endo et al. 2020). The current risk assessment underpins the idea of superspreading events via aerosols. High virus concentrations in mucus of infected individuals appear to be necessary for high risks. For the new UK-originated variant SARS-CoV-2 VOC-202012/01, a 4-fold higher load in clinical materials is estimated based on PCR Ct data (New and Emerging Respiratory Virus Threats Advisory Group 2020), which would imply doses that are four times higher. The exposure assessment of this study demonstrated that viral RNA copy concentrations in mucus above may easily give rise to very high exposure probabilities, even during breathing and speaking. SARS-CoV-2 superspreaders might be pre- or asymptomatic. Kimball et al. (2020) reported no significant difference in observed viral concentrations (Ct values) in throat and nose swabs among symptomatic, presymptomatic, and asymptomatic individuals. One of the subjects in the study by Zou et al. (2020) was asymptomatic and shed viral numbers that were similar to symptomatic subjects. In the 2-h scenario without ventilation (Figure 4, top right), the estimated risks indicated that for a risk of illness of 0.5, either the virus concentration in mucus should be RNA copies/mL and/or the number of aerosols produced by singing was more than average. Note also that the volume of aerosol droplets produced by singing may span two orders of magnitude.
The aim of this study was to assess exposure to airborne SARS-CoV-2 particles from breathing, speaking, singing, coughing, and sneezing in an indoor environment. Key findings are:
Data on size, distribution, and amounts of aerosol droplets generated by breathing, speaking, singing, coughing, and sneezing that are small enough to stay afloat in the air and be dispersed in indoor spaces vary widely. Despite these variations, there is ample evidence that indoor dispersion of aerosol droplets occurs. Generally, higher counts of smaller aerosol droplets, up to the submicron level, could be detected in more recent studies (Asadi et al. 2019; Fabian et al. 2011) as compared to older studies (Duguid 1946; Gerone et al. 1966). Several studies have measured SARS-CoV-2 in the air, four of which showed infectious virus particles (Fears et al. 2020, 2020a; Santarpia et al. 2020b; van Doremalen et al. 2020). Detection of virus particles in the air is hampered by the fact that concentrations are commonly low, as was demonstrated in this study. Nevertheless, such concentrations may still give rise to significant probabilities of exposure (10 persons may inhale 5,000 liters of air per hour). To conclude: Aerosol transmission of SARS-CoV-2 is possible and should not be disregarded.
Moreover, according to the RIVM data presented in this study, at the onset of symptoms, 13% of cases carry concentrations as high as at least RNA copies per mL mucus and 2.7% at least RNA copies per mL, probably even in pre- and asymptomatic persons, adding to the probability of exposure.
According to our results, sneezing leads to highest probabilities of exposure, followed by coughing, singing, and speaking, and last, by breathing, in the selected scenarios.
The exposure assessment in this study can be used as a basis to estimate probabilities of exposure to SARS-CoV-2 by airborne transmission in indoor spaces, thereby accounting for the probability that infected persons are present (prevalence) and for the number of exposed persons, the size of the indoor space, duration of expelling virus by the emitter, and duration of exposure to the virus.
The model has been developed into an interactive computational tool, AirCoV2, that allows users to run scenarios of their choice.
Supplementary Material
Acknowledgments
The authors gratefully acknowledge the Dutch COVID-19 response team consisting of colleagues from RIVM-LCI, RIVM-Centre for Infectious Diseases, Epidemiology and Surveillance (EPI), and Erasmus Medical Centre. Furthermore, the authors express gratitude to the RIVM COVID-19 molecular diagnostic team of Centre for Infectious Diseases Research, Diagnostics and Laboratory Surveillance (IDS) for use of diagnostic data on Dutch COVID-19 patients. The authors thank Municipal health services and hospital labs for sending in specimens of suspected COVID-19 patients and providing additional clinical data. Special thanks are extended to H. Vennema for fruitful discussions. The authors thank anonymous reviewers for valuable comments on this work. This work was funded by the Dutch Ministry of Health, Welfare, and Sports.
References
- Adhikari U, Chabrelie A, Weir M, Boehnke K, McKenzie E, Ikner L, et al. 2019. A case study evaluating the risk of infection from Middle Eastern respiratory syndrome coronavirus (MERS-CoV) in a hospital setting through bioaerosols. Risk Anal 39(12):2608–2624, PMID: 31524301, 10.1111/risa.13389. [DOI] [PMC free article] [PubMed] [Google Scholar]
- Alsved M, Matamis A, Bohlin R, Richter M, Bengtsson PE, Fraenkel CJ, et al. 2020. Exhaled respiratory particles during singing and talking. Aerosol Sci Technol 54(11):1245–1248, 10.1080/02786826.2020.1812502. [DOI] [Google Scholar]
- Anderson EL, Turnham P, Griffin JR, Clarke CC. 2020. Consideration of the aerosol transmission for COVID-19 and public health. Risk Anal 40(5):902–907, PMID: 32356927, 10.1111/risa.13500. [DOI] [PMC free article] [PubMed] [Google Scholar]
- Asadi S, Bouvier N, Wexler AS, Ristenpart WD. 2020. The coronavirus pandemic and aerosols: does COVID-19 transmit via expiratory particles? Aerosol Sci Technol 0(0):1–4, PMID: 32308568, 10.1080/02786826.2020.1749229. [DOI] [PMC free article] [PubMed] [Google Scholar]
- Asadi S, Wexler AS, Cappa CD, Barreda S, Bouvier NM, Ristenpart WD. 2019. Aerosol emission and superemission during human speech increase with voice loudness. Sci Rep 9(1):2348, PMID: 30787335, 10.1038/s41598-019-38808-z. [DOI] [PMC free article] [PubMed] [Google Scholar]
- Bourouiba L, Dehandschoewercker E, Bush JW. 2014. Violent expiratory events: on coughing and sneezing. J Fluid Mech 745:537–563, 10.1017/jfm.2014.88. [DOI] [Google Scholar]
- Bunn JC, Mead J. 1971. Control of ventilation during speech. J Appl Physiol 31(6):870–872, PMID: 5123666, 10.1152/jappl.1971.31.6.870. [DOI] [PubMed] [Google Scholar]
- Buonanno G, Stabile L, Morawska L. 2020. Estimation of airborne viral emission: quanta emission rate of SARS-CoV-2 for infection risk assessment. Environ Int 141:105794, PMID: 32416374, 10.1016/j.envint.2020.105794. [DOI] [PMC free article] [PubMed] [Google Scholar]
- Chao CYH, Wan MP, Morawska L, Johnson GR, Ristovski ZD, Hargreaves M, et al. 2009. Characterization of expiration air jets and droplet size distributions immediately at the mouth opening. J Aerosol Sci 40(2):122–133, PMID: 32287373, 10.1016/j.jaerosci.2008.10.003. [DOI] [PMC free article] [PubMed] [Google Scholar]
- Chen W, Zhang N, Wei J, Yen H-L, Li Y. 2020. Short-range airborne route dominates exposure of respiratory infection during close contact. Build Environ 176:106859, 10.1016/j.buildenv.2020.106859. [DOI] [Google Scholar]
- Chia PY, Coleman KK, Tan YK, Ong SWX, Gum M, Lau SK, et al. 2020. Detection of air and surface contamination by severe acute respiratory syndrome coronavirus 2 (SARS-CoV-2) in hospital rooms of infected patients. medRxiv. Preprint posted online April 9, 2020. 10.1101/2020.03.29.20046557. [DOI]
- Corman VM, Landt O, Kaiser M, Molenkamp R, Meijer A, Chu DK, et al. 2020. Detection of 2019 novel coronavirus (2019-nCoV) by real-time RT-PCR. Euro Surveill 25(3):2000045, PMID: 31992387, 10.2807/1560-7917.ES.2020.25.3.2000045. [DOI] [PMC free article] [PubMed] [Google Scholar]
- Correia G, Rodrigues L, Gameiro da Silva M, Gonçalves T. 2020. Airborne route and bad use of ventilation systems as non-negligible factors in SARS-CoV-2 transmission. Med Hypotheses 141:109781, PMID: 32361528, 10.1016/j.mehy.2020.109781. [DOI] [PMC free article] [PubMed] [Google Scholar]
- Duguid JP. 1945. The numbers and the sites of origin of the droplets expelled during expiratory activities. Edinb Med J 52:385–401, PMID: 21009905. [PMC free article] [PubMed] [Google Scholar]
- Duguid JP. 1946. The size and the duration of air-carriage of respiratory droplets and droplet-nuclei. J Hyg (Lond) 44(6):471–479, PMID: 20475760, 10.1017/s0022172400019288. [DOI] [PMC free article] [PubMed] [Google Scholar]
- Endo A, Abbott S, Kucharski A, Funk S, Centre for the Mathematical Modelling of Infectious Diseases COVID-19 Working Group. 2020. Estimating the overdispersion in COVID-19 transmission using outbreak sizes outside China. Wellcome Open Res 5:67, PMID: 32685698, 10.12688/wellcomeopenres.15842.1. [DOI] [PMC free article] [PubMed] [Google Scholar]
- Fabian P, Brain J, Houseman EA, Gern J, Milton DK. 2011. Origin of exhaled breath particles from healthy and human rhinovirus-infected subjects. J Aerosol Med Pulm Drug Deliv 24(3):137–147, PMID: 21361786, 10.1089/jamp.2010.0815. [DOI] [PMC free article] [PubMed] [Google Scholar]
- Faridi S, Niazi S, Sadeghi K, Naddafi K, Yavarian J, Shamsipour M, et al. 2020. A field indoor air measurement of SARS-CoV-2 in the patient rooms of the largest hospital in Iran. Sci Total Environ 725:138401, PMID: 32283308, 10.1016/j.scitotenv.2020.138401. [DOI] [PMC free article] [PubMed] [Google Scholar]
- Fears AC, Klimstra WB, Duprex P, Hartman A, Weaver SC, Plante KS, et al. 2020. Comparative dynamic aerosol efficiencies of three emergent coronaviruses and the unusual persistence of SARS-CoV-2 in aerosol suspensions. medRxiv. Preprint posted online April 18, 2020. 10.1101/2020.04.13.20063784. [DOI]
- Galvani AP, May RM. 2005. Epidemiology: dimensions of superspreading. Nature 438(7066):293–295, PMID: 16292292, 10.1038/438293a. [DOI] [PMC free article] [PubMed] [Google Scholar]
- Gerone PJ, Couch RB, Keefer GV, Douglas RG, Derrenbacher EB, Knight V. 1966. Assessment of experimental and natural viral aerosols. Bacteriol Rev 30(3):576–588, PMID: 5917337. [DOI] [PMC free article] [PubMed] [Google Scholar]
- Gralton J, Tovey E, McLaws ML, Rawlinson WD. 2011. The role of particle size in aerosolised pathogen transmission: a review. J Infect 62(1):1–13, PMID: 21094184, 10.1016/j.jinf.2010.11.010. [DOI] [PMC free article] [PubMed] [Google Scholar]
- Guo Z-D, Wang Z-Y, Zhang S-F, Li X, Li L, Li C, et al. 2020. Aerosol and surface distribution of severe acute respiratory syndrome coronavirus 2 in hospital wards, Wuhan, China, 2020. Emerg Infect Dis 26(7): 1583–1591, PMID: 32275497, 10.3201/eid2607.200885. [DOI] [PMC free article] [PubMed] [Google Scholar]
- Haas CN. 2020. Action levels for SARS-CoV-2 in air: a preliminary approach. OSF Preprints. Preprint posted online August 14, 2020. 10.31219/osf.io/erntm. [DOI] [Google Scholar]
- Hamner L, Dubbel P, Capron I, Ross A, Jordan A, Lee J, et al. 2020. High SARS-CoV-2 attack rate following exposure at a choir practice – Skagit County, Washington, March 2020. MMWR Morb Mortal Wkly Rep 69(19):606–610, PMID: 32407303, 10.15585/mmwr.mm6919e6. [DOI] [PubMed] [Google Scholar]
- Jones TC, Mühlemann B, Veith T, Biele G, Zuchowski M, Hoffmann J, et al. 2020. An analysis of SARS-CoV-2 viral load by patient age. medRxiv. Preprint posted online June 9, 2020. 10.1101/2020.06.08.20125484. [DOI] [Google Scholar]
- Kimball A, Hatfield KM, Arons M, James A, Taylor J, Spicer K, et al. 2020. Asymptomatic and presymptomatic SARS-CoV-2 infections in residents of a long-term care skilled nursing facility — King County, Washington, March 2020. MMWR Morb Mortal Wkly Rep 2020 69(13):377–381, PMID: 32240128, 10.15585/mmwr.mm6913e1. [DOI] [PMC free article] [PubMed] [Google Scholar]
- Kleiboeker S, Cowden S, Grantham J, Nutt J, Tyler A, Berg A, et al. 2020. SARS-CoV-2 viral load assessment in respiratory samples. J Clin Virol 129:104439, PMID: 32674034, 10.1016/j.jcv.2020.104439. [DOI] [PMC free article] [PubMed] [Google Scholar]
- Kohanski MA, Palmer JN, Cohen NA. 2020. Aerosol or droplet: critical definitions in the COVID-19 era. Int Forum Allergy Rhinol 10(8):968–969, PMID: 32323923, 10.1002/alr.22591. [DOI] [PMC free article] [PubMed] [Google Scholar]
- Kulkarni H, Smith CM, Lee DDH, Hirst RA, Easton AJ, O’Callaghan C. 2016. Evidence of respiratory syncytial virus spread by aerosol. Time to revisit infection control strategies? Am J Respir Crit Care Med 194(3):308–316, PMID: 26890617, 10.1164/rccm.201509-1833OC. [DOI] [PubMed] [Google Scholar]
- Lednicky JA, Lauzardo M, Fan ZH, Jutla AS, Tilly TB, Gangwar M. 2020. Viable SARS-CoV-2 in the air of a hospital room with COVID-19 patients. medRxiv Preprint posted online August 04, 2020. 10.1101/2020.08.03.20167395. [DOI] [PMC free article] [PubMed] [Google Scholar]
- Leung NHL, Chu DKW, Shiu EYC, Chan K-H, McDevitt JJ, Hau BJP, et al. 2020. Respiratory virus shedding in exhaled breath and efficacy of face masks. Nat Med 26(5):676–680, PMID: 32371934, 10.1038/s41591-020-0843-2. [DOI] [PMC free article] [PubMed] [Google Scholar]
- Li Y, Qian H, Hang J, Chen X, Hong L, Liang P, et al. 2020. Aerosol transmission of SARS-CoV-2 - evidence for probable aerosol transmission of SARS-CoV-2 in a poorly ventilated restaurant. medRxiv. Preprint posted online April 22, 2020. 10.1101/2020.04.16.20067728. [DOI] [Google Scholar]
- Lindsley WG, Pearce TA, Hudnall JB, Davis KA, Davis SM, Fisher MA, et al. 2012. Quantity and size distribution of cough-generated aerosol particles produced by influenza patients during and after illness. J Occup Environ Hyg 9(7):443–449, PMID: 22651099, 10.1080/15459624.2012.684582. [DOI] [PMC free article] [PubMed] [Google Scholar]
- Liu Y, Ning Z, Chen Y, Guo M, Liu Y, Gali NK, et al. 2020. Aerodynamic analysis of SARS-CoV-2 in two Wuhan hospitals. Nature 582(7813):557–560, PMID: 32340022, 10.1038/s41586-020-2271-3. [DOI] [PubMed] [Google Scholar]
- Liu L, Wei J, Li Y, Ooi A. 2017. Evaporation and dispersion of respiratory droplets from coughing. Indoor Air 27(1):179–190, PMID: 26945674, 10.1111/ina.12297. [DOI] [PubMed] [Google Scholar]
- Lloyd-Smith JO, Schreiber SJ, Kopp PE, Getz WM. 2005. Superspreading and the effect of individual variation on disease emergence. Nature 438(7066):355–359, PMID: 16292310, 10.1038/nature04153. [DOI] [PMC free article] [PubMed] [Google Scholar]
- Loudon RG, Roberts RM. 1968. Singing and the dissemination of tuberculosis. Am Rev Respir Dis 98:297–300, PMID: 5667756, 10.1164/arrd.1968.98.2.297. [DOI] [PubMed] [Google Scholar]
- Mangura BT, Napolitano EC, Passannante MR, McDonald RJ, Reichman LB. 1998. Mycobacterium tuberculosis miniepidemic in a church gospel choir. Chest 113(1):234–237, PMID: 9440596, 10.1378/chest.113.1.234. [DOI] [PubMed] [Google Scholar]
- Milton DK. 2020. A Rosetta stone for understanding infectious drops and aerosols. J Pediatric Infect Dis Soc 9(4):413–415, PMID: 32706376, 10.1093/jpids/piaa079. [DOI] [PMC free article] [PubMed] [Google Scholar]
- Milton DK, Fabian MP, Cowling BJ, Grantham ML, McDevitt JJ. 2013. Influenza virus aerosols in human exhaled breath: particle size, culturability, and effect of surgical masks. PLoS Pathog 9(3):e1003205, PMID: 23505369, 10.1371/journal.ppat.1003205. [DOI] [PMC free article] [PubMed] [Google Scholar]
- Morawska L, Cao J. 2020. Airborne transmission of SARS-CoV-2: the world should face the reality. Environ Int 139:105730, PMID: 32294574, 10.1016/j.envint.2020.105730. [DOI] [PMC free article] [PubMed] [Google Scholar]
- Mürbe D, Kriegel M, Lange J, Rotheudt H, Fleischer M. 2020. Aerosol emission is increased in professional singing. Preprint Technische Universität Berlin. Preprint posted online July 3, 2020. 10.14279/depositonce-10374. [DOI]
- New and Emerging Respiratory Virus Threats Advisory Group. 2020. NERVTAG meeting on SARS-CoV-2 variant under investigation VUI-202012/01 – December 2020. https://www.nakedcapitalism.com/wp-content/uploads/2020/12/00-new-SARS-2.pdf [accessed 1 February 2021].
- Nicas M, Nazaroff WW, Hubbard A. 2005. Toward understanding the risk of secondary airborne infection: emission of respirable pathogens. J Occup Environ Hyg 2(3):143–154, PMID: 15764538, 10.1080/15459620590918466. [DOI] [PMC free article] [PubMed] [Google Scholar]
- Ong SWX, Tan YK, Chia PY, Lee TH, Ng OT, Wong MSY, et al. 2020. Air, surface environmental, and personal protective equipment contamination by severe acute respiratory syndrome coronavirus 2 (SARS-CoV-2) from a symptomatic patient. JAMA 323(16):1610–1612, PMID: 32129805, 10.1001/jama.2020.3227. [DOI] [PMC free article] [PubMed] [Google Scholar]
- Pan Y, Zhang D, Yang P, Poon LLM, Wang Q. 2020. Viral load of SARS-CoV-2 in clinical samples. Lancet Infect Dis 20(4):411–412, PMID: 32105638, 10.1016/S1473-3099(20)30113-4. [DOI] [PMC free article] [PubMed] [Google Scholar]
- Popa A, Genger J-W, Nicholson MD, Penz T, Schmid D, Aberle SW, et al. 2020. Genomic epidemiology of superspreading events in Austria reveals mutational dynamics and transmission properties of SARS-CoV-2. Sci Transl Med 12(573):eabe2555, PMID: 33229462, 10.1126/scitranslmed.abe2555. [DOI] [PMC free article] [PubMed] [Google Scholar]
- Richard M, Kok A, de Meulder D, Bestebroer TM, Lamers MM, Okba NMA, et al. 2020. SARS-CoV-2 is transmitted via contact and via the air between ferrets. Nat Commun 11(1):3496, PMID: 32641684, 10.1038/s41467-020-17367-2. [DOI] [PMC free article] [PubMed] [Google Scholar]
- Santarpia JL, Herrera VL, Rivera DN, Ratnesar-Shumate S, Reid SP, Denton PW, et al. 2020a. The infectious nature of patient-generated SARS-CoV-2 aerosol. medRxiv. Preprint posted online July 21, 2020. 10.1101/2020.07.13.20041632. [DOI] [Google Scholar]
- Santarpia JL, Rivera DN, Herrera VL, Morwitzer MJ, Creager HM, Santarpia GW, et al. 2020b. Aerosol and surface contamination of SARS-CoV-2 observed in quarantine and isolation care. Nature Scientific Reports 10:12732, 10.1038/s41598-020-69286-3. [DOI] [PMC free article] [PubMed] [Google Scholar]
- Schuit M, Ratnesar-Shumate S, Yolitz J, Williams G, Weaver W, Green B, et al. 2020. Airborne SARS-CoV-2 is rapidly inactivated by simulated sunlight. J Infect Dis 222(4):564–571, PMID: 32525979, 10.1093/infdis/jiaa334. [DOI] [PMC free article] [PubMed] [Google Scholar]
- Setti L, Passarini F, De GG, Barbieri P, Perrone MG, Borelli M, et al. 2020. Airborne transmission route of COVID-19: why 2 meters/6 feet of inter-personal distance could not be enough. Int J Environ Res Public Health 17(8):2932, PMID: 32340347, 10.3390/ijerph17082932. [DOI] [PMC free article] [PubMed] [Google Scholar]
- Stadnytskyi V, Bax CE, Bax A, Anfinrud P. 2020. The airborne lifetime of small speech droplets and their potential importance in SARS-CoV-2 transmission. Proc Natl Acad Sci USA: 117(22):11875–11877, PMID: 32404416, 10.1073/pnas.2006874117. [DOI] [PMC free article] [PubMed] [Google Scholar]
- Stein A, Louveau C, Lepidi H, Ricci F, Baylac P, Davoust B, et al. 2005. Q fever pneumonia: virulence of Coxiella burnetii pathovars in a murine model of aerosol infection. Infect Immun 73(4):2469–2477, PMID: 15784593, 10.1128/IAI.73.4.2469-2477.2005. [DOI] [PMC free article] [PubMed] [Google Scholar]
- Sungnak W, Huang N, Bécavin C, Berg M, Queen R, Litvinukova M, et al. 2020. SARS-CoV-2 entry factors are highly expressed in nasal epithelial cells together with innate immune genes. Nat Med 26(5):681–687, PMID: 32327758, 10.1038/s41591-020-0868-6. [DOI] [PMC free article] [PubMed] [Google Scholar]
- Tellier R, Li Y, Cowling BJ, Tang JW. 2019. Recognition of aerosol transmission of infectious agents: a commentary. BMC Infect Dis 19(1):101, PMID: 30704406, 10.1186/s12879-019-3707-y. [DOI] [PMC free article] [PubMed] [Google Scholar]
- van Doremalen N, Bushmaker T, Morris D, Holbrook M, Gamble A, Williamson B, et al. 2020. Aerosol and surface stability of SARS-CoV-2 as compared with SARS-CoV-1. N Engl J Med 382(16):1564–1567, PMID: 32182409, 10.1056/NEJMc2004973. [DOI] [PMC free article] [PubMed] [Google Scholar]
- van Kampen JJA, van de Vijver DAMC, Fraaij PLA, Haagmans BL, Lamers MM, Okba N, et al. 2020. Shedding of infectious virus in hospitalized patients with coronavirus disease-2019 (COVID-19): duration and key determinants. medRxiv. Preprint published July 9, 2020. 10.1101/2020.06.08.20125310. [DOI] [PMC free article] [PubMed]
- Wang J, Du G. 2020. COVID-19 may transmit through aerosol. Ir J Med Sci 189(4):1143–1144, PMID: 32212099, 10.1007/s11845-020-02218-2. [DOI] [PMC free article] [PubMed] [Google Scholar]
- Wang Z, Yang B, Li Q, Wen L, Zhang R. 2020. Clinical features of 69 cases with coronavirus disease 2019 in Wuhan, China. Clin Infect Dis 71(15):769–777, PMID: 32176772, 10.1093/cid/ciaa272. [DOI] [PMC free article] [PubMed] [Google Scholar]
- Weber TP, Stilianakis NI. 2008. Inactivation of influenza a viruses in the environment and modes of transmission: a critical review. J Infect 57(5):361–373, PMID: 18848358, 10.1016/j.jinf.2008.08.013. [DOI] [PMC free article] [PubMed] [Google Scholar]
- Wölfel R, Corman VM, Guggemos W, Seilmaier M, Zange S, Muller MA, et al. 2020. Virological assessment of hospitalized patients with COVID-2019. Nature 581(7809):465–469, PMID: 32235945, 10.1038/s41586-020-2196-x. [DOI] [PubMed] [Google Scholar]
- WHO (World Health Organization). 2014. Infection Prevention and Control of Epidemic- and Pandemic-Prone Acute Respiratory Infections in Health Care. Geneva, Switzerland: World Health Organization. [PubMed] [Google Scholar]
- WHO. 2020. Coronavirus disease (COVID-19): How is it transmitted? https://www.who.int/emergencies/diseases/novel-coronavirus-2019/question-and-answers-hub/q-a-detail/coronavirus-disease-covid-19-how-is-it-transmitted [accessed 7 January 2021].
- WHO. 2020. Modes of Transmission of Virus Causing COVID-19: Implications for IPC Precaution Recommendations, version 29, March 2020. Geneva, Switzerland: World Health Organization. [Google Scholar]
- Xu P, Qian H, Miao T, Yen H-L, Tan H, Cowling BJ, et al. 2020. Transmission routes of COVID-19 virus in the Diamond Princess cruise ship. medRxiv. Preprint posted online April 14, 2020. 10.1101/2020.04.09.20059113. [DOI]
- Yan J, Grantham M, Pantelic J, Bueno de Mesquita PJ, Albert B, Liu F, et al. 2018. Infectious virus in exhaled breath of symptomatic seasonal influenza cases from a college community. Proc Natl Acad Sci USA 115(5):1081–1086, PMID: 29348203, 10.1073/pnas.1716561115. [DOI] [PMC free article] [PubMed] [Google Scholar]
- Yao M, Zhang L, Ma J, Zhou L. 2020. On airborne transmission and control of SARS-CoV-2. Sci Total Environ 731:139178, PMID: 32388162, 10.1016/j.scitotenv.2020.139178. [DOI] [PMC free article] [PubMed] [Google Scholar]
- Yu ITS, Li Y, Wong TW, Tam W, Chan AT, Lee JHW, et al. 2004. Evidence of airborne transmission of the severe acute respiratory syndrome virus. N Engl J Med 350(17):1731–1739, PMID: 15102999, 10.1056/NEJMoa032867. [DOI] [PubMed] [Google Scholar]
- Zhang H, Li X, Ma R, Li X, Zhou Y, Dong H, et al. 2013. Airborne spread and infection of a novel swine-origin influenza a (H1N1) virus. Virol J 10:204, PMID: 23800032, 10.1186/1743-422X-10-204. [DOI] [PMC free article] [PubMed] [Google Scholar]
- Zou L, Ruan F, Huang M, Liang L, Huang H, Hong Z, et al. 2020. SARS-CoV-2 viral load in upper respiratory specimens of infected patients. N Engl J Med 382(12):1177–1179, PMID: 32074444, 10.1056/NEJMc2001737. [DOI] [PMC free article] [PubMed] [Google Scholar]
Associated Data
This section collects any data citations, data availability statements, or supplementary materials included in this article.