

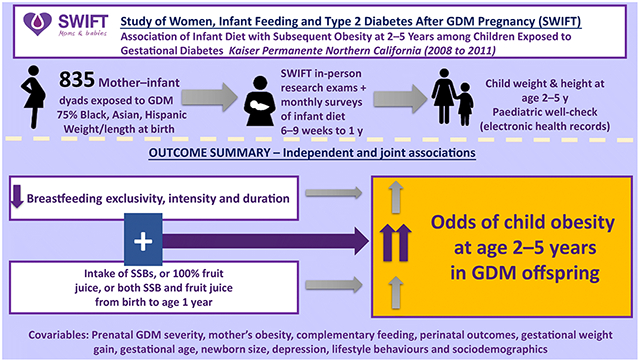
Abstract
Aims/hypotheses
This longitudinal analysis evaluated the independent and joint associations of any breastfeeding (BF) or exclusive BF (EBF) and intake of sugar-sweetened beverages (SSBs) and 100% fruit juice from birth to 1 year with subsequent overweight and obesity among young children exposed to gestational diabetes (GDM).
Methods
The analysis utilised prospectively collected data from participants enrolled in the Study of Women, Infant Feeding and Type 2 Diabetes after GDM (SWIFT); 1,035 pregnant women (20–45 years) diagnosed with GDM, of whom 75% were of Black, Hispanic or Asian race and ethnicity. Mother-infant dyad characteristics and infant dietary intake were assessed via research protocols at in-person examinations, telephone interviews and monthly mailed surveys from birth to 1 year. Child weight, length and height were obtained from electronic health records at birth (2008-2011) and ages 2–5 years (2010-2016) to classify BMI percentile groups (n=835).
Results
Adequate BF (≥6 months), adequate EBF duration (≥6 months), and SSB and 100% fruit juice intake in the first year were independently associated with child obesity at ages 2–5 years (all p<0.05). Compared with children with adequate EBF and no intake of SSB or 100% fruit juice, those with adequate EBF and intake of 100% fruit juice and/or SSBs had a four- to fivefold higher odds of obesity (aOR 4.2, 95% CI: 1.6, 11.2 for 100% fruit juice; aOR 4.5, 95% CI: 1.4, 8.5 for fruit juice or SSBs; and aOR 4.7, 95% CI:1.4, 15 for SSBs; all p<0.01), while those with inadequate EBF (<6 months) and intake of 100% fruit juice and/or SSBs had a six- to 12-fold higher odds of obesity (aOR 6.4, 95% CI:2.4, 17.2 for fruit juice; aOR 6.6, 95% CI:2.7, 14.8 for fruit juice or SSBs; and aOR 12.2, 95% CI:4.3, 25 for SSBs; all p<0.001). Compared with children with adequate BF and no intake of SSB or 100% fruit juice, those with adequate BF and intake of 100% fruit juice and/or SSBs had a threefold higher odds of obesity (aOR 3.1, 95% CI:1.1, 7.3 for fruit juice; aOR 3.3, 95% CI:1.3, 8.3 for fruit juice or SSBs; and aOR 3.4, 95% CI:1.3, 8.5 for SSBs; all p<0.05), while those with inadequate BF (<6 months) and intake of 100% fruit juice and/or SSB were associated with five- to tenfold higher odds of obesity (aOR 4.8, 95% CI:2.3, 12.2 for fruit juice; aOR 6.0, 95% CI:2.5, 12.8 for fruit juice or SSBs; aOR 9.5, 95% CI:3.7, 15.1 for SSBs; all p<0.05).
Conclusions/interpretation
This is the first study to prospectively evaluate the relation of BF or EBF duration and intake of SSB and 100% fruit juice during the first year of life with subsequent obesity in children exposed to GDM. Adequate BF or EBF combined with avoidance of SSB and 100% fruit juice during early infancy may ameliorate future child obesity in this high-risk population.
Keywords: 100% fruit juice, BMI, Childhood obesity, Exclusive breastfeeding, Gestational diabetes mellitus, Infant diet, Sugar-sweetened beverages
Graphical Abstract
Introduction
Intrauterine exposure to maternal glucose intolerance, known as gestational diabetes mellitus (GDM), is one of the most common metabolic complications of pregnancy, affecting 2–10% of all pregnant women annually in the USA [1] and up to 28% worldwide depending on population characteristics [2]. GDM increases the risk of many adverse maternal and perinatal health outcomes. Children exposed to GDM are at higher risk of macrosomia and being born large for gestational age (LGA), and have an increased lifelong risk of obesity[3]. In 2015–2016, the prevalence of overweight and obesity among U.S. children and adolescents (aged 2–19 years) were 16.6% and 18.5%, respectively; while obesity prevalence was about 14% among children aged 2–5 years [4, 5]. GDM and early life dietary behaviours such as limited breastfeeding (BF), limited exclusive BF (EBF) and other postnatal dietary habits may influence weight gain, obesity and metabolic disease among young children and adolescents [6–11]. Prospective studies of GDM infants show conflicting findings for BF measures and infant linear ponderal growth. In South Asian infants exposed to GDM, BF duration was associated with accelerated growth compared with formula fed infants, but perinatal outcomes including prematurity were not evaluated in this study [12]. In contrast, our analysis of 464 mother-infant dyads exposed to GDM showed that higher intensity and duration of BF were inversely associated with infant ponderal growth, weight gain, and change in weight-for-length z scores using repeated measurements from birth and through the first year [7]. This analysis accounted for maternal pre-pregnancy BMI, gestational weight gain, sociodemographics, GDM severity, newborn outcomes including gestational age, infant sleep and complementary feeding.
Early introduction to complementary foods, SSBs and unsweetened fruit juice have been directly associated with obesity in young children [8, 13–15]. The American Academy of Pediatrics (AAP) recommends that breast milk be the sole source of nutrients during the infant’s first 6 months of life and that solid foods or liquids be introduced around six months of age [16]. The AAP also recommends avoiding fruit juice and SSBs during the infant’s first year because they have a high sugar content, lower nutrient content, and links with obesity [17]. Studies of GDM-exposed children were unable to evaluate infant dietary intake, except for breast and formula feeding (FF). This is because most of them had retrospective designs that looked at older children and asked mothers to recall BF duration and whether BF was mixed with formula [10, 18–21]; one prospective study has been conducted, but it had a small sample size (n<58) [22]. Other studies have evaluated cross-sectional associations between concurrent intake of SSBs or fruit juice with child obesity (ages 5–16 years) and GDM exposure [8, 13–15, 23, 24]. In contrast, the Study of Women, Infant Feeding and Type 2 Diabetes after GDM Pregnancy (SWIFT) enrolled 1,035 mother–infant dyads in which the mother had GDM, and prospectively assessed both BF intensity and duration and infant dietary intake (e.g., SSBs, fruit juice, artificial formula, other) every month from birth to 1 year of age [25].
In this study, we evaluated the independent and joint associations between BF measures and infant dietary intake and child BMI percentile categories at 2–5 years of age among GDM-exposed children. We hypothesised that higher BF intensity and longer BF duration, and avoidance of SSBs and 100% fruit juice intake during the first year of life are associated with lower risk of overweight or obesity at 2–5 years of age among children exposed to GDM, after accounting for the intrauterine milieu (maternal BMI, glucose intolerance, GDM treatment, and gestational weight gain), sociodemographics and other factors known to affect child obesity.
Methods
Study sample: mother–infant dyads
This analysis utilises data from the SWIFT study, which is a prospective, longitudinal study of 1,035 women with recent GDM enrolled into in-person research examinations from September 2008 to December 2011. The study eligibility criteria were as follows: (1) Kaiser Permanente Northern California (KPNC) member delivered at a Kaiser Permanente hospital (2008–2011), (2) maternal age 20–45 years at delivery, (3) diagnosed with GDM according to the 3 h 100 g OGTT per Carpenter and Coustan criteria [26], (4) delivery of a singleton, live birth at ≥35 weeks gestation, (5) no history of overt diabetes or other serious medical conditions, (6) electronic health record (EHR) data for the GDM pregnancy, (7) not planning to become pregnant again or move out of the area in the next 2 years, (8) not taking any medications that affect blood glucose tolerance, (9) able to speak English or Spanish, and (10) exclusive or mostly BF, or exclusive or mostly FF and the intention to continue for ≥4 months as detailed in the SWIFT study design [25, 27].
Briefly, the study contacted women with GDM during late pregnancy and again at 4 weeks postpartum to evaluate BF intention and study eligibility. The SWIFT study enrolled 1035 women within a single integrated healthcare system who provided written informed consent for three in-person research visits starting from six to nine weeks postpartum (study baseline) and annually thereafter for two years. In this analysis, 835 of 1031 SWIFT mother-infant dyads exposed to GDM and continued in study follow-up had complete information on BF and infant dietary intake variables (from birth to 1 year), sociodemographics, prenatal and newborn clinical outcomes, child weight and height measurements at 2–5 years of age, and mothers did not have overt diabetes at study baseline. Those excluded from the analytic sample (n=196) had lower attained education, worse maternal glucose intolerance and shorter BF duration than women included (electronic supplementary material (ESM) Table 1).
Data collection
At each SWIFT study in-person research visit for women (6–9 weeks postpartum, 1 year and 2 year post-baseline), trained research staff conducted a 2 h 75g OGTT (glucose and insulin) and obtained measurements of maternal anthropometry (weight, height, waist circumference), and administered interviewer- and self-administered surveys to assess reproductive and health history, infant feeding/diet, child health, sociodemographic factors (race/ethnicity, education, income), depression and maternal lifestyle behaviours (diet, physical activity, sleep). Participants also completed monthly mailed surveys from delivery to one year later to report BF intensity and duration, health status, and detailed infant dietary intake [25].
This study also obtained clinical data from the Kaiser Permanente EHR to determine study eligibility and account for prenatal exposure to maternal hyperglycaemia, including GDM diagnosis and treatment (i.e., prenatal 3 h l00g OGTT, gestational age at GDM diagnosis, and GDM treatment with diet, oral medication, and/or insulin therapy), maternal height, pre-pregnancy weight and last weight measured before delivery (gestational weight gain). Data on newborn outcomes (i.e., infant sex, gestational age, birthweight, weight and length for size-at-birth percentiles) and child weight and height measurement between the ages of 2 and 5 years were obtained from the EHR. The SWIFT Study protocols were approved by the Kaiser Permanente Northern California institutional review board and were carried out in accordance with the Declaration of Helsinki as revised in 2008.
Infant feeding and dietary intake measures
Telephone interviews were conducted during late pregnancy to assess BF intention and again at 4–6 weeks post-delivery to assess BF intensity and intention to assess eligibility for enrolment. Women completed detailed infant feeding surveys at in-person research visits up to 2 years, a telephone interview at 6 months, and monthly mailed surveys from birth to 12 months. Women reported the average frequency of BF and FF within the past seven days for each month, including total number of all feedings, BF and daily amounts of formula fed, as well as the date of introduction of solids, fruit juice, sweetened beverages, water, sugar water, and other beverages, including types and amounts of each item. BF duration (total months of any BF) was evaluated as a continuous variable, and dichotomised as adequate BF (≥6 months) or inadequate BF (none or <6 months). EBF duration was dichotomised as adequate EBF (≥6 months) or inadequate EBF (none or <6 months). The SWIFT study utilised the method of Piper et al [28] to quantitatively assess BF intensity and duration [7]. This method calculates a BF intensity score for each month by dividing the number of breast milk feeds by the total number of feeds (FF, BF, other liquids) in 24 h (on average during the past seven days). The monthly score ranges from 0 for exclusive FF to 1 for EBF. The 12 month BF intensity/duration score is the sum of the 12 intensity ratios from birth to 12 months (range of scores: 0 to 12), as a single continuous measure across time.
The infant diet variables were assessed from birth to 12 months, including age at initiation of first complementary foods, intake of fruit juice (100% fruit juice or juice with added sugar), liquids with added sugar, and SSBs. Intake of beverages other than milk feeds during the first year of life were categorised as: (1) consuming SSBs (including any sugary drinks, Pedialyte, water or juices with added sugar), (2) 100% fruit juice intake (unsweetened/with no added sugar), or 3) no SSB/no 100% fruit juice from birth to 1year of age. Other food items were assessed and included in the complementary food intake variable categorised by age of initiation.
Clinical anthropometric measurements from the EHR at birth and 2–5 years
Clinical measurements of neonatal weight and length in the supine position were obtained from the EHR to calculate birthweight percentiles based on the KPNC population [29, 30]. We also obtained child weight and height from the EHR clinical paediatric well check visits (measured height in a standing position without shoes and heels against a wall using a stadiometer, and measured weight using a calibrated digital scale) between 2 and 5 years of age [31, 32]. For this analysis, the weight and height measured at the oldest age between 2 and 5 years for each child was selected to calculate the standardised BMI percentiles for age and sex, and categorise each child as normal (BMI <85th percentile), overweight (BMI ≥85th to <95th percentile) or obese (BMI ≥95th percentile) based on the Centers for Disease Prevention and Control growth percentiles [33]. ESM Table 2 displays per cent of individuals among the BMI percentile categories by child age at last weight and height measurements.
Data analysis
Descriptive statistics (i.e., mean, SD, range, median and quartiles, histograms and Q-Q plots) assessed the variable distributions. Four separate linear and multinomial logistic regression models estimated adjusted OR (aOR) for the following BF measures: (1) the continuous BF duration, (2) any BF duration categories, (3) EBF duration categories, and (4) 12 month BF intensity/duration score, as well as SSB intake for child BMI percentile categories at ages 2–5 years. For the current analysis, a priori covariates were selected for their known influence on child obesity, including maternal education level (years of formal schooling), gestational weight gain, parity (primiparous vs multiparous), Special Supplemental Nutrition Program for Women, Infants and Children (WIC) participation, infant sex, size for gestational age, race/ethnicity, and child age at BMI measurement. Prenatal GDM severity was measured according to three variables: (1)3 h 100 g OGTT laboratory results calculated as the sum of four z scores for glucose, (2) GDM treatment type (diet only vs oral hypoglycaemic agents or insulin) and (3) gestational age at GDM diagnosis.
Finally, to evaluate the joint association between the infant dietary intake categories (SSB, and 100% fruit juice) and categorical BF variables, two separate multinomial regression models were constructed, each stratified by BF adequacy and EBF adequacy adjusted for the above covariates. All analyses were performed with SAS version 9.4 (SAS, North Carolina, USA). Significance was denoted atp<0.05.
Results
Descriptive statistics and correlates
Of 835 mother–infant dyads, BMI percentiles were obtained for 90% of children using weight and height measured at 3 years or older, with a mean±SD age at the last BMI percentile of 40.5±6.3 months. Regarding race/ethnicity, 37% of children were Non-Hispanic Asian, 23% were Non-Hispanic White, 8% were Black, and 30% were of Hispanic origin. Maternal age, GDM treatment type, gestational weight gain, and parity did not differ among child BMI categories (Table 1). Child obesity was associated with higher maternal pre-pregnancy BMI and prenatal 3 h 100 g OGTT z score sum, lower education, earlier gestational age at GDM diagnosis, and WIC participation (Table 1).
Table 1.
Maternal characteristics among BMI percentile categories for young children aged 2 to 5 years exposed to GDM
| Characteristicsa | Child BMI percentile categories at ages 2 to 5 yearsb |
||||
|---|---|---|---|---|---|
| All n=835 |
Normal n=643 |
Overweight n=106 |
Obesity n=86 |
p-valuec | |
| Maternal age (years) | 33.4±4.8 | 33.5±4.8 | 33.1±4.5 | 32.7±5.5 | 0.29 |
| Education (years) | 14.9±2.9 | 15.1±2.9 | 14.6±2.6 | 13.6±2.7 | <0.001 |
| Race/ethnicity, n (%) | |||||
| Non-Hispanic White | 195 (23) | 149 (23) | 29 (27) | 17 (20) | <0.01 |
| Non-Hispanic Black | 67 (8) | 46 (7) | 8 (8) | 13 (15) | |
| Non-Hispanic Asian | 311 (37) | 262 (41) | 28 (26) | 21 (24) | |
| Hispanic | 246 (30) | 172 (27) | 39 (37) | 35 (41) | |
| Mixed race/other | 16 (2) | 14 (2) | 2 (2) | 0 (0) | |
| WIC recipient, n (%) | 211 (25) | 142 (22) | 29 (27) | 40 (47) | <0.001 |
| Pre-pregnancy BMI, (kg/m2) | 29.5±7.3 | 28.5±6.8 | 31.7±8.3 | 33.6±7.1 | <0.001 |
| Prenatal 3 h 100 g OGTTd z score sum | 0±2.7 | −0.1±2.5 | −0.3±2.4 | 0.9±3.6 | <0.01 |
| GDM treatment type, n (%) | |||||
| Diet only | 587 (70) | 457 (71) | 74 (70) | 56 (65) | 0.45 |
| Oral hypoglycaemic agents | 223 (27) | 165 (26) | 29 (27) | 29 (34) | |
| Insulin | 25 (3) | 21 (3) | 3 (3) | 1 (1) | |
| Gestational age at GDMe(weeks) | 28 (25,29) | 28 (26,29) | 27 (25,29) | 27 (13,29) | <0.01 |
| Gestational weight gain (kg) | 10.5±6.8 | 10.6±6.3 | 10.2±9.1 | 9.9±7.7 | 0.65 |
| Parity birth order, n (%) | |||||
| Primiparous | 319 (38) | 238 (37) | 48 (45) | 33 (38) | 0.08 |
| Multiparous | 516 (62) | 405 (63) | 58 (55) | 53 (62) | |
Values are mean±SD unless otherwise stated
Normal: BMI-for-age <85th percentile. Overweight: BMI-for-age 85th to <95th percentile. Obesity: BMI-for-age ≥95th percentile
p values <0.05 are significant; t tests and χ2 tests were run to assess difference in means or % between BMI percentile groups
Prenatal 3 h 100g OGTT sum of four z scores (z score for the glucose value at each time point; GDM severity)
Gestational age at GDM diagnosis [median (Q1, Q3)]
Birth outcomes, infant diet and other mother-infant dyad characteristics among the child BMI percentile categories at age 2–5 years are shown in Table 2. Thirteen percent (n=106) of children were classified with overweight, and 11% (n=86) with obesity. Child age at BMI, sex or age of initiation of complementary foods were not associated with BMI percentile categories. Children with obesity were more likely to have been LGA than those with overweight and normal weight. Compared with normal weight children, those with overweight and obesity had significantly higher mean birthweight and birth length. All 835 children were exposed to GDM but only 20% (n=163) were exclusively breastfed for 6 months (adequate EBF). Fifty-one percent (n=424) consumed 100% juice before 1 year of age, and 16% (n=l31) consumed SSB before 1 year of age. Compared with children with normal weight and overweight, children with obesity had less favourable infant diet intake including shorter mean BF duration (9.4 and 8.5 vs 6.4 months; p<0.001), lower proportions having adequate BF duration (BF≥6 months; 62% and 59% vs 42%; p<0.01) or adequate EBF (21% and 19% vs 12%; p<0.01), and were more likely to have consumed 100% fruit juice (57%) and SSBs (26%) during the first year of life (p<0.01). Early introduction to complementary food (≤4 and ≤6 months of age) was not associated with child overweight or obesity at 2–5 years of age.
Table 2.
Characteristics at birth and infant feeding during the first year of life associated with overweight and obesity categories among children aged 2 to 5 years exposed to GDM
| Characteristicsa | Child BMI categories at ages 2 to 5 yearsb |
||||
|---|---|---|---|---|---|
| All n=835 |
Normal n=643 |
Overweight n=106 |
Obesity n=86 |
p valuec | |
| Male sex, n (%) | 433 (52) | 331 (51) | 52 (49) | 50 (58) | 0.42 |
| Birthweight (g) | 3397±499 | 3341±484 | 3531±506 | 3621±478 | <0.001 |
| Birth length (cm) | 50.5±2.4 | 50.4±2.5 | 50.8±2.3 | 50.9±2.3 | 0.01 |
| Gestational age (weeks) | 39±1.2 | 39±1.2 | 39.2±1 | 39.1±1.2 | 0.21 |
| Size-at-birth percentile | |||||
| LGA | 176 (21) | 113 (18) | 27 (25) | 36 (42) | <0.001 |
| AGA | 641 (77) | 513 (80) | 78 (74) | 50 (56) | |
| SGA | 18 (2) | 17 (3) | 1 (1) | 0 (0) | |
| Child age at follow-up BMI (months) | 40.5±6.2 | 40.5±6.2 | 40.5±6.1 | 40.9±6.4 | 0.56 |
| Infant dietary intake | |||||
| Total BF (any) duration (months) | 9±7.2 | 9.4±7.3 | 8.5±7.4 | 6.4±6.2 | <0.001 |
| BF duration categories | |||||
| Inadequate BF (<6 months) | 335 (40) | 242 (38) | 43 (41) | 50 (58) | <0.01 |
| Adequate BF (≥6 months) | 500 (60) | 401 (62) | 63 (59) | 36 (42) | |
| EBF duration categories | |||||
| Inadequate EBF (<6 months) | 672 (80) | 510 (79) | 86 (81) | 76 (88) | <0.01 |
| Adequate EBF (≥6 months) | 163 (20) | 133 (21) | 20 (19) | 10 (12) | |
| BF intensity groups at age 6–9 weeks | |||||
| Exclusively BF | 183 (22) | 149 (23) | 25 (23) | 9 (11) | 0.04 |
| Mostly BF | 342 (41) | 269 (42) | 41 (39) | 32 (36) | |
| Mixed/inconsistent FF | 176 (21) | 129 (20) | 22 (21) | 25 (27) | |
| Exclusively or mostly FF | 134 (16) | 96 (15) | 18 (17) | 20 (26) | |
| BF intensity and duration categoriesd | |||||
| 12 month score <6 | 440 (53) | 317 (49) | 62 (58) | 61 (71) | <0.001 |
| 12 month score ≥6 | 395 (47) | 326 (51) | 44 (42) | 25 (29) | |
| Beverage intake from birth to 1 year | |||||
| No SSB/no 100% fruit juice | 280 (33) | 232 (36) | 33 (31) | 15 (17) | <0.01 |
| 100% fruit juice | 424 (51) | 319 (50) | 56 (53) | 49 (57) | |
| SSB | 131 (16) | 92 (14) | 17 (16) | 22 (26) | |
| Complementary feeding age of initiation categories | |||||
| ≤4 months (early) | 136 (26) | 100 (16) | 17 (16) | 19 (22) | 0.37 |
| >4 months (later) | 699 (84) | 543 (84) | 89 (84) | 67 (78) | |
| ≤6 months (early) | 647 (77) | 495 (77) | 82 (77) | 70 (73) | 0.57 |
| >6 months (later) | 188 (23) | 148 (23) | 24 (23) | 16 (27) | |
Values are mean±SD unless otherwise stated
Normal: BMI-for-age <85th percentile. Overweight: BMI-for-age 85th to <95th percentile. Obesity: BMI-for-age ≥95th percentile
p values <0.05 are significant; t tests and χ2 tests were run to assess difference in means or % between BMI percentile groups
overall score sum of 12 monthly ratios (birth to 12 months of age; range 0–12)
Multinomial logistic and linear regression analyses
Compared with adequately breastfed infants (any BF or EBF for ≥6 months), infants who were inadequately breastfed were more likely to consume SSBs or 100% fruit juice in the first year of life (ESM Table 3). The multiple linear regression model showed an inverse association between months of any BF duration and BMI percentile adjusted for all covariates (B=−0.009, 95% CI:−0.02, −0.003, p=0.003). Results from multinomial logistic regression models adjusted for covariates are shown in Table 3. BF duration, EBF duration, and 12 month BF intensity/duration scores were each inversely associated with odds of child obesity at 2–5 years of age. Compared with children with adequate BF, inadequate BF was associated with a twofold higher odds of obesity. Similar strength of direct associations were found between inadequate EBF (<6 months), and 12 month BF intensity/duration score (<6 months) with odds of child obesity. However, there were no significant associations between BF, EBF, and BF intensity/duration score categories for child overweight compared with normal weight. Infant beverage intake was associated with child BMI percentile categories. Both SSBs and 100% juice intakes before age 1 year were each associated with higher odds of child obesity at 2–5 years independent of BF duration (SSB aOR 3.22, 95% CI: 1.55, 6.67, p<0.01, and 100% fruit juice, aOR 2.18, 95% CI 1.17, 4.06, p=0.01). However, these associations were null for the odds of overweight.
Table 3.
Logistic multinomial regression for infant feeding and covariables during the first year of life and the adjusted odds ratios with 95% CIs for overweight and obesity among children aged 2 to 5 years exposed to GDM
| Child BMI categories at ages 2 to 5 yearsa | |||||
|---|---|---|---|---|---|
| Variable | Overweight | Obesity | Overall | ||
| aORb (95% | p valuec | aORb (95% CI) | p valuec | p valuec | |
| Model 1: Any breastfeeding duration (BF) categories | 0.02 | ||||
| Adequate BF (≥6 months) | 1.00 | Referent | 1.00 | ----- | |
| Inadequate BF (<6 months) | 1.10 (0.72, 1.68) | 0.97 | 1.99 (1.23, 3.21) | 0.01 | |
| Model 2: Exclusive BF duration (EBF) categories | <0.01 | ||||
| Adequate EBF (≥6 months) | 1.00 | Referent | 1.00 | ----- | |
| Inadequate EBF (<6 months) | 1.04 (0.68, 1.59) | 0.86 | 2.11 (1.32, 3.35) | <0.01 | |
| Model 3: BF intensity/duration scored categories | |||||
| 12 month score ≥ 6 | 1.00 | Referent | 1.00 | ----- | <0.01 |
| 12 month score < 6 | 1.44 (0.95, 2.19) | 0.09 | 2.21 (1.33, 3.67) | <0.01 | |
| Covariates for model 1 (above)e | |||||
| Beverage feeding (intake from birth to 1 year) | 0.03 | ||||
| No SSB/no 100% fruit juice | 1.00 | Referent | 1.00 | ----- | |
| 100% fruit juice | 1.24 (0.78, 1.98) | 0.48 | 2.18 (1.17, 4.06) | 0.02 | |
| SSB | 1.31 (0.69, 2.50) | 0.67 | 3.22 (1.55, 6.67) | <0.01 | |
| Race/ethnicity, n (%) | 0.03 | ||||
| Non-Hispanic White | 1.00 | Referent | 1.00 | ----- | |
| Hispanic | 1.54 (1.03, 2.38) | 0.04 | 1.61 (1.05, 2.63) | 0.03 | |
| Prenatal 3 h 100 g OGTT sum of 4 z scores | 0.95 (0.87, 1.03) | 0.21 | 1.08 (1.00, 1.16) | 0.04 | 0.04 |
| Size-at-birth percentile categories | <0.001 | ||||
| AGA or SGA | 1.00 | Referent | 1.00 | ----- | |
| LGA | 1.33 (0.80, 2.18) | 0.26 | 2.68 (1.62, 4.41) | <0.001 | |
| Maternal gestational weight gain (kg) | 0.97 (0.96, 1.02) | 0.55 | 0.97 (0.94, 1.01) | 0.14 | 0.80 |
| Maternal pre-pregnancy BMI (kg/m2) | 1.06 (1.03, 1.09) | <0.001 | 1.07 (1.03, 1.10) | <0.0001 | <0.0001 |
| Gestational age at GDM diagnosis (weeks) | 1.01 (0.98-1.04) | 0.41 | 0.97 (0.94, 0.99) | 0.03 | 0.04 |
| Model 4: Any BF-beverage categories | 0.03 | ||||
| Adequate BF, no SSB/100% juice intake | 1.00 | Referent | 1.00 | ----- | |
| Adequate BF, and 100% fruit juice | 1.23 (0.73, 2.34) | 0.65 | 3.13 (1.11, 7.29) | 0.03 | |
| Adequate BF, and SSB or 100% fruit juice | 1.28 (0.71, 2.18) | 0.38 | 3.32 (1.29, 8.25) | <0.01 | |
| Adequate BF, and SSB | 1.31 (0.51, 2.94) | 0.65 | 3.35 (1.32, 8.50) | 0.01 | |
| Inadequate BF, no SSB/100% juice intake | 1.16 (0.53, 2.53) | 0.71 | 3.25 (1.29, 9.62) | 0.03 | |
| Inadequate BF, and 100% fruit juice | 1.31 (0.73, 2.35) | 0.36 | 4.78 (2.33, 12.19) | <0.01 | |
| Inadequate BF, and SSB or 100% fruit juice | 1.32 (0.64, 2.12) | 0.61 | 6.03 (2.45, 12.80) | <0.001 | |
| Inadequate BF, and SSB | 1.60 (0.68, 3.76) | 0.27 | 9.64 (3.70, 15.10) | <0.0001 | |
| Model 5: EBF-beverage categories | <0.01 | ||||
| Adequate EBF, no SSB/100% juice intake | 1.00 | Referent | 1.00 | ----- | |
| Adequate EBF, and 100% fruit juice | 1.28 (0.73, 2.27) | 0.39 | 4.17 (1.55, 11.17) | <0.01 | |
| Adequate EBF, and SSB or 100% fruit juice | 1.05 (0.55, 1.99) | 0.43 | 4.45 (1.40, 8.47) | <0.01 | |
| Adequate EBF, and SSB | 1.26 (0.73, 2.18) | 0.72 | 4.71 (1.43, 15.01) | <0.01 | |
| Inadequate EBF, no SSB/100% juice intake | 1.07 (0.48, 2.37) | 0.57 | 4.43 (1.43, 13.71) | <0.01 | |
| Inadequate EBF, and 100% fruit juice | 1.22 (0.65, 2.29) | 0.53 | 6.40 (2.38, 17.16) | <0.001 | |
| Inadequate EBF, and SSB or 100% fruit juice | 1.29 (0.72, 2.31) | 0.75 | 6.60 (2.71, 14.85) | <0.001 | |
| Inadequate EBF, and SSB | 1.50 (0.65, 3.48) | 0.34 | 12.28 (4.26, 25.40) | <0.0001 | |
Overweight: BMI-for-age 85th to <95th percentile; obesity: BMI-for-age >95th percentile
aOR values
p values <0.05 are significant
overall BF score sum of 12 monthly ratios (birth to 12 months of age; range 0–12)
Covariates are from the regression model with any BF variable
The following covariates were used in all five regression models: maternal education level race/ethnicity, gestational weight gain, prenatal 3 h 100 g OGTT sum of 4 z scores (z score for glucose values at each time point; GDM severity), GDM treatment type, gestational age at GDM diagnosis, WIC participation, parity, and infant sex, infant size for gestational age and sex at birth, and age at BMI measurement
In the models stratified by adequate BF and EBF categories and infant beverage categories, there were overall associations with the odds of child overweight and obesity in the adjusted model. Compared with children with adequate BF and no SSBs or 100% juice intake during infancy (referent), those with adequate BF and 100% fruit juice intake, SSB intake, or both combined from birth to 1 year of age had threefold higher odds of obesity (all p<0.05). Figure 1 displays the aOR of obesity by BF-beverage groups among the children (2–5 years), of whom all were exposed to GDM.
Fig. 1.
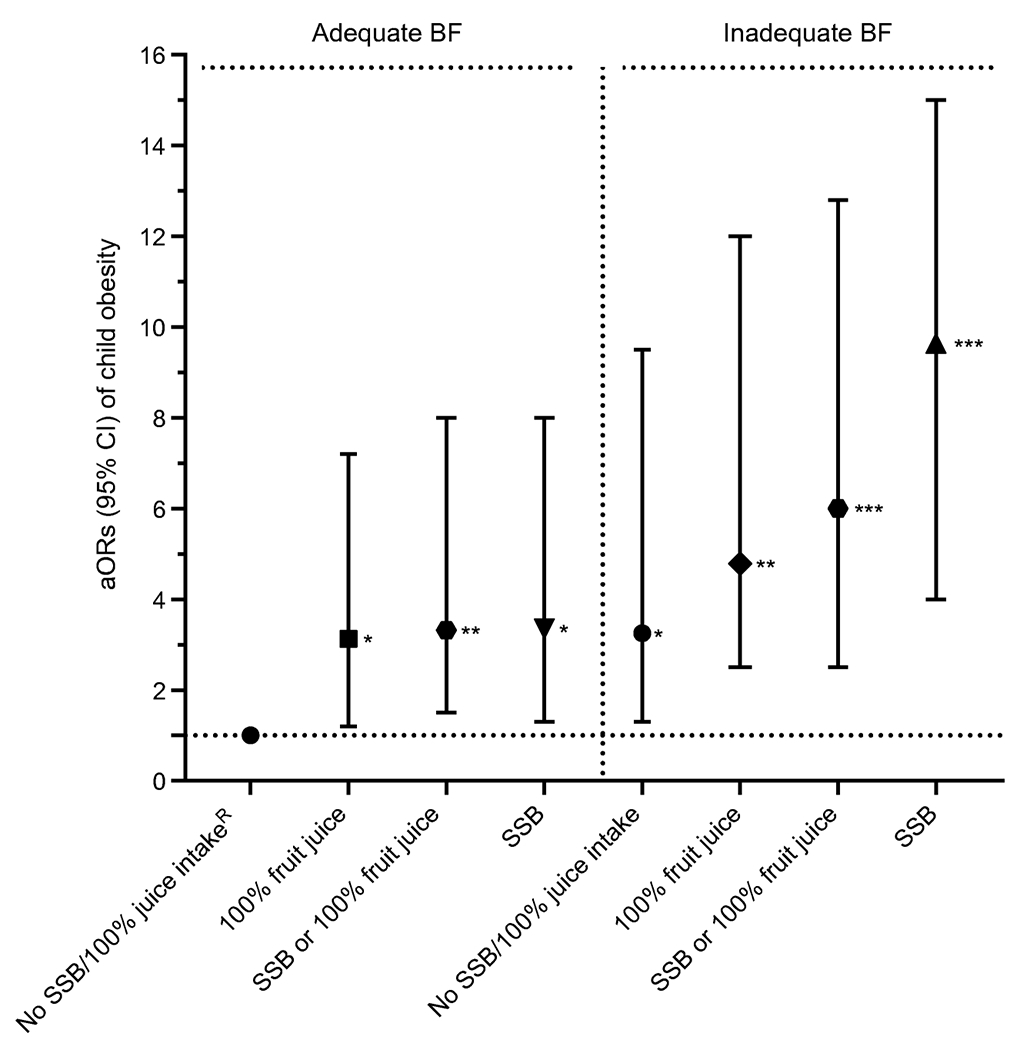
aORs (95% CIs) for obesity among children aged 2–5 years exposed to GDM associated with SSB intake and/or 100% fruit juice during infancy and stratified by BF duration. *p<0.05, **p<0.01, ***p<0.001: significantly higher odds compared with referent; RReferent: adequate BF, no SSBs, no 100% fruit juice; adequate BF: BF ≥6 months; inadequate BF: no BF or <6 months BF. Adjusted covariates: child sex, race/ethnicity, parity, WIC participation, maternal education level, prenatal 3 h OGTT sum of four z scores (GDM severity), GDM treatment type, gestational weight gain, gestational age at GDM diagnosis, and child age at BMI measurement
Similarly, compared with children with adequate EBF and no SSB or 100% fruit juice intake during the first year (referent), those with adequate EBF and 100% fruit juice, SSBs intake or both combined had 4.2- to 4.7-fold higher odds of obesity. Compared with the referent group, children with inadequate BF and no SSBs or 100% juice intake during the first year had threefold higher odds of obesity. Similarly, inadequate EBF and no SSBs or 100% juice intake during infancy was associated with a fourfold higher odds of obesity than the referent group. Compared with adequate BF and no SSBs/100% juice intake (referent), inadequate BF with SSBs, 100% fruit juice intake, or both combined were associated with a five- to tenfold higher odds of obesity. Compared with the EBF referent group, inadequate EBF with SSBs, 100% fruit juice intake, or both combined were associated with a six- to 12-fold higher odds of obesity. Figure 2 displays the aOR (95% CIs) of obesity by EBF-beverage groups among all children (aged 2–5 years) who were exposed to GDM.
Fig. 2.
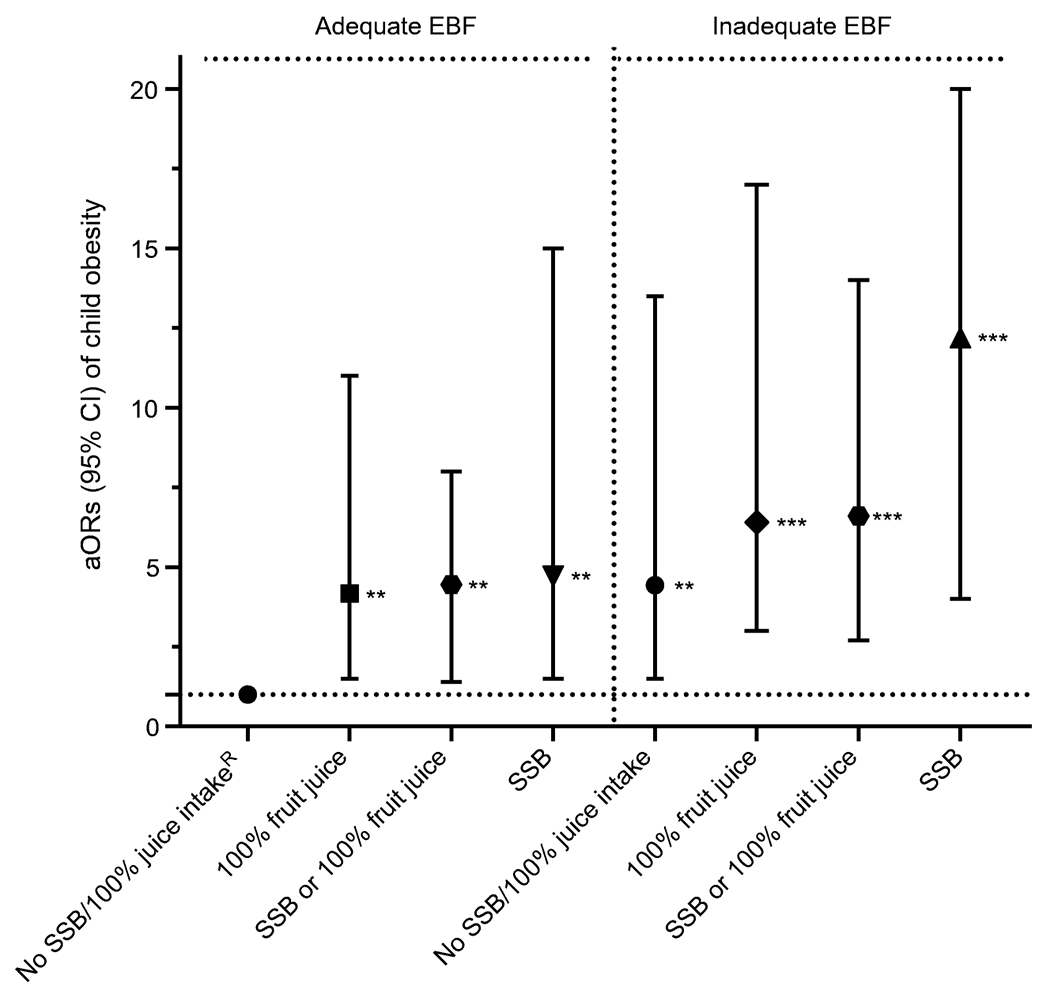
aORs (95% CIs) for obesity among children aged 2–5 years exposed to GDM associated with SSB and 100% fruit juice intake during infancy and stratified by EBF duration. **p<0.01, ***p<0.001: significantly higher odds compared with referent; RReferent: adequate EBF, no SSB, no 100% fruit juice; adequate EBF: exclusive BF ≥6 months; inadequate EBF: no EBF or <6 months EBF. Adjusted covariates: child sex, race/ethnicity, parity, WIC participation, maternal education level, prenatal 3 h OGTT sum of four z scores (GDM severity), GDM treatment type, gestational weight gain, gestational age at GDM diagnosis, and child age at BMI measurement
Discussion
This prospective longitudinal analysis showed independent and joint associations for lower BF intensity and shorter duration, and the initiation of SSBs and 100% fruit juice during the first year of life with subsequent obesity at 2–5years of age for children exposed to GDM. The odds of child obesity was strongest for the combination of any BF or EBF <6 months with intake of SSB or 100% fruit juice during the first year of life: a six- to 12-fold higher odds of obesity compared with ≥6 months of any BF or EBF and no intake of SSBs or 100% fruit juice. These findings remained after accounting for intrauterine risk factors for child obesity, including maternal hyperglycaemia, pre-pregnancy obesity, gestational weight gain and sociodemographic factors. To our knowledge, this is the first study to evaluate independent and joint associations for BF measures and infant dietary intake of added sugar or naturally sweetened beverages with subsequent child obesity among GDM offspring. Of note, the associations of infant diet of sweetened beverages during the first year of life with child obesity increased markedly for infants with inadequate vs adequate BF (five- to tenfold vs threefold higher odds). The associations persisted after accounting for in utero exposure to maternal obesity, and severity of maternal glucose intolerance among other factors.
Previous studies, primarily cross-sectional or retrospective designs, have shown inverse associations for EBF duration with BMI-for-age percentile, and/or excessive weight gain [9, 18, 19, 23] or higher prevalence of obesity with concurrent SSBs intake among elementary school-age children or pre-adolescents exposed to GDM [23]. However, these studies did not assess infant dietary intake, except for maternal recall of BF; in these studies, older children who were exposed to GDM were investigated and the severity of GDM was not assessed. A cross-sectional study of WIC participants found a higher odds of obesity at 1–5 years of age in children who were exclusively breastfed with concurrent SSB intake, regardless of GDM exposure [11]. However, this study did not assess GDM severity or infant diet during the first year of life. The findings are consistent with our previous analysis showing that higher BF intensity and longer duration were associated with slower longitudinal ponderal growth and lower attained weight-for-length from birth through one year of age, independent of prenatal exposure among 464 SWIFT mother–infant dyads enrolled in a substudy of infant growth that involved anthropometric measurements and validated assessment of other infant behaviours in the first year of life [7].
There is mounting evidence that intrauterine exposure to GDM may impact the fetal programming of obesity [34] and increase glucose-linked hypothalamic activation and therefore obesity risk in offspring [35]. Women with GDM are less likely to breastfeed exclusively in the first postpartum hour and are more likely to formula feed their children in the hospital than women without GDM are [36], although adverse clinical perinatal outcomes and maternal obesity may affect the early feeding practices. While evidence for causal associations between BF and lower child obesity risk in general is substantial, much less is known about the impact of BF intensity and infant dietary habits during the first year of life, specifically, the effect of SSB and fruit juice intake on the early growth and adiposity of young children exposed to GDM [7, 10, 11]. Investigation into human milk constituents such as human milk oligosaccharides, leptin, insulin and other hormones and nutrients in milk of mothers, particularly those with GDM, warrant further study for their putative effects on child obesity rates.
In this prospective study, EBF ≥6 months with added SSBs or 100% fruit juice increased the odds of obesity at 2–5 years by fourfold compared with no intake of SSBs or 100% fruit juice, with much stronger associations for any BF combined with beverage intakes. Evidence from prospective studies in the general population is conflicting in relation to 100% fruit juice intake during infancy and toddlerhood and future child obesity prevalence [37–39]. A meta-analysis of 100% fruit juice intake in young children has been associated with higher BMI z scores at 1–6 years of age [14], but other studies have shown no effect at older ages (1–18 years) [15]. Another meta-analysis of 4657 articles reported that eight prospective cohort studies with 34,470 children (aged 1–18 years) found direct associations between 100% fruit juice (177–236 ml/day) consumption and BMI z score controlling for total energy intake only for young children aged 1–6 years. Of note, no previous studies have assessed the intake of 100% fruit juice during the first year of life [14]. In contrast, a systematic review of studies published during 1995–2013 showed no significant associations between concurrent 100% fruit juice intake and weight or adiposity in children aged 2–5 years [15]. However, intake of SSBs or 100% fruit juice during the first year of life was not evaluated and findings were not presented for GDM-exposed children. While many studies have shown that SSB intake is directly associated with obesity in children [8, 40, 41], relatively few have looked at this association prospectively from infancy through to early childhood or pre-adolescence (6 and 8–14 years), and findings are mixed [42, 43]. Our findings from a large, well-characterised prospective cohort of mother-infant dyads exposed to GDM provide strong evidence that intake of SSBs or naturally sweetened fruit juice at <12 months of age markedly increases the risk of obesity in early childhood, and that this risk depends on the intensity and duration of BF. –
A considerable amount of calories (7.6% of total caloric intake) in the diet of U.S. toddlers comes from SSBs [44]. The mechanisms underlying the independent associations between BF and child obesity are hypothesised to involve satiety responsiveness and lower protein content of breastmilk [45]. How fruit juice and SSB intake during early infancy causes obesity is less clear. Sweet taste and maternal feeding practices related to nutritional habits and soothing children with foods and liquid feeding may be associated with higher daily SSB intake and consequent child obesity [45].
Strengths of this study include the prospective, quantitative research methods used to assess BF measures, and detailed recording of infant dietary intake via monthly mailed surveys, telephone and in-person interviews from birth to 12 months [28]. We also obtained clinical measures of weight before pregnancy or during early gestation to calculate pre-pregnancy BMI and gestational weight gain. Child height and weight measurements were obtained from KPNC paediatric well-child clinical visits using standardised procedures with calibrated equipment within a single integrated healthcare system. Another major strength is the well-characterised research cohort of mother–infant dyads; 95% of participants were retained at 1–2 years post-baseline, and 83% of children were still KPNC members at 2–5 years of age.
This study had some limitations. First, it was not possible to conduct direct observational or physiological measures of BF (i.e., weighing infants) in this large prospective cohort of women with recent GDM. Residual confounding associated with measurement error for beverage and dietary intake covariates is possible; assessing the clinical and sociodemographic characteristics would have reduced this possibility. Later physical activity measurements concurrent with child BMI were unavailable in the EHR. The racially and ethnically diverse SWIFT study of mothers with GDM are representative of women with GDM in the USA. However, Northern California women have higher BF initiation rates than other areas in the USA [46]. The monthly dietary intake assessments determined the age at which SSBs, fruit juice and food items were introduced, but not the specific quantities.
In summary, the combination of shortened BF or EBF and exposure to SSB and/or 100% fruit juice during the first year of life was associated with six- to 12-fold higher odds of obesity. This indicates that infant feeding exposures, including sugary beverages, may play a major role in countering fetal life programming, and that modification of early postnatal infant feeding habits may be beneficial in ameliorating the risks to the child from intrauterine exposure to maternal hyperglycaemia.
Our findings add to a growing body of evidence that none or inadequate BF combined with intake of SSBs and 100% fruit juice during the first year independently and synergistically contribute to future development of child obesity. These findings highlight the need for interventions targeting pregnant women with GDM to focus on promoting higher BF and EBF duration, particularly in mothers with obesity, and to avoid giving infants SSBs and 100% fruit juice during the first year of life. In conclusion, this study suggests that increasing BF duration and intensity and avoiding SSBs and 100% fruit juices could combat childhood obesity especially in children exposed to intrauterine GDM.
Supplementary Material
Rearch in context.
What is already known about this subject?
Gestational diabetes mellitus (GDM) increases obesity risk in offspring
Breastfeeding is a recommended infant feeding behaviour that is associated with decreased risk of obesity later in the child’s life
Much less is known about the impact of naturally sweetened fruit juice and sugary beverage intake during early infancy on the risk of obesity in children exposed to GDM
What is the key question?
Are there independent and joint associations between adequate ‘any’ breastfeeding (BF) or exclusive breastfeeding (EBF), intake of sugar-sweetened beverages and 100% fruit juice during the first year of life and subsequent overweight and obesity among children (aged 2–5 years) exposed to GDM?
What are the new findings?
Inadequate duration of BF and EBF (<6 months were each directly associated with child obesity in GDM-exposed children at 2–5 years of age
Sugar-sweetened beverage and fruit juice intake in the first year were each independently associated with a higher odds of child obesity in GDM-exposed children at 2–5 years of age
Inadequate EBF combined with intake of fruit juice or sugar-sweetened beverages before 1 year of age was associated with six- and 12-fold higher odds of obesity, respectively, in GDM-exposed children at 2–5 years of age. There were similar associations for adequate EBF and BF and inadequate BF, when combined with intake of fruit juice and sugar-sweetened beverages
How might this impact on clinical practice in the foreseeable future?
These results support the implementation of early life behavioural interventions to counter obesogenic feeding practices during infancy in populations at higher risk of obesity and diabetes
Acknowledgements
We would like to thank all the SWIFT participants for their contributions to this study. We would like to thank the KPNC, Division of Research SWIFT study team led by EPG for all of their hard work in conducting the in-person research visits and collecting data.
Funding The analyses were supported by grants from the National Institute of Diabetes, Digestive and Kidney Diseases, R01DK122700 (to EPG), R21 DK103171 (to EPG) and R01DK118409 (to EPG), the National Institute of Child health and Human Development, R01HD050625 (to EPG), and the ADA (Clinical Research Award, to EPG).
Abbreviations
- AAP
The American Academy of Pediatrics
- AGA
Appropriate for gestational age
- BF
Breastfeeding
- EBF
Exclusive breastfeeding
- EHR
Electronic health record
- FF
Formula feeding
- GDM
Gestational diabetes mellitus
- KPNC
Kaiser Permanente Northern California
- LGA
Large for gestational age
- SGA
Small for gestational age
- SSB
Sugar-sweetened beverage
- SWIFT
Study of Women, Infant Feeding and Type 2 Diabetes after GDM Pregnancy
- U.S.
United States
- WIC
Special Supplemental Nutrition Program for Women, Infants and Children
Footnotes
Publisher's Disclaimer: This Author Accepted Manuscript is a PDF file of a an unedited peer-reviewed manuscript that has been accepted for publication but has not been copyedited or corrected. The official version of record that is published in the journal is kept up to date and so may therefore differ from this version.
Data availability The KPNC data used for this study is owned by the Kaiser Foundation Health Plan, Kaiser Foundation Hospitals and The Permanente Medical Group; it is not owned by the Kaiser Foundation Research Institute. Because of their third party rights, it is not possible to make the data publicly available without restriction. In accordance with database of record, and KPNC’s mission to conduct research to serve the public good, we will establish collaborative agreements with other investigators who may wish to use data from this study for future secondary analyses addressing important research questions. Such collaborative relationships will take into account resource constraints, opportunity costs and the need to obtain Institutional Review Board approval.
Authors’ relationships and activities The authors declare that there are no relationships or activities that might bias, or be perceived to bias, their work.
References
- 1.American Diabetes Association (2019) 2. Classification and diagnosis of diabetes: Standards of medical care in diabetesd2019. Diabetes Care 42(January):S13–S28. 10.2337/dc19-S002 [DOI] [PubMed] [Google Scholar]
- 2.Jiwani A, Marseille E, Lohse N, Damm P, Hod M, Kahn JG (2012) Gestational diabetes mellitus: Results from a survey of country prevalence and practices. J Matern Neonatal Med 25(6):600–610. 10.3109/14767058.2011.587921 [DOI] [PubMed] [Google Scholar]
- 3.Dabelea D, Sauder KA (2018) Intrauterine exposure to maternal diabetes and childhood obesity. In: Freemark MS (ed) Pediatric Obesity. Contemporary Endocrinology. Humana Press, Cham, pp 229–242 [Google Scholar]
- 4.Fryar CD, Carroll MD, Ogden CL (2016) Prevalence of overweight and obesity among children and adolescents aged 2–19 years: United States, 1963–1965 through 2013–2014. NCHS Heal E-Stats 1–5 [Google Scholar]
- 5.Hales CM, Carroll MD, Fryar CD, Ogden CL (2017) Prevalence of obesity among adults and youth: United States, 2015–2016. NCHS Data Brief (288):1–8 [PubMed] [Google Scholar]
- 6.Faith MS, Hittner JB, Hurston SR, et al. (2019) Association of infant temperament with subsequent obesity in young children of mothers with gestational diabetes mellitus. JAMA Pediatr 173(5):424–433. 10.1001/jamapediatrics.2018.5199 [DOI] [PMC free article] [PubMed] [Google Scholar]
- 7.Gunderson EP, Greenspan LC, Faith MS, Hurston SR, Quesenberry CP (2018) Breastfeeding and growth during infancy among offspring of mothers with gestational diabetes mellitus: a prospective cohort study. Pediatr Obes 13(8):492–504. 10.1111/ijpo.12277 [DOI] [PMC free article] [PubMed] [Google Scholar]
- 8.Luger M, Lafontan M, Bes-Rastrollo M, Winzer E, Yumuk V, Farpour-Lambert N (2018) Sugar-sweetened beverages and weight gain in children and adults: A systematic review from 2013 to 2015 and a comparison with previous studies. Obes Facts 10(6):674–693. 10.1159/000484566 [DOI] [PMC free article] [PubMed] [Google Scholar]
- 9.Davis JN, Koleilat M, Shearrer GE, Whaley SE (2014) Association of infant feeding and dietary intake on obesity prevalence in low-income toddlers. Obesity 22(4): 1103–1111. 10.1002/oby.20644 [DOI] [PubMed] [Google Scholar]
- 10.Vandyousefi S, Goran MI, Gunderson EP, et al. (2019) Association of breastfeeding and gestational diabetes mellitus with the prevalence of prediabetes and the metabolic syndrome in offspring of Hispanic mothers. Pediatr Obes 14(7): 1–10. 10.1111/ijpo.12515 [DOI] [PMC free article] [PubMed] [Google Scholar]
- 11.Vandyousefi S, Whaley SE, Widen EM, et al. (2019) Association of breastfeeding and early exposure to sugar-sweetened beverages with obesity prevalence in offspring born to mothers with and without gestational diabetes mellitus. Pediatr Obes 14(12): 1070. 10.1111/ijpo.12569 [DOI] [PMC free article] [PubMed] [Google Scholar]
- 12.de Seymour J, Chia A, Colega M, et al. (2016) Maternal dietary patterns and gestational diabetes mellitus in a multi-ethnic Asian cohort: The GUSTO study. Nutrients 8(9). 10.3390/nu8090574 [DOI] [PMC free article] [PubMed] [Google Scholar]
- 13.Park S, Pan L, Sherry B, Li R (2014) The association of sugar-sweetened beverage intake during infancy with sugar-sweetened beverage intake at 6 years of age. Pediatrics 134:S56–S62. 10.1542/peds.2014-0646J [DOI] [PMC free article] [PubMed] [Google Scholar]
- 14.Auerbach BJ, Wolf FM, Hikida A, et al. (2017) Fruit juice and change in BMI: A meta-analysis. Pediatrics 139(4). 10.1542/peds.2016-2454 [DOI] [PMC free article] [PubMed] [Google Scholar]
- 15.Crowe-White K, O’Neil CE, Parrott JS, et al. (2016) Impact of 100% fruit juice consumption on diet and weight status of children: An evidence-based review. Crit Rev Food Sci Nutr 56(5):871–884. 10.1080/10408398.2015.1061475 [DOI] [PubMed] [Google Scholar]
- 16.American Pediatric Academy (2020) Infant Food and Feeding. https://www.aap.org/en-us/advocacy-and-policy/aap-health-initiatives/HALF-Implementation-Guide/Age-Specific-Content/Pages/Infant-Food-and-Feeding.aspx. Accessed 27 Nov 2020
- 17.Kleinman RE (2000) American academy of pediatrics recommendations for complementary feeding. Pediatrics 106(5 II): 1274. [PubMed] [Google Scholar]
- 18.Shearrer GE, Whaley SE, Miller SJ, House BT, Held T, Davis JN (2015) Association of gestational diabetes and breastfeeding on obesity prevalence in predominately Hispanic low-income youth. Pediatr Obes 10(3): 165–171. 10.1111/ijpo.247 [DOI] [PubMed] [Google Scholar]
- 19.Bider-Canfield Z, Martinez MP, Wang X, et al. (2017) Maternal obesity, gestational diabetes, breastfeeding and childhood overweight at age 2 years. Pediatr Obes 12(2): 171–178. 10.1111/ijpo.12125 [DOI] [PubMed] [Google Scholar]
- 20.Crume TL, Ogden L, Maligie M, et al. (2011) Long-term impact of neonatal breastfeeding on childhood adiposity and fat distribution among children exposed to diabetes in utero. Diabetes Care 34(3):641–645. 10.2337/dc10-1716 [DOI] [PMC free article] [PubMed] [Google Scholar]
- 21.Kawasaki M, Arata N, Ogawa Y (2018) Obesity and abnormal glucose tolerance in the offspring of mothers with diabetes. Curr Opin Obstet Gynecol 30(6):361–368. 10.1097/GCO.0000000000000479 [DOI] [PubMed] [Google Scholar]
- 22.Taveras EM, Gillman MW, Kleinman KP, Rich-Edwards JW, Rifas-Shiman SL (2013) Reducing racial/ethnic disparities in childhood obesity the role of early life risk factors. JAMA Pediatr 167(8):731–738. 10.1001/jamapediatrics.2013.85 [DOI] [PMC free article] [PubMed] [Google Scholar]
- 23.Sauder KA, Bekelman TA, Harrall KK, Glueck DH, Dabelea D (2019) Gestational diabetes exposure and adiposity outcomes in childhood and adolescence: An analysis of effect modification by breastfeeding, diet quality, and physical activity in the EPOCH study. Pediatr Obes 14(12): 1–9. 10.1111/ijpo.12562 [DOI] [PMC free article] [PubMed] [Google Scholar]
- 24.Lim S, Zoellner JM, Lee JM, et al. (2009) Obesity and sugar-sweetened beverages in african-american preschool children: A Longitudinal study. Obesity 17(6): 1262–1268. 10.1038/oby.2008.656 [DOI] [PubMed] [Google Scholar]
- 25.Gunderson EP, Matias SL, Hurston SR, et al. (2011) Study of Women, Infant Feeding, and Type 2 Diabetes mellitus after GDM pregnancy (SWIFT), a prospective cohort study: Methodology and design. BMC Public Health 11:1–15. 10.1186/1471-2458-11-952 [DOI] [PMC free article] [PubMed] [Google Scholar]
- 26.Carpenter MW, Coustan DR (1982) Criteria for screening tests for gestational diabetes. Am J Obstet Gynecol 144(7):768–773. 10.1016/0002-9378(82)90349-0 [DOI] [PubMed] [Google Scholar]
- 27.Gunderson EP, Hurston SR, Dewey KG, et al. (2015) The study of women, infant feeding and type 2 diabetes after GDM pregnancy and growth of their offspring (SWIFT Offspring study): Prospective design, methodology and baseline characteristics. BMC Pregnancy Childbirth 15(1): 1–15. 10.1186/s12884-015-0587-z [DOI] [PMC free article] [PubMed] [Google Scholar]
- 28.Piper S, Parks PL (2001) Use of an intensity ratio to describe breastfeeding exclusivity in a national sample. J Hum Lact 17(3):227–232. 10.1177/089033440101700306 [DOI] [PubMed] [Google Scholar]
- 29.Permanente Kaiser (2019) Children’s Growth Chart. https://healthy.kaiserpermanente.org/health-wellness/health-encyclopedia/he.children%27s-growth-chart.hw250189. Accessed 30 Jun 2020
- 30.WHO Multicentre Growth Reference Study Group (2006) WHO child growth standards based on length/height, weight and age. Acta Paediatr Int J Paediatr 95(SUPPL. 450):76–85. 10.1080/08035320500495548 [DOI] [PubMed] [Google Scholar]
- 31.WHO Multicentre Growth Reference Study Group. (1999) The WHO Multicentre Growth Reference Study (MGRS). https://www.who.int/childgrowth/mgrs/en/. Accessed 30 Jun 2020
- 32.World Health Organization (2016) The WHO Child Growth Standards. http://www.who.int/childgrowth/standards/en/. Accessed 30 Jun 2020
- 33.Center for Disease Control and Prevention (2010) Morbidity and mortality weekly report use of World Health Organization and CDC growth charts for children aged 0–59 months in the United States department of health and human services. http://www.cdc.gov/mmwr/preview/mmwrhtml/rr5909a1.htm [PubMed]
- 34.Di Bernardo S, Mivelaz Y, Epure AM, et al. (2017) Assessing the consequences of gestational diabetes mellitus on offspring’s cardiovascular health: MySweetHeart Cohort study protocol, Switzerland. BMJ Open 7(11). 10.1136/bmjopen-2017-016972 [DOI] [PMC free article] [PubMed] [Google Scholar]
- 35.Page KA, Luo S, Wang X, et al. (2019) Children exposed to maternal obesity or gestational diabetes mellitus during early fetal development have hypothalamic alterations that predict future weight gain. Diabetes Care 42(8): 1473–1480. 10.2337/dc18-2581 [DOI] [PMC free article] [PubMed] [Google Scholar]
- 36.Oza-Frank R, Chertok I, Bartley A (2015) Differences in breast-feeding initiation and continuation by maternal diabetes status. Public Health Nutr 18(4):727–735. 10.1017/S1368980014000792 [DOI] [PMC free article] [PubMed] [Google Scholar]
- 37.Sonneville KR, Long MW, Rifas-Shiman SL, Kleinman K, Gillman MW, Taveras EM (2015) Juice and water intake in infancy and later beverage intake and adiposity: Could juice be a gateway drink? Obesity 23(1): 170–176. 10.1002/oby.20927 [DOI] [PMC free article] [PubMed] [Google Scholar]
- 38.Newby PK, Peterson KE, Berkey CS, Leppert J, Willett WC, Colditz GA (2004) Beverage consumption is not associated with changes in weight and body mass index among low-income preschool children in North Dakota. J Am Diet Assoc 104(7): 1086–1094. 10.1016/jjada.2004.04.020 [DOI] [PubMed] [Google Scholar]
- 39.Faith MS, Dennison BA, Edmunds LS, Stratton HH (2006) Fruit juice intake predicts increased adiposity gain in children from low-income families: Weight status-by-environment interaction. Pediatrics 118(5):2066–2075. 10.1542/peds.2006-1117 [DOI] [PubMed] [Google Scholar]
- 40.Olsen NJ, Heitmann BL (2009) Intake of calorically sweetened beverages and obesity. Obes Rev 10(1):68–75. 10.1111/j.1467-789X.2008.00523.x [DOI] [PubMed] [Google Scholar]
- 41.Keller A, Bucher Della Torre S (2015) Sugar-sweetened beverages and obesity among children and adolescents: A review of systematic literature reviews. Child Obes 11(4):338–346. 10.1089/chi.2014.0117 [DOI] [PMC free article] [PubMed] [Google Scholar]
- 42.Cantoral A, Téllez-Rojo MM, Ettinger AS, Hu H, Hernández-Ávila M, Peterson K (2016) Early introduction and cumulative consumption of sugar-sweetened beverages during the pre-school period and risk of obesity at 8-14 years of age. Pediatr Obes 11(1):68–74. 10.1111/ijpo.12023 [DOI] [PMC free article] [PubMed] [Google Scholar]
- 43.Pan L, Li R, Park S, Galuska DA, Sherry B, Freedman DS (2014) A longitudinal analysis of sugar-sweetened beverage intake in infancy and obesity at 6 years. Pediatrics 134(September):S29–S35. 10.1542/peds.2014-0646F [DOI] [PMC free article] [PubMed] [Google Scholar]
- 44.Rosinger A, Herrick K, Gahche J, Park S (2017) Sugar-sweetened beverage consumption among U.S. youth, 2011-2014. NCHS Data Brief (271): 1–8 [PubMed] [Google Scholar]
- 45.Bartok CJ, Ventura AK (2009) Mechanisms underlying the association between breastfeeding and obesity. Int J Pediatr Obes 4(4): 196–204. 10.3109/17477160902763309 [DOI] [PubMed] [Google Scholar]
- 46.Center for Disease Control and Prevention (2018) Breastfeeding Report Card | Breastfeeding, https://www.cdc.gov/breastfeeding/data/reportcard.htm. Accessed 30 Jun 2020
Associated Data
This section collects any data citations, data availability statements, or supplementary materials included in this article.