

Abstract
Fibronectin (FN) is an extracellular matrix (ECM) glycoprotein that self‐assembles into FN fibrils, forming a FN matrix contributing to the stiffness of the ECM. Stromal FN stiffness in cancer has been shown to impact epithelial functions such as migration, cancer metastasis, and epithelial‐to‐mesenchymal transition. The role of the FN matrix of epithelial cells in driving such processes remains less well understood and is the focus of this study. Hypoxia, defined by low oxygen tension (<5%) is one of the hallmarks of tumor microenvironments impacting fibril reorganization in stromal and epithelial cells. Here, using the MCF10 breast epithelial progression series of cell lines encompassing normal, preinvasive, and invasive states, we show that FN fibril formation decreases during hypoxia, coinciding with a decrease in migratory potential of these cells. Conversely, we find that FN fibril disruption during three‐dimensional acinar growth of normal breast cells resulted in acinar luminal filling. Our data also demonstrates that the luminal filling upon fibril disruption in untransformed MCF10A cells results in a loss of apicobasal polarity, characteristic of pre‐invasive and invasive breast cell lines MCF10AT and MCF10 DCIS.com. Overall this is the first study that relates fibril‐mediated changes in epithelial cells as critical players in lumen clearing of breast acini and maintenance of the untransformed growth characteristic.
Keywords: acini, fibronectin, hypoxia, integrin, migration
Graphical abstract
Fibronectin fibril disruption and lumen filling in breast acini.
1. INTRODUCTION
Morphogenesis and metastatic progression are influenced by the composition and organization of the extracellular matrix (ECM). 1 One such ECM protein is fibronectin (FN), a cell surface glycoprotein that organizes into a matrix by the stepwise assembly of its N‐terminal domains by FN–FN self‐association. 2 Although FN knockout is embryonically lethal, 3 , 4 the selective deletion of FN in the mammary epithelium results in growth retardation of branching ducts and lobules. 5 Evidently, FN is also the most significantly altered ECM protein, spatially and temporally during the postnatal development of the mammary gland. 6 Although normal adult breast tissue and benign neoplasms are devoid of FN, enhanced expression is observed in malignant neoplasms and lobular carcinoma. 7 Histopathological evaluation of metastatic ECM is also supported by qPCR analyses of FN, confirming the increased expression in metastatic lesions compared to primary tumors and matched controls, respectively. 8 , 9
Several pivotal studies using three‐dimensional (3D) cultures of breast cells that mirror the acinar development of the mammary gland have established the contribution of ECM proteins to acinar morphogenesis and tumorigenesis. 10 , 11 , 12 , 13 Addition of FN either during acinar growth or after acinar differentiation of normal breast cells reverses growth arrest, resulting in lumen filling and an increase in acinar size, pointing to the role of FN in the modulation of oncogenesis. 11 Acinar cultures of cells from breast carcinoma biopsies and cell lines reveal the loss of acinar organization, tissue polarity, proliferation and the absence of a distinct lumen. 14 , 15 , 16 , 17 Incidentally, perturbation of cell–ECM interactions in breast tumor acini using integrin‐β1 function‐blocking antibodies cause reversion to phenotypically normal acini. 16 , 17 , 18
Matrix FN is structured into distinct FN fibrils on the cell surface, unlike the non‐fibril dimeric protein (nearly identical ∼250 kDa subunits) that is present intracellularly. 2 Studies using a 76aa peptide (III‐1C) derived from the first Type III repeat of FN accelerates FN–FN crosslinking, modifying the assembly state from dimeric to polymeric FN that resembles matrix FN fibrils. 19 Administering the fibril‐forming peptide specifically reduces breast cancer metastasis in xenograft mouse models 20 and reduces subcutaneous and experimental metastases in multiple tumor types. 21 We have also demonstrated that the assembly state of FN determines the migratory potential of “normal” breast cells in response to TGF‐β1. 22 , 23
Oxygen is a vital morphogen that has been shown to influence FN fibril formation largely in fibroblasts and the tumor stroma. 24 , 25 The reorganization of FN into aligned fibrils in fibroblasts serves as conduits for the migration of breast cancer cells by increasing adhesion and motility. 25
Despite the advances in our understanding of hypoxia on the ECM of fibroblasts, the reorganization of FN in breast epithelial cells exposed to hypoxia remain undefined. Here, we demonstrate that hypoxia reorganizes FN in hypoxic breast epithelial cells, perhaps influencing the migratory behavior of these cells. Importantly, we show that FN matrix formation plays a required and 3D specific role in acinar development and polarization of normal breast cells. These results add new data demonstrating the necessity of the FN matrix for the normal morphological development of the mammary gland, preventing tumorigenesis.
2. MATERIALS AND METHODS
2.1. Cell lines and culture conditions
The isogenic MCF10 cell line series included the untransformed normal MCF10A, Ras‐transformed pre‐invasive MCF10AneoT and the invasive MCF10 DCIS.com. MCF10A and MCF10AneoT were obtained from the Barbara Ann Karmanos Institute and MCF10 DCIS.com was obtained from Wayne State University. MCF10A and MCF10AT cells were cultured in DMEM/F12 (1:1) media (#11330‐032; Gibco) supplemented with 5.26% horse serum (#16050‐122; Gibco), insulin (10 µg/ml; #12585‐014; Gibco), epidermal growth factor (20 ng/ml; #PHG0313; Gibco), hydrocortisone (0.5 µg/ml; #CB40203; Corning), and cholera toxin (100 ng/ml). MCF10 DCIS.com cells were cultured in DMEM/F12 (1:1) media (#11330‐032; Gibco) supplemented with 5.26% horse serum (#16050‐122; Gibco). Cells were maintained in a 37°C humidified incubator buffered with 5% CO2 and routinely tested for mycoplasma contamination using the MycoAlert Plus Mycoplasma Detection Kit (#LT07703; Lonza).
2.2. Normoxic and hypoxic culture conditions
Normoxic conditions for the cell lines were routine subculture conditions 37°C/5% CO2 and (21% environmental Oxygen). Hypoxia (1% O2) within an incubator subchamber C‐Chamber was generated using a ProOx C21 Oxygen CO2 single chamber controller (Biospherix). Hypoxia incubations were initiated and timed after the setpoint on the controller reached 1% O2.
2.3. Antibodies and reagents
Antibodies for immunoblotting and immunocytochemistry: GAPDH (#437000; Invitrogen), HIF1‐α (#14179S; Cell Signaling Technology), HIF2‐α (#ab207607; Abcam), FN (IB) (#ab23750; Abcam), FN (ICC) (#IST‐9; SCBT), β‐actin (#MA1‐140; Invitrogen), Vinculin (#129002; Abcam), Integrin‐α6 (#MABT356; Millipore Sigma), Integrin‐α5 (#ab150361; Abcam), Integrin‐β1 (#96996; Cell Signaling Technology) Alexa Fluor 568 (#A10037; Invitrogen), and Alexa Fluor 488 (#A11001; Invitrogen). For flowcytometry, Active integrin‐β1 clone HUTS‐4 (#MAB2079Z; Millipore Sigma) was used. Matrigel™ was purchased from Corning. Protein concentration in lots used varied between 10 and 11.2 mg/ml with an endotoxin level of less than 1.5.
2.4. Deoxycholate assay
Deoxycholate (DOC) fractionation was carried out as previously described. 22 , 23 Briefly, cells were washed in ice‐cold phosphate‐buffered saline (PBS) and soluble FN protein was extracted in buffer containing 2% DOC and 0.02‐M Tris‐HCl, pH 8.8, supplemented with 2‐mM phenylmethylsulphonyl fluoride, 2‐mM EDTA, 2‐mM iodoacetic acid, and 2‐mM N‐ethylmalemide. Following lysis for 30 min at 4°C, the lysates were centrifuged at 15,000 rpm for 30 min to separate the soluble FN in the supernatant. The pellet fraction containing the fibril FN was resuspended in sodium dodecyl sulfate (SDS) lysis buffer containing 1% SDS, 25‐mM Tris‐HCl, pH 8.0, and protease inhibitors. The pellet fraction containing the SDS lysis buffer was heated for 1 min at 95°C. The entire pellet fraction was loaded on a 5% polyacrylamide gel and 10% of the soluble fraction was loaded alongside. Both soluble and fibril FN were normalized to GAPDH. Average fold differences between fibril and soluble FN were plotted as bar graphs and p values calculated using the unpaired Student's t‐test.
2.5. Protein extraction and immunoblotting
Protein extraction was performed at 4°C using ice‐cold SDS lysis buffer containing protease and phosphatase inhibitors (1‐mM DTT, 1‐mM EDTA, 100‐µg/ml PMSF, 1‐µg/ml leupeptin, 1‐mM sodium orthovanadate). Proteins were separated by SDS–polyacrylamide gel electrophoresis and immunoblotted for specific proteins as indicated. Vinculin, β‐actin, and GAPDH were used as loading controls.
Quantification of immunoblots was performed using the Li‐Cor Image Studio Software version 5.2. Pixel intensities of each protein normalized to the loading control were averaged from at least three independent experiments and fold‐differences between untreated and treated samples were plotted as shown. Statistical significance was determined using the unpaired Student's t‐test.
2.6. Immunocytochemistry and imaging
For immunocytochemistry of active integrin‐β1, cells were seeded on sterile coverslips in a six‐well plate at a density of 173,000 cells per well. The coverslips were fixed in 4% paraformaldehyde and permeabilized in 0.1% Triton X‐100 on ice for 1 min. After blocking in 5% BSA‐1X PBS, active integrin‐β1 antibody (1:100) was added for 1 h followed by 1h incubation with secondary antibody. After repeated washing in 1X PBS, cells were stained with the DNA stain DAPI (4,6‐diamidino‐2‐phenylindole dihydrochloride; #1023627001; Roche) and mounted using Prolong gold anti‐fade mount media (#P36930; Invitrogen) on glass slides. Imaging and z‐stacks (1‐µm z‐slice) were acquired using a Leica TCS SPEII confocal microscope maintaining consistent acquisition parameters between experiments.
2.7. Cell migration
Real‐time cell migration was performed in 16‐well CIM plates using the ACEA xCELLigence RTCA DP System (ACEA Biosciences). To set‐up the cell migration assay, 160 µl of serum‐containing media were plated in the lower chamber of the CIM plates and topped with 50‐µl serum‐free media to equilibrate the membrane (8‐µm pore size) that separates the top and bottom chambers. As a negative control, one triplicate set of wells contained serum‐free media in the lower chamber. For migration in the presence of functional upstream domain (FUD; 500 nM) or III‐11C (500 nM), the peptide was added to the top and bottom chambers. After equilibration of the membrane for 1 h, 30,000 cells in 100‐µl serum‐free media were plated in the top chamber of the CIM plate. After the plate was assembled in the instrument, cell migration from the upper to lower chambers was quantified by measurement of cell impedance. Impedance is created when cells travel through the membrane lined with gold electrodes. As cells migrate, they impede the flow of electrical current between the electrodes to generate impedance values, which are converted by the xCELLigence software to cell index (cell numbers). For cell migration at 1% O2, the xCELLigence instrument was placed in a hypoxia chamber and the complete cell migration assay was performed under hypoxic conditions. Cell index values generated by the instrument were analyzed using the included RTCA DP software Pro. The values were exported to Excel and migration curves were calculated following ACEA‐provided user manuals. Each treatment condition was performed in technical triplicates and each experiment was performed two times. Statistical significance was determined using the nonparametric Mann–Whitney U test between hypoxia‐exposed cells and normoxic cells.
2.8. Acinar culture
Three‐dimensional acinar culture in Matrigel™ was performed as previously described. 14 Briefly, cells were resuspended in Assay media containing 2% serum, 5‐ng/ml EGF, and 2% Matrigel™. 400 µl of this mixture (∼5000 cells) was plated in each well of a chamber slide containing solidified Matrigel™. The cells were fed with fresh Assay media every four days. We obtained anywhere from 5 to 10 acini/well.
For FUD and III‐11C treatments, the 500‐nM peptide was added to the Assay media. Media replacement included re‐addition of the peptides. For acini growth in hypoxia, cells were plated on solidified Matrigel™ in chamber slides and placed in the hypoxia chamber for the entire duration of acini formation. All acini were processed for immunostaining after 14‐day growth in culture. Acini processed for FN immunostaining (Figure S3B) was sampled after 7‐day growth in culture when FN expression is detectable. 11
2.9. Immunostaining of acinar structures
Immunostaining of acini was performed as previously described. 26 Briefly, media was aspirated from each well of the chamber slide and acini were fixed with 4% paraformaldehyde for 20 min followed by permeabilization for 10 min at 4°C in 0.5% Triton‐PBS. After repeated rinsing in PBS‐glycine, blocking solution (130‐mM NaCl, 7‐mM Na2HPO4, 3.5‐mM NaH2PO4, 7.7‐mM NaN3, 0.1% BSA, 0.2% Triton X‐100, 0.05% Tween‐20, and 10% goat serum) was added for 45–60 min at room temperature. The acini were subsequently incubated with integrin‐α6 primary antibody or FN primary antibody (1:100) overnight at 4°C followed by secondary antibody incubation (Alexa 568) in blocking buffer. The nuclei were stained with DAPI (#1023627001; Roche) and mounted using Prolong gold anti‐fade mount media (#P36930; Invitrogen) on glass slides. Imaging and z‐stacks (4‐µm z‐slice) were acquired using a Leica TCS SPEII confocal microscope maintaining consistent acquisition parameters between experiments.
2.10. Quantification of acinar size
Acinar size of DAPI‐stained acini was determined from a confocal z‐stack comprising z‐slices from the center of the acini and imported into Fiji (ImageJ; open source). A region of interest (ROI) was drawn around each acinus and the area of each acinus calculated using Fiji. Average acinar area values were plotted as individual data points and statistical significance determined using the unpaired Student t‐test.
2.11. Quantification of integrin‐α6 lumen intensity
To quantify luminal staining of integrin‐α6, z‐slices of the center of the acini were imported into Fiji (ImageJ; open source). Each z‐slice is a 4‐µm section acquired as a z‐stack using confocal microscopy. Mean integrated intensities (total intensity/area) of the ROI excluding the basement membrane were determined from the center slice. Intensity values from each acinus were plotted as individual data points. Statistical difference in intensities between treatments was evaluated using the unpaired Student t‐test.
2.12. Flowcytometry analysis
To determine active integrin‐β1 levels, 0.4 × 10⁶ cells were seeded on 6‐cm2 plates and treated with the different experimental conditions as described. Cells were dissociated using the non‐enzymatic cell dissociation buffer (#13151014; Sigma) and washed with ice‐cold 0.5% BSA‐PBS. The cells were pelleted at 1500 rpm for 5 min and blocked for 1 h using 100 µl 0.5% BSA‐PBS. After blocking, the cell pellets were incubated with 2.5 µl of the active integrin‐β1 antibody for 1 h at 4°C according to the manufacturer's instructions. After antibody incubation, the cell pellets were washed twice with 0.5% BSA‐PBS and resuspended with 200 µl of 0.5% BSA‐PBS before acquisition. Acquisition was carried out using a CytoFLEX flowcytometer (Beckman Coulter) and analyzed using the FlowJo™ software (BD Bioscience). Average positive cells for active integrin‐β1 are represented as flowcytometry histograms and mean fluorescence intensities (MFI) are represented as bar graphs.
2.13. Statistical analysis
All data are presented as mean ± SEM. Where indicated the experiments are averages of at least three independent determinations or data representative of two or more trials. Individual data points for each experimental condition have been included in figures to demonstrate variability between experiments. Statistical analyses were performed with GraphPad Prism 8.
3. RESULTS
3.1. Hypoxia reduces FN fibrils in untransformed and transformed breast epithelial cells
To investigate whether FN fibril formation is affected by hypoxia in the untransformed MCF10A, pre‐invasive MCF10AT, and invasive MCF10 DCIS.com cells, we exposed the MCF10 breast progression series to 1% O2 for 6, 12, and 18 h and separated the fibril (insoluble) and nonfibril (soluble) FN fractions by fractionation based on differential solubilities in DOC. 22 , 23 As shown in Figure 1A, hypoxia decreased FN fibril levels and significantly decreased the ratio of fibril versus soluble FN at 18 h in MCF10AT (*p < .05) and at 12 and 18 h in MCF10 DCIS.com cell lines (*p < .05, ***p < .001; Figure 1B). The decrease in FN fibrils in response to hypoxia was further confirmed in the three cell lines by immunolabelling FN (Figure S1A). In accordance with our observations and from previous studies in renal epithelial cells, 27 , 28 , 29 , 30 we observed a two‐fold increase in total FN protein in response to hypoxia indicating that the decrease in FN fibrils (Figures 1A and S1A) is unlikely to be due to insufficient protein (Figure 1C,D). Increased levels of HIF‐1α and HIF‐2α confirmed hypoxia response in these cell lines (Figures 1E and S1B).
Figure 1.
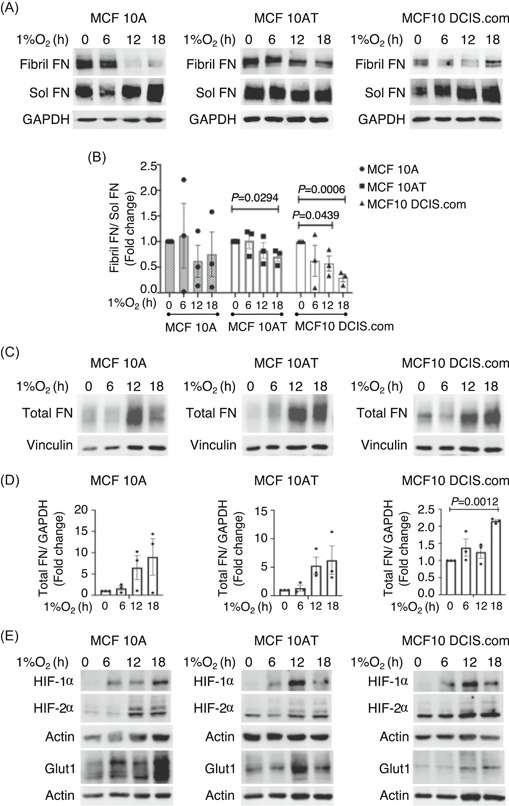
Fibril formation decreases in hypoxia‐exposed breast epithelial cells. (A) MCF10A, MCF10AT and MCF10 DCIS.com cells were exposed to hypoxia (1% O2) for the indicated times and cell lysates fractionated using deoxycholate to separate fibril FN and soluble FN. (B) Ratio of fibril versus soluble FN fractions, normalized to loading control GAPDH is plotted as mean ± SEM. Quantification is an average of three independent trials. Statistically significant differences between untreated and hypoxic samples were calculated using unpaired Student's t‐test. Actual p values are included. (C) Total cell lysates at the indicated treatment times were lysed in sodium dodecyl sulfate buffer to solubilize total FN pools (fibril and soluble combined) and immunoblotted against FN. Vinculin is used as loading control. (D) Total FN levels normalized to vinculin are plotted as mean ± SEM of three independent trials. Statistical significance and actual p values were determined using the unpaired Student t‐test. (E) Total cell lysates immunoblotted against proteins as indicated. Actin was used as loading control
3.2. Integrin activation is not altered in cells exposed to hypoxia
Hypoxia has been shown to increase expression of integrin‐α5 and integrin‐β1 in breast cancer cell lines. 31 Since integrinα5β1 activation is principally associated with FN fibril formation, 32 , 33 we assessed whether protein levels of the integrin‐α5 and integrin‐β1 subunits are altered in cells exposed to hypoxia. Basal expression levels of the integrin subunits were comparable among the three cell lines and hypoxia upregulated integrin protein levels, especially at the 12 and 18 h time points as detected by immunoblotting and immunocytochemistry (Figures 2A and S2A). However, vinculin, a focal adhesion protein that has been shown to stabilize integrin activity, 34 demonstrated unchanged total protein levels in the three cell lines in response to hypoxia (Figure S2B). Since upregulated integrin levels did not correlate with our observation that hypoxia reduces FN fibril formation (Figure 1A,B and S1A), we suspected instead the absence of integrin activation. Consistently, quantification of the active conformation of integrin‐β1 by immunocytochemistry and flowcytometry using a conformation‐specific antibody revealed the absence of integrin‐β1 activation in hypoxia‐exposed cells (Figure 2B,C). Experimentally ‐induced functional activation of integrin‐β1 by addition of the divalent cation MnCl2 considerably increased active integrin‐β1 by immunostaining (Figure 2B). These results were confirmed using flowcytometry (Figure 2C), indicating that the absence of integrin‐β1 activation in response to hypoxia was neither due to insufficient protein levels nor defective activation of cell surface integrins.
Figure 2.
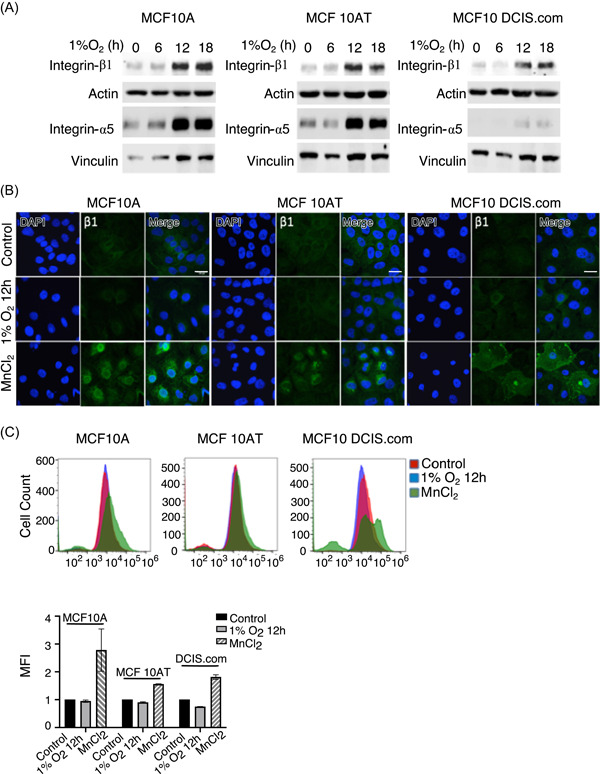
Integrin‐β1 is not activated by hypoxia. (A) Total cell lysates at the indicated treatment times were lysed in sodium dodecyl sulfate and immunoblotted for integrin‐β1 and integrin‐α5. Vinculin was used as loading control. Data is a representative image of three independent trials. (B) Untreated and hypoxia‐exposed cells were fixed at indicated time points after treatment and immunostained for the active conformation of integrin‐β1 (green) and nuclear stain DAPI (blue). Integrin activator MnCl2 was included as a positive control. Scale bar = 20 µm. (C) Untreated and hypoxia‐exposed cells were marked using fluorescent‐tagged antibodies for activated integrin‐β1 and positive cells were quantified using a Beckman Coulter CytoFLEX benchtop flowcytometer. Twelve‐hour hypoxia treatment (blue) did not increase activation of integrin‐β1 (x‐axis) in comparison to untreated controls (red) or MnCl2‐treated positive controls (green) in any of the three cell lines tested. Bar graph of mean fluorescence intensities (MFIs; n = 2) determined from flowcytometry data in (C) is shown
3.3. Hypoxia decreases cell migration
Although hypoxia did not increase integrin‐β1 activation in 2D culture of the MCF10 series of cell lines, total integrin levels were increased in these cells (Figures 2A and S2A). Upregulated integrin levels are significant to the metastatic response of breast cancer cells and knockdown of integrinα5β1 has been shown to reduce 3D cell migration but having no impact on migration in 2D. 31 We have previously shown that FN fibril formation is required for directional cell migration in MCF10A cells. 22 Since hypoxia reduced FN fibrils in the MCF10 progression series (Figure 1), we investigated whether hypoxia impacts epithelial cancer cell migration. We set up a transwell migration assay and tracked the real‐time migration of the MCF10 series of cell lines towards a serum‐based chemotactic gradient under normoxic and hypoxic conditions for 12 h. All the three cell lines displayed significantly reduced cell migration under hypoxia compared to migration at 21% oxygen (Figure 3A).
Figure 3.
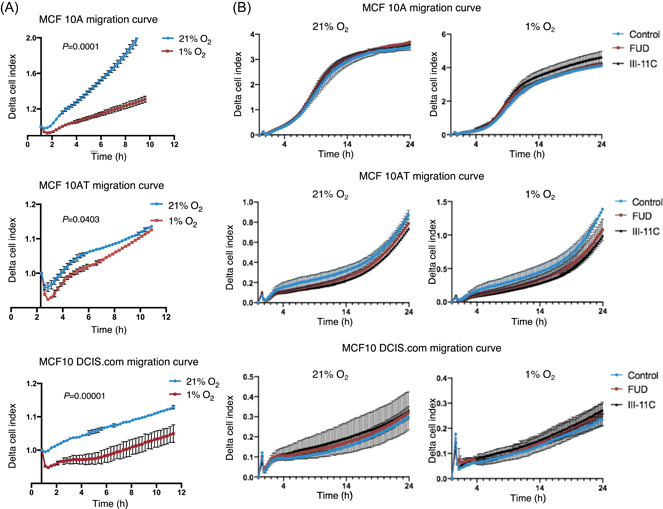
Hypoxia decreases chemotactic migration. (A) MCF10 series of cell lines were allowed to migrate under normoxic (21% O2) or hypoxic (1% O2) environments towards a serum chemotactic gradient for 12 h. Real‐time migration of the cells through the 8‐µm pore was automatically quantified by the ACEA xCELLigence system and the migration curve was plotted. Each data point is an average of technical duplicates ± SD. Data is representative of two independent determinations. Statistically significant differences in migration up to 10 h between normoxia and hypoxia as denoted by actual p values were determined using the Mann–Whitney U test. (B) Cell migration was performed as described in (A) in the presence of 500‐nM functional upstream domain (FUD), 500‐nM III‐11C, or no‐peptide control. Each data point is an average of technical duplicates ± SD. Data is representative of three independent determinations
Given that hypoxia decreases FN fibril assembly (Figure 1A,B), we investigated whether FN fibril disruption is sufficient to decrease the cellular migration in response to a serum chemotactic gradient. To test this, we blocked fibril assembly using a 49‐mer peptide (FUD) derived from the Streptococcus pyrogenes adhesion F1 protein that binds to the N‐terminal domain of FN, which is responsible for fibril formation. Since FUD does not affect FN protein levels or the initial binding of FN to the integrinα5β1 receptor, this approach specifically targets fibril assembly without altering the protein composition of the ECM. 35 , 36 , 37 , 38 , 39 We confirmed that FUD treatment at 500 nM, unlike the control peptide III‐11C (control fragment from the 11th Type III repeat of FN), disrupted FN fibril assembly in MCF10A cells (Figure S3A). Migration kinetics of the MCF10 progression series remained unchanged despite the addition of FUD in normoxia and hypoxia (Figure 3B).
3.4. FN fibril disruption prevents lumen formation in 3D mammary acini of untransformed MCF10A cells
Although hypoxia reduced cell migration in 2D culture (Figure 3A) whilst FN fibril disruption alone did not (Figure 3B), hypoxia has been shown to cause filling of the acinar luminal space of untransformed breast cells cultured to form acini in 3D culture conditions. 40 , 41 Due to differences in the composition and organization of the microenvironment between tissue versus in vitro culture conditions, we tested the role of hypoxia and FN fibril disruption in the context of 3D cell culture conditions. Since 3D growth of mammary epithelial cells recapitulates the breast epithelial architecture in vivo, 15 , 42 we cultured breast acini of the MCF10 progression series of cell lines on reconstituted basement membrane Matrigel™ for 14 days. As expected, the untransformed MCF10A cells formed acini with a single layer of polarized epithelial cells and a hollow lumen, whereas the pre‐invasive MCF10AT and invasive MCF10 DCIS.com cells showed filling of luminal space: a hallmark of epithelial tumors. MCF10A acini growth in hypoxic conditions resulted in the filling of the acinar lumen in agreement with previous findings 40 , 41 (Figure 4A). Pre‐invasive MCF10AT and invasive MCF10 DCIS.com cells did not significantly alter acinar architecture in response to hypoxia, exhibiting a filled lumen under normal and hypoxic growth conditions (Figure 4A). Interestingly, growth of MCF10A acini in the presence of FUD replenished throughout the growth of the acini, blocked the hollowing of the lumen (but this was not achieved using the control peptide III‐11C), indicating that FN fibril assembly is critical to lumen formation and maintenance of the untransformed phenotype (Figure 4A). The blocking of FN fibril assembly using FUD yielded an increase in the percentage of MCF10A acini lacking a hollow lumen which was comparable to that resulting from hypoxia exposure (Figure 4B).
Figure 4.
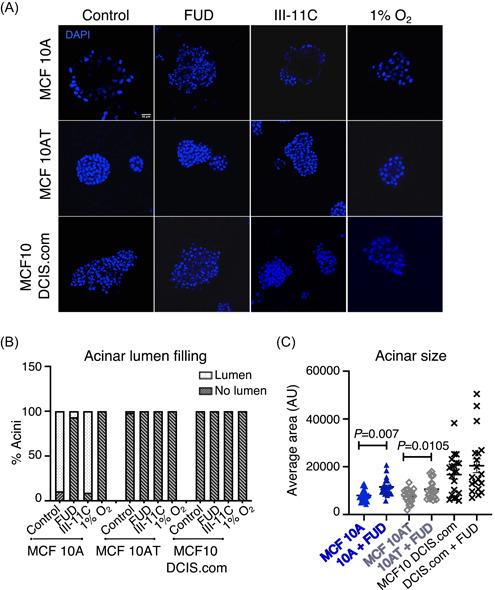
FN fibril disruption blocks lumen formation and increases 3D acinar size. (A) MCF10 series of cell lines were cultured on Matrigel™ for 14 days in the presence of indicated treatments throughout the course of the culture period. Acini were fixed and stained using nuclear stain DAPI (blue). Images are z‐slices of a center slice in a z‐stack acquired using a confocal microscope. Scale bar = 50 µm. (B) Immunostained acini in (A) were separated into “lumen” and “no lumen” containing acini and plotted as percentages. Data is an average of multiple determinations and a total of approximately 40 acini per condition were included in the analysis. (C) Maximum projections of immunostained acini in (A) were used to determine the acinar area. Each data point represents a separate acinus. Statistical significance and actual p values between untreated and functional upstream domain (FUD)‐treated acini were determined using the unpaired Student t‐test
Early proliferative stages of acinar morphogenesis is followed by polarization and growth arrest 14 , 26 and FN expression has been shown to decline at the onset of polarization and growth arrest (∼Day 7). 11 To investigate whether blocking FN fibril assembly during the early stages affected growth arrest, we added FUD or the III‐11C control peptide during acinar growth and determined acinar size. FUD treatment increased acinar size significantly in the untransformed MCF10A (***p < .001) and pre‐invasive MCF10AT cells (*p < .05) compared to the control peptide treatments (Figure 4C). These data demonstrate that fibril formation is essential for lumen formation and in addition, increases acinar size during MCF10 morphogenesis.
3.5. Blocking FN fibrils disrupts apicobasal polarity
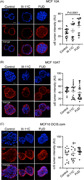
Cells that contact the confines of the 3D matrix exhibit apicobasal polarity, one of the prerequisites for lumen clearing in maintaining the untransformed phenotype during acinar morphogenesis. 26 In contrast, mammary tumors and cell lines are unable to maintain acinar lumen clearing and are characterized by a loss of polarity. 17 The polarization marker integrin‐α6 localizes to the basal surface of the single layer of polarized epithelia that contacts the 3D matrix. Thus the localization of integrin‐α6 to the basement membrane of breast acini is a reliable marker to assess polarized epithelia. 17 To investigate whether blocking fibril assembly disrupts lumen formation by altering apicobasal polarity, we cultured acini of the MCF10 progression series of cell lines in the presence of the FUD and III‐11C peptides and immunostained for integrin‐α6. In untreated MCF10A cells, integrin‐α6 was localized as a distinct rim labeling the basal surface, consistent with their polarized phenotype and untransformed state. Upon treatment with FUD (but not in the case of the III‐11C‐treated acini), integrin‐α6 localization was more random, spreading towards the center of the acini revealing a loss in polarity (Figure 5A). Quantification of integrin‐α6 intensity levels within the center of the acini showed a two‐fold increase in FUD‐treated MCF10A acini relative to the controls (****p < .0001). MCF10AT and MCF10 DCIS.com cells, either untreated or treated with FUD displayed a characteristic loss in polarity, evident from the distribution of integrin‐α6 that was not restricted to the basal surface (Figure 5B,C).
Figure 5.
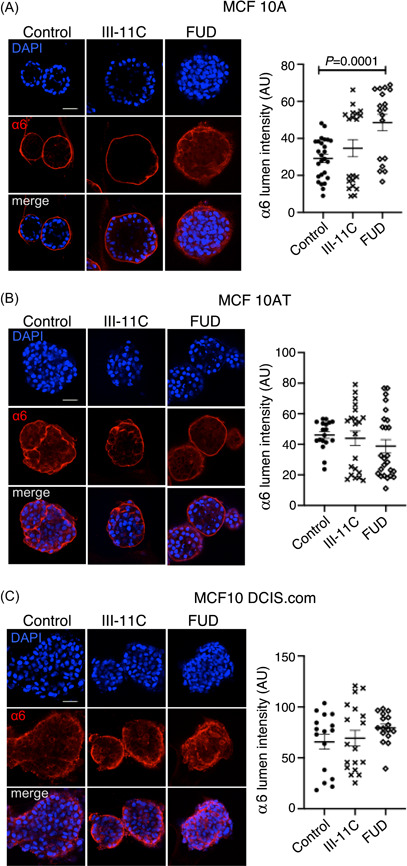
FN fibril formation is required for apicobasal polarization during acini development. (A–C) MCF10 series of cell lines were cultured on Matrigel™ for 14 days in the presence of 500‐nM functional upstream domain (FUD), 500‐nM III‐11C, or no‐peptide control. The acini were fixed and immunostained for the basal polarization marker integrin‐α6 (red) and counterstained using the nuclear stain DAPI (blue). Images are z‐slices of a center slice in a z‐stack acquired using a confocal microscope. Scale bar = 50 µm. (A) MCF10A acini show a rim‐like localization for integrin‐α6 in untreated and control peptide ‐treated acini. FUD treated acini demonstrate invaginations in integrin‐α6 staining towards the lumen. Quantification of luminal integrin‐α6 (right) was performed by measuring integrated intensities (intensity/area) within one region of interest (ROI) per acinus. Each ROI comprised the majority of the lumen while omitting the acinar margin. Statistical significance in intensity variation between the untreated and peptide‐treated acini (as denoted by actual p values) was determined using the unpaired Student t‐test. (B) MCF10AT acini display integrin‐α6 staining in the lumen and rim of the acini in all treatment conditions. (C) MCF10 DCIS.com acini display random integrin‐α6 staining as shown
4. DISCUSSION
In this study, we demonstrate that hypoxia decreases FN fibril assembly in normal and transformed breast epithelial cells whilst increasing FN deposition in these cells (Figure 1A–D). Although previous studies by others 43 , 44 have observed negligible fibril FN in MCF10A cells, our observation of fibril FN in these cells is perhaps due to our experimental and culture conditions that include serum and growth factors. Regardless, amongst the three cell lines we tested in our progression series—MCF10A, MCF10AT, and MCF10 DCIS.com, the invasive MCF10 DCIS.com cells exhibited the least amount of fibril FN as evident from our fluorescence detection and biochemical fractionation approaches (Figures S1A and 1A).
Studies in primary mammary tumors and analysis of more than 2000 patient tumor biopsies have indicated that increased FN expression correlates with decreased patient survival. 45 , 46 Incidentally, the addition of exogenous FN to 3D cultures of breast acini, disrupts acinar morphology and increases acinar size. 11 Nonetheless, the assembly state of FN is a critical contributor to the tumorigenic potential of cancer cells although mechanistic data on the contribution of the FN matrix to development and tumorigenesis remains less well understood. 20 , 21 , 47 Our results indicated that the decrease in fibril assembly that we observed in untransformed and transformed breast cell lines, in response to hypoxia, correlated to a decrease in migration in these cells (Figure 3A). Although we show that FN matrix disruption does not independently retard migration kinetics (Figure 3B), it remains to be tested if preventing the FN matrix disruption during hypoxia reverses reduced cell migration in these cells. This reasoning has been corroborated by findings in breast cell lines, demonstrating that although FUD treatment did not alter chemotactic migration of MCF10A cells, FUD decreased the TGF‐β1‐mediated cell migration. 43 Although we and others have previously shown that renal epithelial cells exposed to hypoxia disassemble the FN matrix, perhaps involving cell trafficking of the FN protein, it is still unclear how this process of FN disassembly is initiated or mediated. 28 For this reason, we were unable to target a specific mechanistic process to reverse fibril disassembly. However, this data is the first observation investigating real‐time migration of the breast progression series under hypoxia. While several studies in other cancer types correlate hypoxia to increased cell migration, 28 , 48 , 49 limited but significant data in breast cell lines generated using hypoxia mimetics or alternatively by pre‐exposing cells to 1% O2 followed by migration in normoxia have also pointed to similar conclusions. 50 , 51 In contrast to much of the previous in vitro migration assays but in agreement with our findings, in vivo imaging of breast cancer cells at single‐cell resolution, has revealed a persistent slow migration of hypoxic cells compared to their normoxic counterparts. 52 This property has been linked to the abundance of invadopodia in these cells, offering directionality towards attractants and persistence in migration. 53 Thus more sophisticated detection methods have allowed us to redefine the context‐dependent role of hypoxia in cancer migration.
Our findings establish that hypoxia in breast cell lines decreases migration, which is in agreement with in vivo findings by others that attribute the slow persistent migration of hypoxic cells to greater metastatic propensity. The absence of a change in migration rates upon FN fibril disruption (Figure 3B) agrees with previously published findings 43 and indicates that matrix disruption alone is insufficient to alter the migratory capacity of breast cell lines.
The observation that hypoxia causes luminal filling in 3D acinar cultures of normal MCF10A cells (Figure 4A) is in accordance with previously published data. 40 , 41 The alteration of matrix FN by hypoxia (Figure 1A–D), led us to investigate if the matrix organization was a contributor to luminal filling. Despite our observation that FN fibrils may not influence chemotactic migration (Figure 3B), based on several in vivo studies pointing to the function of the fibril FN, it was likely that FN fibril disruption may have significant effects on metastatic propensity in a 3D cell culture model. Our results indicated that disrupting matrix organization in normal breast cells using the FUD peptide was sufficient to phenocopy the changes observed in the transformed MCF10AT and MCF10 DCIS.com cell lines such as filling of the central luminal space, characteristic of early epithelial tumors (Figure 4A). Although integrin α5β1 is the typical integrin involved in fibril formation, other integrins besides integrin α5β1 have been shown to mediate matrix assembly. 33 , 54 , 55 Since FUD binding does not interfere with the engagement of FN to integrins nor affect FN protein levels, FUD served as an ideal tool to establish the role of the matrix in acinar development despite the choice of the integrin heterodimer that initiated matrix formation. 35 , 36 , 37 , 38 , 39 As previously established, FN localizes to the acinar rim during the early proliferative stage (∼7 days) following which FN expression begins to decrease. 11 At the resolution limits of confocal imaging, we were unable to determine whether the FN at the rim in untreated acini were composed of fibrils (Figure S3B). Perhaps, for this reason, immunolabelled FN in tissues have not been resolved into fibril and non‐fibril forms although FUD has been shown to disrupt the FN fibril‐mediated functions in vivo. 56 We observed that the addition of FUD to acini resulted in an interspersed localization of FN (Figure S3B white arrows) not restricted to the acinar rim. Hypoxia similarly affected FN localization (Figure S3B white arrows) although we also observed prominent labeling of FN at the rim (Figure S3B). Collectively, these studies are the first to implicate FN reorganization in the creation of the lumen and in preventing the transformed growth characteristic in normal cells.
During 3D growth of normal MCF10A breast cells, lumen formation follows the development of apicobasal polarity. 14 Based on our findings, we predict that the loss in polarization upon fibril disruption, as observed from the mislocalized integrin‐α6 immunostaining (Figure 5A), prevents the subsequent stages of growth arrest and luminal apoptosis. In accordance with these findings, we observed increased acinar size under these conditions (Figure 4C).
Oncogenes that cause luminal filling have shown to also exhibit anti‐apoptotic activities since the cells that proliferate within the lumen are incompatible with cell survival. 26 It is probable from our experiments that oncogenes that cause lumen filling do so by specifically targeting the fibril organization of FN. Our data sheds light on the novel function of matrix organization on lumen filling, independent of the role of oncogenes in driving this process.
While these experiments were primarily focused on FN fibril disruption, it is nonetheless of interest to speculate how accelerated matrix formation during 3D growth of pre‐invasive and invasive cancer cells could impact luminal filling and cause reversion of the tumorigenic phenotype.
CONFLICT OF INTERESTS
The authors declare that there is no conflict of interests.
Supporting information
Supporting information.
Supporting information.
Supporting information.
Supporting information.
ACKNOWLEDGMENTS
The authors thank Prof. Jane Sottile (University of Rochester) for generously sharing the FUD and control peptide III‐11C. This study was funded in part by National Institutes of Health grant U54 U54MD012388 to Archana Varadaraj and Narendiran Rajasekaran, and National Cancer Institute of the National Institutes of Health under the awards for the Partnership of Native American Cancer Prevention U54CA143924 (UACC) and U54CA143925 (NAU) to Narendiran Rajasekaran.
Magdaleno C, House T, Pawar JS, Carvalho S, Rajasekaran N, Varadaraj A. Fibronectin assembly regulates lumen formation in breast acini. J Cell Biochem. 2021;122:524–537. 10.1002/jcb.29885
DATA AVAILABILITY STATEMENT
The data that support the findings of this study are available from the corresponding author upon reasonable request.
REFERENCES
- 1. Muncie JM, Weaver VM. The physical and biochemical properties of the extracellular matrix regulate cell fate. Curr Top Dev Biol. 2018;130:1‐37. [DOI] [PMC free article] [PubMed] [Google Scholar]
- 2. Singh P, Carraher C, Schwarzbauer JE. Assembly of fibronectin extracellular matrix. Annu Rev Cell Dev Biol. 2010;26:397‐419. [DOI] [PMC free article] [PubMed] [Google Scholar]
- 3. Watt FM, Hodivala KJ. Cell adhesion: fibronectin and integrin knockouts come unstuck. Curr Biol. 1994;4(3):270‐272. [DOI] [PubMed] [Google Scholar]
- 4. George EL, Georges‐Labouesse EN, Patel‐King RS, Rayburn H, Hynes RO. Defects in mesoderm, neural tube and vascular development in mouse embryos lacking fibronectin. Development. 1993;119(4):1079‐1091. [DOI] [PubMed] [Google Scholar]
- 5. Liu K, Cheng L, Flesken‐Nikitin A, Huang L, Nikitin AY, Pauli BU. Conditional knockout of fibronectin abrogates mouse mammary gland lobuloalveolar differentiation. Dev Biol. 2010;346(1):11‐24. [DOI] [PMC free article] [PubMed] [Google Scholar]
- 6. Woodward TL, Mienaltowski AS, Modi RR, Bennett JM, Haslam SZ. Fibronectin and the alpha(5)beta(1) integrin are under developmental and ovarian steroid regulation in the normal mouse mammary gland. Endocrinology. 2001;142(7):3214‐3222. [DOI] [PubMed] [Google Scholar]
- 7. Koukoulis GK, Howeedy AA, Korhonen M, Virtanen I, Gould VE. Distribution of tenascin, cellular fibronectins and integrins in the normal, hyperplastic and neoplastic breast. J Submicrosc Cytol Pathol. 1993;25(2):285‐295. [PubMed] [Google Scholar]
- 8. Hao X, Sun B, Hu L, et al. Differential gene and protein expression in primary breast malignancies and their lymph node metastases as revealed by combined cDNA microarray and tissue microarray analysis. Cancer. 2004;100(6):1110‐1122. [DOI] [PubMed] [Google Scholar]
- 9. Vasaturo F, Sallusti E, Gradilone A, et al. Comparison of extracellular matrix and apoptotic markers between benign lesions and carcinomas in human breast. Int J Oncol. 2005;27(4):1005‐1011. [PubMed] [Google Scholar]
- 10. Klinowska TC, Soriano JV, Edwards GM, et al. Laminin and beta1 integrins are crucial for normal mammary gland development in the mouse. Dev Biol. 1999;215(1):13‐32. [DOI] [PubMed] [Google Scholar]
- 11. Williams CM, Engler AJ, Slone RD, Galante LL, Schwarzbauer JE. Fibronectin expression modulates mammary epithelial cell proliferation during acinar differentiation. Cancer Res. 2008;68(9):3185‐3192. [DOI] [PMC free article] [PubMed] [Google Scholar]
- 12. Faraldo MM, Deugnier MA, Lukashev M, Thiery JP, Glukhova MA. Perturbation of beta1‐integrin function alters the development of murine mammary gland. EMBO J. 1998;17(8):2139‐2147. [DOI] [PMC free article] [PubMed] [Google Scholar]
- 13. Furuta S, Ren G, Mao JH, Bissell MJ. Laminin signals initiate the reciprocal loop that informs breast‐specific gene expression and homeostasis by activating NO, p53 and microRNAs. eLife. 2018;7:e26148. [DOI] [PMC free article] [PubMed] [Google Scholar]
- 14. Muthuswamy SK, Li D, Lelievre S, Bissell MJ, Brugge JS. ErbB2, but not ErbB1, reinitiates proliferation and induces luminal repopulation in epithelial acini. Nat Cell Biol. 2001;3(9):785‐792. [DOI] [PMC free article] [PubMed] [Google Scholar]
- 15. Petersen OW, Ronnov‐Jessen L, Howlett AR, Bissell MJ. Interaction with basement membrane serves to rapidly distinguish growth and differentiation pattern of normal and malignant human breast epithelial cells. Proc Natl Acad Sci U S A. 1992;89(19):9064‐9068. [DOI] [PMC free article] [PubMed] [Google Scholar]
- 16. Wang F, Weaver VM, Petersen OW, et al. Reciprocal interactions between beta1‐integrin and epidermal growth factor receptor in three‐dimensional basement membrane breast cultures: a different perspective in epithelial biology. Proc Natl Acad Sci U S A. 1998;95(25):14821‐14826. [DOI] [PMC free article] [PubMed] [Google Scholar]
- 17. Weaver VM, Petersen OW, Wang F, et al. Reversion of the malignant phenotype of human breast cells in three‐dimensional culture and in vivo by integrin blocking antibodies. J Cell Biol. 1997;137(1):231‐245. [DOI] [PMC free article] [PubMed] [Google Scholar]
- 18. Weaver VM, Lelievre S, Lakins JN, et al. beta4 integrin‐dependent formation of polarized three‐dimensional architecture confers resistance to apoptosis in normal and malignant mammary epithelium. Cancer Cell. 2002;2(3):205‐216. [DOI] [PMC free article] [PubMed] [Google Scholar]
- 19. Morla A, Zhang Z, Ruoslahti E. Superfibronectin is a functionally distinct form of fibronectin. Nature. 1994;367(6459):193‐196. [DOI] [PubMed] [Google Scholar]
- 20. Yi M, Ruoslahti E. A fibronectin fragment inhibits tumor growth, angiogenesis, and metastasis. Proc Natl Acad Sci U S A. 2001;98(2):620‐624. [DOI] [PMC free article] [PubMed] [Google Scholar]
- 21. Pasqualini R, Bourdoulous S, Koivunen E, Woods VL Jr, Ruoslahti E. A polymeric form of fibronectin has antimetastatic effects against multiple tumor types. Nat Med. 1996;2(11):1197‐1203. [DOI] [PubMed] [Google Scholar]
- 22. Varadaraj A, Jenkins LM, Singh P, et al. TGF‐beta triggers rapid fibrillogenesis via a novel TbetaRII dependent fibronectin trafficking mechanism. Mol Biol Cell. 2017;28:1195‐1207. [DOI] [PMC free article] [PubMed] [Google Scholar]
- 23. Varadaraj A, Magdaleno C, Mythreye K. Deoxycholate fractionation of fibronectin (FN) and biotinylation assay to measure recycled FN fibrils in epithelial cells. Bio Protoc. 2018;8(16):e2972. [DOI] [PMC free article] [PubMed] [Google Scholar]
- 24. Petrova V, Annicchiarico‐Petruzzelli M, Melino G, Amelio I. The hypoxic tumour microenvironment. Oncogenesis. 2018;7(1):10. [DOI] [PMC free article] [PubMed] [Google Scholar]
- 25. Gilkes DM, Bajpai S, Chaturvedi P, Wirtz D, Semenza GL. Hypoxia‐inducible factor 1 (HIF‐1) promotes extracellular matrix remodeling under hypoxic conditions by inducing P4HA1, P4HA2, and PLOD2 expression in fibroblasts. J Biol Chem. 2013;288(15):10819‐10829. [DOI] [PMC free article] [PubMed] [Google Scholar] [Retracted]
- 26. Debnath J, Mills KR, Collins NL, Reginato MJ, Muthuswamy SK, Brugge JS. The role of apoptosis in creating and maintaining luminal space within normal and oncogene‐expressing mammary acini. Cell. 2002;111(1):29‐40. [DOI] [PubMed] [Google Scholar]
- 27. Lee SH, Lee YJ, Han HJ. Role of hypoxia‐induced fibronectin‐integrin beta1 expression in embryonic stem cell proliferation and migration: involvement of PI3K/Akt and FAK. J Cell Physiol. 2011;226(2):484‐493. [DOI] [PubMed] [Google Scholar]
- 28. Magdaleno C, Dixon L, Rajasekaran N, Varadaraj A. HIFalpha independent mechanisms in renal carcinoma cells modulate divergent outcomes in fibronectin assembly mediated by hypoxia and CoCl2 . Sci Rep. 2020;10(1):18560. [DOI] [PMC free article] [PubMed] [Google Scholar]
- 29. Rana MK, Srivastava J, Yang M, Chen CS, Barber DL. Hypoxia increases the abundance but not the assembly of extracellular fibronectin during epithelial cell transdifferentiation. J Cell Sci. 2015;128(6):1083‐1089. [DOI] [PMC free article] [PubMed] [Google Scholar]
- 30. Ryu MH, Park HM, Chung J, Lee CH, Park HR. Hypoxia‐inducible factor‐1alpha mediates oral squamous cell carcinoma invasion via upregulation of alpha5 integrin and fibronectin. Biochem Biophys Res Commun. 2010;393(1):11‐15. [DOI] [PubMed] [Google Scholar]
- 31. Ju JA, Godet I, Ye IC, et al. Hypoxia selectively enhances integrin alpha5beta1 receptor expression in breast cancer to promote metastasis. Mol Cancer Res. 2017;15(6):723‐734. [DOI] [PMC free article] [PubMed] [Google Scholar]
- 32. Wu C, Hughes PE, Ginsberg MH, McDonald JA. Identification of a new biological function for the integrin alpha v beta 3: initiation of fibronectin matrix assembly. Cell Adhes Commun. 1996;4(3):149‐158. [DOI] [PubMed] [Google Scholar]
- 33. Yang JT, Hynes RO. Fibronectin receptor functions in embryonic cells deficient in alpha 5 beta 1 integrin can be replaced by alpha V integrins. Mol Biol Cell. 1996;7(11):1737‐1748. [DOI] [PMC free article] [PubMed] [Google Scholar]
- 34. Sun Z, Costell M, Fassler R. Integrin activation by talin, kindlin and mechanical forces. Nat Cell Biol. 2019;21(1):25‐31. [DOI] [PubMed] [Google Scholar]
- 35. McKeown‐Longo PJ, Mosher DF. Interaction of the 70,000‐mol‐wt amino‐terminal fragment of fibronectin with the matrix‐assembly receptor of fibroblasts. J Cell Biol. 1985;100(2):364‐374. [DOI] [PMC free article] [PubMed] [Google Scholar]
- 36. Sechler JL, Takada Y, Schwarzbauer JE. Altered rate of fibronectin matrix assembly by deletion of the first type III repeats. J Cell Biol. 1996;134(2):573‐583. [DOI] [PMC free article] [PubMed] [Google Scholar]
- 37. Tomasini‐Johansson BR, Annis DS, Mosher DF. The N‐terminal 70‐kDa fragment of fibronectin binds to cell surface fibronectin assembly sites in the absence of intact fibronectin. Matrix Biol. 2006;25(5):282‐293. [DOI] [PMC free article] [PubMed] [Google Scholar]
- 38. Tomasini‐Johansson BR, Kaufman NR, Ensenberger MG, Ozeri V, Hanski E, Mosher DF. A 49‐residue peptide from adhesin F1 of Streptococcus pyogenes inhibits fibronectin matrix assembly. J Biol Chem. 2001;276(26):23430‐23439. [DOI] [PubMed] [Google Scholar]
- 39. Chernousov MA, Fogerty FJ, Koteliansky VE, Mosher DF. Role of the I‐9 and III‐1 modules of fibronectin in formation of an extracellular fibronectin matrix. J Biol Chem. 1991;266(17):10851‐10858. [PubMed] [Google Scholar]
- 40. Whelan KA, Caldwell SA, Shahriari KS, et al. Hypoxia suppression of Bim and Bmf blocks anoikis and luminal clearing during mammary morphogenesis. Mol Biol Cell. 2010;21(22):3829‐3837. [DOI] [PMC free article] [PubMed] [Google Scholar]
- 41. Whelan KA, Schwab LP, Karakashev SV, et al. The oncogene HER2/neu (ERBB2) requires the hypoxia‐inducible factor HIF‐1 for mammary tumor growth and anoikis resistance. J Biol Chem. 2013;288(22):15865‐15877. [DOI] [PMC free article] [PubMed] [Google Scholar]
- 42. Barcellos‐Hoff MH, Aggeler J, Ram TG, Bissell MJ. Functional differentiation and alveolar morphogenesis of primary mammary cultures on reconstituted basement membrane. Development. 1989;105(2):223‐235. [DOI] [PMC free article] [PubMed] [Google Scholar]
- 43. Griggs LA, Hassan NT, Malik RS, et al. Fibronectin fibrils regulate TGF‐beta1‐induced epithelial‐mesenchymal transition. Matrix Biol. 2017;60‐61:157‐175. [DOI] [PMC free article] [PubMed] [Google Scholar]
- 44. Park J, Schwarzbauer JE. Mammary epithelial cell interactions with fibronectin stimulate epithelial‐mesenchymal transition. Oncogene. 2014;33(13):1649‐1657. [DOI] [PMC free article] [PubMed] [Google Scholar]
- 45. Balanis N, Wendt MK, Schiemann BJ, Wang Z, Schiemann WP, Carlin CR. Epithelial to mesenchymal transition promotes breast cancer progression via a fibronectin‐dependent STAT3 signaling pathway. J Biol Chem. 2013;288(25):17954‐17967. [DOI] [PMC free article] [PubMed] [Google Scholar]
- 46. Shinde A, Libring S, Alpsoy A, et al. Autocrine fibronectin inhibits breast cancer metastasis. Mol Cancer Res. 2018;16(10):1579‐1589. [DOI] [PMC free article] [PubMed] [Google Scholar]
- 47. Hayman EG, Engvall E, Ruoslahti E. Concomitant loss of cell surface fibronectin and laminin from transformed rat kidney cells. J Cell Biol. 1981;88(2):352‐357. [DOI] [PMC free article] [PubMed] [Google Scholar]
- 48. Young SD, Hill RP. Effects of reoxygenation on cells from hypoxic regions of solid tumors: anticancer drug sensitivity and metastatic potential. J Natl Cancer Inst. 1990;82(5):371‐380. [DOI] [PubMed] [Google Scholar]
- 49. Young SD, Marshall RS, Hill RP. Hypoxia induces DNA overreplication and enhances metastatic potential of murine tumor cells. Proc Natl Acad Sci U S A. 1988;85(24):9533‐9537. [DOI] [PMC free article] [PubMed] [Google Scholar]
- 50. Barrak NH, Khajah MA, Luqmani YA. Hypoxic environment may enhance migration/penetration of endocrine resistant MCF7‐ derived breast cancer cells through monolayers of other non‐invasive cancer cells in vitro. Sci Rep. 2020;10(1):1127. [DOI] [PMC free article] [PubMed] [Google Scholar]
- 51. Zhang M, Gao CE, Chen WL, et al. Opposite response to hypoxia by breast cancer cells between cell proliferation and cell migration: a clue from microRNA expression profile. Oncol Lett. 2018;15(3):2771‐2780. [DOI] [PMC free article] [PubMed] [Google Scholar]
- 52. Wang Y, Wang H, Li J, et al. Direct visualization of the phenotype of hypoxic tumor cells at single cell resolution in vivo using a new hypoxia probe. Intravital. 2016;5(2):e1187803. [DOI] [PMC free article] [PubMed] [Google Scholar]
- 53. Gligorijevic B, Bergman A, Condeelis J. Multiparametric classification links tumor microenvironments with tumor cell phenotype. PLoS Biol. 2014;12(11):e1001995. [DOI] [PMC free article] [PubMed] [Google Scholar]
- 54. Wu C, Bauer JS, Juliano RL, McDonald JA. The alpha 5 beta 1 integrin fibronectin receptor, but not the alpha 5 cytoplasmic domain, functions in an early and essential step in fibronectin matrix assembly. J Biol Chem. 1993;268(29):21883‐21888. [PubMed] [Google Scholar]
- 55. Zhang Z, Morla AO, Vuori K, Bauer JS, Juliano RL, Ruoslahti E. The alpha v beta 1 integrin functions as a fibronectin receptor but does not support fibronectin matrix assembly and cell migration on fibronectin. J Cell Biol. 1993;122(1):235‐242. [DOI] [PMC free article] [PubMed] [Google Scholar]
- 56. Tomasini‐Johansson BR, Zbyszynski PW, Toraason I, Peters DM, Kwon GS. PEGylated pUR4/FUD peptide inhibitor of fibronectin fibrillogenesis decreases fibrosis in murine Unilateral Ureteral Obstruction model of kidney disease. PLoS One. 2018;13(10):e0205360. [DOI] [PMC free article] [PubMed] [Google Scholar]
Associated Data
This section collects any data citations, data availability statements, or supplementary materials included in this article.
Supplementary Materials
Supporting information.
Supporting information.
Supporting information.
Supporting information.
Data Availability Statement
The data that support the findings of this study are available from the corresponding author upon reasonable request.