Summary
The plant immune system is fundamental to plant survival in natural ecosystems and productivity in crop fields. Substantial evidence supports the prevailing notion that plants possess a two-tiered innate immune system, called pattern-triggered immunity (PTI) and effector-triggered immunity (ETI). PTI is triggered by microbial patterns via cell surface-localized pattern-recognition receptors (PRRs), whereas ETI is activated by pathogen effector proteins via mostly intracellularly-localized receptors called nucleotide-binding, leucine-rich repeat receptors (NLRs)1–4. PTI and ETI are initiated by distinct activation mechanisms and involve different early signaling cascades5,6. Here we show that, surprisingly, Arabidopsis PRR/co-receptor mutants, fls2/efr/cerk1 and bak1/bkk1/cerk1 triple mutants, are greatly impaired in ETI responses when challenged with incompatible Pseudomonas syrinage bacteria. We further show that the NADPH oxidase (RBOHD)-mediated production of reactive oxygen species (ROS) is a critical early signaling event connecting PRR- and NLR-mediated immunity and that the receptor-like cytoplasmic kinase Botrytis-induced kinase 1 (BIK1) is necessary for full activation of RBOHD, gene expression and bacterial resistance during ETI. Moreover, NLR signaling rapidly augments the transcript and/or protein levels of key PTI components. Our study supports a revised model in which potentiation of PTI is in fact an indispensable component of ETI during bacterial infection. This revised model conceptually unites two major immune signaling cascades in plants and mechanistically explains some of the long-observed similarities in downstream defense outputs between PTI and ETI.
PRRs are cell surface-localized receptor-like kinases/proteins (RLKs/RLPs) with extracellular ligand-binding domain to sense conserved molecular patterns from diverse microorganisms. NLRs, on the other hand, are mostly intracellular proteins that sense pathogen-derived effector proteins inside the plant cell and can be further classified into the coiled coil (CC)-type, Toll/interleukin-1 receptor/Resistance protein (TIR)-type, or RPW8 (CCR)-type, depending on their N-terminal domain7. Signaling initiated by PRRs and NLRs leads to largely overlapping downstream cellular responses, including defense gene expression, production of ROS and callose deposition8,9, but the mechanism(s) by which this occurs and the nature of potential signal cooperation between cell surface and intracellular perception systems has remained unclear.
Requirement of PRR/co-receptors for ETI
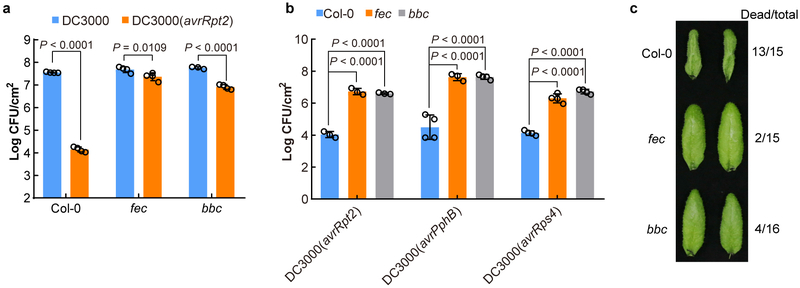
Using the Arabidopsis thaliana-Pseudomonas syringae pathosystem, we discovered a striking and unexpected role of PRR/co-receptors in ETI. Specifically, an “avirulent”, ETI-eliciting bacterial strain, P. s. pv. tomato (Pst) DC3000(avrRpt2), which activates RPS2 (Resistance to P. syringae 2)-dependent ETI in wild-type plants10,11, failed to elicit effective ETI in two separate PRR/co-receptor Arabidopsis mutants, fls2/efr/cerk1 (fec) and bak1/bkk1/cerk1 (bbc) mutants, which lack major PRR/co-receptors recognizing bacteria-associated molecular patterns12. As shown in Extended Data Fig. 1a, the fec and bbc mutants did not mount an effective ETI against Pst DC3000(avrRpt2). The compromised ETI phenotype in fec and bbc mutants also held true for AvrPphB and AvrRps4, which are recognized by RPS513 and RPS414, respectively, in Arabidopsis Col-0 accession (Extended Data Fig. 1b), suggesting a potentially broad role of PRR/co-receptors in ETI. We subsequently focused on AvrRpt2-triggered ETI (ETI hereinafter) for in-depth characterization. Hypersensitive response (HR), manifested by fast cell death during ETI, was found to be delayed in fec and bbc mutants in response to Pst DC3000(avrRpt2), as evidenced by less HR-associated leaf tissue collapse 7h after bacteria infiltration (Extended Data Fig. 1c).
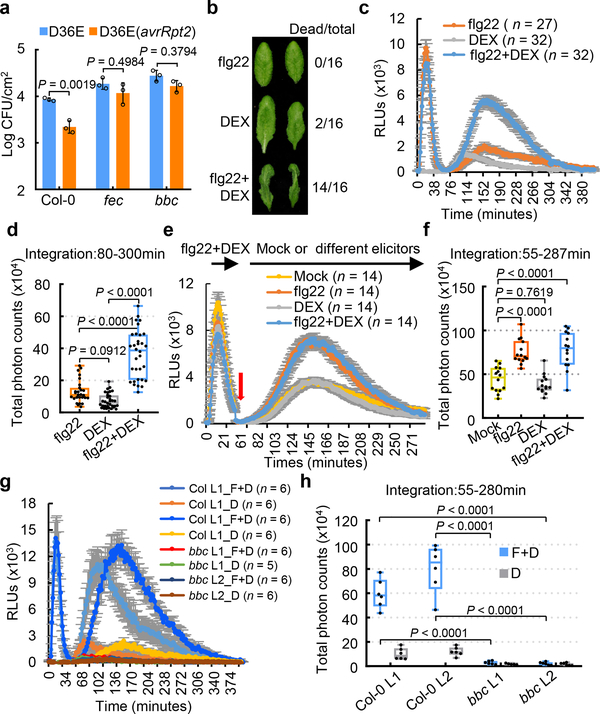
For the past several decades, conventional studies of ETI triggered by Pst DC3000 carrying “avirulent” effector genes have been performed in the presence of all 36 endogenous effector genes in Pst DC3000. Due to interference of PTI and ETI by endogenous Pst DC3000 effectors reported in many studies15,16, it is not always easy to clearly interpret the relationship between PTI and ETI using wild type Pst DC3000 strain to deliver “avirulent” effectors to trigger ETI. We therefore took advantage of the Pst DC3000 strain D36E17, in which all 36 effector genes and coronatine biosynthesis genes are deleted and therefore is expected to activate only PTI, and D36E(avrRpt2) strain, which delivers only AvrRpt2 and activates both PTI and ETI. Although D36E is greatly reduced in virulence compared to Pst DC3000 (Extended Data Fig. 1a), we could still observe a robust AvrRpt2-induced ETI in Col-0 plants, with D36E(avrRpt2) growing significantly less than D36E (Fig. 1a). We found that AvrRpt2-triggered ETI was almost undetectable in either fec or bbc mutant (Fig. 1a).
Fig. 1|. PTI-associated PRR/co-receptors are required for ETI responses and resistance.
a, D36E(avrRpt2) bacteria were infiltrated at OD600=0.004 and populations were determined 4 days post infiltration (dpi). Two-way ANOVA with Tukey’s test. (mean ± s.d.; n = 3 biologically independent samples). b, DEX-induced HR was accelerated by flg22 co-treatment in DEX::avrRpt2 plant. Pictures were taken ~6 h after infiltration of 200nM flg22, 500nM DEX or 200nM flg22+500nM DEX into leaves. c-h, ROS burst detected by luminol-HRP approach in Col-0/DEX::avrRpt2 (c-f) and bbc/DEX::avrRpt2 plants (g, h), with treatment of different elicitors (F+D, flg22+DEX; D, Dex). Total photon counts (d, f, h) are calculated from c, e and g, respectively. e, f, Leaf disks were first treated with flg22+ DEX for 35min, washed with sterilized water four times (red arrow), and then subject to mock (sterilized water), flg22, DEX or flg22+ DEX. Individual data points (n = numbers of leaf disks as biologically independent samples) are plotted with mean ± s.e.m. displayed in d, f, h. Data were analyzed by one-way (d, f) or two-way (h) ANOVA with Tukey’s test. RLUs, relative luminescence units. Box plots: centre line, median; box limits, lower and upper quartiles; whiskers, highest and lowest data points. Experiments in this figure were repeated at least three times with similar trends.
Role of PRR/co-receptors for ROS in ETI
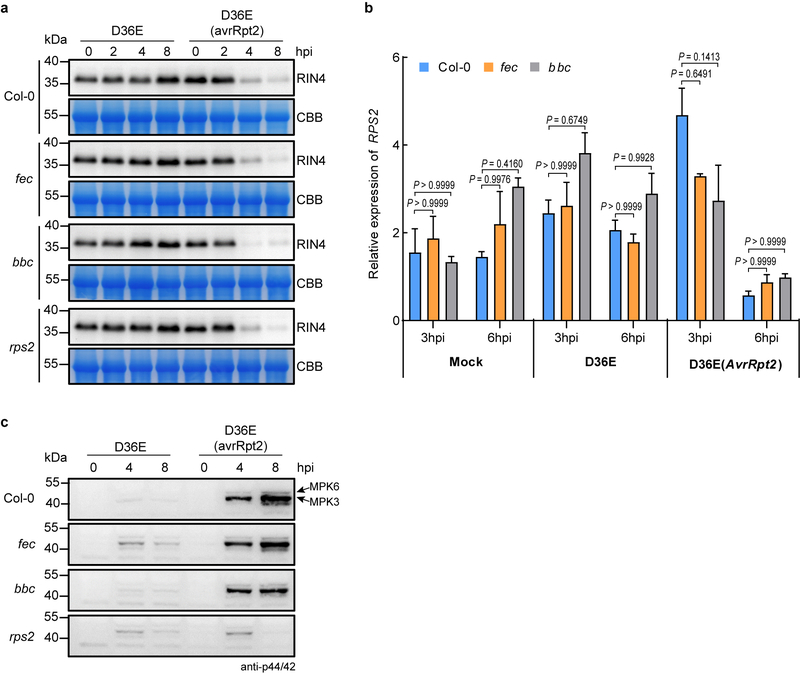
AvrRpt2 cleaves the Arabidopsis protein RIN4 (RPM1-interacting protein 4), leading to activation of RPS210,11. We found that D36E(avrRpt2)-induced RIN4 protein depletion and the RPS2 transcript level was not affected in the fec and bbc mutants (Extended Data Fig. 2a, 2b). We also observed normal ETI-associated MPK3/6 phosphorylation (i.e., at 4 or 8 h post inoculation) in fec and bbc mutants (Extended Data Fig. 2c).
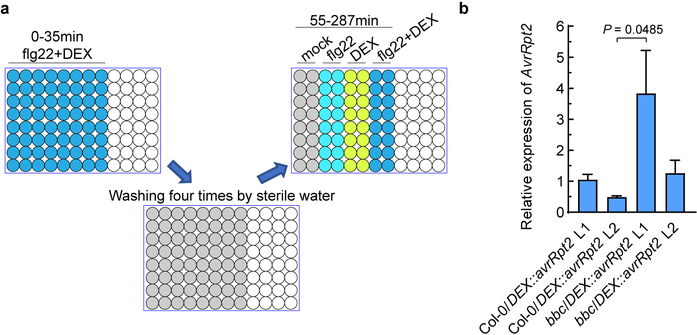
An important immune response associated with both PTI and ETI is production of ROS, which have been proposed to act as defense molecules that kill pathogens and signaling molecules that further activate immune responses18. We examined PTI- and ETI-associated ROS production in transgenic avrRpt2 plants, in which avrRpt2 expression is driven by a dexamethasone (DEX)-inducible promoter19. In this system, PTI and ETI can be initiated separately or in combination using PAMP (e.g., flg22, a 22-aa peptide derived from bacterial flagellin) and DEX treatments. We found that flg22 treatment significantly accelerates AvrRpt2-triggered HR, which is especially notable at early time points (5–6h; Fig. 1b). Furthermore, while flg22 alone triggered a fast and transient ROS burst in 35 min (PTI-ROS hereinafter; Fig. 1c), DEX-induced expression of AvrRpt2 alone triggered only a weak and kinetically slower ROS burst. Interestingly, co-treatment of flg22 and DEX triggered a strong and sustained second-phase ROS burst (ETI-ROS hereinafter), peaking at 2h to 3h after treatment, and lasted for several hours (Fig. 1c, d), a profile that bears a striking similarity to previous observations during bacteria-triggered ETI20,21. To determine whether the second peak of ETI-ROS requires sustained active PTI signaling, we washed off the “flg22+DEX” solution after the first ROS peak (i.e., after 35 min) and then added H2O, flg22, DEX or flg22+DEX (Extended Data Fig. 3a). Results show that ETI-ROS requires newly added flg22 (Fig. 1e, f), suggesting that continued PTI signaling at the second phase is important for ETI-ROS. We further tested the requirement of PTI signaling for ETI-ROS by generating bbc/DEX::avrRpt2 and Col-0/DEX::avrRpt2 plants (Extended Data Fig. 3b). As shown in Fig. 1g, h, in the bbc/DEX::avrRpt2 plants, not only flg22-induced first-phase ROS is absent, but also the ETI-ROS is nearly abolished, clearly demonstrating a requirement of PRR/co-receptor signaling for ETI-ROS production.
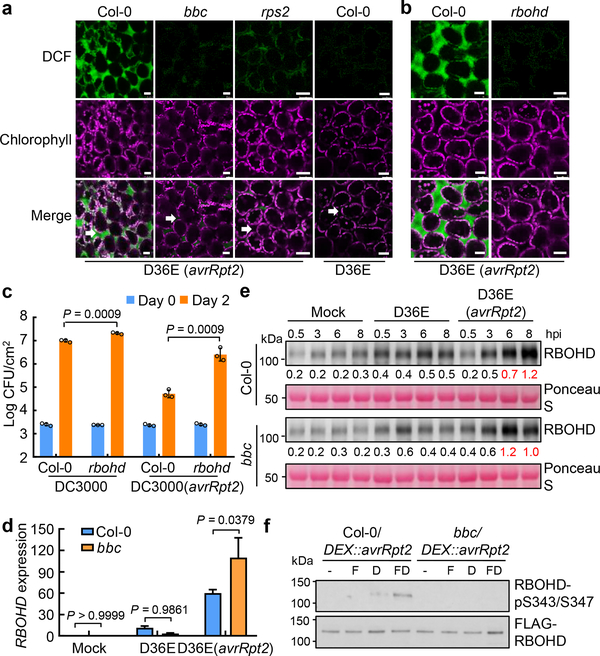
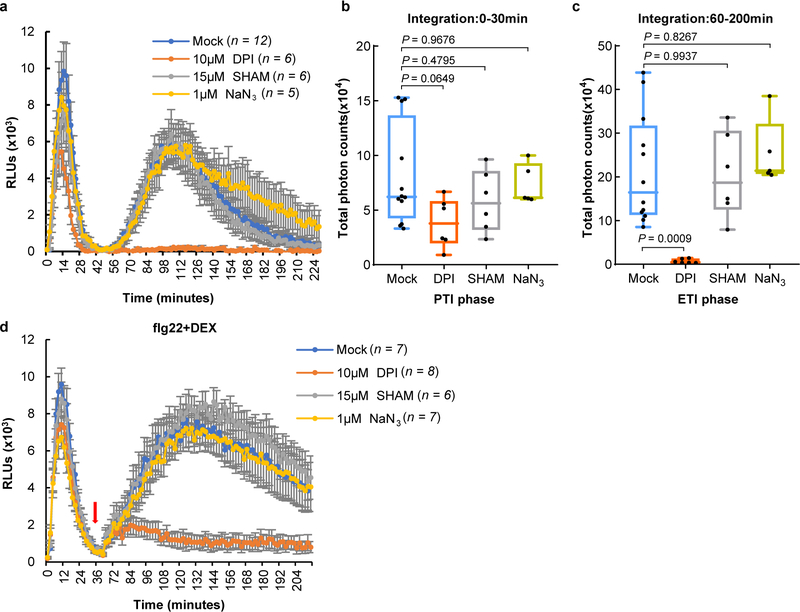
To examine whether PTI- and ETI-associated ROS bursts are produced at the same or different subcellular compartments, ROS production was monitored with the fluorescent dye H2DCFDA22. As shown in Fig. 2a, strong fluorescent signal was detected in the apoplastic spaces of Col-0 leaves 5h post infiltration of D36E(avrRpt2). This signal was much weaker in the bbc mutant leaves, which were indistinguishable from the rps2 control leaves infiltrated with D36E(avrRpt2) or Col-0 leaves infiltrated with D36E (Fig. 2a). Two classes of enzymes, the NADPH oxidases and peroxidases, have been shown to be involved in generating pathogen-associated apoplastic ROS23,24. We therefore investigated which class is involved in the generation of ETI-ROS by using chemical inhibitors diphenylene iodonium (DPI), which inhibits NADPH oxidases, and salicylhydroxamic acid (SHAM) and sodium azide, which inhibit peroxidase activities20,25. As shown in Extended Data Fig. 4a–c, co-treatment of DPI, but not SHAM or sodium azide, with flg22 and DEX greatly diminished ETI-ROS. When we added these inhibitors at 40 min after flg22+DEX treatment (i.e., after PTI-ROS and before the start of ETI-ROS), still only DPI, but not SHAM or sodium azide, greatly diminished ETI-ROS (Extended Data Fig. 4d), indicating that NADPH oxidases mediate ETI-ROS. We further tested whether respiratory burst oxidase homolog D (RBOHD), which plays a prominent role in generating pathogen-induced ROS23,26,27, mediates the ETI-ROS. As shown in Fig. 2b, D36E(avrRpt2)-induced apoplastic ROS was completely lost in the rbohd plant. The rbohd mutant plant also showed a compromised ETI resistance against Pst DC3000(avrRpt2) (Fig. 2c, Extended Data Fig. 5a, b). Altogether, our results suggests RBOHD as a key molecular node connecting PTI and ETI.
Fig. 2|. AvrRpt2-triggered ROS is mediated by RBOHD and requires PRR/co-receptors.
a, b, ROS burst detected with fluorescent dye H2DCFDA in Col-0, bbc, rps2 and rbohd leaves 5h after infiltration of D36E(avrRpt2) or in Col-0 leaves 5h after infiltration of D36E strain. White arrows indicate the apoplast space in the leaf. Scale bars = 25μm. c, Pst DC3000 (avrRpt2) bacteria were infiltrated at OD600=0.001 and bacterial populations were determined 2 dpi. Student’s t-test, two-tailed. Data are displayed as mean ± s.d. (n = 3 biologically independent samples). d, e, RBOHD transcript (d) and protein (e) levels in Col-0 and bbc plants 3h (d) or different time points (e) after inoculation of bacterial strains indicated. d, Data are displayed by mean ± s.e.m. (n = 4 biologically independent samples for “bbc-Mock/D36E” and “Col-0-D36E” and n = 3 biologically independent samples for “Col-0-Mock/D36E(avrRpt2)” and “bbc-D36E(avrRpt2)”). Data were analyzed by two-way ANOVA with Tukey’s test. P-values for additional comparisons are provided in Supplementary Table 3. e, Numbers indicate band intensity relative to that of Ponceau S, quantified by ImageJ. f, Phosphorylation of RBOHD protein at S343/S347 sites. FLAG-RBOHD was transformed into protoplasts, which were then treated with elicitors (-, Mock; F, 100nM flg22; D, 5μM DEX; FD, 100nM flg22+5μM DEX) and harvested 2.5h later for FLAG-RBOHD immunoprecipitation and protein blotting. Experiments in this figure were repeated at least three times with similar trends. For gel source data, see Supplementary Figure 1.
RBOHD activation in PTI and ETI
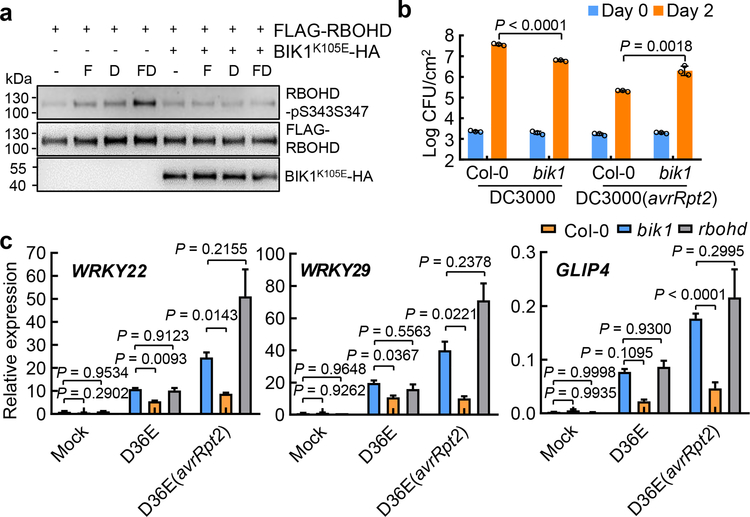
We next assayed the transcript and protein level of RBOHD and found that they are induced both by D36E and, interestingly, to a much higher level, by D36E(avrRpt2) inoculation in Col-0 plant (Fig. 2d, e). However, this strong induction of RBOHD transcript and protein by D36E(avrRpt2) occurred in bbc mutant plants (Fig. 2d, e), pointing to an involvement of post-translational regulation of RBOHD by PRR signaling during ETI. Previous studies have reported several classes of kinases, including calcium dependent protein kinases (CPKs) and BIK1, involved in phosphorylating RBOHD for ROS production18. We found that ETI-ROS was reduced in the bik1 mutant, which was readily observed when bik1 plants were grown in ½ MS agar plates, but did not seem to be affected in the cpk5/6/11 mutant (Extended Data Fig. 6a, b). BIK1 rapidly and transiently (i.e., 15min post-elicitation) phosphorylates RBOHD at multiple sites including S39, S343 and S347 during PTI26,27. We therefore examined RBOHD phosphorylation levels during PTI and/or ETI in protoplasts prepared from Col-0/DEX::avrRpt2 and bbc/DEX::avrRpt2 plants and transformed with a DNA construct expressing FLAG-RBOHD. A 35S promoter was used to express FLAG-RBOHD to ensure similar protein levels during various treatments. We found that DEX alone reproducibly induced a modest phosphorylation of S343/S347 in Col-0/DEX::avrRpt2 leaf protoplasts 2.5h after treatment (Fig. 2f), whereas a flg22+DEX combinational treatment induced a much stronger phosphorylation on S343/S347 (Fig. 2f). In contrast, no phosphorylation was detected in the bbc background with any treatment, confirming the requirement of PRR/co-receptor signaling for RBOHD phosphorylation during ETI. We further found that the phosphorylation of RBOHD at S343/347 during ETI is BIK1-dependent, by examining the S343/347 phosphorylation in protoplasts expressing BIK1K105E-HA, a kinase-dead and dominant-negative version of BIK127 (Fig. 3a) and that ETI-associated restriction of Pst DC3000 (avrRpt2) growth was significantly compromised in the bik1 mutant (Fig. 3b, Extended Data Fig. 5c, d). S343/S347 phosphorylation of RBOHD has previously been shown to be important for ETI resistance and restriction of bacterial growth28. Our results now highlight the importance of PRR and NLR signaling in the coordination of the abundance (i.e., by NLR signaling) and full activity (i.e., by PRR/BIK1 signaling) of RBOHD for generating robust ETI-ROS.
Fig. 3|. BIK1 is required for phosphorylation of RBOHD, immune gene expression and resistance during ETI.
a, Phosphorylation of RBOHD at S343/S347 sites during ETI. Protoplasts from DEX::avrRpt2 plants were transformed with DNA constructs expressing FLAG-RBOHD and/or BIK1K105E-HA as indicated, followed by treatment with 100nM flg22 (F), 5μM DEX (D) or 100nM flg22+5μM DEX (F+D) for 2.5h before immuno-precipitation and protein blotting. b, Pst DC3000 (avrRpt2) bacteria were infiltrated into Arabidopsis leaves at OD600=0.001 and bacterial populations were determined 2 dpi. Student’s t-test, two-tailed. Data are displayed as mean ± s.d. (n = 3 biologically independent samples). c, qRT-PCR analysis of WRKY22, WRKY29 and GLIP4 expression level in Col-0, bik1 and rbohd plants 3h after infiltration with different bacterial strains or mock. Data shown are mean ± s.e.m. (n = 4 biologically independent samples; statistical analysis by two-way ANOVA with Tukey’s test; different letters indicate statistically significant difference). Experiments in this figure were repeated at least three times with similar trends. For gel source data, see Supplementary Figure 1.
PTI- and ETI-associated transcriptomes
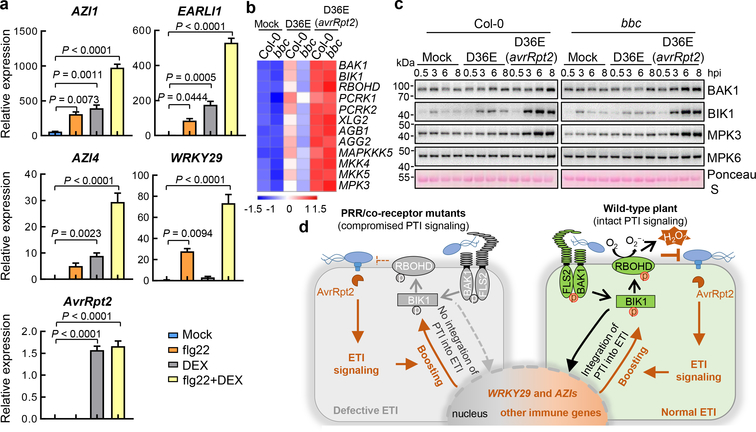
The requirement of PTI signaling for activation of RBOHD and a strong up-regulation of RBOHD during ETI (Fig. 2d, e) were intriguing and suggested that ETI may have evolved to co-opt RBOHD and other components of the PTI pathway as an integral part of its signaling mechanism. We therefore examined the expression patterns of other components of the PTI pathway and the rest of Arabidopsis transcriptome by RNAseq (Extended Data Fig. 7a, b). We found that, at 3h post infiltration, D36E(avrRpt2) already caused global differential expression compared to D36E in Col-0 plant (Extended Data Fig. 7c), suggesting that 3h is sufficient for delivery of AvrRpt2 into the plant cell and triggering ETI-associated gene expression. Many genes are differentially regulated at this early time point between Col-0 and bbc plants in response to PTI-inducing D36E (Extended Data Fig. 7d). Interestingly, the majority of these genes show similar expression pattern in Col-0 and bbc plants after D36E(avrRpt2) inoculation (Extended Data Fig. 7d), suggesting that ETI can largely restore PTI-associated global gene expression in the bbc plant. Similar trends were observed for genes associated with salicylic acid, jasmonate and ethylene pathways (Extended Data Fig. 7e–g). We did notice that a subset of 272 genes were differentially expressed in bbc plants after D36E(avrRpt2) inoculation (Supplementary Table 1). In particular, a cluster of WRKY genes including WRKY22/29 and FRK1, which are canonical marker genes of flg22-induced PTI pathway29, are down-regulated in the bbc plant (Extended Data Fig. 8a, b). This suggests that the WRKY-FRK1 branch represents a unique immune branch, the activation of which during ETI requires PRR/co-receptors. Interestingly, BIK1, but not RBOHD, was necessary for the full expression of several examined genes, such as WRKY22 and WRKY29, after D36E(avrRpt2) inoculation (Fig. 3c). This suggests that BIK1 is one of the integration points for ETI-ROS burst and a subset of immune gene expression during ETI. Gene expression analysis in the DEX::avrRpt2 plants confirmed ETI-mediated boosting of immune gene expression (e.g., WRKY29, AZI1, EARLI1 and AZI430) (Fig. 4a) and also suggested a basal role of PRR/co-receptors per se in ETI-associated gene expression in the absence of PRR signaling activation by flg22 (Extended Data Fig. 8c).
Fig. 4|. ETI upregulates key components of the PTI pathway.
a, Expression levels of AvrRpt2, WRKY29, AZI1, EARLI1 and AZI4 genes in DEX::avrRpt2 transgenic plants after different elicitors treatment. Leaves were harvested 2h post infiltration for transcript analysis (mean ± s.e.m; n = 3 biologically independent samples). Statistical analysis by one-way ANOVA with Tukey’s test. P-values for additional comparisons are provided in Supplementary Table 3. b, Heat map of the expression pattern of PTI pathway genes. c, Protein levels of BAK1, BIK1, MPK3 and MPK6 in Col-0 and bbc plants at different time points after inoculation of bacterial strains indicated. MPK6 protein is not induced by ETI and serves as an internal control. These experiments were repeated at least three times with similar trends. e, A model depicting findings from this study showing PTI as a key component of ETI. In wild-type plant, RPS2 activation leads to protein accumulation of key PTI components such as BIK1 and RBOHD and potentiation of PTI-associated genes such as WRKY29 and AZIs. PRR/co-receptors are required for fully “activating” ROBHD (by phosphorylation) to generate robust ROS and normal ETI. In the absence of PRR/co-receptors (left panel), although NLR activation still induces PTI components, many of these components like BIK1 and RBOHD are inactive, leading to lack of ROS production and defective ETI. Grey color indicates mutated (i.e., FLS2 and BAK1) or inactive (i.e. RBOHD and BIK1) proteins and green color indicates active proteins. For gel source data, see Supplementary Figure 1.
Increase of key PTI components in ETI
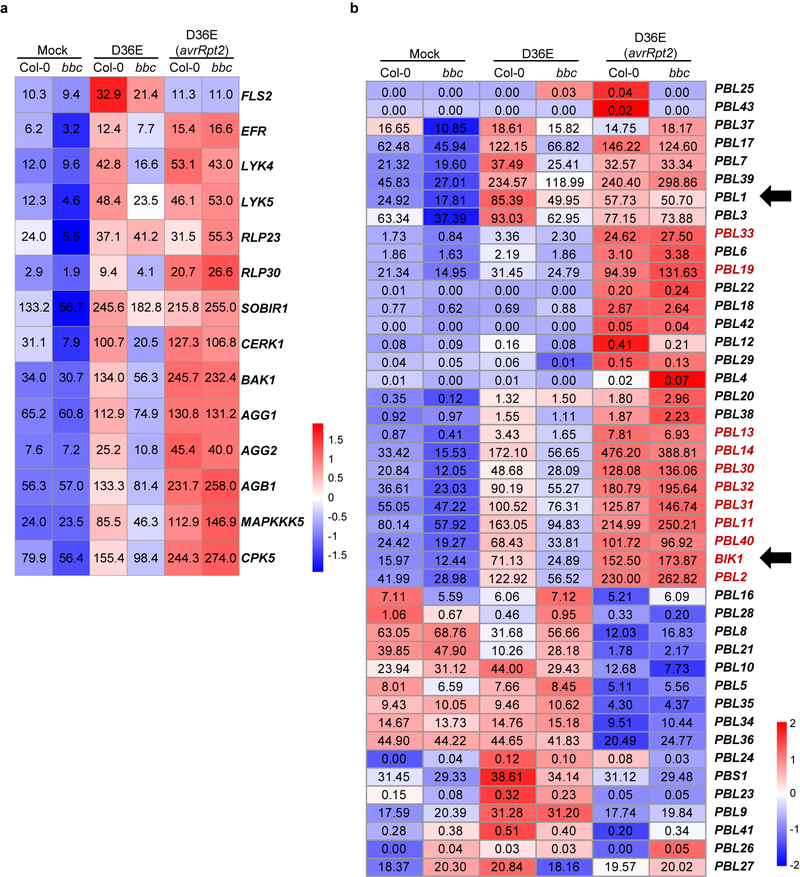
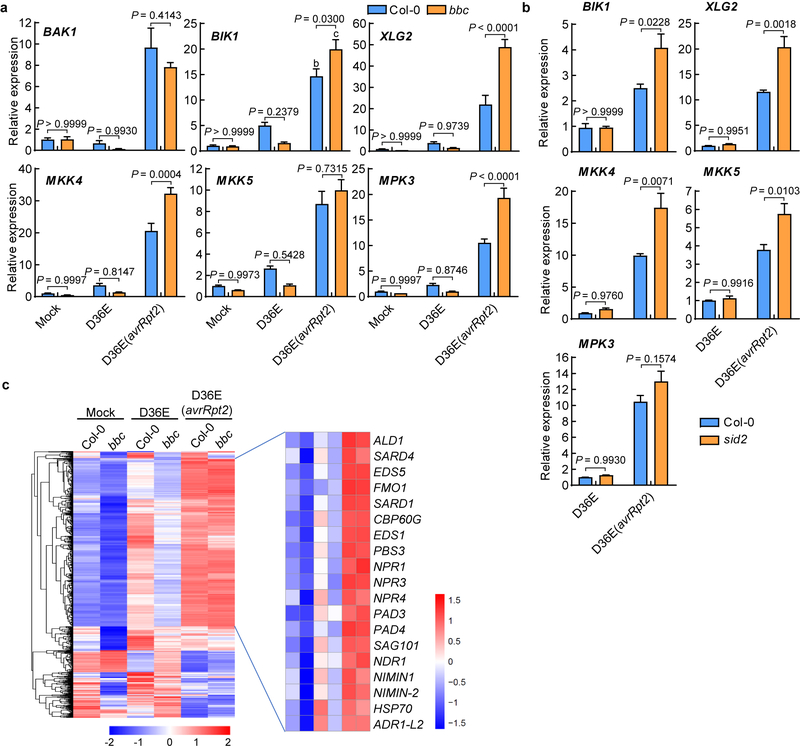
Further analysis of PTI- and ETI-associated transcriptomes revealed an interesting expression pattern for many PTI signaling genes. We found that PTI-inducing D36E can moderately induce many key PTI components, namely BAK1, BIK1, XLG2/AGB1/AGG231, MAPKKK5, MKK4/5 and MPK3, that are associated with RLK/RLP -initiated pathways. However, ETI-inducing D36E(avrRpt2) induced these genes to a much higher level (Fig. 4b; Extended Data Fig. 9a). Similar to RBOHD, the strong induction of these PTI components by ETI is independent of PRR/co-receptors, since it occurs in the bbc mutant. Upregulation of PRR-encoding genes such as FLS2, EFR (Elongation factor Tu receptor) and LYK5 (Lysin motif receptor kinase 5)2 was not observed during AvrRpt2-ETI in bacteria-infected Col-0 plants (Extended Data Fig. 9a), but was observed in transgenic plants expressing AvrRpt2 or AvrRps4 (see Ngou et al). This difference may reflect different ETI signal input strengths. Regardless, the robust upregulation of common co-receptors and other early signaling components, instead of individual PRRs, may represent an evolutionally “smart” way that enables plants to strengthen immunity irrespective of the specific type of pathogens. Notably, BIK1 and some other PBLs, but not PBL1, are strongly induced after D36E(avrRpt2) inoculation (Extended Data Fig. 9b), suggesting differential contribution of different members of the BIK1/PBL family to ETI. Quantitative RT-PCR and western blot analysis confirmed the up-regulation of several PTI key components during ETI in Col-0 and bbc plants (Fig. 4c, Extended Data Fig. 10a). Our results, together with Ngou et al, suggest that part of ETI signaling is to rapidly induce high-level expression of key components of the PTI pathway, including BAK1, BIK1 and RBOHD. Further analysis showed that this “re-enforcement” of the PTI pathway during AvrRpt2-ETI also occurs in the SA biosynthesis mutant, sid2 (Extended Data Fig. 10b), and, furthermore, SA- (Extended Data Fig. 7e) and N-hydroxy-pipecolic acid (NHP)- (Extended Data Fig. 10c) responsive genes expressed at similar levels in Col-0 and bbc plants during ETI in our RNAseq.
Discussion
Our study reveals a surprising requirement of PRR/co-receptor signaling for effective ETI and supports a mechanistic model in which ETI co-opts part of the PTI machinery as an indispensable component (Fig. 4d). In particular, we found that PRRs and NLRs, the two primary classes of plant immune receptors, function synergistically to ensure a fully “active status” as well as “robust level” of key immune components, including the BIK1-RBOHD module, which mediates ETI-ROS generation, full immunity-associated gene expression and disease resistance during ETI. Intriguingly, a synergistic interaction between cell surface and intracellular immune receptors in animals and humans has also been reported32, suggesting a possible conceptual parallel in immune receptor functions across different kingdoms of life. Our study sheds light on a long-standing puzzle in the field of plant immunity with respect to the enigmatic similarity between PTI- and ETI-associated cellular features. Results could have broad practical implications as well, as it suggests a possibility for carefully controlled augmentation of PTI components as a new strategy to broadly increase the effectiveness of ETI against numerous diseases in crop plants.
Methods
Plant materials and growth conditions
Arabidopsis thaliana plants used in this study are in Col-0 ecotype background. The fls2/efr/cerk133, bak1/bkk1/cerk112, rps234, rbohd23, bik135, cpk5/6/1136 mutants were reported previously. Plants were grown in potting soil in environmentally-controlled growth chambers, with relative humidity set at 60% and temperature at 22°C with a 12h light/12h dark photoperiod unless stated otherwise. Four- to five-week-old plants were used for all experiments in this study. To generate the bbc/DEX::avrRpt2 and Col-0/DEX::avrRpt2 transgenic plants, the avrRpt2 gene was cloned into pBUD-DEX (pBD) vector in the XhoI/SpeI restriction enzyme sites, and the expression cassette was introduced into Col-0 or bbc plants by Agrobacterium-mediated transformation. The bik1 plants for disease assays were grown on Redi-Earth soil (Sun Gro Horticulture), under relative humidity set at 60%, temperature at 23°C, light intensity at 100 μE⋅m2⋅s and photoperiod at a 12 h light-12 h dark cycle.
Bacterial disease and HR assays
The Pst DC3000 strains carrying avrRpt2, avrRps4 and avrPphB were published previously37–39. The D36E(avrRpt2) strain was generated by transforming the avrRpt2 expression plasmid into D36E strain by electroporation. For bacterial inoculation, Pst strains were cultured in Luria-Marine (LM) medium overnight at 30°C to a cell density of OD600=0.8–1.0. Bacteria were collected by centrifugation and washed once with sterile water, and adjusted to a cell density of OD600=0.2. For disease assay, bacterial suspension was further diluted to a cell density of OD600=0.001–0.002. Bacteria were infiltrated into leaves with a needleless syringe, and inoculated plants were kept under ambient humidity for about 1h to allow evaporation of excess water from the leaf and then covered with a transparent plastic dome to keep high humidity for disease to develop. For quantification of bacteria, four leaf discs from two different leaves (after surface sterilization) were taken using a cork borer (7.5mm in diameter) as one biological repeat, and 3–4 repeats were taken for each treatment (repeat numbers are different across treatments in cases of not sufficient healthy plants). Leaf discs were ground and diluted in sterile water, and the extraction solutions were then plated on LM agar plates supplemented with rifampicin (at 50mg/L). Colonies were counted with a stereoscope 24h after incubation at 30°C. For HR assay, Pst DC3000(avrRpt2) suspension was prepared as described above and bacterial suspension at the cell density of OD600=0.2 was syringe-infiltrated into leaves. Plants were then kept under ambient humidity for about 7h before tissue collapse was recorded. For HR assay in DEX::avrRpt2 plants, four-week old plant leaves were infiltrated with 200nM flg22, 500nM DEX or 200nM flg22+500nM DEX, respectively. Fully-expanded leaves at a similar developmental stage were chosen (about 3 leaves per plant) for treatments. Severely wounded leaves were discarded in final counting. Infiltrated plants were kept under ambient humidity and pictures were taken 5–6 h after infiltration.
RIN4 cleavage assays
Arabidopsis plant leaves were infiltrated with Pst D36E or Pst D36E(avrRpt2) (at OD600=0.1), and samples were collected at 0, 2, 4, 8h after infiltration by snap-freezing in liquid nitrogen. Three leaves were collected as one biological repeat. Total proteins were extracted in protein extraction buffer (50mM Tris-HCl pH 7.5, 150mM NaCl, 5mM EDTA pH 7.5, 1mM DTT, 1% Triton X-100, 1mM Phenylmethylsulfonyl fluoride) supplemented with 1 × plant protease inhibitor cocktail (Complete EDTA-free, Roche). Cell lysates were centrifuged at 12,000 × g for 15min at 4°C, and the pellet was discarded. Protein concentration of the supernatant (“total protein extract”) was determined by Bradford protein assay kit (Bio-Rad). An equal amount of total protein was loaded on 12% SDS acrylamide gels (Bio-Rad) for SDS-PAGE. RIN4 protein was detected by anti-RIN4 antibody at a dilution of 1:100040. Goat Anti-Rabbit lgG HRP (Abmart; 1:5000) was used as secondary antibody. The protein image was taken using the Tanon-5200 imaging system (Tanon). Total proteins were stained by Coomassie Brilliant Blue (CBB) to show equal loading.
MAPK kinase activity assay
Four-week-old plant leaves were infiltrated with Pst D36E or Pst D36E(avrRpt2) (at OD600=0.02), and leaves were collected at different time points by snap-freezing in liquid nitrogen. Proteins were extracted in protein extraction buffer (50mM Tris-HCl pH 7.5, 150mM NaCl, 5mM EDTA pH 7.5, 1mM DTT, 1% Triton X-100, 1mM Phenylmethylsulfonyl fluoride) supplemented with 1 × plant protease inhibitor cocktail (Complete EDTA-free, Roche) and 1 × phosphatase inhibitor cocktail (PhosSTOP, Roche). Total protein concentration was determined with Bradford protein assay kit (Bio-Rad). An equal amount of protein was loaded onto 12% SDS-PAGE gel for western blot. Phosphorylated MPK3 and MPK6 proteins were detected by anti-Phospho-p44/42 antibody (Cell Signaling Technology; 1:1000). Goat Anti-Rabbit lgG HRP (Abmart; 1:5000) was used as secondary antibody. The protein image was taken using the Tanon-5200 imaging system (Tanon).
Protein extraction and immunoblotting for PTI signaling components
Four-week-old plant leaves were infiltrated with sterile water (mock) or different Pst strains at OD600=0.02, and samples were collected at 0.5, 3, 6, 8h after infiltration. Three to four leaves from different plants were collected as one sample. Protein was extracted using Plasma Membrane Protein Isolation Kit (Invent) according to the manufacturer’s protocol. Concentration of the cytosolic protein was determined with Bradford protein assay kit (Bio-Rad). An equal amount of protein was loaded onto SDS-PAGE gel for western blot. BAK1 and RBOHD are detected in the immunoblot of total membrane fraction and other proteins are detected in the immunoblot of total protein extracts. Different PTI components were detected by following antibodies with indicated dilution: anti-RBOHD (Agrisera), 1:1000; anti-BAK1 (Agrisera), 1:5000; anti-BIK1 (Agrisera), 1:3000; anti-MPK3 (Sigma-Aldrich), 1:2500; anti-MPK6 (Sigma-Aldrich), 1:5000. Goat Anti-Rabbit lgG HRP (Abmart; 1:5000) was used as secondary antibody. The protein image was taken using the Tanon-5200 imaging system (Tanon).
Protoplast transformation and detection of RBOHD phosphorylation
Protoplasts were prepared from Col-0/DEX::avrRpt2 and bbc/DEX::avrRpt2 plants (4–5 weeks old; grown under 10h light/14h dark photoperiod) and transfected with FLAG-RBOHD plasmid. After overnight incubation to allow protein accumulation, protoplasts were treated with 100nM flg22, 5μM DEX or 100nM flg22+5μM DEX and incubated for 2.5h. Total protein was extracted with protein extraction buffer (50 mM HEPES [pH 7.5], 150 mM KCl, 1 mM EDTA, 0.5% Trition-X100, 1 mM DTT, protease inhibitor cocktail), and then incubated with 50μL anti-FLAG M2 agarose beads (Sigma-Aldrich) for 2 h at 4°C. The bound protein was eluted with 50μL of 0.5mg/mL 3xFLAG peptide for 30 min. Total RBOHD was detected by FLAG antibody (Sigma-Aldrich; 1:5000). RBOHD phosphorylation was detected by immunoblotting with RBOHD-pS343/347 antibody published previously27. To determine whether BIK1 is important for phosphorylating RBOHD during ETI, DEX::avrRpt2 transgenic plants were grown under the 10h light/14h dark photoperiod for 4 to 5 weeks, and protoplasts were prepared (from 40–50 fully expanded leaves) and transformed with FLAG-RBOHD plasmid alone or co-transformed with FLAG-RBOHD and BIK1K105E-HA plasmids27. After elicitor treatment (see above), total proteins were extracted using the protein extraction buffer (50 mM HEPES [pH 7.5], 150 mM NaCl, 5 mM EDTA, 0.5% Trition-X100, 0.1% IGEPAL CA-630, 10% glycerol, 1 mM DTT, protease inhibitor cocktail and PhosSTOP cocktail) by incubating protoplasts with extraction buffer on ice for 1 h. Supernatant was collected after centrifugation at 12,000 rpm at 4°C for 20min and incubated with 50μL anti-FLAG M2 agarose beads (Sigma-Aldrich) for 2.5h at 4°C. The bound proteins were eluted with 120μL of 0.3mg/mL 3xFLAG peptide (Sigma-Aldrich) after incubation at 4°C for 1h. RBOHD phosphorylation was detected by immunoblotting using the RBOHD-pS343/347 antibody (1:1000), and BIK1K105E-HA was detected using the anti-HA antibody (Abmart). Goat Anti-Rabbit lgG HRP (Abmart; 1:5000) or Goat Anti-Mouse lgG HRP (Abmart; 1:5000) were used as secondary antibody. The protein image was taken using the Tanon-5200 imaging system (Tanon).
ROS detection
ROS measurement with luminol-based approach was performed as previously described with minor modification26. Briefly, leaf discs of four-week-old Arabidopsis plants were harvested using a cork borer (5.5mm in diameter) and floated on 200μL sterile water in a 96-well plate, and then incubated overnight at room temperature under continuous light. On the next day, water was replaced with a solution containing 30mg/L (w/v) luminol (Sigma-Aldrich) and 20mg/L (w/v) peroxidase from horseradish (Sigma-Aldrich) with 100nM flg22 only, 5μM DEX only or 100nM flg22+5μM DEX. The luminescence was detected for 5–6h with a signal integration time of 1 or 2min using Varioskan Flash plate reader (Thermo Fisher Scientific) and analyzed by SkanIt™ Software (Thermo Scientific; 6.0). For determining the effects of chemical inhibitors, 10μM diphenyleneiodonium (DPI; Sigma-Aldrich), 15μM salicylhydroxamic acid (SHAM; Sigma-Aldrich) or 1μM sodium azide was added to the elicitation solution at indicated time points and luminescence was recorded as described above. To examine whether co-treatment of flg22 and DEX is important for production of ETI-ROS, leaf discs from Col-0/DEX::avrRpt2 transgenic plants were first treated with flg22+DEX for 35min, during which the production of ROS was detected by a microplate reader. Then the leaf discs were washed with sterile water 4 times, 5min each time with gentle agitation of leaf disc-containing plates. Then sterilized water (mock), 100nM flg22, 5μM DEX or 100nM flg22+5μM DEX was added to the leaf discs and ROS burst was recorded. For detection of ROS production by 2’,7’-Dichlorofluorescein diacetate (H2DCFDA) under confocal microscopy, plants were infiltrated with Pst D36E (OD600=0.02) or D36E(avrRpt2) (OD600=0.02), air-dried and put back into the plant growth room. ROS was detected at 4–5h post infiltration. Ten μM of H2DCFDA solution was infiltrated into the leaf and fluorescence signal was detected 10 min later. Images were captured using a Leica SP8 microscope with a 488nm excitation and 501–550nm emission, and chlorophyll auto-fluorescence was detected at 640–735nm.
RNA extraction and qRT-PCR analysis of gene expression
To analyze gene expression levels, four-week-old Arabidopsis plant leaves were infiltrated with sterile water (mock) or different Pst strains at OD600=0.04, and then harvested at indicated time points. Three leaves from different plants were collected as one biological replicate and 4 replicates were collected for each treatment. For analysis of genes expression in DEX::avrRpt2 plants, leaves from four-week-old plants (grown under the 10h/14h light/dark photoperiod) were infiltrated with 20nM flg22, 50nM DEX or 20nM flg22+ 50nM DEX, respectively. We used low concentrations of elicitors, which are presumed to be closer to the physiological level, so that induction of gene expression by either pathway alone is not saturated and the individual contribution and a possible synergistic effect of PTI and ETI can be observed. At 2h post infiltration, two leaves from two different plants were harvested as one biological replicate for gene transcript analysis (replicate numbers are different across treatments in cases of not sufficient healthy plants). Samples were frozen and ground in liquid nitrogen. Total mRNA was extracted using Trizol reagent (Invitrogen) according to the manufacturer’s protocol. One μg of RNA was used for reverse transcription using the ReverTra Ace® qPCR RT Master Mix with gDNA remover (TOYOBO). Real-time qPCR analysis was carried out with the SYBR®Green Realtime PCR Master Mix (TOYOBO) on a CFX real-time machine (Bio-Rad). Two technical repeats were performed for each sample. The plant U-box gene was used as reference gene for normalization. Primer sequences for qPCR are listed in Supplementary Table 2.
cDNA library generation and RNAseq
For RNAseq experiments, bacterial inoculation and sample collection were performed as described above. Two leaves from different plants were harvested as one replicate, and four biological replicates were collected for each treatment/time point. Total mRNA was extracted using Trizol reagent (Invitrogen). Total RNA was then treated with DNase I (Invitrogen) to remove DNA and purified RNA was recovered with RNeasy® MinElute™ Cleanup kit (QIAGEN) according to the manufacturer’s instructions. Library construction and RNA sequencing were performed by Novogene company. Briefly, RNA purity and integrity was examined using the NanoPhotometer® spectrophotometer (IMPLEN) and the RNA Nano 6000 Assay Kit of the Bioanalyzer 2100 system (Agilent Technologies). RNA concentration was measured with Qubit® RNA Assay Kit in Qubit® 2.0 Flurometer (Life Technologies). One μg RNA per sample was used as input material for library preparation and sequencing. Sequencing libraries were generated using NEBNext® Ultra™ RNA Library Prep Kit for Illumina® (NEB), following the manufacturer’s recommendations and sequenced on Illumina Hiseq platform and 150 bp paired-end reads were generated.
Data analysis of RNA-seq
Clean raw data were obtained by removing reads containing adapter sequences or ploy-N and low-quality reads and were then mapped to the Arabidopsis genome (TAIR10). Gene expression levels were calculated using the TPM method (Transcripts per Kb of exon model per Million mapped reads). Differential expression analysis was performed using the DESeq R package (1.18.0). The resulting P-values were adjusted using the Benjamini and Hochberg’s approach for controlling the false discovery rate. Genes with an q-value < 0.05 and log2(Fold change) > 1 found by DESeq were assigned as differentially expressed.
Statistical analysis
All statistical analyses were performed by one-way or two-way analysis of variance (ANOVA) with GraphPad software or by two sided student’s t-test with Office Excel software. Each experiment was repeated at least three times and data were represented as the mean ± standard error of mean (s.e.m.) or standard deviation (s.d.) as indicated.
Data availability
The RNAseq data has been deposited into GEO (Gene Expression Omnibus) repository on NCBI (GSE142747). All data is available in the main text or the supplementary materials. Source data for western blots and graphs in main figures and Extended Data Figures are provided in Supplementary Figure 1(i.e., uncropped gels for western blots) and Source Data files (i.e., original data points for graphs).
Extended Data
Extended Data Fig. 1|. PRR/co-receptors are required for ETI elicited by different P. syringae avirulent effectors.
a, Pst DC3000 (avrRpt2) bacteria were infiltrated into Arabidopsis leaves at OD600=0.002 and populations were determined 3 days post infection (dpi). (mean ± s.d.; n = 4 biologically independent samples, except n = 3 biologically independent samples for “bbc-DC3000”). Data were analyzed using two-way ANOVA with Tukey’s test. b, AvrPphB- and AvrRps4-mediated ETI are also compromised in fec and bbc mutants. Plants were infiltrated with different strains at OD600=0.002. Bacterial populations were determined 3 days post inoculation. Data were analyzed using two-way ANOVA with Tukey’s test. (mean ± s.d.; n = 3 (Col-0/fec/bbc-DC3000(avrRpt2) and fec-DC3000(avrPphB)) or 4 (Col-0/fec/bbc-DC3000(avrRps4) and Col-0/bbc -DC3000(avrPphB)) biologically independent samples). c, HR was compromised in PRR/co-receptor mutants. Pst DC3000 (avrRpt2) bacteria were infiltrated at OD600=0.2 and pictures were taken ~7 h post infiltration (hpi). Experiments were repeated three times with similar trends.
Extended Data Fig. 2|. RIN4 cleavage, transcript level of RPS2 and activation of MAPK cascades are not altered in the fec and bbc mutant plants.
a, RIN4 cleavage in Col-0 and the PRR/co-receptor mutants after D36E or D36E(avrRpt2) inoculation. CBB, Coomassie Brilliant Blue staining. An equal amount of total protein was loaded in each lane. b, RPS2 transcript levels in the fec and bbc mutant plants were similar to those in Col-0 plants after inoculation of bacterial strains indicated. Statistical analysis was performed using two-way ANOVA with Tukey’s test. (mean ± s.e.m; n = 3 biologically independent samples). c, MPK3/6 phosphorylation in Col-0 and the PRR/co-receptor mutants after D36E or D36E(avrRpt2) inoculation. An equal amount of total protein was loaded in each lane. Experiments were repeated at least three times with similar trends. For gel source data, see Supplementary Figure 1.
Extended Data Fig. 3|. Characterization of different lines of bbc/DEX::avrRpt2 plants.
a, Schematic diagram of the experimental design. Leaf discs were first treated with flg22+DEX for 35min, and the production of ROS was detected by a microplate reader. Leaf discs were then washed with sterilized water for 4 times, 5min each time. Sterilized water (mock), 100nM flg22, 5μM DEX or 100nM flg22+5μM DEX was then added for detection of second-phase ROS. b, Expression levels of the avrRpt2 transgene in different transgenic lines 2h after infiltration with 5μM DEX. Statistical analysis was performed using one-way ANOVA with Tukey’s test. (mean ± s.e.m.; n = 3 (Col-0/DEX::avrRpt2 L2, bbc/DEX::avrRpt2 L1, bbc/DEX::avrRpt2 L2) or 4 (Col-0/DEX::avrRpt2 L1) biologically independent samples). Experiments were repeated three times with similar trends.
Extended Data Fig. 4|. AvrRpt2-triggered ETI-ROS depends on NADPH oxidase.
a-c, ROS production in Col-0/DEX::avrRpt2 L1 plants was inhibited by NADPH oxidase inhibitor DPI. Leaf discs were treated with 100nM flg22 and 5μM DEX. DPI, SHAM and NaN3 were added at the beginning of measurement (mean ± s.e.m.; n (numbers of leaf disks) are indicated in the panel). b-c, Total photon counts are calculated from a at the PTI phase (0–30min) or ETI phase (60–200min). Statistical analysis was performed by one-way ANOVA with Tukey’s test. d, ETI-associated ROS burst is inhibited by DPI, an NADPH oxidase inhibitor. ROS was detected in Col-0/DEX::avrRpt2 plants after treatment of 100nM flg22 and 5μM DEX. Chemical inhibitors (DPI, SHAM or NaN3) were added after the first ROS burst (about 40min after addition of flg22 and DEX). Data are displayed as mean ± s.e.m. n (numbers of leaf disks) are indicated in the panel. Box plots: centre line, median; box limits, lower and upper quartiles; dots, individual data points; whiskers, highest and lowest data points. Experiments in this figure were repeated three times with similar trends.
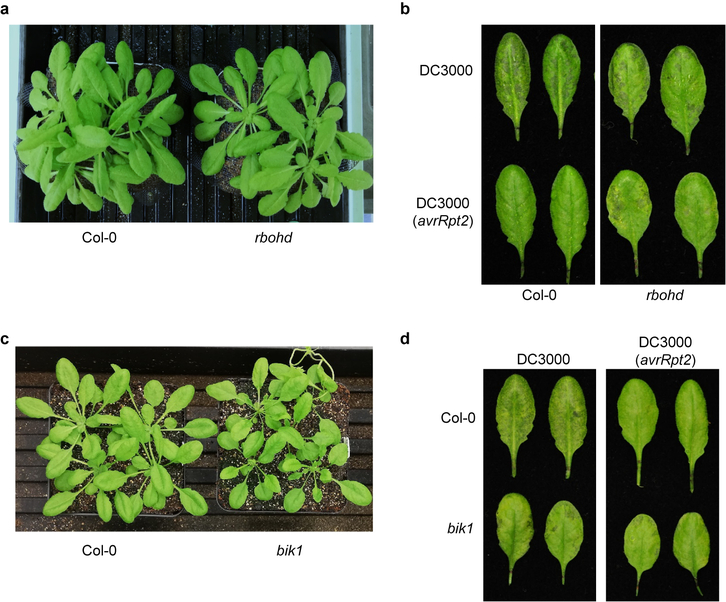
Extended Data Fig. 5|. The rbohd and bik1 mutant plants are compromised in ETI resistance against Pst DC3000(avrRpt2).
a, Appearance of the 5 week-old rbohd mutant plants before bacteria inoculation. b, Disease symptom of Col-0 and rbohd mutant plant 2 days after Pst DC3000 and Pst DC3000 (avrRpt2) infiltration. c, Appearance of the 4.5 week-old bik1 mutant plants growth in redi-earth soil before bacteria inoculation. d, Disease symptom of Col-0 and bik1 mutant plant 2 days after Pst DC3000 and Pst DC3000 (avrRpt2) infiltration. Experiments in this figure were repeated three times with similar trends.
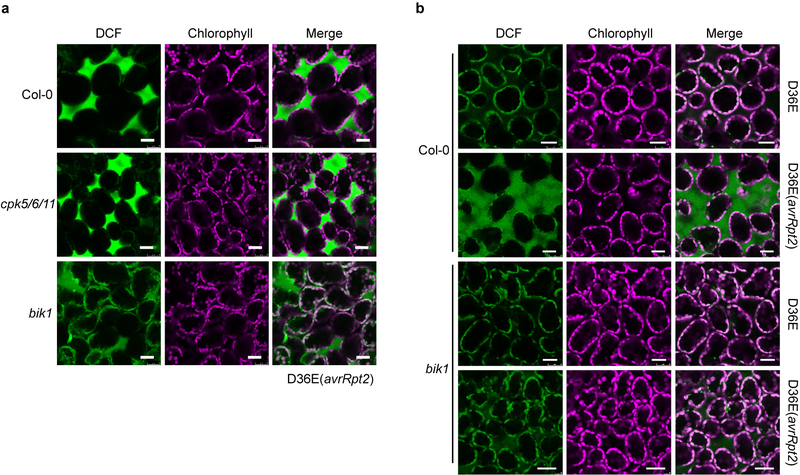
Extended Data Fig. 6|. The AvrRpt2 ETI-associated ROS burst is partially mediated by BIK1.
a, ROS was detected in the bik1 and cpk5/6/11 mutant plants by H2DCFDA dye 4.5 h after D36E (avrRpt2) inoculation. Scale bars = 25 μm. b, ROS was detected in the bik1 mutant plants by H2DCFDA dye 5 h after D36E or D36E (avrRpt2) inoculation. Plants were grown on 1/2MS plate for 3 weeks. Scale bars = 25 μm. Experiments in this figure were repeated three times with similar trends.
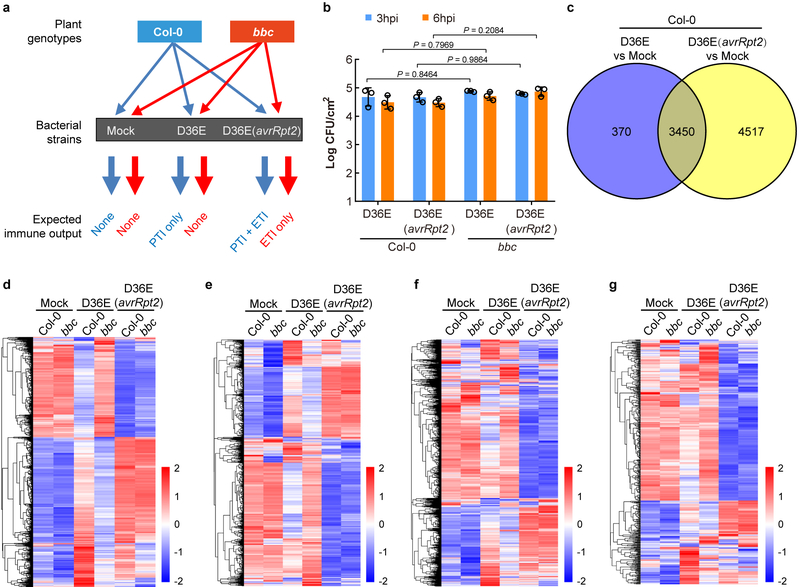
Extended Data Fig. 7|. Transcriptomic analysis of RNAseq experiments.
a, A diagram showing the RNAseq design in this study. b, Bacterial population in Arabidopsis leaves at 3h or 6h post infiltration. Data are displayed by mean ± s.d. (n = 3 biologically independent samples). Statistical analysis was performed using two-way ANOVA with Tukey’s test. c, A Venn diagram showing numbers of differentially expressed genes (DEGs) 3h after D36E or D36E(avrRpt2) infection in Col-0 plants. d, A heat-map of the expression pattern of D36E/PTI-responsive genes. e-g, Heat-maps of SA- (e; genes extracted from Karolina et al., 201241), jasmonate- (f; genes extracted from Hickman et al., 201742) and ethylene-(g; genes extracted from Nemhauser et al.,200643) responsive genes.
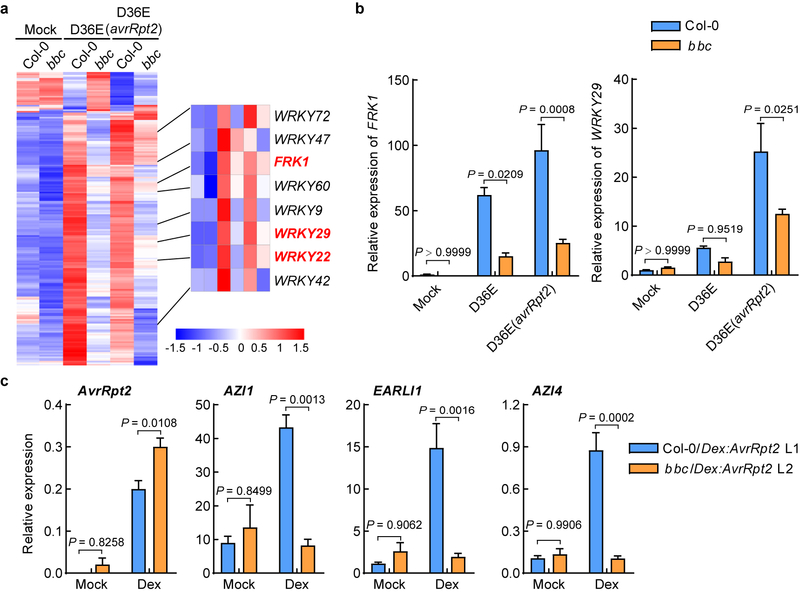
Extended Data Fig. 8|. PRR/co-receptors are important for immune-related gene expression.
(a, b) The WRKY-FRK1 is a unique immune branch and cannot be restored by ETI in bbc mutant. a, Heat map of the 272 DEGs in the bbc plant compared to Col-0 plant after D36E (avrRpt2) infection, with the canonical PTI pathway genes highlighted in red. b, qRT-PCR of FRK1 and WRKY29 expression level in Col-0 and bbc plants 3h after infiltration with different strains or Mock. (mean ± s.e.m.; n = 3 biologically independent samples; statistical analysis by two-way ANOVA with Tukey’s test; p < 0.05; different letters indicate statistically significant difference). c, Expression level of AvrRpt2, AZI1, EARLI1 and AZI4 in the Col-0/DEX::avrRpt2 L1 and bbc/DEX::avrRpt2 L2 plants after sterilized water (mock) or DEX (50nM for Col-0/DEX::avrRpt2 and 100nM for bbc/DEX::avrRpt2) treatment. Leaves were harvested 2h post infiltration for transcript analysis (mean ± s.e.m; n = 3 biologically independent samples; statistical analysis by two-way ANOVA with Tukey’s test). Experiments in b and c were repeated at least three times with similar trends.
Extended Data Fig. 9|. Heat map of gene expression of RLK/LYK5/RLP pathway (a) and BIK1/PBL family (b) in the RNAseq experiment.
Numerical values indicate expression level calculated by TPM (Transcripts per Kb of exon model per Million). Genes labeled in red show significant up-regulation after D36E(avrRpt2) inoculation, compared to mock and D36E inoculation, in Col-0 and bbc plants. Arrows indicate BIK1 and PBL1 genes (b).
Extended Data Fig. 10|. Up-regulation of key PTI component genes by AvrRpt2-triggered ETI seems to be independent of PTI and SA/NHP.
a, qRT-PCR results of representative PTI pathway genes. Col-0 and bbc plants were infiltrated with different strains indicated, and leaves were harvested 3h post infiltration for transcript analysis (mean ± s.e.m; n = 3 biological replicates for all plants/genes, except “bbc-BAK1”, for which n = 4 biologically independent samples). Statistical analysis by two-way ANOVA with Tukey’s test. P-values for additional comparisons are provided in Supplementary Table 3. b, qRT-PCR analysis of BIK1, XLG2, MKK4, MKK5 and MPK3 expression levels in Col-0 and sid2 plants 3h after infiltration with D36E or D36E(avrRpt2). Statistical analysis by two-way ANOVA with Tukey’s test (mean ± s.e.m.; n = 3 (for Col-0) or 4 (for sid2) biologically independent samples). These experiments were repeated at least three times with similar trends. c, Heat-maps of NHP-responsive genes (extracted from Hartmann et al., 201844, defined by genes that are responsive to pipecolic acid and depend on FMO1 for expression) in the Col-0 and bbc plants in our RNAseq experiment.
Supplementary Material
Acknowledgments
We would like to thank Xin lab members for helpful discussions. We thank the Greenhouse and Confocal Microscopy Imaging facilities at CAS Center for Excellence in Molecular Plant Sciences for plant growth and technical support. Dr. Gitta Coaker from University of California, Davis, USA kindly provided RIN4 antibody. We thank Bruno Pok Man Ngou and Pingtao Ding from Jonathan Jones’ lab at the Sainsbury Laboratory, UK, for insightful discussions during manuscript preparation. This research was supported by Chinese Academy of Sciences, Center for Excellence in Molecular Plant Sciences/Institute of Plant Physiology and Ecology, National Key Laboratory of Plant Molecular Genetics and Chinese Academy of Sciences Strategic Priority Research Program (Type-B; Project number: XDB27040211). Guozhi Bi was supported by the Youth Program of National Natural Science Foundation of China (NSFC) (Project number: 31900222).
Footnotes
Competing interests
The authors declare no competing interests.
Supplementary information is available for this paper.
Reprints and permissions information is available at http://www.nature.com/reprints.
References
- 1.Yu X, Feng B, He P & Shan L From Chaos to Harmony: Responses and Signaling upon Microbial Pattern Recognition. Annu Rev Phytopathol. 55, 109–137 (2017). [DOI] [PMC free article] [PubMed] [Google Scholar]
- 2.Couto D & Zipfel C Regulation of pattern recognition receptor signalling in plants. Nat Rev Immunol. 16, 537–552 (2016). [DOI] [PubMed] [Google Scholar]
- 3.Spoel SH & Dong X How do plants achieve immunity? Defence without specialized immune cells. Nat Rev Immunol. 12, 89–100 (2012). [DOI] [PubMed] [Google Scholar]
- 4.Cui H, Tsuda K & Parker JE Effector-triggered immunity: from pathogen perception to robust defense. Annu Rev Plant Biol. 66, 487–511 (2015). [DOI] [PubMed] [Google Scholar]
- 5.Jones JD & Dangl JL The plant immune system. Nature. 444, 323–329 (2006). [DOI] [PubMed] [Google Scholar]
- 6.Chisholm ST, Coaker G, Day B & Staskawicz BJ Host-microbe interactions: shaping the evolution of the plant immune response. Cell. 124, 803–814 (2006). [DOI] [PubMed] [Google Scholar]
- 7.Jones JD, Vance RE & Dangl JL Intracellular innate immune surveillance devices in plants and animals. Science. 354 (2016). [DOI] [PubMed] [Google Scholar]
- 8.Tsuda K & Katagiri F Comparing signaling mechanisms engaged in pattern-triggered and effector-triggered immunity. Curr Opin Plant Biol. 13, 459–465 (2010). [DOI] [PubMed] [Google Scholar]
- 9.Peng Y, van Wersch R & Zhang Y Convergent and Divergent Signaling in PAMP-Triggered Immunity and Effector-Triggered Immunity. Mol Plant Microbe Interact. 31, 403–409 (2018). [DOI] [PubMed] [Google Scholar]
- 10.Axtell MJ & Staskawicz BJ Initiation of RPS2-specified disease resistance in Arabidopsis is coupled to the AvrRpt2-directed elimination of RIN4. Cell. 112, 369–377 (2003). [DOI] [PubMed] [Google Scholar]
- 11.Mackey D, Belkhadir Y, Alonso JM, Ecker JR & Dangl JL Arabidopsis RIN4 is a target of the type III virulence effector AvrRpt2 and modulates RPS2-mediated resistance. Cell. 112, 379–389 (2003). [DOI] [PubMed] [Google Scholar]
- 12.Xin XF et al. Bacteria establish an aqueous living space in plants crucial for virulence. Nature. 539, 524–529 (2016). [DOI] [PMC free article] [PubMed] [Google Scholar]
- 13.Shao F et al. Cleavage of Arabidopsis PBS1 by a bacterial type III effector. Science. 301, 1230–1233 (2003). [DOI] [PubMed] [Google Scholar]
- 14.Gassmann W, Hinsch ME & Staskawicz BJ The Arabidopsis RPS4 bacterial-resistance gene is a member of the TIR-NBS-LRR family of disease-resistance genes. Plant J. 20, 265–277, (1999). [DOI] [PubMed] [Google Scholar]
- 15.Xin XF, Kvitko B & He SY Pseudomonas syringae: what it takes to be a pathogen. Nat Rev Microbiol. 16, 316–328 (2018). [DOI] [PMC free article] [PubMed] [Google Scholar]
- 16.Toruno TY, Stergiopoulos I & Coaker G Plant-Pathogen Effectors: Cellular Probes Interfering with Plant Defenses in Spatial and Temporal Manners. Annu Rev Phytopathol. 54, 419–441 (2016). [DOI] [PMC free article] [PubMed] [Google Scholar]
- 17.Wei HL et al. Pseudomonas syringae pv. tomato DC3000 Type III Secretion Effector Polymutants Reveal an Interplay between HopAD1 and AvrPtoB. Cell Host Microbe. 17, 752–762 (2015). [DOI] [PMC free article] [PubMed] [Google Scholar]
- 18.Qi J, Wang J, Gong Z & Zhou JM Apoplastic ROS signaling in plant immunity. Curr Opin Plant Biol. 38, 92–100 (2017). [DOI] [PubMed] [Google Scholar]
- 19.McNellis TW et al. Glucocorticoid-inducible expression of a bacterial avirulence gene in transgenic Arabidopsis induces hypersensitive cell death. Plant J. 14, 247–257 (1998). [DOI] [PubMed] [Google Scholar]
- 20.Levine A, Tenhaken R, Dixon R & Lamb C H2O2 from the oxidative burst orchestrates the plant hypersensitive disease resistance response. Cell. 79, 583–593 (1994). [DOI] [PubMed] [Google Scholar]
- 21.Chandra S, Martin GB & Low PS The Pto kinase mediates a signaling pathway leading to the oxidative burst in tomato. Proc Natl Acad Sci U S A. 93, 13393–13397 (1996). [DOI] [PMC free article] [PubMed] [Google Scholar]
- 22.Tian S et al. Plant Aquaporin AtPIP1;4 Links Apoplastic H2O2 Induction to Disease Immunity Pathways. Plant physiol. 171, 1635–1650 (2016). [DOI] [PMC free article] [PubMed] [Google Scholar]
- 23.Torres MA, Dangl JL & Jones JD Arabidopsis gp91phox homologues AtrbohD and AtrbohF are required for accumulation of reactive oxygen intermediates in the plant defense response. Proc Natl Acad Sci U S A. 99, 517–522 (2002). [DOI] [PMC free article] [PubMed] [Google Scholar]
- 24.Daudi A et al. The apoplastic oxidative burst peroxidase in Arabidopsis is a major component of pattern-triggered immunity. Plant cell. 24, 275–287 (2012). [DOI] [PMC free article] [PubMed] [Google Scholar]
- 25.Li Y et al. Glucose triggers stomatal closure mediated by basal signaling through HXK1 and PYR/RCAR receptors in Arabidopsis. J Exp Bot. 69, 1471–1484 (2018). [DOI] [PMC free article] [PubMed] [Google Scholar]
- 26.Kadota Y et al. Direct regulation of the NADPH oxidase RBOHD by the PRR-associated kinase BIK1 during plant immunity. Mol Cell. 54, 43–55 (2014). [DOI] [PubMed] [Google Scholar]
- 27.Li L et al. The FLS2-associated kinase BIK1 directly phosphorylates the NADPH oxidase RbohD to control plant immunity. Cell Host Microbe. 15, 329–338 (2014). [DOI] [PubMed] [Google Scholar]
- 28.Kadota Y et al. Quantitative phosphoproteomic analysis reveals common regulatory mechanisms between effector- and PAMP-triggered immunity in plants. New Phytol. 221, 2160–2175 (2019). [DOI] [PMC free article] [PubMed] [Google Scholar]
- 29.Asai T et al. MAP kinase signalling cascade in Arabidopsis innate immunity. Nature. 415, 977–983 (2002). [DOI] [PubMed] [Google Scholar]
- 30.Cecchini NM, Steffes K, Schlappi MR, Gifford AN & Greenberg JT Arabidopsis AZI1 family proteins mediate signal mobilization for systemic defence priming. Nat Commun. 6, 7658 (2015). [DOI] [PubMed] [Google Scholar]
- 31.Liang X et al. Arabidopsis heterotrimeric G proteins regulate immunity by directly coupling to the FLS2 receptor. Elife. 5, e13568 (2016). [DOI] [PMC free article] [PubMed] [Google Scholar]
- 32.Cao X Self-regulation and cross-regulation of pattern-recognition receptor signalling in health and disease. Nat Rev Immunol. 16, 35–50 (2016). [DOI] [PubMed] [Google Scholar]
References
- 33.Gimenez-Ibanez S, Ntoukakis V & Rathjen JP The LysM receptor kinase CERK1 mediates bacterial perception in Arabidopsis. Plant Signal Behav. 4, 539–541 (2009). [DOI] [PMC free article] [PubMed] [Google Scholar]
- 34.Mindrinos M, Katagiri F, Yu GL & Ausubel FM The A. thaliana disease resistance gene RPS2 encodes a protein containing a nucleotide-binding site and leucine-rich repeats. Cell. 78, 1089–1099 (1994). [DOI] [PubMed] [Google Scholar]
- 35.Veronese P et al. The membrane-anchored BOTRYTIS-INDUCED KINASE1 plays distinct roles in Arabidopsis resistance to necrotrophic and biotrophic pathogens. Plant cell. 18, 257–273 (2006). [DOI] [PMC free article] [PubMed] [Google Scholar]
- 36.Gao X et al. Bifurcation of Arabidopsis NLR immune signaling via Ca2+-dependent protein kinases. PLoS pathog. 9, e1003127 (2013). [DOI] [PMC free article] [PubMed] [Google Scholar]
- 37.Mudgett MB & Staskawicz BJ Characterization of the Pseudomonas syringae pv. tomato AvrRpt2 protein: demonstration of secretion and processing during bacterial pathogenesis. Mol Microbiol. 32, 927–941 (1999). [DOI] [PubMed] [Google Scholar]
- 38.Hinsch M & Staskawicz B Identification of a new Arabidopsis disease resistance locus, RPs4, and cloning of the corresponding avirulence gene, avrRps4, from Pseudomonas syringae pv. pisi. Mol Plant Microbe Interact. 9, 55–61 (1996). [DOI] [PubMed] [Google Scholar]
- 39.Aarts N et al. Different requirements for EDS1 and NDR1 by disease resistance genes define at least two R gene-mediated signaling pathways in Arabidopsis. Proc Natl Acad Sci U S A. 95, 10306–10311 (1998). [DOI] [PMC free article] [PubMed] [Google Scholar]
- 40.Lee D, Bourdais G, Yu G, Robatzek S & Coaker G Phosphorylation of the Plant Immune Regulator RPM1-INTERACTING PROTEIN4 Enhances Plant Plasma Membrane H+-ATPase Activity and Inhibits Flagellin-Triggered Immune Responses in Arabidopsis. Plant cell. 27, 2042–2056 (2015). [DOI] [PMC free article] [PubMed] [Google Scholar]
- 41.Pajerowska-Mukhtar KM et al. The HSF-like transcription factor TBF1 is a major molecular switch for plant growth-to-defense transition. Curr Biol. 22, 103–112 (2012). [DOI] [PMC free article] [PubMed] [Google Scholar]
- 42.Hickman R et al. Architecture and Dynamics of the Jasmonic Acid Gene Regulatory Network. Plant cell. 29, 2086–2105 (2017). [DOI] [PMC free article] [PubMed] [Google Scholar]
- 43.Nemhauser JL, Hong F & Chory J Different plant hormones regulate similar processes through largely nonoverlapping transcriptional responses. Cell. 126, 467–475 (2006). [DOI] [PubMed] [Google Scholar]
- 44.Hartmann M et al. Flavin Monooxygenase-Generated N-Hydroxypipecolic Acid Is a Critical Element of Plant Systemic Immunity. Cell. 173, 456–469 e416 (2018). [DOI] [PubMed] [Google Scholar]
Associated Data
This section collects any data citations, data availability statements, or supplementary materials included in this article.
Supplementary Materials
Data Availability Statement
The RNAseq data has been deposited into GEO (Gene Expression Omnibus) repository on NCBI (GSE142747). All data is available in the main text or the supplementary materials. Source data for western blots and graphs in main figures and Extended Data Figures are provided in Supplementary Figure 1(i.e., uncropped gels for western blots) and Source Data files (i.e., original data points for graphs).


