Abstract
Purpose
To evaluate whether deep neural networks trained on a similar number of images to that required during physician training in the American College of Cardiology Core Cardiovascular Training Statement can acquire the capability to detect and classify myocardial delayed enhancement (MDE) patterns.
Materials and Methods
The authors retrospectively evaluated 1995 MDE images for training and validation of a deep neural network. Images were from 200 consecutive patients who underwent cardiovascular MRI and were obtained from the institutional database. Experienced cardiac MR image readers classified the images as showing the following MDE patterns: no pattern, epicardial enhancement, subendocardial enhancement, midwall enhancement, focal enhancement, transmural enhancement, and nondiagnostic. Data were divided into training and validation datasets by using a fourfold cross-validation method. Three untrained deep neural network architectures using the convolutional neural network (CNN) technique were trained with the training dataset images. The detection and classification accuracies of the trained CNNs were calculated with validation data.
Results
The 1995 MDE images were classified by human readers as follows: no pattern, 926; epicardial enhancement, 91; subendocardial enhancement, 458; midwall enhancement, 118; focal enhancement, 141; transmural enhancement, 190; and nondiagnostic, 71. GoogLeNet, AlexNet, and ResNet-152 CNNs demonstrated accuracies of 79.5% (1592 of 1995 images), 78.9% (1574 of 1995 images), and 82.1% (1637 of 1995 images), respectively.
Conclusion
Deep learning with CNNs using a limited amount of training data, less than that required during physician training, achieved high diagnostic performance in the detection of MDE on MR images.
© RSNA, 2019
Summary
Deep learning with deep neural networks can detect the presence of myocardial delayed enhancement (MDE) on cardiovascular MR images and may obtain the ability to classify MDE by training with a similar number of images to that required for physicians who perform or interpret cardiovascular MRI examinations as part of their practice.
Key Points
■ The use of deep learning convolutional neural networks (CNNs) enabled the detection of myocardial delayed enhancement (MDE) patterns on cardiovascular MR images, with an area under the receiver operating characteristic curve of 0.938–0.948.
■ Three different CNN architectures enabled the classification of MDE patterns with a similar accuracy of 78.9%–82.1%.
■ Deep neural networks enabled image sorting according to the presence of MDE in clinical practice and may support clinicians who are less experienced in cardiac MRI.
Introduction
In recent years, the ability of computers to classify images has progressed remarkably with the introduction of the convolutional neural network (CNN), which is a type of deep neural network (1,2). CNNs can classify nonmedical images with a small error rate (top five errors in 1000 class recognitions of 6.67%–4.94%) that is similar to that of human performance (2–5). In image recognition for medical applications, CNNs have demonstrated good diagnostic performance in the detection of metastatic lymph nodes in women with breast cancer (area under the receiver operating characteristic curve [AUC], 0.994) (6), tuberculosis with chest radiography (AUC, 0.99) (7), assessments of skeletal maturity on pediatric bone radiographs (with accuracy similar to that of an expert radiologist) (8), and liver masses in CT images for differentiating malignancy (AUC, 0.92) (9).
Acquisition of myocardial delayed enhancement (MDE) images with cardiovascular MRI has been widely performed in the past decade; these images can reveal pathologic myocardial changes such as myocardial fibrosis or infiltration (10). Classification of MDE patterns enables the differentiation of ischemic myocardial disease from nonischemic myocardial disease (11). In addition, the classification of enhancement patterns may enable the differentiation of types of nonischemic cardiomyopathy (10). Thus, the detection and classification of MDE patterns have become essential steps for the diagnosis of myocardial disease.
Physicians are typically trained in cardiovascular MR image interpretation according to their specialized level in cardiac imaging. In addition, the interpretation of cardiovascular MR images requires a certain level of proficiency. Although proficiency criteria, such as the number of case reviews required for each level of training, have been developed (12), it may be difficult to accumulate sufficient cardiovascular MRI experience depending on the facility environment or examination time frame. Therefore, if a CNN were used as a diagnostic aid, it could provide a reference finding for an expert physician and might detect a lesion before the image arrives in the hands of a physician who is not accustomed to the interpretation of cardiovascular images. However, it remains unclear how many images a CNN must “read” before attaining sufficient diagnostic performance.
Therefore, the purpose of this study was to evaluate whether CNNs can acquire the capability to detect and classify MDE patterns using a similar number of images to that used to train expert readers during physician interpretation training.
Materials and Methods
This single-center study was approved by our institutional review board, which waived the requirement to obtain written informed consent for the retrospective analysis. All authors had control of the data and information submitted for publication. No individuals from industry were included in this study or had any control over the data or information. This study received no financial or industry support.
A flow diagram of the procedure used in this study is shown in Figure 1. This study consisted of three steps. First, MDE images were extracted from an image database and prepared. Second, CNNs were trained by using a training dataset. Third, the diagnostic performance of the trained CNNs was tested by using a validation dataset; this process was performed four times by using fourfold cross-validation.
Figure 1:
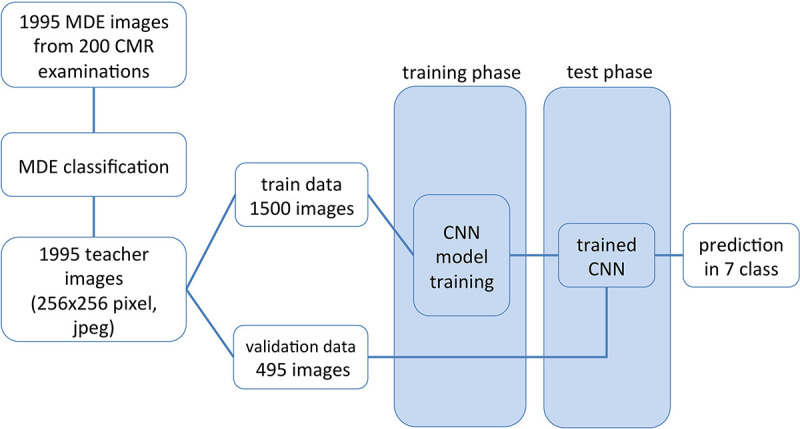
Diagram of data flow from image extraction to myocardial delayed enhancement (MDE) pattern classification. CMR = cardiovascular MRI, CNN = convolutional neural network.
Image sections obtained during cardiovascular MRI examination of 264 consecutive patients between March 2010 and July 2014 were extracted from the picture archiving and communication system at our institution. The most common clinical indication for the examinations was ischemic heart disease. We excluded cardiovascular MR images without MDE analysis. Thus, MDE images from examinations in 200 patients obtained with three MRI systems were analyzed in this study. There were 128 men aged 18–89 years (mean age ± standard deviation, 60 years ± 15) and 72 women aged 28–89 years (mean age, 68 years ± 14). Detailed MDE protocols are given in Appendix E1 (supplement).
Image Preparation
The datasets consisted of 1995 MDE images from the 200 patients. For the training dataset, MDE images were prepared by referring to the cardiovascular MRI guidelines for level II training (those who wish to perform and interpret cardiovascular MRI examinations as part of their practice of cardiovascular medicine) from the Core Cardiovascular Training Statement 4 Task Force 8 (12). There is no general rule on the percentage split between the training and validation data, as this depends on the signal-to-noise ratio in each data point (image) and the overall training dataset size (13). The performance of the CNN was assessed by using a stratified fourfold cross-validation procedure to reduce prediction error variance. The MDE images were randomly divided into four groups on a patient-by-patient basis to avoid inclusion of similar images in both the training and validation datasets. The study population was randomly divided into four nonoverlapping groups of patients of approximately the same sample size. Four training and validation datasets were built. These datasets consisted of training and test images at a ratio of almost 3:1. Images were magnified for each patient so that the short axis of the largest part of the heart fit within the image size (256 × 256 pixels). Images were then converted from the Digital Imaging and Communications in Medicine format to the Joint Photographic Experts Group, or JPEG, format using the export function of the Digital Imaging and Communications in Medicine image viewer (EV Insite; PSP, Tokyo, Japan).
Index Image Classification
To classify each image in the training dataset according to MDE category, images in the training set were presented in random order. Index classification was performed by two radiologists independently without clinical information (Y.O. and S.K., with 10 and 6 years of experience in cardiac radiology, respectively). If discrepancies existed between the two readers, a consensus was achieved with discussion after both reading sessions were complete.
MDE image datasets were visually classified into seven categories while blinded to clinical information. The MDE categories were as follows: no MDE, focal enhancement, epicardial enhancement, subendocardial enhancement, transmural enhancement, nondiagnostic enhancement, and midwall enhancement (10). Detailed criteria for MDE classification are given in Appendix E2 (supplement).
Deep Learning
Three different CNN architectures (AlexNet, GoogLeNet, and ResNet-152) were used to create trained CNN models. The AlexNet model had eight layers and 7.27 × 10⁸ floating point operations, the GoogLeNet model had 22 layers and 2.0 × 10⁹ floating point operations, and the ResNet-152 model had 152 layers and 11 × 109 floating point operations (2–4). The AlexNet and GoogLeNet models were modified with batch normalization to improve loss convergence (14). Because these original architectures have 1000-class output layers, we modified them as seven-class output layers. The training system and other parameters are described in Appendix E3 (supplement).
Trained CNNs were evaluated in the test phase by using the validation dataset for each image. Because patients do not necessarily show the same MDE pattern in each image, per-patient classification evaluation was not performed. As the CNN outputs are probabilities for each category by the softmax function, the highest probability index was used as the determined MDE classification from the CNN for each image. As the sum of the probabilities in the softmax function is 1, the probabilities classified with MDE present pattern (nondiagnostic images were classified as MDE present) were summed, and ROC was calculated after dividing into two with and without MDE. Diagnostic performances for detecting any MDE pattern were calculated as a 2 × 2 contingency table (15) and with receiver operating characteristic analysis.
Statistical Analysis
Continuous variables that were normally distributed were summarized and reported as means ± standard deviations, whereas continuous variables that were not normally distributed were summarized by reporting the medians and interquartile range. Interobserver agreement was determined with the Cohen κ coefficient for diagnostic performance (16) and defined as follows: poor (κ < 0), slight (κ = 0–0.20), fair (κ = 0.21–0.40), moderate (κ = 0.41–0.60), substantial (κ = 0.61–0.80), and almost perfect (κ = 0.81–1.00) (17).
The AUC was calculated for each CNN for MDE detection (18). P < .05 was considered indicative of a statistically significant difference. In this study, the performance of the deep neural network was examined in an image-based fashion; however, treating multiple images per patient as independent when evaluating diagnostic performance overstates the legitimate sample size. Therefore, the sample size calculation for diagnostic performance was based on a per-patient approach. The dataset size satisfied the calculated sample size of 200 patients, which was based on the following assumptions: sensitivity of 80%, specificity of 80%, and disease prevalence of 0.5, where the maximum marginal error does not exceed 10% at a 95% confidence interval (CI) (19). The Fisher exact test was used for categorical variables. Differences between CNN classification results and the teaching index determined by the expert readers were evaluated by using a confusion matrix. The sensitivity or precision of the CNNs for each category and the accuracy for all categories were also determined with a confusion matrix. Analysis was performed with software (SPSS, version 23 [IBM, Armonk, NY] and EZR A version 3.0.1 [R Foundation for Statistical Computing] [20]).
Results
Patient characteristics are shown in Table 1. There were no significant differences in the patient background heart disease by sex. The results of MDE pattern classification by the two expert readers are given in Table 2. Microvascular obstructions were found in 51 of the 190 images with a transmural pattern (26.8%) and 20 of the 458 with a subendocardial pattern (4.4%). In the classification of the MDE pattern, the agreement between the two readers (κ = 0.775) and between teacher data and CNN-classified results (κ = 0.71 and 0.74) were both substantial.
Table 1:
Patient Characteristics
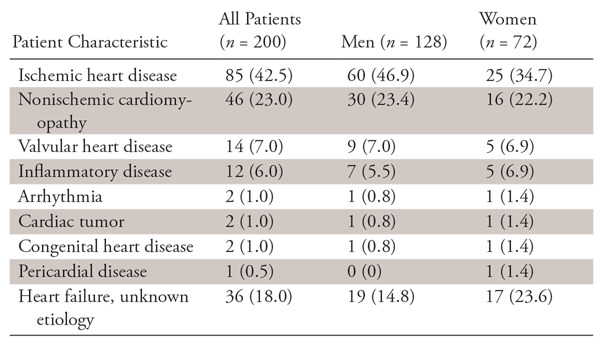
Note.—Data are numbers of patients, with percentages in parentheses.
Table 2:
Results of MDE Classification by Two Experts
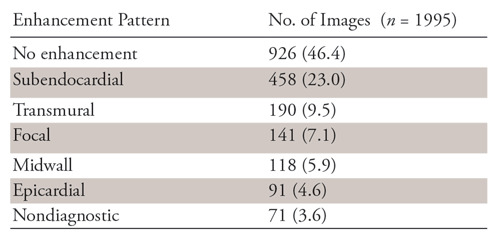
Note.—Numbers in parentheses are percentages. MDE = myocardial delayed enhancement
In the validation phase, the accuracies and AUCs of the CNNs for the detection of any MDE and nondiagnostic pattern with use of the validation datasets were 87.2% (95% CI: 85.6%, 88.6%) and 0.939 (95% CI: 0.929, 0.949), respectively, for AlexNet, 87.4% (95% CI: 85.9%, 88.8%) and 0.938 (95% CI: 0.927, 0.949) for GoogLeNet, and 88.9% (95% CI: 87.5%, 90.3%) and 0.948 (95% CI: 0.939, 0957) for ResNet-152 (Table 3). The sensitivities of the architectures according to pattern are shown in Table 4. The overall accuracies of AlexNet, GoogLeNet, and ResNet-152 for the classification of the seven patterns of MDE were 78.9%, 79.8%, and 82.1%, respectively.
Table 3:
Diagnostic Performance of Trained CNNs

Note.—Numbers in parentheses are raw data, and numbers in brackets are 95% confidence intervals. AUC = area under the receiver operating characteristic curve, CNN = convolutional neural network, NPV = negative predictive value, PPV = positive predictive value.
Table 4:
Sensitivity and Overall Accuracy of MDE Classification for Each CNN Architecture

Note—Data are percentages. CNN = convolutional neural network, MDE = myocardial delayed enhancement.
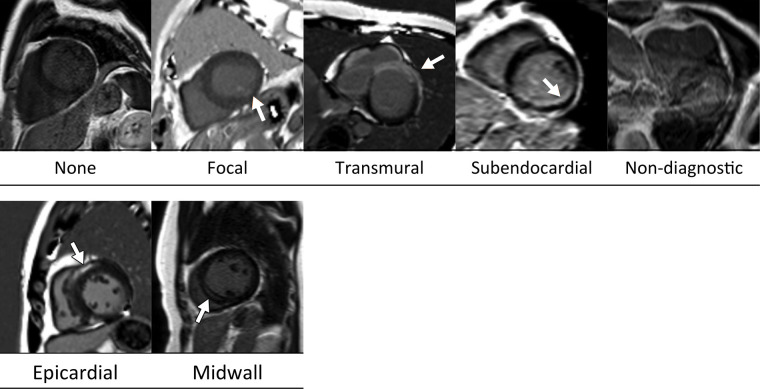
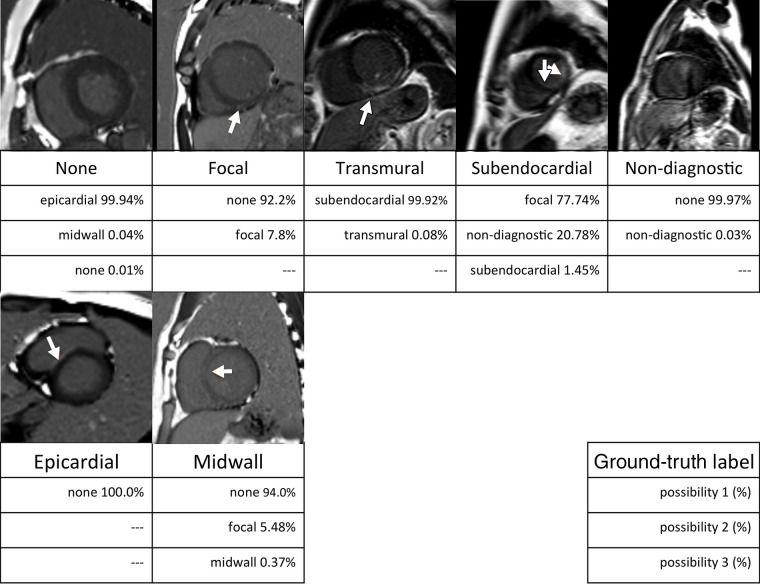
As an example, the confusion matrix of the GoogLeNet CNN is shown in Table 5. The confusion matrixes of the other CNN architectures are shown in Tables E1 and E2 (supplement). Examples of images that were accurately and inaccurately classified by the GoogLeNet CNN are shown in Figures 2 and 3, respectively.
Table 5:
Confusion Matrix between Teaching Images and GoogLeNet Classification Results

Note.—Unless otherwise indicated, data are numbers of images. The teaching image classification was used as the standard of reference. The overall accuracy for CNN image classification was 79.8%. CNN = convolutional neural network.
Figure 2:
Examples of MR images correctly classified by the GoogLeNet architecture. Ground-truth labels are listed below each image. Arrows indicate myocardial enhancement.
Figure 3:
Examples of MR images misclassified by the GoogLeNet architecture. Ground-truth labels are listed below each image. The three rows under the ground-truth label show the top three categories and probabilities classified by the trained GoogLeNet convolutional neural network. Arrows indicate myocardial enhancement.
Discussion
We investigated the potential for CNNs to detect and classify MDE patterns and demonstrated that CNNs were useful for detecting MDE patterns with an accuracy of 87.2%–88.9%. Furthermore, the CNNs could classify MDE patterns into seven categories with an overall accuracy of 78.9%–82.1%.
CNNs have frequently been used for research in the field of computer vision (1). For image recognition trained by large datasets such as ImageNet, CNNs have shown a low recognition error rate, similar to that of humans (5,21); hence, we used this approach in the present study. The GoogLeNet CNN architecture demonstrated a sensitivity of 81.6% in the detection of subendocardial patterns.
Because the basic level of training in the Core Cardiovascular Training Statement (level I) is insufficient for using CNNs in clinical practice, we trained using images from 150 cases, referring to the guidelines for level II training required by the Core Cardiovascular Training Statement for specialized cardiovascular MRI (12). CNNs demonstrated almost-perfect accuracy during the training phase. The difference in accuracy between the training and validation phases was thought to be the result of overfitting. One reason for this was likely the small training dataset, in addition to the CNN recognition ability. Although the required number of images in a training dataset cannot be stated explicitly, the use of larger datasets to train CNNs may improve the classification ability.
In some previous studies (7,8), CNN training was performed by using downsized images to reduce the calculation cost; however, this may cause information loss. With use of a high-resolution model, CNNs can provide the correct label in the higher rank of possibility scores (22). Image downsizing was not performed in our study, and information loss in the MDE image might not have occurred. Moreover, in previous studies, lesion identification and cropping were performed by the observer in advance (9,23,24). In studies using conventional radiography, structures had similar sizes in the imaging plane (8,21) but images were downsized to reduce calculation costs. In our study, image areas outside the heart region were cropped; however, lesion identification was not performed in advance. Nevertheless, CNNs demonstrated sufficient MDE detection capability, and the pattern recognition was relatively good.
When physicians evaluate myocardial ischemia, they determine the extent of irreversible necrosis from subendocardial layers toward the epicardium in accordance with the so-called “wave-front phenomenon” (25). Therefore, differentiation between ischemic and nonischemic patterns is based on pathophysiologic characteristics. However, we could not determine how the CNNs recognized the subendocardial pattern. The CNNs had a tendency to confuse the transmural pattern containing endocardial enhancement with the endocardial pattern itself (11.3%, 20 of 177 images). In contrast, the number of subendocardial patterns that CNNs misdiagnosed as transmural patterns was small (5.5%, 25 of 457 images). Unfortunately, we have no way of knowing the reason for this discrepancy in misdiagnosis. GoogLeNet occasionally misdiagnosed the absence of an MDE pattern as focal enhancement (3.9%, 39 of 993 images) or subendocardial enhancement (3.8%, 38 of 993 images). As demonstrated in Figure 3, subtle signal intensity changes may mimic a focal or small subendocardial enhancement. Some cases of the epicardial pattern were classified as showing no pattern. In addition, CNNs may recognize epicardial hyperenhancement as high signal intensity from adjacent epicardial fat, a representative case of which is shown in Figure 3. Some cases of midwall hyperenhancement were classified as having no MDE (15.8%, 18 of 114 images) or a subendocardial pattern (6.1%, seven of 114 images). A relatively large focal pattern along the myocardium might cause misclassification. As discussed earlier, physicians can classify images based on the patient’s pathophysiologic background in a clinical setting and infer the cause of misdiagnosis by the CNN. As is often said, deep neural networks are a kind of “black box” for which there is no theoretical deduction of the determination process. Therefore, final confirmation by a diagnostic physician remains necessary.
Our study had some limitations. The data we used were obtained with several MRI machines at a single medical center, and the models were not validated on data obtained outside our institution or on MRI equipment that our institution does not use. We did not equalize the number of images in each dataset, and these images were extracted from consecutive examinations to approximate the frequency of cases that would be experienced in a daily clinical situation based on the data from an actual educational hospital. For the categories that demonstrated low sensitivity, increments of the numbers of images may lead to improvements in classification sensitivity. The diagnostic performances were calculated in an image-based fashion. This study was focused on detecting and classifying patterns in MDE images; classification according to clinical or pathologic diagnosis was not done. However, interpreting MDE images in clinical practice relies on patient-based diagnostic information, so diagnostic performance using clinical information should be evaluated in a future study. Unlike other organs for which pathologic samples are readily available in the form of resected specimens, such as liver or lung, it is difficult to construct a large dataset of cardiologic specimens. Such a dataset is necessary for deep learning based on pathologic diagnosis. In addition, classification was performed for each image section; summary pattern classification for each patient was not performed. This is because patients do not necessarily show the same MDE pattern in each section. However, it is known that pattern classification is closely related to disease, and we thought that it was important to evaluate the performance of CNNs in pattern recognition as a preliminary study. MDE diagnosis beyond pattern differentiation might be made possible by performing clinical diagnosis based on image recognition with CNNs.
In conclusion, deep learning with CNNs using a smaller amount of training data than required during physician training may provide the ability to detect MDE on cardiovascular MR images. The agreement of MDE pattern classification by CNNs was substantial after training with a relatively small dataset; however, the classification accuracies of the MDE patterns were 78.9%–82.1%, indicating that it may be insufficient to rely completely on the model as opposed to a human reviewer.
APPENDIX
Disclosures of Conflicts of Interest: Y.O. disclosed no relevant relationships. H.Y. disclosed no relevant relationships. S.K. disclosed no relevant relationships. T.K. disclosed no relevant relationships. T.F. disclosed no relevant relationships. T.O. disclosed no relevant relationships.
Abbreviations:
- AUC
- area under the receiver operating characteristic curve
- CI
- confidence interval
- CNN
- convolutional neural network
- MDE
- myocardial delayed enhancement
References
- 1.LeCun Y, Bengio Y, Hinton G. Deep learning. Nature 2015;521(7553):436–444. [DOI] [PubMed] [Google Scholar]
- 2.Krizhevsky A, Sutskever I, Hinton GE. ImageNet classification with deep convolutional neural networks. In: Pereira F, Burges CJC, Bottou L, Weinberger KQ, eds. Advances in Neural Information Processing Systems 25 (NIPS 2012), 2012 [conference paper]. https://papers.nips.cc/paper/4824-imagenet-classification-with-deep-convolutional-neural-networks. Published 2012. Accessed June 2, 2018. [Google Scholar]
- 3.Szegedy C, Liu W, Jia YQ, et al. Going deeper with convolutions. In: 2015 IEEE Conference on Computer Vision and Pattern Recognition (CVPR). Piscataway, NJ: IEEE, 2015; 1–9. [Google Scholar]
- 4.He KM, Zhang XY, Ren SQ, Sun J. Deep residual learning for image recognition. In: 2016 IEEE Conference on Computer Vision and Pattern Recognition (CVPR). Piscataway, NJ: IEEE, 2016; 770–778. [Google Scholar]
- 5.He KM, Zhang XY, Ren SQ, Sun J. Delving deep into rectifiers: surpassing human-level performance on ImageNet classification. In: 2015 IEEE International Conference on Computer Vision (ICCV). Piscataway, NJ: IEEE, 2015; 1026–1034. [Google Scholar]
- 6.Ehteshami Bejnordi B, Veta M, Johannes van Diest P, et al. Diagnostic assessment of deep learning algorithms for detection of lymph node metastases in women with breast cancer. JAMA 2017;318(22):2199–2210. [DOI] [PMC free article] [PubMed] [Google Scholar]
- 7.Lakhani P, Sundaram B. Deep learning at chest radiography: automated classification of pulmonary tuberculosis by using convolutional neural networks. Radiology 2017;284(2):574–582. [DOI] [PubMed] [Google Scholar]
- 8.Larson DB, Chen MC, Lungren MP, Halabi SS, Stence NV, Langlotz CP. Performance of a deep-learning neural network model in assessing skeletal maturity on pediatric hand radiographs. Radiology 2018;287(1):313–322. [DOI] [PubMed] [Google Scholar]
- 9.Yasaka K, Akai H, Abe O, Kiryu S. Deep learning with convolutional neural network for differentiation of liver masses at dynamic contrast-enhanced CT: a preliminary study. Radiology 2018;286(3):887–896. [DOI] [PubMed] [Google Scholar]
- 10.Mahrholdt H, Wagner A, Judd RM, Sechtem U, Kim RJ. Delayed enhancement cardiovascular magnetic resonance assessment of non-ischaemic cardiomyopathies. Eur Heart J 2005;26(15):1461–1474. [DOI] [PubMed] [Google Scholar]
- 11.Schulz-Menger J, Bluemke DA, Bremerich J, et al. Standardized image interpretation and post processing in cardiovascular magnetic resonance: Society for Cardiovascular Magnetic Resonance (SCMR) board of trustees task force on standardized post processing. J Cardiovasc Magn Reson 2013;15(1):35. [DOI] [PMC free article] [PubMed] [Google Scholar]
- 12.Kramer CM, Hundley WG, Kwong RY, Martinez MW, Raman SV, Ward RP. COCATS 4 task force 8: training in cardiovascular magnetic resonance imaging. J Am Coll Cardiol 2015;65(17):1822–1831. [DOI] [PubMed] [Google Scholar]
- 13.Hastie T, Tibshirani R, Friedman J. Model assessment and selection. The elements of statistical learning: data mining, inference, and prediction. New York, NY: Springer, 2009; 219–259. [Google Scholar]
- 14.Ioffe S, Szegedy C. Batch normalization: accelerating deep network training by reducing internal covariate shift. In: Bach F, Blei D, eds. Proceedings of the 32nd International Conference on Machine Learning, vol. 37. Lille, France: JMLR.org, 2015; 448–456. [Google Scholar]
- 15.Agresti A, Coull BA. Approximate is better than “exact” for interval estimation of binomial proportions. Am Stat 1998;52(2):119–126. [Google Scholar]
- 16.Kundel HL, Polansky M. Measurement of observer agreement. Radiology 2003;228(2):303–308. [DOI] [PubMed] [Google Scholar]
- 17.Landis JR, Koch GG. The measurement of observer agreement for categorical data. Biometrics 1977;33(1):159–174. [PubMed] [Google Scholar]
- 18.Obuchowski NA. Receiver operating characteristic curves and their use in radiology. Radiology 2003;229(1):3–8. [DOI] [PubMed] [Google Scholar]
- 19.Hajian-Tilaki K. Sample size estimation in diagnostic test studies of biomedical informatics. J Biomed Inform 2014;48:193–204. [DOI] [PubMed] [Google Scholar]
- 20.Kanda Y. Investigation of the freely available easy-to-use software ‘EZR’ for medical statistics. Bone Marrow Transplant 2013;48(3):452–458. [DOI] [PMC free article] [PubMed] [Google Scholar]
- 21.Bar Y, Diamant I, Wolf L, Greenspan H. Deep learning with non-medical training used for chest pathology identification. In: Hadjiiski LM, Tourassi GD, eds. Medical Imaging 2015: Computer-Aided Diagnosis. Bellingham, Wash: SPIE, 2015. [Google Scholar]
- 22.Wu R, Yan S, Shan Y, Dang Q, Sun G. Deep image: scaling up image recognition. ArXiv [preprint]. https://arxiv.org/pdf/1501.02876v2.pdf. Posted February 6, 2015. Accessed June 2, 2018.
- 23.Hua KL, Hsu CH, Hidayati SC, Cheng WH, Chen YJ. Computer-aided classification of lung nodules on computed tomography images via deep learning technique. OncoTargets Ther 2015;8:2015–2022. [DOI] [PMC free article] [PubMed] [Google Scholar]
- 24.Shin HC, Roth HR, Gao M, et al. Deep convolutional neural networks for computer-aided detection: CNN architectures, dataset characteristics and transfer learning. IEEE Trans Med Imaging 2016;35(5):1285–1298. [DOI] [PMC free article] [PubMed] [Google Scholar]
- 25.Perazzolo Marra M, Lima JAC, Iliceto S. MRI in acute myocardial infarction. Eur Heart J 2011;32(3):284–293. [DOI] [PubMed] [Google Scholar]
Associated Data
This section collects any data citations, data availability statements, or supplementary materials included in this article.


