

Abstract
Purpose
To examine variations of convolutional neural network (CNN) performance for multiple chest radiograph diagnoses and image resolutions.
Materials and Methods
This retrospective study examined CNN performance using the publicly available National Institutes of Health chest radiograph dataset comprising 112 120 chest radiographic images from 30 805 patients. The network architectures examined included ResNet34 and DenseNet121. Image resolutions ranging from 32 × 32 to 600 × 600 pixels were investigated. Network training paradigms used 80% of samples for training and 20% for validation. CNN performance was evaluated based on area under the receiver operating characteristic curve (AUC) and label accuracy. Binary output networks were trained separately for each label or diagnosis under consideration.
Results
Maximum AUCs were achieved at image resolutions between 256 × 256 and 448 × 448 pixels for binary decision networks targeting emphysema, cardiomegaly, hernias, edema, effusions, atelectasis, masses, and nodules. When comparing performance between networks that utilize lower resolution (64 × 64 pixels) versus higher (320 × 320 pixels) resolution inputs, emphysema, cardiomegaly, hernia, and pulmonary nodule detection had the highest fractional improvements in AUC at higher image resolutions. Specifically, pulmonary nodule detection had an AUC performance ratio of 80.7% ± 1.5 (standard deviation) (0.689 of 0.854) whereas thoracic mass detection had an AUC ratio of 86.7% ± 1.2 (0.767 of 0.886) for these image resolutions.
Conclusion
Increasing image resolution for CNN training often has a trade-off with the maximum possible batch size, yet optimal selection of image resolution has the potential for further increasing neural network performance for various radiology-based machine learning tasks. Furthermore, identifying diagnosis-specific tasks that require relatively higher image resolution can potentially provide insight into the relative difficulty of identifying different radiology findings.
Supplemental material is available for this article.
© RSNA, 2020
See also the commentary by Lakhani in this issue.
Summary
Tracking convolutional neural network performance as a function of image resolution allows insight into how the relative subtlety of different radiology findings can affect the success of deep learning in diagnostic radiology applications.
Key Points
■ Understanding the impact of image resolution (pixel dimensions) in deep learning is important for the optimization of radiology models.
■ Different diagnoses or image labels can have different model performance changes relative to increased image resolution (eg, pulmonary nodule detection benefits more from increased image resolution than thoracic mass detection).
■ Most diagnostic labels examined had optimal performance at resolutions between 256 and 448 pixels per dimension, yet emphysema and pulmonary nodule detection specifically showed greater preference for a range of higher resolution convolutional neural network image inputs compared with low resolutions such as 32 × 32 and 64 × 64 pixels.
Introduction
Many recent advances have been made in the applications of deep learning and convolutional neural networks (CNNs) to radiology tasks involving diagnosis determination and finding identification on chest radiographic images (1–4). Multiple public datasets exist for labeled chest radiographic images (2,3) with the National Institutes of Health (NIH) datasets released as ChestX-ray8 and ChestX-ray14 being among the largest and most studied (1,4). One previous study of these data used long short-term memory recurrent neural networks with 512 × 512-pixel input images and focused on label dependencies (4). Deep learning analyses concurrent with the dataset’s release involved 1024 × 1024 resolution images and investigations that included the AlexNet, GoogLeNet, VGGNet-16, and ResNet-50 architectures (3). Another study that showed improved performance based on area under the receiver operating characteristic curve (AUC) compared with these two prior works used 224 × 224-pixel inputs and a DenseNet121 architecture with a modified model head (1).
Achieving better model performance with lower input image resolutions might initially seem paradoxical, but, in various machine learning paradigms, a reduced number of inputs or features is desirable as a means of lowering the number of parameters that must be optimized, which in turn diminishes the risk of model overfitting (5). Nevertheless, extensive lowering of image resolution eliminates information that is useful for classification. Furthermore, there is an inherent trade-off in CNN implementations in that graphics processing unit–based optimization can have memory limitations where using a higher image resolution can reduce the usable maximum batch size, and a higher batch size can allow improved calculation of the gradient with regard to the loss function. Consequently, determining the optimal image resolution for different radiology-based machine learning applications remains an open problem. In this study, we have investigated this problem by selecting eight of the 14 diagnoses in the NIH ChestX-ray14 dataset and examining CNN performance for a wide spectrum of image resolutions and network training strategies. Our results revealed practical insights for improving the performance of radiology-based machine learning applications and demonstrated diagnosis-dependent performance differences that allow for potential inferences into relative difficulties of different radiology findings.
Materials and Methods
Our institutional review board approved this study and deemed it to be Health Insurance Portability and Accountability Act compliant. CNNs were trained on the NIH ChestX-ray14 dataset comprising 112 120 chest radiographic images stored at a 1024 × 1024-pixel resolution. This dataset covers 30 805 unique patients. CNNs were trained by using PyTorch (https://pytorch.org) and FastAI (https://www.fast.ai) version 0.7 using the Anaconda (Austin, Tex) distribution of Python (https:www.python.org) on a single Nvidia GTX 1080 Ti graphics processing unit (Santa Clara, Calif). The default bilinear interpolation method of image resizing within these libraries was used to manipulate image resolutions. The Sklearn package was used to calculate the AUC. The model architectures studied included ResNet34 and DenseNet121 (6,7). The batch size was set to eight unless otherwise specified.
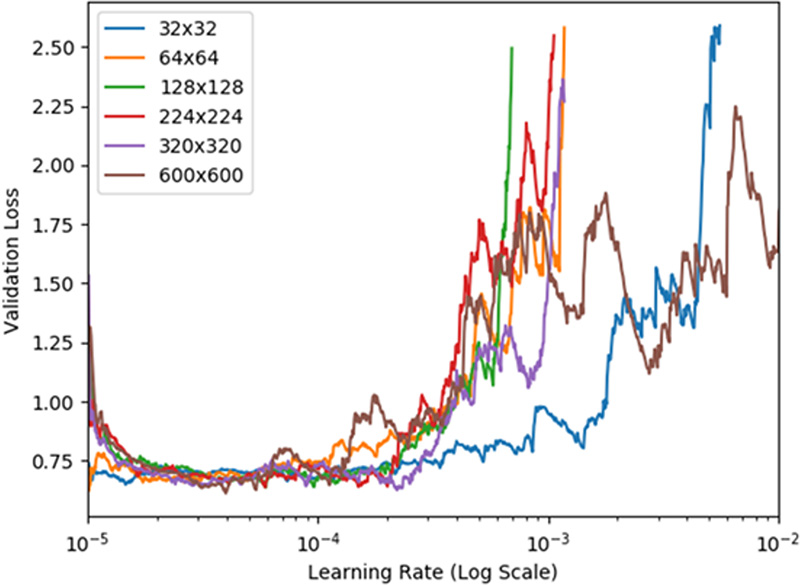
Learning rate was fixed at 0.0005. To understand the impact of different learning rates in our CNN modeling, we used techniques inspired by Smith et al (8,9) to plot model validation loss as a function of different potential learning rates (see Section 1, Appendix E1 [supplement] for further details). For comparison, this learning rate is within an order of magnitude of the 0.001 learning rate in Rajpurkar et al (1) and the 0.0001 learning rate in Irvin et al (2) for chest radiograph deep learning.
Network weights were initialized with ImageNet-trained weights, and models were trained end-to-end with all layers open, as this showed better performance than selectively training only on the top layer of the models. Each network was trained for binary classification with a weighted cross-entropy loss function. Our training paradigm involved subsampling the 112 120-image dataset to 20 000 images with positive sample enrichment so that for each diagnostic label under consideration, all positive samples were included in the 20 000-image subsample and then the remaining samples were randomly selected from the images in the dataset that did not contain the finding or diagnosis of interest. Cross-entropy loss function weights were then calculated based on the proportion of positive images in this enriched 20 000-image subsample. Each 20 000-image sample was split such that 80% (16 000/20 000) was used for training and 20% (4000/20 000) was used as a validation set. Subsampling the dataset for each diagnosis label–specific binary CNN was performed to decrease the amount of computational time needed per epoch and to reduce the numerical mismatch between positive and negative samples (thus allowing the loss function cross-entropy weights to move closer to one). Preliminary simulations across the full 112 120 image dataset showed relatively worse initial performance compared with subsampling, likely owing to reduced tractability of the optimization problem related to the overabundance of negative samples. The DeLong method was used to calculate variance of the AUC for the validation set images (10,11). When appropriate, z-score–based statistical analysis was used to compare AUC by using a P value of .05.
Image augmentation was utilized for each training epoch consisting of random rotations up to 20°, random brightness and contrast fluctuations, black pixel padding, and random flipping of the images about the vertical axis. AUCs were calculated based on test time image augmentation based on four randomly selected augmentations (default FastAI test time image augmentation parameters). For comparison, some prior work has limited image augmentation to only vertical axis flipping (1), while other work has used augmentation consisting of 25 pixel translation of 512 × 512-pixel images in four random directions combined with up to a 15° rotation and 80%–120% rescaling (4).
We elected to only model eight out of the 14 labels in the ChestX-ray14 dataset owing to concerns about the clinical utility and relevance of models trained on the six excluded labels. We excluded the label of “pneumothorax,” because manual inspection of the dataset images revealed that many of the radiographs with the pneumothorax label already had chest tubes in place which raised concerns that models trained on these labels would potentially detect chest tubes instead of clinically relevant pneumothoraces. We excluded the labels of “consolidation,” “infiltration,” and “pneumonia” owing to the mutual ambiguity of these three labels. Similarly, we excluded the labels of “fibrosis” and “pleural thickening,” as without access to the radiologist’s reports underlying the natural language processing labels we were concerned about the ambiguity of pleural fibrosis versus interstitial fibrosis as well as the ambiguity of pleural fibrosis versus pleural thickening.
Results
Before training network models and evaluating performance, one possible heuristic method of selecting an appropriate image resolution size for radiology deep learning is simple inspection of the images to determine how low the image resolution can become before identification of radiologic findings becomes overly difficult for a human observer. Figure 1 shows a selected chest radiograph for patient 103 (60-year-old male patient) labeled as having a thoracic mass. The size of the image stored in the NIH database is 1024 × 1024 pixels, and for comparison, Figure 1 shows this chest radiograph resized to four different resolutions under consideration for deep learning inputs (32 × 32, 64 × 64, 128 × 128, and 224 × 224 pixels). The extremely low-resolution samples at 32 × 32-pixel and 64 × 64-pixel dimensions have readily observable limitations from the perspective of diagnostic quality, yet this is less noticeable immediately for the second row of resolutions. For comparison, possible MRI slice presentations include 128 × 128-pixel and 256 × 256-pixel resolutions (12), whereas possible axial CT scan slice resolutions are 512 × 512 pixels (13). Without relying on visual inspection, it is also possible to systematically examine the effect of image resolution on validation set loss in a manner similar to Smith et al (8,9). In this study, rather than focusing on direct loss function output comparisons, we computed validation set AUCs, which potentially possess more readily accessible extrinsic interpretability compared with validation set loss for radiologists, even though the 2018 work by Smith et al (8) still represents the standard of reference in terms of hyperparameter selection methodology within the deep learning community.
Figure 1:

Comparison of chest radiographs at different image resolutions for patient 103 (60-year-old man with a thoracic mass). The mass finding is visible in all images but with visually observable improved clarity in the higher resolution examples (bottom row).
Figure 2 shows the effects of varying the image resolution on an AUC for six distinct diagnosis labels: emphysema, cardiomegaly, hernia, atelectasis, edema, and effusion. Each of these AUCs represents the predictions of a ResNet34 trained for three iterations on 20 000 samples. Performances plateau at resolutions of 256 × 256 and 320 × 320 pixels. The hernia prediction network is notable here as a special case owing to its higher performance variability, presumptively because this diagnosis label has the smallest total number of positive samples in the NIH dataset (only 227 total cases). Indeed, performance for hernia detection improves to 0.943 AUC at a 256 × 256-pixel resolution when the positive sample enrichment is enhanced by further subsampling down to 2000 training and testing images to reduce the discrepancies between loss function weights.
Figure 2:
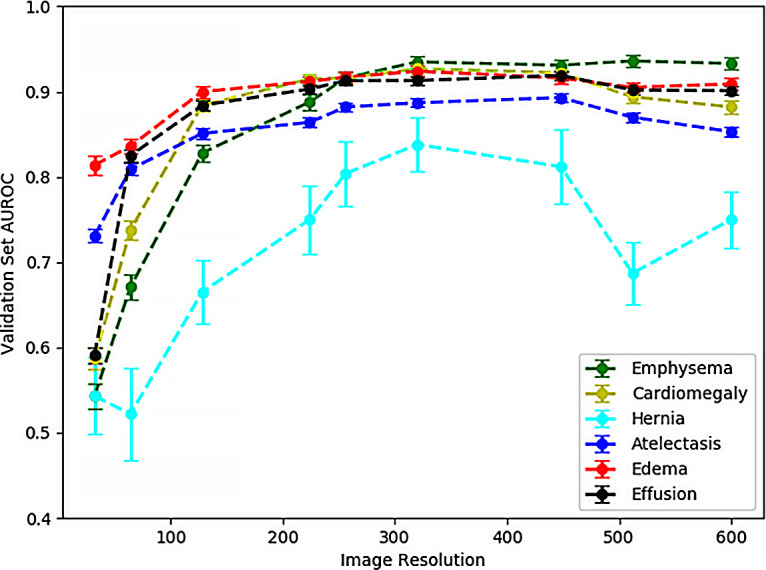
Validation set area under the receiver operating characteristic curve (AUROC) for six different diagnostic labels shows improved performance with increased image resolution and a plateau effect on performance improvement for resolutions higher than 224 × 224 pixels. Models were trained with ResNet34 architecture for three subsample epochs. Resolutions shown are as follows: 32 × 32, 64 × 64, 128 × 128, 224 × 224, 256 × 256, 320 × 320, 448 × 448, 512 × 512, and 600 × 600 pixels. Error bars represent standard deviation of the area under the curve calculated via the DeLong method.
The performance plateau in Figure 2 at 256 × 256-pixel and 320 × 320-pixel image resolutions can be contrasted with the poorer performance at lower resolutions where diagnostic information contained within the image is lost. Figure 3 highlights these discrepancies for eight diagnostic labels: emphysema, cardiomegaly, hernia, atelectasis, edema, effusion, mass, and nodule. The bar graph shows the percentage AUC performance for 32 × 32-pixel and 64 × 64-pixel image resolution networks compared with more optimally trained networks at a 320 × 320-pixel image resolution. For the diagnostic label of edema, 32 × 32-pixel resolution networks come closest to capturing the performance of the higher resolution network with 88.1% ± 1.5 (standard deviation) (0.814 of 0.924) of the 320 × 320-pixel model performance. For the 64 × 64-pixel resolution networks, these low-resolution networks have over 85% of the AUC performance of the 320 × 320-pixel resolution networks for the diagnostic labels of atelectasis, edema, effusion, and thoracic mass.
Figure 3:
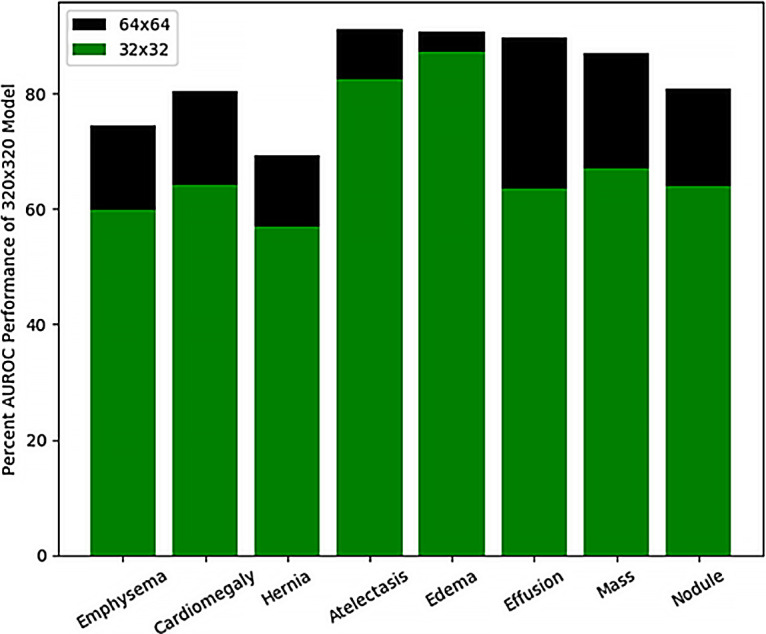
Bar graph shows percentage area under the receiver operating characteristic curve (AUROC) achievable with low-resolution models compared with a higher resolution 320 × 320-pixel resolution model for eight example diagnostic labels. Edema prediction models at 32 × 32-pixel resolution are able to capture the highest percentage of a 320 × 320-pixel resolution model.
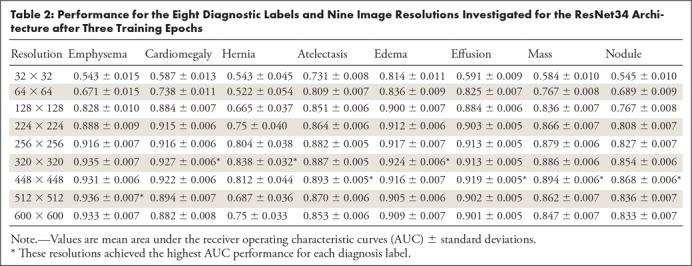
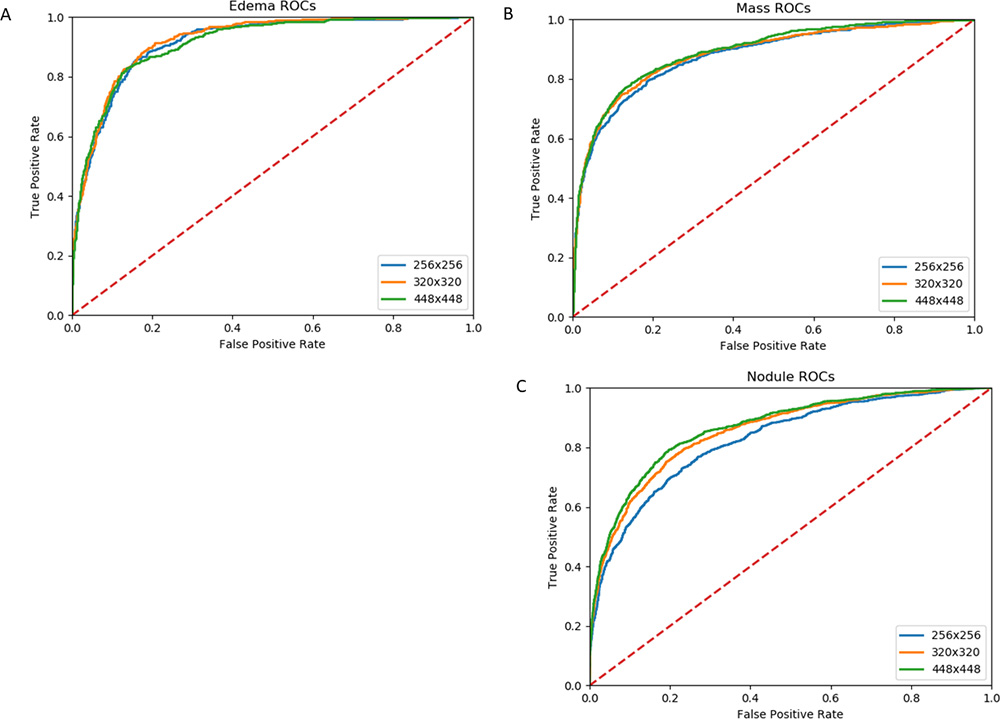
Table 1 depicts further comparison of the AUCs for 64 × 64-pixel resolution ResNet34 models trained for three subsample epochs with 320 × 320-pixel resolution ResNet34 models. Each of the eight diagnostic labels under consideration is listed along with the total number of positive samples with this label contained within the dataset (and the number of cases for which this is the only finding label). Diagnosis-specific AUCs from prior reports that have investigated this dataset with deep learning are also included for comparison (1,4). Table 2 further supplements Table 1 and Figure 2 by listing the AUC and standard deviation for all eight diagnosis labels and nine image resolutions that we have investigated for the ResNet34 architecture. The image resolution with the optimal AUC for each diagnosis label is shown in a footnote. For selected example receiver operating characteristics, see Section 2, Appendix E2 (supplement). A z-score–based statistical analysis showed that the optimal resolution had a significantly higher AUC compared against all other image resolutions for all diagnosis labels (P < .05).
Table 1:
Comparison of the AUCs for 64 × 64-Pixel Resolution ResNet34 Models Trained for Three Subsample Epochs with the ResNet34 Architecture
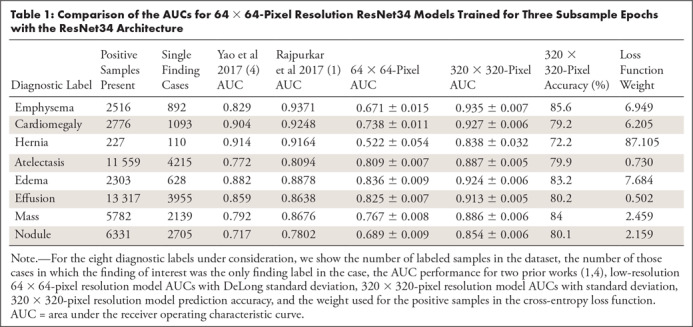
Table 2:
Performance for the Eight Diagnostic Labels and Nine Image Resolutions Investigated for the ResNet34 Architecture after Three Training Epochs
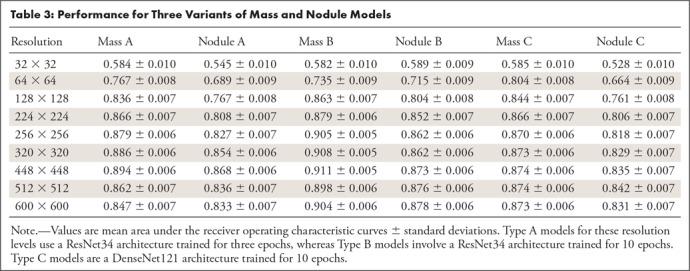
An interesting example of different resolution sensitivities for different diagnosis labels occurs when comparing the thoracic “mass” and “nodule” labels. Figure 4 compares the validation set AUCs at varying resolutions for “mass” and “nodule” detection networks. Two different CNN architectures (ResNet34 and DenseNet121) were trained for each diagnostic label for 10 iterations. CNN performance at thoracic “mass” detection (green and black curves) noticeably achieves higher performance than “nodule” detection (blue and gold curves) at the lower image resolutions of 64 × 64 and 128 × 128 pixels. At 224 × 224-pixel input image resolution and above, performances plateau but the “mass” detection networks still outperform the “nodule” networks within each architecture class. Table 3 further expands on Figure 4 by showing the AUC and standard deviation of performance for mass and nodule models under three different modeling paradigms.
Figure 4:
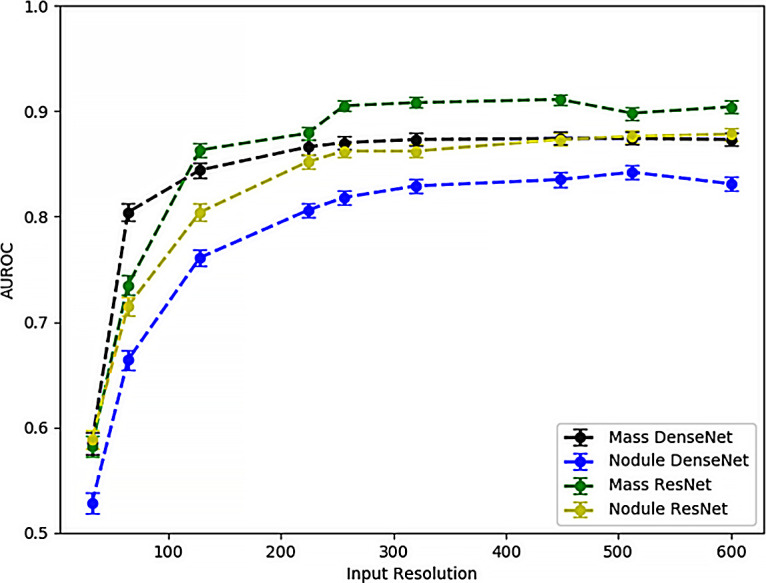
Comparison of area under the receiver operating characteristic curve (AUROC) as a function of input image resolution for “mass” and “nodule” detection models trained for two different architectures (ResNet34 and DenseNet121) for 10 subsample epochs. Mass prediction models achieve better performance at lower resolutions, which is presumptively attributable to the larger size (>3 cm) of pulmonary masses compared with pulmonary nodules.
Table 3:
Performance for Three Variants of Mass and Nodule Models
Discussion
Prior work on the NIH ChestX-ray14 dataset has focused on whether deep learning performance can exceed that of clinical radiologists (1). Other radiology deep learning research focused on other modalities and applications has investigated whether artificial intelligence can augment a radiologist’s performance for breast cancer detection in mammography (14) or if artificial intelligence can help prioritize the reading order for a study list in a triage scenario (15). In this study, when each selected label is considered separately, the AUCs have similar or higher performance compared with the multilabel DenseNet121 model in Rajpurkar et al (1) and other ChestX-ray14 deep learning approaches (3,4). However, our goal is not to report incremental model improvements based on different choices of hyperparameters and image augmentation, but instead to clarify the implications of some of these modeling choices, specifically with regard to image resolution. For six out of eight diagnostic labels for which our present approach outperforms the previous literature values, our goal is not to claim direct superiority of our techniques or approaches. We pointedly moved away from some of the training paradigms of other studies (1,3,4) by training binary networks on dataset subsamples instead of multilabel models on the full dataset and, as a consequence, disinvite direct performance comparisons, because the validation set of images is not consistent between our analysis and prior reports. Nevertheless, our binary classification models possibly have an advantage over multilabel models in that model hyperparameters and network weights can be customized and optimized for each specific diagnosis label. In multiple nonradiology applications requiring large-scale analysis of image data in a time sensitive manner, having marginally reduced CNN performance with a multilabel model compared with a large number of binary classification networks might be a worthwhile trade-off for the sake of reduced computational overhead, especially owing to the many likely computational redundancies in such an approach. However, for radiology deep learning applications, particularly those focused on critical findings, even small performance changes can potentially have dramatic effects on patient care and outcomes, which would make increased computational overhead more tolerable than in other domains.
The main focus of our results shows that some findings such as emphysema and pulmonary nodules benefit more from higher image resolution for increased AUC performance than other diagnoses such as thoracic masses. For pulmonary nodule detection compared with thoracic mass detection, performance discrepancies between ranges of image resolutions are likely due to the size difference between these findings. By definition, a pulmonary nodule is less than 3 cm, whereas a mass exceeds that size (16). In contrast, emphysema typically presents more diffusely on a radiograph than a nodule or mass, and thus, relatively poor performance at low resolutions likely relates to more generalized loss of information within the images.
Perhaps higher image resolution input models not unambiguously outperforming lower resolution input models might seem counterintuitive. However, before development of the ResNet architecture and residual learning blocks, very deep neural network architectures frequently encountered a problem of higher training error (loss) compared with shallower model equivalents as an increased number of model parameters reduced the tractability of optimization (7). Therefore, the present issue of increasing image resolution not necessarily improving performance can perhaps be likened to this similar phenomenon in which the higher parameter count presents an obstacle to performance not just owing to the risk of overfitting but also owing to the increased complexity of the optimization problem.
In the field of radiology, different deep learning applications have employed many different image resolutions that can be compared with our nine selected image resolutions. For example, 3D U-Net liver volumetry has used 128 × 128 × 128 arrays (17), while pediatric elbow fraction classification has used 500 × 500-pixel inputs (18). Subtle musculoskeletal fraction detection is another case potentially similar to our pulmonary nodule label here, where increased image input resolution benefits performance owing to the size of the finding itself.
When investigating image resolution impact in nonradiology deep learning, CIFAR-10 is a classic dataset for low-resolution (32 × 32-pixel) images (19). For comparison, ImageNet is a large diverse image dataset with 14 197 122 images in a variety of resolutions (20,21). Effective weights for models trained on this dataset can then be used to initialize models targeted at other applications (6,7), as has been done here via transfer learning, although development of medical image-specific model weight initializations may allow for further modeling improvements and training time reductions in the future.
As hardware improvements and algorithmic advancements continue to occur, developing radiology deep learning applications at higher image resolutions becomes continuously more feasible. One limitation of our present work was that, owing to graphics processing unit memory constraints, we fixed our batch size at eight for all models, as our hardware was not capable of training high-resolution models at larger batch sizes. However, as hardware advances make graphics processing units with larger amounts of random access memory increasingly available, there is an opportunity for obtaining better performance from high image resolution models with larger batch sizes. Additionally, the natural language processing labels in the ChestX-ray14 dataset are known to be imperfect, which places a potential limitation on achievable AUC, independent of selected image resolution.
In this study, despite limitations, we have shown that, as would be intuitively expected, subtler findings benefit from CNN training at relatively higher image resolutions, specifically for the case of pulmonary nodule detection versus mass detection on chest radiographs. Moreover, as advancements are made toward improving techniques for deep learning hyperparameter selection (8), the consequences of proper and improper selection of input image resolution in radiology deep learning applications may further be elucidated.
APPENDIX
SUPPLEMENTAL FIGURES
Disclosures of Conflicts of Interest: C.F.S. disclosed no relevant relationships. B.M.S. disclosed no relevant relationships.
Abbreviations:
- AUC
- area under the receiver operating characteristic curve
- CNN
- convolutional neural network
- NIH
- National Institutes of Health
References
- 1. Rajpurkar P , Irvin J , Zhu K , et al . CheXNet: radiologist-level pneumonia detection on chest x-rays with deep learning . ArXiv 1711.05225 [preprint] http://arxiv.org/abs/1711.05225. Posted 2017. Accessed February 2, 2019 .
- 2. Irvin J , Rajpurkar P , Ko M , et al . CheXpert: a large chest radiograph dataset with uncertainty labels and expert comparison . http://www.aaai.org. Accessed February 2, 2019 .
- 3. Wang X , Peng Y , Lu L , Lu Z , Bagheri M , Summers RM . ChestX-ray8: hospital-scale chest x-ray database and benchmarks on weakly-supervised classification and localization of common thorax diseases . https://uts.nlm.nih.gov/metathesaurus.html. Accessed February 2, 2019 .
- 4. Yao L , Poblenz E , Dagunts D , Covington B , Bernard D , Lyman K . Learning to diagnose from scratch by exploiting dependencies among labels . ArXiv 1710.10501 [preprint] https://arxiv.org/abs/1710.10501. Posted 2017. Accessed February 2, 2019 .
- 5. Battiti R . Using mutual information for selecting features in supervised neural net learning . IEEE Trans Neural Netw 1994. ; 5 ( 4 ): 537 – 550 . [DOI] [PubMed] [Google Scholar]
- 6. Huang G , Liu Z , Van Der Maaten L , Weinberger KQ . Densely connected convolutional networks . https://github.com/liuzhuang13/DenseNet. Accessed February 2, 2019 .
- 7. He K , Zhang X , Ren S , Sun J . Deep residual learning for image recognition . http://image-net.org/challenges/LSVRC/2015/. Accessed February 2, 2019 .
- 8. Smith LN . A disciplined approach to neural network hyper-parameters: part 1–learning rate, batch size, momentum, and weight decay . ArXiv 1803.09820 [preprint] https://arxiv.org/abs/1803.09820. Posted 2018. Accessed February 2, 2019 .
- 9. Smith LN . Cyclical learning rates for training neural networks . ArXiv 1506.01186 [preprint] https://arxiv.org/abs/1506.01186. Posted 2015. Accessed February 2, 2019 .
- 10. DeLong ER , DeLong DM , Clarke-Pearson DL . Comparing the areas under two or more correlated receiver operating characteristic curves: a nonparametric approach . Biometrics 1988. ; 44 ( 3 ): 837 – 845 . [PubMed] [Google Scholar]
- 11. Sun X , Xu W . Fast implementation of DeLong’s algorithm for comparing the areas under correlated receiver operating characteristic curves . IEEE Signal Process Lett 2014. ; 21 ( 11 ): 1389 – 1393 . [Google Scholar]
- 12. Rosenkrantz AB , Deng FM , Kim S , et al . Prostate cancer: multiparametric MRI for index lesion localization--a multiple-reader study . AJR Am J Roentgenol 2012. ; 199 ( 4 ): 830 – 837 . [DOI] [PubMed] [Google Scholar]
- 13. Atwi NE , Smith DL , Flores CD , et al . Dual-energy CT in the obese: a preliminary retrospective review to evaluate quality and feasibility of the single-source dual-detector implementation . Abdom Radiol (NY) 2019. ; 44 ( 2 ): 783 – 789 . [DOI] [PubMed] [Google Scholar]
- 14. Rodríguez-Ruiz A , Krupinski E , Mordang JJ , et al . Detection of breast cancer with mammography: effect of an artificial intelligence support system . Radiology 2019. ; 290 ( 2 ): 305 – 314 . [DOI] [PubMed] [Google Scholar]
- 15. Annarumma M , Withey SJ , Bakewell RJ , Pesce E , Goh V , Montana G . Automated triaging of adult chest radiographs with deep artificial neural networks . Radiology 2019. ; 291 ( 1 ): 196 – 202 . [DOI] [PMC free article] [PubMed] [Google Scholar]
- 16. Snoeckx A , Reyntiens P , Desbuquoit D , et al . Evaluation of the solitary pulmonary nodule: size matters, but do not ignore the power of morphology . Insights Imaging 2018. ; 9 ( 1 ): 73 – 86 . [DOI] [PMC free article] [PubMed] [Google Scholar]
- 17. Marinelli B , Kang M , Martini M , et al . Combination of active transfer learning and natural language processing to improve liver volumetry using surrogate metrics with deep learning . Radiol Artif Intell 2019. ; 1 ( 1 ): e180019 . [DOI] [PMC free article] [PubMed] [Google Scholar]
- 18. Rayan JC , Reddy N , Kan JH , Zhang W , Annapragada A . Binomial classification of pediatric elbow fractures using a deep learning multiview approach emulating radiologist decision making . Radiol Artif Intell 2019. ; 1 ( 1 ): e180015 . [DOI] [PMC free article] [PubMed] [Google Scholar]
- 19. Krizhevsky A . Learning multiple layers of features from tiny images . 2009. . https://www.cs.toronto.edu/∼kriz/learning-features-2009-TR.pdf. Accessed February 2, 2019 .
- 20. Deng J , Dong W , Socher R , Li LJ , Li K , Fei-Fei L . ImageNet: a large-scale hierarchical image database . http://www.image-net.org. Accessed February 2, 2019 .
- 21. Russakovsky O , Deng J , Su H , et al . ImageNet large scale visual recognition challenge . Int J Comput Vis 2015. ; 115 ( 3 ): 211 – 252 . [Google Scholar]
Associated Data
This section collects any data citations, data availability statements, or supplementary materials included in this article.