Abstract
Purpose
To investigate the feasibility of automatic identification and classification of hip fractures using deep learning, which may improve outcomes by reducing diagnostic errors and decreasing time to operation.
Materials and Methods
Hip and pelvic radiographs from 1118 studies were reviewed, and 3026 hips were labeled via bounding boxes and classified as normal, displaced femoral neck fracture, nondisplaced femoral neck fracture, intertrochanteric fracture, previous open reduction and internal fixation, or previous arthroplasty. A deep learning–based object detection model was trained to automate the placement of the bounding boxes. A Densely Connected Convolutional Neural Network (or DenseNet) was trained on a subset of the bounding box images, and its performance was evaluated on a held-out test set and by comparison on a 100-image subset with two groups of human observers: fellowship-trained radiologists and orthopedists; senior residents in emergency medicine, radiology, and orthopedics.
Results
The binary accuracy for detecting a fracture of this model was 93.7% (95% confidence interval [CI]: 90.8%, 96.5%), with a sensitivity of 93.2% (95% CI: 88.9%, 97.1%) and a specificity of 94.2% (95% CI: 89.7%, 98.4%). Multiclass classification accuracy was 90.8% (95% CI: 87.5%, 94.2%). When compared with the accuracy of human observers, the accuracy of the model achieved an expert-level classification, at the very least, under all conditions. Additionally, when the model was used as an aid, human performance improved, with aided resident performance approximating unaided fellowship-trained expert performance in the multiclass classification.
Conclusion
A deep learning model identified and classified hip fractures with expert-level performance, at the very least, and when used as an aid, improved human performance, with aided resident performance approximating that of unaided fellowship-trained attending physicians.
Supplemental material is available for this article.
© RSNA, 2020
Summary
A deep learning model was trained to identify and subclassify hip fractures from radiographs, with an overall binary accuracy for hip fracture detection of 93.7% and a functional subclassification accuracy of 90.8%.
Key Points
■ In this study, a deep learning model achieved an accuracy of 93.7% in the identification of a fracture and an accuracy of 90.8% in a functional subclassification.
■ This model performed, at the very least, at the level of fellowship-trained attending physicians and outperformed the residents under the conditions of our study.
■ When the model’s predictions were provided as an aid, human performance improved, with aided resident performance approximating that of unaided fellowship-trained attending physicians in a multiclass classification.
Introduction
Hip fractures are a substantial cause of morbidity and mortality in the United States and throughout the world, with more than 300 000 cases occurring in 2014 in the United States alone (1). Although age-adjusted hip fracture incidence has decreased in recent years, absolute numbers of hip fractures are expected to increase by 12% by 2030 owing to an aging population (2). Hip fractures, especially in elderly patients, represent a life-changing event and carry a substantial risk of decreased functional status and death, with 1-year mortality rates reported to be as high as 30% (3,4).
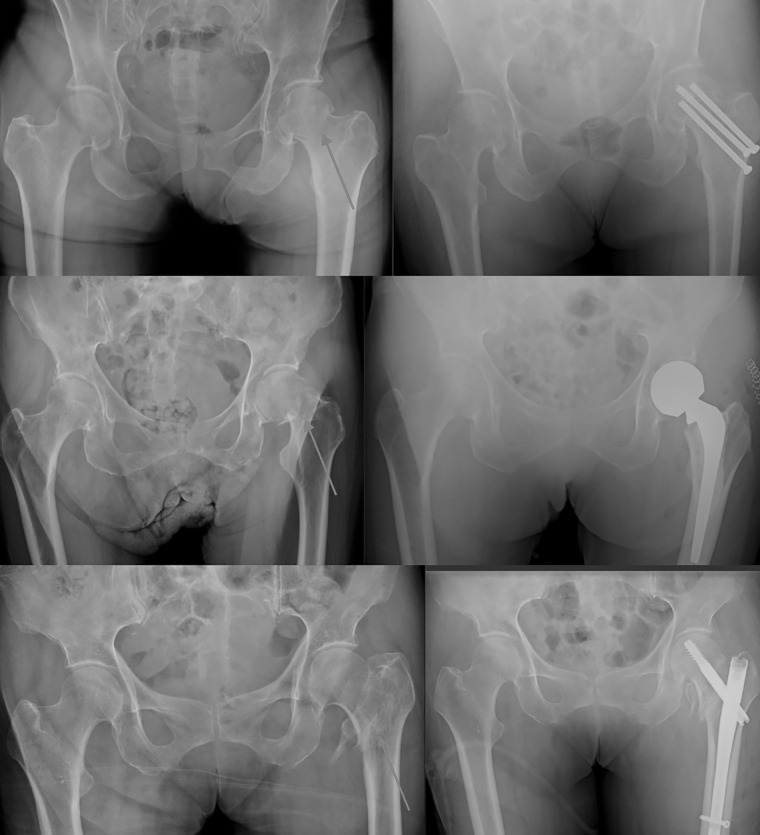
Accurate and timely diagnosis of hip fractures is critical, as outcomes are well known to depend on time to operative intervention (5–7). Specifically, Maheshwari et al recently showed that each 10-hour delay from admission to surgery is linearly associated with 5% higher odds of 1-year mortality (6). Efficient radiographic identification and classification of a hip fracture represents a key component to optimizing outcomes by avoiding unnecessary delays, especially as the implant choice for a hip fracture depends almost entirely on its radiographic classification, and the initial image often contains enough information to begin planning the definitive surgery (Fig 1) (8,9). Additionally, up to 10% of hip fractures are occult on radiographs (24). In these situations, subsequent imaging is often required for diagnosis, including CT, bone scan, and MRI, which may increase the time to diagnosis and the overall cost of care (25).
Figure 1:
Frontal radiographs of the pelvis show implant choice by fracture type. Top row: a nondisplaced femoral neck fracture, which is treated with cannulated screw fixation. Middle row: a displaced femoral neck fracture, treated with arthroplasty. Bottom row: an intertrochanteric fracture, which is treated with internal fixation with cephalomedullary nail. White arrows point to fractures.
Machine learning and deep learning with artificial neural networks, in particular, have recently shown great promise in achieving human- or near-human–level performance in a variety of highly complex perceptual tasks that were traditionally challenging for machines to perform, including image classification and natural language processing. Artificial neural networks exploit a stacked architecture of layers of “neurons” to learn hierarchical representations of data across multiple levels of abstraction, calculating more and more complex features in each layer. Convolutional neural networks, the standard in computer vision, use sets of filters in each layer to generate many complex features from an input image and have shown great promise in many areas of radiography, including in many musculoskeletal applications (10–16).
In this study, we proposed an automated system of hip fracture diagnosis and classification using deep learning with a convolutional neural network. Such a system has enormous clinical importance as it may decrease the rate of missed fractures, the reliance on advanced imaging such as MRI, and the time to operative intervention, thus potentially improving patient outcomes. We hypothesized that this system will be, at the very least, equivalent to expert performance in hip fracture identification and classification and will improve physician performance when its predictions are used as an aid.
Materials and Methods
Dataset Acquisition
After obtaining institutional review board approval, our radiology report database was queried retrospectively for hip or pelvic radiographs obtained in the emergency department with the words “intertrochanteric” or “femoral neck” occurring near “fracture” from 1998 to 2017 in patients aged 18 years or older. A total of 919 of these studies were identified as likely containing a hip fracture based on a manual review of the reports and were included in the study. An additional 199 studies were chosen at random from the database of hip or pelvic radiographs using the same year and age cutoffs. Each radiograph from these 1118 studies was then extracted and processed using the Python Pydicom package (version 1.1.0; https://pydicom.github.io/pydicom/stable/). A patient flowchart is shown in Figure E1 (supplement).
All images were reviewed by two postgraduate year 4 orthopedic residents (J.D.K., K.M.H.) using the Visual Geometry Group Image Annotator (University of Oxford, Oxford, England) (17). All radiographs that included at least one hip taken from an anteroposterior projection of the patient were included, including the anteroposterior pelvis, anteroposterior hip, and frog-leg lateral views; cross-table lateral views and images not including the hip were excluded. Bounding boxes were drawn around each hip, and each was classified as unfractured, fractured, or containing hardware. Fractures were further subclassified as nondisplaced femoral neck (FN) fractures, displaced FN fractures, or intertrochanteric fractures. The hardware was subclassified as previous internal fixation (open reduction and internal fixation) or arthroplasty and was counted as “no fracture” in binary fracture prediction. In cases of uncertainty, the patient’s subsequent imaging was reviewed, and further CT, MRI, and postoperative imaging was used as ground truth. If an operation eventually occurred, the label was inferred from the operative fixation chosen (Fig 1). A total of 3026 bounding boxes were labeled in this fashion. These came from 1999 radiographs in 972 patients, with 1877 different hips represented (eg, right and left hips), indicating that 93.1% of patients had each of their hips seen on at least one radiograph. The bounded hip images were split by the accession number into the training, validation, and test sets using a 60:25:15 split, with a randomization by class distribution to ensure an equal distribution of classes among datasets. This ensured that all images from a study appeared in only one dataset.
Model Architecture
We selected a Densely Connected Convolutional Neural Network (DenseNet) architecture consisting of 169 layers for fracture classification. In a DenseNet, convolutional layers are placed in discrete “dense blocks,” and within those blocks, a layer receives as input all activations from the previous layers within the block (19). This feature reuse allows for a more compact model with fewer parameters and reduced overfitting, which is particularly important in our training set that is relatively small in size (19). This choice of models was verified empirically by testing against a variety of different model architectures, including VGG-19, InceptionV3, and InceptionResNetV2.
To further combat overfitting in our dataset, the DenseNet was initialized with ImageNet-pretrained weights (20). The ImageNet dataset consists of more than 1 million images separated into 1000 individual classes (29). Training models first on the ImageNet dataset and then fine-tuning on the task at hand has been shown to achieve faster model convergence and improved performance, especially when working with relatively small datasets, which may otherwise be insufficient to learn a deep representation of data from scratch (30,31).
An attention pooling mechanism was added to the end of the model via the addition of a squeeze-and-excitation block (32). On a conceptual level, this block acts as a learnable channel-wise weight mask that allows the network to dynamically prioritize the most salient features in a given image for classification, such as the radiolucency of a fracture, and empirically has shown performance improvements in our dataset as shown in Table E1 (supplement). The final layer is a softmax layer with one output for every hip class (see Fig E3 [supplement] for an overview of the model architecture), and binary prediction is computed by summing the probabilities of the fractured and unfractured classes.
Data Processing and Augmentation
Before being inserted in the model, the hip images were resized to 224 × 224 pixels and replicated into three channels to be compatible with the ImageNet-pretrained model, and left hips were flipped to appear as right hips. While downsampling the images to 224 × 224 pixels may cause some loss of information, it was necessary to make our images compatible with the ImageNet-pretrained model, and attempts to train our model on 500 × 500 pixel and 1000 × 1000 pixel images failed to converge consistently given our small sample size. We evaluated this effect of downsampling via a comparison with human observers as described in the following section. To make our model invariant to differences in the zoom of the bounding box, each hip in the training set appeared twice, with differing sizes of bounding boxes. To each of these images, we applied data augmentation with three types of contrast changing—cutout (18), Gaussian-mixture masking, and bounding box wiggling—to generate six additional images (Fig E2 [supplement]). The effect of each of these data augmentations was validated empirically and is shown in Table E1 (supplement).
Model Training
The DenseNet was initialized with ImageNet-pretrained weights (20) as mentioned and trained using the Adam optimizer (21) with a learning rate of 0.00001, batch size of 25, and learning rate decay of 0.9 to minimize weighted cross-entropy loss. The small learning rate chosen here allowed our model’s weights to be fine-tuned to our specific dataset while avoiding forgetting the ImageNet weights that already put the model close to the local minimum for our task. Weighted cross-entropy loss was chosen to compensate for the difference in prevalence of each hip class. Training was stopped after 10 epochs passed without improvement in validation accuracy, and the model with the highest validation set accuracy was then chosen. All code was implemented in Python 3.6.5 utilizing the Tensorflow 1.8.0 (https://www.tensorflow.org) and Keras 2.2.0 (https://keras.io) packages. Training was done with an Nvidia Titan Xp GPU with 12 GB of GDDR5× memory (Nvidia, Santa Clara, Calif).
Bounding Box Detection
To automate the process of hip fracture detection end-to-end, it is necessary to train an object detection algorithm to place the bounding boxes automatically. This was implemented via an object detection deep convolutional neural network, which was implemented in Python with the TensorFlow Object Detection API (Google, Mountain View, Calif) on a single-shot detector with the Resnet-50 feature pyramid network architecture (22,23). The model’s output consisted of bounding boxes around the upper extremity of the femur and labels of left versus right hip. Nonmax suppression was performed to eliminate redundant boxes with constraints of no more than one box per class in a given image and an intersection over union threshold of 0.3. The input data were augmented by randomly cropping the images. The model was pretrained on ImageNet classification and COCO (common objects in common) object detection datasets and trained with Nvidia Titan XP GPU for 25 000 iterations (347 epochs; a batch size of 16 images) on the training dataset of radiographs with bounding boxes defined by a postgraduate year 4 orthopedic resident (J.D.K., K.M.H.). To evaluate the performance of the network, inference was performed on the radiographs from the validation set and, finally, on the test set, using the same dataset splits as the classification algorithm. Detection accuracy was measured with the intersection over union metric, and the performance of the DenseNet classification algorithm was compared using manually located versus automatically located bounding boxes.
Model Evaluation and Statistical Analysis
The trained model’s performance was evaluated using the receiver operating characteristic (ROC) curve and its area under the curve (AUC) and via calculation of key performance metrics including accuracy, sensitivity, and specificity. To calculate these metrics, we performed bootstrapping with 2000 iterations, where the first step in each iteration was to randomly drop all images except one from each patient; we then reported the mean and 95% confidence interval (CI) of the bootstrapped statistic. In this way, we ensured that each image was independent from all others in our evaluation and that no patient had more than one image in each evaluation subset. The 95% CI bands were generated around the ROC curve via vertical averaging (33). The time to the preliminary and final radiology reading for our dataset was also recorded, and averages, standard deviations, and ranges were reported after excluding outliers (all points that lie more than 1.5 times the interquartile range more or less than the third or first quartiles, respectively).
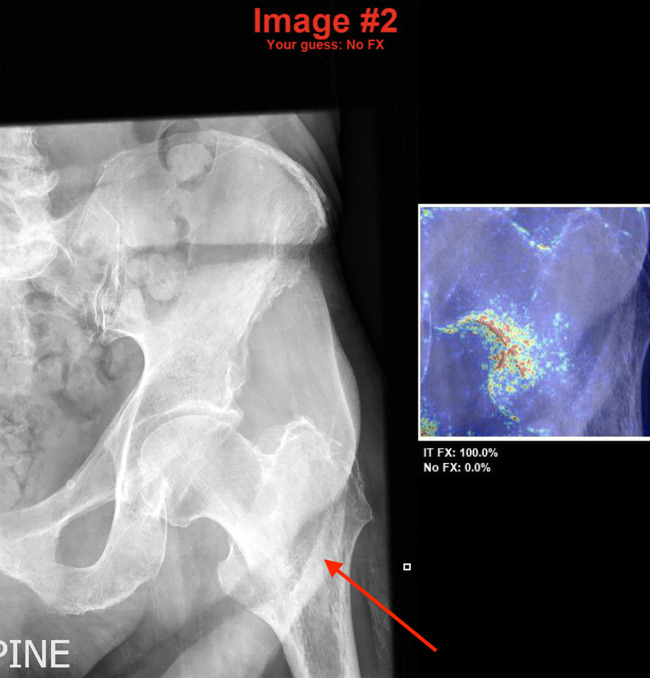
A total of 100 images were chosen at random from the test set for comparison with human evaluators. As our human experts, we selected two trauma fellowship–trained orthopedic surgeons (P.T. and E.G.M., average of 10 years of postfellowship experience) and two musculoskeletal fellowship–trained radiologists (R.P. and K.C.M., average of 2 years of postfellowship experience). As residents often perform the initial image interpretation in an academic setting, two postgraduate year 4 residents in each of the fields of emergency medicine (B.F.D., K.A.P.), orthopedics (M.Z., E.J.G.), and radiology (J.H.S., A.W.) were also selected. Each physician was shown the 100 images exactly as input into the model (“model-quality” images), and after 1 week, they evaluated the same hips in a shuffled order at the full resolution and size (“full-quality” images). To assess the effect of model-aided image reading, each physician was finally presented with the model’s heatmap and top two suggestions when their answer differed from that of the model with the full-quality images, and they were asked to provide a final prediction (Fig 2).
Figure 2:
Model-aided conditions. In cases where the human observer’s answer differed from the model, they were shown the original image with their prediction along with the model heatmap and top two model predictions with probabilities. In this case, the human observer is presented with the model’s prediction of an intertrochanteric fracture (denoted by the white arrow added manually for the purpose of this figure), which is correct, after stating that there was no fracture. FX = fracture, IT = intertrochanteric.
Using the method specified earlier to ensure the independence of observations, key performance metrics were calculated for each group of observers, and Cohen κ coefficients were then calculated to measure each observer’s agreement with the ground truth. Binary and multiclass performance for the model versus human observers and between different groups of human observers were compared via differences in Cohen κ coefficients with 95% CIs of these differences, which were computed via a bootstrapping test with 2000 iterations. Additionally, we plotted the sensitivity and specificity point estimates for each group of human observers on the model’s ROC curve with 95% confidence bands (34) for binary classification. We defined performance to be statistically superior when the CI for the difference in Cohen κ coefficients is positive throughout and does not cross zero, and noninferior when the CI does not go below the noninferiority margin, which we defined empirically to be the average between the individual difference in Cohen κ coefficients for each pair of human observers under all conditions tested (ie, the mean of the differences in binary and multiclass Cohen κ coefficients between the two orthopedic attending physicians, between the radiology attending physicians, between the orthopedic residents, between the radiology residents, and between the emergency department residents under model-quality, full-quality, and model-aided conditions). This establishes the limits of noninferiority to be the average difference between two observers with the same training. Additionally, when determining if performance in binary classification of the model exceeds a group of human observers, we also require the model’s ROC curve confidence bands to exceed the sensitivity and specificity point of that group.
Results
Model Performance
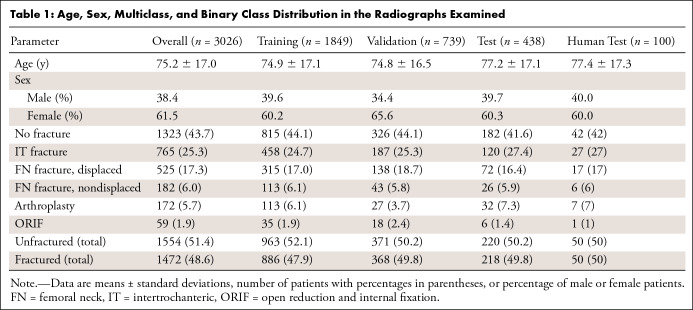
The average age of patients included in the study was 75.2 years ± 17.0 (standard deviation), with 62% female patients. The age, sex, multiclass, and binary class distributions of our dataset are shown in Table 1. Using a Pearson χ2 test, we found that there was no statistically significant difference in the distribution between the different datasets (P = .866 for multiclass distributions; P = .898 for binary distributions). Regarding time to radiology reading, the average time from examination completion to generation of the preliminary radiology report was 238 minutes ± 333 (range, 3–1424 minutes), and to generation of the final report was 767 minutes ± 653 (range, 2–2885 minutes).
Table 1:
Age, Sex, Multiclass, and Binary Class Distribution in the Radiographs Examined
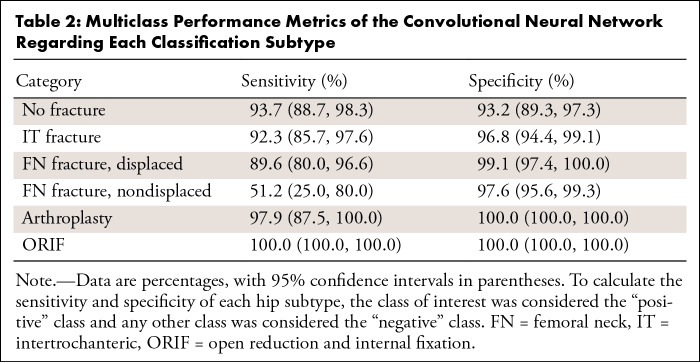
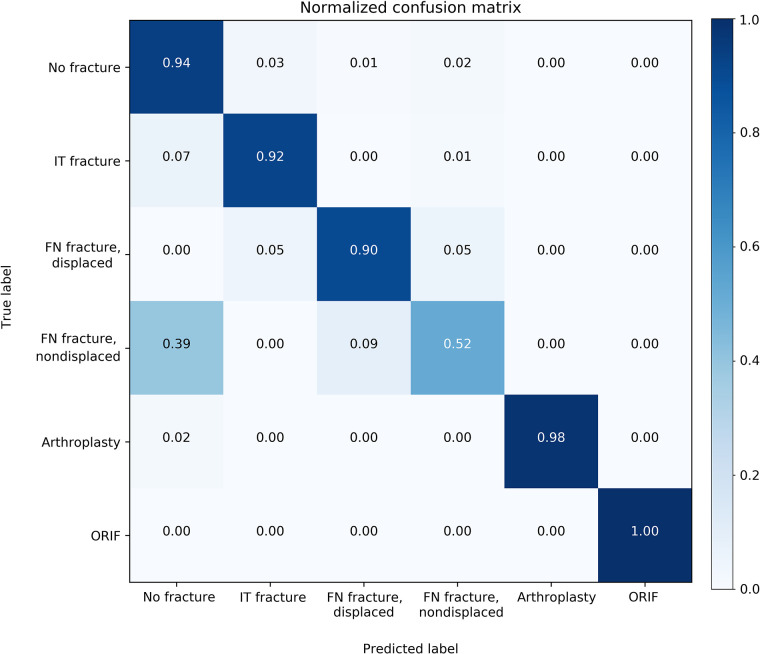
When evaluated on the overall held-out test set, the model’s binary accuracy for the presence of a fracture was 93.7% (95% CI: 90.8%, 96.5%), with a sensitivity of 93.2% (95% CI: 88.9%, 97.1%) and a specificity of 94.2% (95% CI: 89.7%, 98.4%). The multiclass accuracy was 90.8% (95% CI: 87.5%, 94.2%) with sensitivities and specificities for each class type shown in Table 2 and a confusion matrix shown in Figure 3. Specificity was universally high for all fracture types (≥ 96.8%), indicating very few false-positive diagnoses. While sensitivity for displaced FN fractures was 89.6%, 100% of these were classified as a fracture of some type, indicating 100% binary sensitivity for these fracture types. Similarly, while approximately half of nondisplaced FN fractures were correctly identified as such, 61% were identified as FN fractures of some type. An ablation table showing the effect on multiclass accuracy over the validation and test sets of our image augmentation techniques and attention mechanism is shown in Table E1 (supplement). Table E2 (supplement) shows the results of different model architectures evaluated under the same conditions (with all augmentations and the attention mechanism added) and demonstrates the superior performance of the DenseNet169 model despite containing fewer parameters.
Table 2:
Multiclass Performance Metrics of the Convolutional Neural Network Regarding Each Classification Subtype
Figure 3:
Normalized confusion matrix of multiclass classification. The y axis represents the true label, and the x axis represents the model’s prediction. FN = femoral neck, IT = intertrochanteric, ORIF = open reduction and internal fixation.
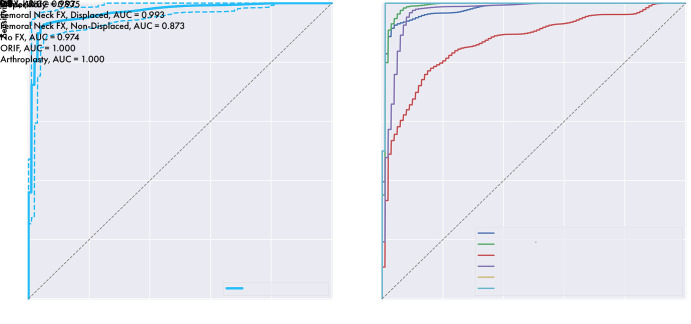
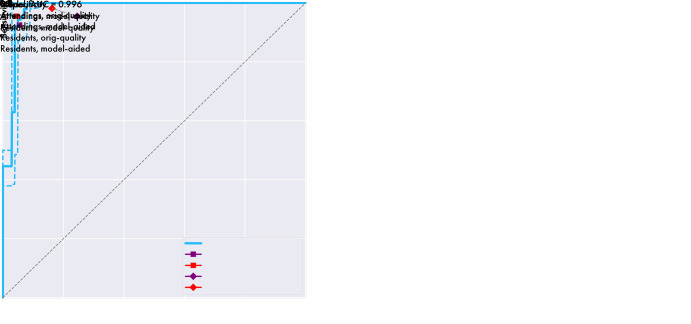
Binary classification ROC curve has an AUC of 0.975, indicating excellent agreement with the ground truth, and is shown with multiclass ROC curves and the respective AUCs for each class type in Figure 4. AUCs generally were near 1, indicating excellent agreement with the ground truth, with somewhat lower performance for nondisplaced FN fractures with an AUC of 0.873.
Figure 4:
The model’s receiver operating characteristic (ROC) curves for binary classification (left) and each classification subtype (right). Binary represents the model’s ROC curve for detecting a hip fracture, overall, and is shown with 95% confidence bands in dashed lines. AUC = area under the curve, FX = fracture, IT = intertrochanteric, ORIF = open reduction and internal fixation.
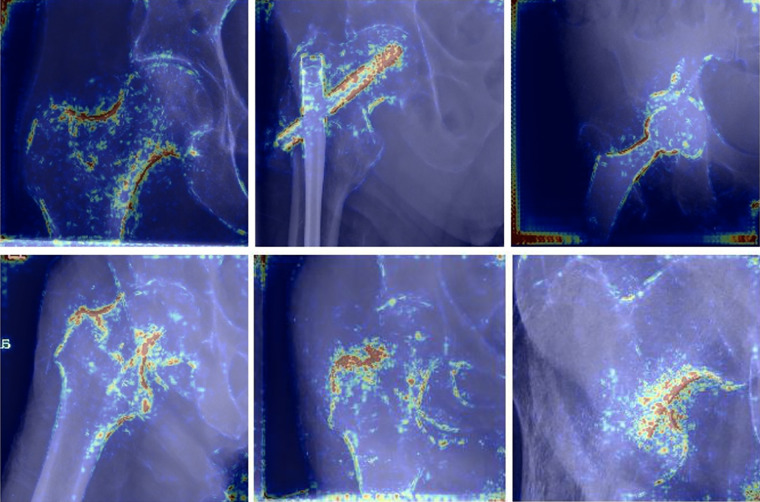
Heatmaps for correctly predicted images in each of the six categories are shown in Figure 5. Qualitative assessment of these images indicates high importance of cortical outlines in fracture classification, while the lucency of the fracture line itself appears to receive comparatively little attention.
Figure 5:
Examples of heatmaps for the model’s correct predictions for each of the six classification types (from top-left clockwise: no fracture, open reduction and internal fixation, arthroplasty, intertrochanteric fracture, nondisplaced femoral neck fracture, and displaced femoral neck fracture). Of note, the model appears to pay attention to cortical outlines to make its classification, while the lucent fracture line appears to receive very little attention.
Bounding Box Detection
The trained RetinaNet object detection algorithm correctly identified every labeled hip in the test dataset with an average intersection over union value of 0.92 ± 0.04 and a minimum value of 0.64. On six radiographs, the detection algorithm labeled a hip that had not been labeled by the evaluator as it was only partially contained in the image. An example radiograph with manual and automatically labeled boxes is shown in Figure 6. The DenseNet achieved a binary accuracy of 94.2% (95% CI: 91.4%, 97.1%) and a multiclass accuracy of 91.2% (95% CI: 87.9%, 94.4%) on the automatically generated bounding boxes, which did not differ significantly from the performance on manually labeled boxes as measured by the difference in Cohen κ coefficients. These results are shown in detail in Table E3 (supplement).
Figure 6:
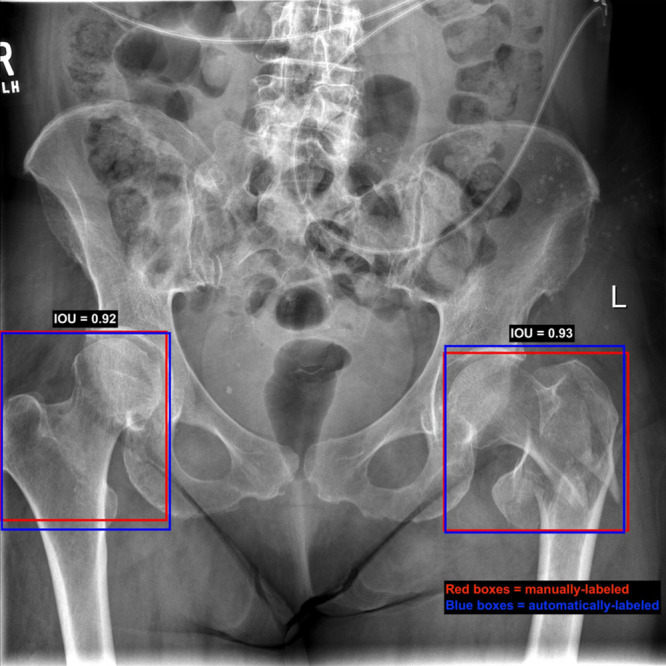
Manual versus automated bounding box placement on an image from our test set. On this image, red boxes represent the manually labeled boxes, while the blue boxes are the output of the box detection model. Intersection over union (IOU) of the right hip is 0.92 and for the left hip is 0.93. The right hip is not fractured here, while the left hip has an intertrochanteric fracture.
Comparison with Human Performance
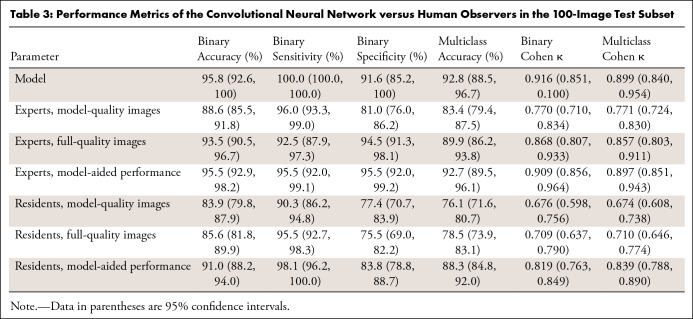
Results of the human interpretation versus model performance of the 100-image subset are shown in Table 3, and the sensitivities and specificities of the pooled experts and residents are plotted on the model’s ROC with 95% confidence bands in Figure 7. Performance of the human observers for each of the fracture subtypes is shown in Table E4 (supplement). As validation of the ground truth, all labels were found to match the consensus expert predictions in the 78 cases in which all experts’ predictions agreed. Comparisons between the model and human observers for binary and multiclass Cohen κ coefficients with 95% CIs are shown in Table 4, and comparisons between human observers are shown in Table 5. The average difference in Cohen κ between individuals in each pair under all conditions for binary and multiclass classification was 0.103, and as described earlier, this was set as our noninferiority margin.
Table 3:
Performance Metrics of the Convolutional Neural Network versus Human Observers in the 100-Image Test Subset
Figure 7:
The model’s receiver operating characteristic (ROC) curve with 95% confidence bands (dotted lines) versus human observers. Left: Graph shows the model’s ROC curve versus sensitivity and specificity for the human observers when using model-quality images. Right: Graph shows the model’s ROC curve versus these metrics when human observers use full-quality images in both unaided and aided conditions. Note that this only reflects performance in a binary fracture detection task and does not reflect performance in a subclassification task. AUC = area under the curve, orig = original.
Table 4:
Difference in Cohen κ Values with 95% Confidence Intervals Calculated Using Bootstrapping with 2000 Iterations for a Comparison of Multiclass Classification of the Model with Human Observers
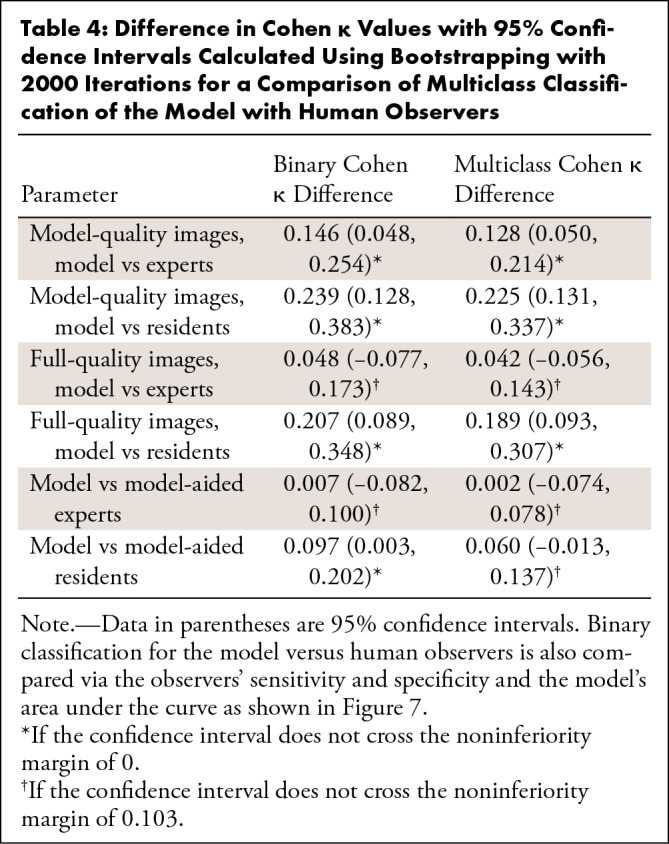
Table 5:
Difference in Cohen κ Values with 95% Confidence Intervals Calculated Using Bootstrapping with 2000 Iterations for a Comparison of Binary and Multiclass Classifications between Human Observers
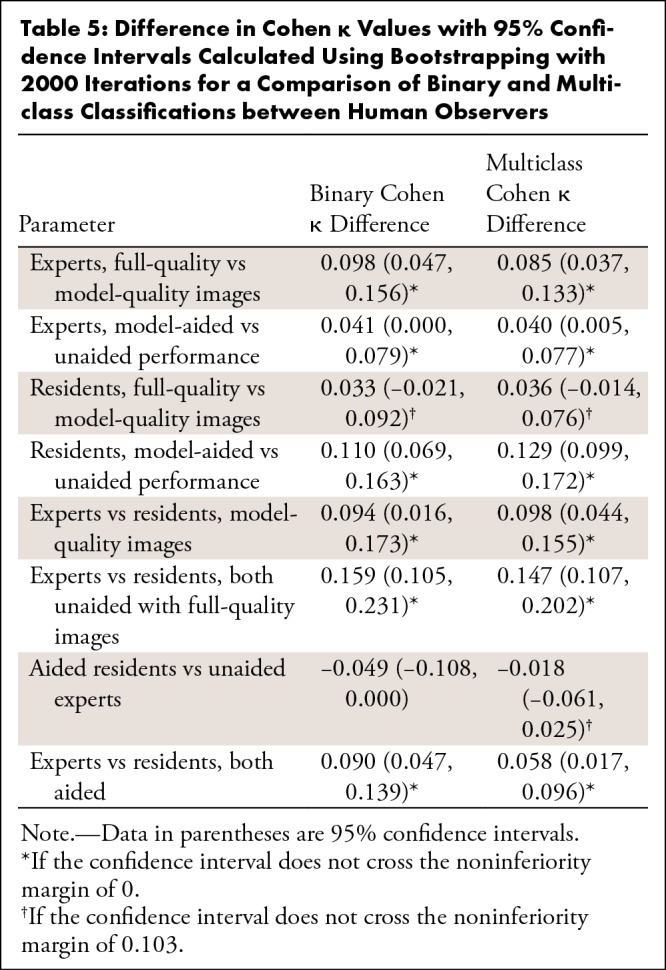
Regarding binary classification, the model outperformed the residents under all conditions, as shown in both Table 4 and Figure 7. The model outperformed the experts when the experts used the “model-quality” images (difference 0.146; 95% CI: 0.048, 0.254, a point below the 95% confidence bands of the model’s ROC), and performed, at the very least, at the expert level as determined by the noninferiority test when the experts used “full-quality” images (difference 0.048; 95% CI: −0.077, 0.173) and under “model-aided” conditions (difference 0.007; 95% CI: –0.082, 0.100). Regarding the multiclass classification, the model outperformed residents when the residents used the “model-quality” (difference 0.225; 95% CI: 0.131, 0.337) or “full-quality” images (difference 0.189; 95% CI: 0.093, 0.307) and was noninferior to residents when residents were using the model as an aid (difference 0.060; 95% CI: –0.013, 0.137). The model outperformed the experts when the experts used “model-quality” images (difference 0.128; 95% CI: 0.050, 0.214), and performed, at the very least, at the expert level via the noninferiority test when the experts used “full-quality” images (difference 0.042; 95% CI: –0.056, 0.143) and when experts were using the model as an aid (difference 0.060; 95% CI: –0.013, 0.137). Expert performance improved significantly when using full-quality rather than model-quality images for both binary classification (difference 0.098; 95% CI: 0.047, 0.156) and multiclass classification (difference 0.085; 95% CI: 0.037, 0.133). When used as an aid to human observers, both resident (binary difference 0.110 with 95% CI: 0.069, 0.163; multiclass difference 0.129 with 95% CI: 0.099, 0.172) and attending physician performance (binary difference 0.041 with 95% CI: 0.000, 0.079; multiclass difference 0.040 with 95% CI: 0.005, 0.077) improved significantly. Interestingly, while experts achieved superior performance relative to residents with either model-quality or full-quality images for both binary and multiclass classifications, model-aided resident performance was noninferior to unaided experts in the multiclass classification (difference –0.018, 95% CI: –0.061, 0.025).
Discussion
In this study, we demonstrated, at the very least, expert-level binary and multiclass classifications of hip radiographs into one of six categories in both fractured and nonfractured groups. To our knowledge, this represents the first report of hip fracture subclassification by deep learning in the literature. The excellent results we have obtained are notable, given the limited size of our training set, which was only 1849 images, which we overcame with the use of data augmentation and the validity of ground truth. As we labeled radiographs, we referred to subsequent imaging, including CT and MRI and postsurgical radiographs, whenever the classification was not obvious. Dominguez et al showed that up to 10% of hip fractures are occult on radiographs (24); therefore, solely using radiographs as ground truth may lead to substantial avoidable bias owing to misclassification. However, because of the potential morbidity of missing a diagnosis of a hip fracture, patients with negative radiographs and high clinical suspicion for a hip fracture (eg, hip pain after fall, inability to ambulate, etc) often undergo advanced imaging with CT or the reference standard MRI, which serves as more reliable ground truth than plain radiographs (25). Additionally, while there will always be some inherent uncertainty about the diagnosis, utilizing the type of surgery as ground truth when necessary minimizes this uncertainty as the treating surgeon has all the information available for diagnosis at the time of surgery (including radiographs, CT, MRI, etc), and the functional classification of a hip fracture dictates the type of operation that a patient undergoes.
In our comparison to fellowship-trained experts, our model showed statistically superior performance when experts used images at the same quality and resolution that the model uses. Using human expert performance as a proxy for Bayes optimal error rate, we demonstrated that few gains are likely to be made in our system using the low-resolution images via further hyperparameter optimization or additional data collection and, therefore, efforts should be focused rather on developing a model that can process higher resolution images. This notion is validated by the statistically significant boost in expert performance between the lower and full-quality images, indicating that some information essential to classification may be lost in downsampling and that we may improve our model’s performance if trained on larger resolution images. In this project, we were restricted to using low resolution images, given our small dataset size and the need for ImageNet pretraining; future research will explore boosting our training set size in a self-supervised fashion using natural language processing and the automated hip detector described in this study, which we hope will allow us to escape the resolution constraints of using an ImageNet-pretrained model.
As fellowship-trained radiologists and orthopedists are not the only persons responsible for reading hip radiographs in the emergency room, we included senior residents in emergency medicine, orthopedics, and radiology in our comparison to human performance. The model achieved statistically superior performance compared with that of residents when using both model-quality and full-resolution images. Additionally, we showed that when using the model as an aid, residents and attending physicians improved their performance, with aided residents approximating the performance of fellowship-trained experts for the multiclass classification. This shows that the model may also be a valuable tool in training physicians to better evaluate hip radiographs for a fracture. These results together suggest that a model such as ours may be used to decrease diagnostic error and reduce the use of advanced imaging in the emergency department.
This tool could be implemented in a variety of ways depending on the needs of the individual clinical environment. In some settings, it may act as a new form of “preliminary” report and alert the relevant parties automatically of the presence of a hip fracture, similar to the function of the automated report at electrocardiography, while a definitive reading is still performed by the radiologist when able. This may be most useful in hospitals that are currently without full-time in-house radiology coverage. As this automated process can occur nearly instantaneously in real time, this may save considerable time by avoiding the approximately 4-hour delay to preliminary reading present in this dataset at our institution, which, as pointed out earlier, may improve not only efficiency in the emergency department but also patient outcomes via decreasing time to surgery. In other clinical settings, it may be used to triage suspected fractures to the top of the reading radiologist’s queue, so that fractures are diagnosed more quickly. In other environments, it may simply function as an aid to boost radiologists’ reading performance as simulated in the “model-aided” conditions in this study.
These results build on a growing body of evidence that suggests the clinical utility of deep learning in musculoskeletal radiography. Lindsey et al recently showed excellent results of a modified U-Net architecture in the detection of wrist fracture on radiographs and, similar to this study, showed a significant boost in human performance when given the model’s predictions as an aid (16). Regarding hip fractures, Gale et al demonstrated radiologist-level performance of the binary classification by comparing the model’s performance to the radiologist’s reports (26), and Urakawa et al demonstrated orthopedist-level detection of intertrochanteric fractures when using model-quality images (27). To our knowledge, no prior study has performed subclassification of hip fracture types.
Limitations
The limitations of this study included the fact that all of our radiographs came from one institution, potentially limiting its generalizability, although we mitigated this by using images obtained with many different scanners over a 20-year duration. Without an external dataset we cannot prove the model’s ability to generalize to outside institutions with their particular radiology equipment and patient demographics, and thus, we are currently working on obtaining a dataset from an external trauma hospital to test our model and overcome this limitation. Additionally, while we investigated several different state-of-the-art model architectures, our search was by no means exhaustive, and it is possible that a different model architecture may achieve higher performance, although any potential gains are likely to be modest, given the model is already achieving better than expert performance under model conditions. An additional limitation was that the classification algorithm depends on a bounded box image, which was generated manually. To this end, we trained the object detection algorithm described earlier and demonstrated equivalent classification performance with these automatically generated boxes, demonstrating a fully automated end-to-end solution with deep learning.
Another limitation in this study was that our model only considered a single image in its prediction, unlike a human interpreter, who may look at several views. For example, apparently subtle FN fractures are often best seen on the lateral image, which was not included in our model. Rayan et al recently demonstrated excellent results from a system that used a convolutional neural network as a feature extractor for images in a given radiographic study and then fed this output into a recurrent neural network to generate study-level predictions for pediatric elbow fractures (28). Such a system may help to improve our model’s performance and represents an exciting area of research.
The biggest limitation of the model presented was the relatively low sensitivity to nondisplaced FN fractures, with only 61% correctly identified as a fracture of some kind in the test set and only 51% correctly subclassified. These are challenging fractures to diagnose, as shown in Table E4 (supplement), which demonstrates that human observers performed even more poorly than the model under all conditions for this fracture subtype. As these are often subtle, we believe that increasing the image resolution and including multiple views into the model’s prediction may improve performance, and we are actively exploring these directions as described earlier. Interestingly, the model has a relatively high-performing ROC curve for this fracture subtype with an AUC of 0.873, but as shown in Figure 8, the prediction threshold of 0.5 results in operating far from the ideal point on this specific curve. If we adjust the detection threshold to reach the ideal point (the point that minimizes the distance from the top-left of the figure), multiclass sensitivity improves to 78.0% with a specificity of 83.9%. This suggests a role for the model suggesting further imaging with CT or MRI if its predicted likelihood of a nondisplaced FN fracture lies above this ideal point’s threshold even though the most likely prediction is no fracture.
Figure 8:
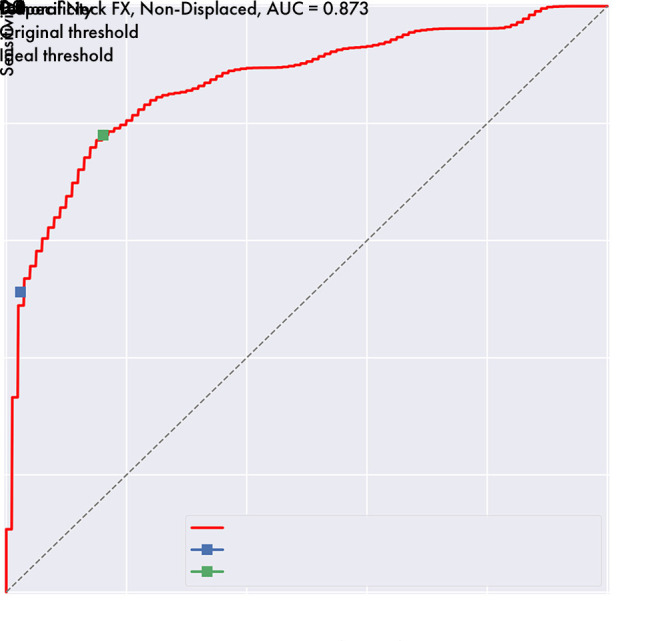
Receiver operating characteristic curve shows a change in sensitivity and specificity of nondisplaced femoral neck fracture detection by varying the detection threshold. With the original model threshold of 0.5, sensitivity for this type of fracture is 51.2% with a specificity of 97.6%. After setting the threshold to reach the curve’s ideal point, which is the point on the line minimizing the distance from the top-left corner, the sensitivity improves to 78.8% with a specificity of 83.9%. AUC = area under the curve, FX = fracture.
Conclusion
Hip fractures are a common cause of morbidity and mortality globally, and recent literature suggests that early operative stabilization of hip fractures is essential to optimize outcomes. This study demonstrated, at the very least, expert-level performance of automatic hip fracture diagnosis by using a fully automated end-to-end deep learning–based system, with functional subclassification that allows stratification into operative groups. Additionally, we demonstrated that when used as a diagnostic aid, our model improves human performance, with aided residents approximating the performance of unaided fellowship-trained experts. Such a system has the potential to decrease diagnostic error and the use of advanced imaging and decrease the time to diagnosis and eventual surgery, which may have an impact on patient recovery and morbidity.
SUPPLEMENTAL TABLES
SUPPLEMENTAL FIGURES
J.D.K. and K.V.C. contributed equally to this work.
Disclosures of Conflicts of Interest: J.D.K. Activities related to the present article: disclosed no relevant relationships. Activities not related to the present article: since April 2019, author is paid consultant with equity stake in Kaliber Labs (not related to the content of this study); Other relationships: disclosed no relevant relationships. K.V.C. disclosed no relevant relationships. K.M.H. disclosed no relevant relationships. P.T. disclosed no relevant relationships. E.G.M. disclosed no relevant relationships. E.J.G. disclosed no relevant relationships. M.Z. disclosed no relevant relationships. K.C.M. disclosed no relevant relationships. R.P. disclosed no relevant relationships. J.H.S. disclosed no relevant relationships. A.W. disclosed no relevant relationships. B.F.D. disclosed no relevant relationships. K.A.P. disclosed no relevant relationships. E.O. disclosed no relevant relationships. S.M. Activities related to the present article: disclosed no relevant relationships. Activities not related to the present article: author is consultant for Smith Research; institution receives grants from GE Healthcare and Samumed; author receives travel support from ISMRM; institution has patent issued and licensed (Nociscan); institution receives patent royalties from UCOP. Other relationships: disclosed no relevant relationships. V.P. disclosed no relevant relationships.
Abbreviations:
- AUC
- area under the curve
- CI
- confidence interval
- DenseNet
- Densely Connected Convolutional Neural Network
- FN
- femoral neck
- ROC
- receiver operating characteristic
References
- 1.Healthcare Cost and Utilization Project (HCUP) . https://www.ahrq.gov/data/hcup/index.html. Accessed February 23, 2019.
- 2.Stevens JA, Rudd RA. The impact of decreasing U.S. hip fracture rates on future hip fracture estimates. Osteoporos Int 2013;24(10):2725–2728. [DOI] [PMC free article] [PubMed] [Google Scholar]
- 3.Roche JJW, Wenn RT, Sahota O, Moran CG. Effect of comorbidities and postoperative complications on mortality after hip fracture in elderly people: prospective observational cohort study. BMJ 2005;331(7529):1374. [DOI] [PMC free article] [PubMed] [Google Scholar]
- 4.Brauer CA, Coca-Perraillon M, Cutler DM, Rosen AB. Incidence and mortality of hip fractures in the United States. JAMA 2009;302(14):1573–1579. [DOI] [PMC free article] [PubMed] [Google Scholar]
- 5.Anthony CA, Duchman KR, Bedard NA, et al. Hip fractures: appropriate timing to operative intervention. J Arthroplasty 2017;32(11):3314–3318. [DOI] [PubMed] [Google Scholar]
- 6.Maheshwari K, Planchard J, You J, et al. Early surgery confers 1-year mortality benefit in hip-fracture patients. J Orthop Trauma 2018;32(3):105–110. [DOI] [PubMed] [Google Scholar]
- 7.Fu MC, Boddapati V, Gausden EB, Samuel AM, Russell LA, Lane JM. Surgery for a fracture of the hip within 24 hours of admission is independently associated with reduced short-term post-operative complications. Bone Joint J 2017;99-B(9):1216–1222. [DOI] [PubMed] [Google Scholar]
- 8.Miyamoto RG, Kaplan KM, Levine BR, Egol KA, Zuckerman JD. Surgical management of hip fractures: an evidence-based review of the literature. I: femoral neck fractures. J Am Acad Orthop Surg 2008;16(10):596–607. [DOI] [PubMed] [Google Scholar]
- 9.Kaplan K, Miyamoto R, Levine BR, Egol KA, Zuckerman JD. Surgical management of hip fractures: an evidence-based review of the literature. II: intertrochanteric fractures. J Am Acad Orthop Surg 2008;16(11):665–673. [DOI] [PubMed] [Google Scholar]
- 10.Norman BD, Pedoia V, Noworolski A, Link TM, Majumdar S. Automatic knee Kellgren Lawrence grading with artificial intelligence. Osteoarthritis Cartilage 2018;26(Suppl 1):S436–S437. [Google Scholar]
- 11.Norman B, Pedoia V, Majumdar S. Use of 2D U-Net convolutional neural networks for automated cartilage and meniscus segmentation of knee MR imaging data to determine relaxometry and morphometry. Radiology 2018;288(1):177–185. [DOI] [PMC free article] [PubMed] [Google Scholar]
- 12.Zhou Z, Zhao G, Kijowski R, Liu F. Deep convolutional neural network for segmentation of knee joint anatomy. Magn Reson Med 2018;80(6):2759–2770. [DOI] [PMC free article] [PubMed] [Google Scholar]
- 13.Liu F, Zhou Z, Samsonov A, et al. Deep learning approach for evaluating knee MR images: achieving high diagnostic performance for cartilage lesion detection. Radiology 2018;289(1):160–169 [DOI] [PMC free article] [PubMed] [Google Scholar]
- 14.Tiulpin A, Thevenot J, Rahtu E, Lehenkari P, Saarakkala S. Automatic knee osteoarthritis diagnosis from plain radiographs: a deep learning-based approach. Sci Rep 2018;8(1):1727. [DOI] [PMC free article] [PubMed] [Google Scholar]
- 15.Bien N, Rajpurkar P, Ball RL, et al. Deep-learning-assisted diagnosis for knee magnetic resonance imaging: development and retrospective validation of MRNet. PLoS Med 2018;15(11):e1002699. [DOI] [PMC free article] [PubMed] [Google Scholar]
- 16.Lindsey R, Daluiski A, Chopra S, et al. Deep neural network improves fracture detection by clinicians. Proc Natl Acad Sci U S A 2018;115(45):11591–11596. [DOI] [PMC free article] [PubMed] [Google Scholar]
- 17.VGG Image Annotator (VIA) . http://www.robots.ox.ac.uk/∼vgg/software/via/. Accessed February 23, 2019.
- 18.DeVries T, Taylor GW. Improved regularization of convolutional neural networks with cutout. ArXiv170804552 Cs. [preprint] http://arxiv.org/abs/1708.04552. Posted August 2017. Accessed February 23, 2019.
- 19.Huang G, Liu Z, van der Maaten L, Weinberger KQ . Densely connected convolutional networks. ArXiv160806993 Cs. [preprint] http://arxiv.org/abs/1608.06993. Posted August 2016. Accessed February 23, 2019.
- 20.Deng J, Dong W, Socher R, Li LJ, Li K, Fei-Fei L. ImageNet: a large-scale hierarchical image database. In: 2009 IEEE Conference on Computer Vision and Pattern Recognition (CVPR), Miami, June 20–25, 2009. Piscataway, NJ: IEEE, 2009; 248–255. [Google Scholar]
- 21.Kingma DP, Ba J. Adam: a method for stochastic optimization. ArXiv14126980 Cs. [preprint] http://arxiv.org/abs/1412.6980. Posted December 2014. Accessed February 23, 2019.
- 22.Lin TY, Goyal P, Girshick R, He K, Dollár P. Focal loss for dense object detection. In: 2017 IEEE International Conference on Computer Vision (ICCV), Venice, October 22–29, 2007. Piscataway, NJ: IEEE, 2017; 2980–2988. [Google Scholar]
- 23.Lin TY, Dollár P, Girshick R, He K, Hariharan B, Belongie S. Feature pyramid networks for object detection. In: 2017 IEEE Conference on Computer Vision and Pattern Recognition (CVPR), Honolulu, July 21–26, 2017. Piscataway, NJ: IEEE; 2017; 936–944. [Google Scholar]
- 24.Dominguez S, Liu P, Roberts C, Mandell M, Richman PB. Prevalence of traumatic hip and pelvic fractures in patients with suspected hip fracture and negative initial standard radiographs--a study of emergency department patients. Acad Emerg Med 2005;12(4):366–369. [DOI] [PubMed] [Google Scholar]
- 25.Cannon J, Silvestri S, Munro M. Imaging choices in occult hip fracture. J Emerg Med 2009;37(2):144–152 10.1016/j.jemermed.2007.12.039. [DOI] [PubMed] [Google Scholar]
- 26.Gale W, Oakden-Rayner L, Carneiro G, Bradley AP, Palmer LJ. Detecting hip fractures with radiologist-level performance using deep neural networks. ArXiv171106504 Cs Stat. [preprint] http://arxiv.org/abs/1711.06504. Posted November 2017. Accessed January 4, 2019.
- 27.Urakawa T, Tanaka Y, Goto S, Matsuzawa H, Watanabe K, Endo N. Detecting intertrochanteric hip fractures with orthopedist-level accuracy using a deep convolutional neural network. Skeletal Radiol 2019;48(2):239–244. [DOI] [PubMed] [Google Scholar]
- 28.Rayan JC, Reddy N, Kan JH, Zhang W, Annapragada A. Binomial classification of pediatric elbow fractures using a deep learning multiview approach emulating radiologist decision making. Radiol Artif Intell 2019;1(1):e180015. [DOI] [PMC free article] [PubMed] [Google Scholar]
- 29.ImageNet. (n.d.). http://image-net.org/index. Accessed October 16, 2019.
- 30.Sharif Razavian A, Azizpour H, Sullivan J, Carlsson S. CNN features off-the-shelf: an astounding baseline for recognition. In: 2014 IEEE Conference on Computer Vision and Pattern Recognition Workshops, Columbus, Ohio, June 23–28, 2014. Piscataway, NJ: IEEE; 2014; 806–813. [Google Scholar]
- 31.Donahue J, Jia Y, Vinyals O, et al. Decaf: a deep convolutional activation feature for generic visual recognition. In: Proceedings of the International Conference on Machine Learning, Beijing, China,. New York, NY: ACM, 2014; 647–655. [Google Scholar]
- 32.Hu J, Shen L, Sun G. Squeeze-and-excitation networks. In: 2018 IEEE/CVF Conference on Computer Vision and Pattern Recognition, Salt Lake City, June 18–23, 2018. Piscataway, NJ: IEEE; 2018; 7132–7141. [Google Scholar]
- 33.Macskassy S, Provost F. Confidence bands for ROC curves: methods and an empirical study. In: Proceedings of the First Workshop on ROC Analysis in AI, Spain, August2004. SSRN, 2004. [Google Scholar]
- 34.Liu F, Guan B, Zhou Z, et al. Fully automated diagnosis of anterior cruciate ligament tears on knee MR images by using deep learning. Radiol Artif Intell 2019;1(3):180091. [DOI] [PMC free article] [PubMed] [Google Scholar]
Associated Data
This section collects any data citations, data availability statements, or supplementary materials included in this article.


