Abstract
Purpose
To employ deep learning to predict genomic subtypes of lower-grade glioma (LLG) tumors based on their appearance at MRI.
Materials and Methods
Imaging data from The Cancer Imaging Archive and genomic data from The Cancer Genome Atlas from 110 patients from five institutions with lower-grade gliomas (World Health Organization grade II and III) were used in this study. A convolutional neural network was trained to predict tumor genomic subtype based on the MRI of the tumor. Two different deep learning approaches were tested: training from random initialization and transfer learning. Deep learning models were pretrained on glioblastoma MRI, instead of natural images, to determine if performance was improved for the detection of LGGs. The models were evaluated using area under the receiver operating characteristic curve (AUC) with cross-validation. Imaging data and annotations used in this study are publicly available.
Results
The best performing model was based on transfer learning from glioblastoma MRI. It achieved AUC of 0.730 (95% confidence interval [CI]: 0.605, 0.844) for discriminating cluster-of-clusters 2 from others. For the same task, a network trained from scratch achieved an AUC of 0.680 (95% CI: 0.538, 0.811), whereas a model pretrained on natural images achieved an AUC of 0.640 (95% CI: 0.521, 0.763).
Conclusion
These findings show the potential of utilizing deep learning to identify relationships between cancer imaging and cancer genomics in LGGs. However, more accurate models are needed to justify clinical use of such tools, which might be obtained using substantially larger training datasets.
Supplemental material is available for this article.
© RSNA, 2020
Summary
Deep learning algorithms, especially those utilizing transfer learning, were able to find the association between imaging and genomics of lower grade gliomas.
Key Points
■ While deep learning cannot yet replace genomic testing, it shows promise in aiding clinical decisions of lower grade gliomas.
■ A convolutional neural network pretrained with brain MRI of glioblastoma tumors achieved the best performance as compared with networks trained from scratch or pretrained on natural images.
■ For discriminating cluster-of-clusters 2 from others, we achieved area under the receiver operating characteristic curve of 0.730 (95% confidence interval: 0.605, 0.844).
Introduction
Lower-grade gliomas (LGGs) are a diverse group of brain tumors classified as grade II and III using the World Health Organization grading system. Histopathologic analysis suffers from interobserver variability and can be inaccurate in predicting patient outcomes (1). Recently, a new tumor subtyping scheme was proposed which clusters LGGs based on DNA methylation, gene expression, DNA copy number, and microRNA expression (1). In particular, unsupervised analysis of tumors based on their molecular profiles derived from these four platforms resulted in a second-level cluster of clusters (CoC) partitioning into three distinctive biologic subsets (CoC1 to CoC3). It has been shown that the new subtypes are, to a large extent, in agreement with more basic subtyping utilizing isocitrate dehydrogenase (IDH1 and IDH2) mutation and 1p/19q codeletion (1,2). It has been determined that tumors from the different molecular groups substantially differ in terms of typical course of the disease and overall survival (3). Specifically, the CoC2 cluster was found to have a strong correlation with wild-type IDH molecular subtype and had an overall survival rate similar to that of glioblastoma (GBM).
Radiogenomics is a new direction in cancer research that aims to identify relationships between tumor genomic characteristics and imaging phenotypes (ie, its presentation on radiologic images) (4). In addition to extending our understanding of the disease in general, radiogenomics might provide actionable information if the genomic characteristics of tumors can be predicted prior to invasive tissue examination or in cases when resection is risky or impossible. Some radiogenomic studies of LGGs have discovered an association of tumor shape features extracted from brain MRI with its genomic subtypes (5–7). A shortcoming of the previously proposed method is that the features of the image used for the analysis need to be decided a priori without knowing which image characteristics might be most predictive of tumor genomics. Often a very large number of features are extracted, which increases the likelihood of the noisy features obscuring the important ones. An alternative, more holistic approach, proposed in this study, is based on a supervised deep learning model that allows the algorithm to learn which imaging characteristics are the most helpful in making the prediction.
In recent years, progress in deep learning has allowed for the development of highly accurate models for various image-related tasks, even in the presence of limited training data (8,9). Although neural networks can be trained from a random initialization of the weights, an approach that has shown promise is transfer learning, which allows for pretraining of the network with a dataset different than the main training set. The performance of these methods depends on the task at hand, available data, and potentially other factors. Particularly, the type of dataset used for pretraining could be a factor influencing the final performance of the network. In this study, we tested whether a deep learning model with transfer learning from GBM MRI, instead of natural images, can provide improvement in performance over a model trained from scratch for predicting CoC molecular subtype based on MRI of LGG. The hypothesis was that a supervised deep learning approach based on MR images of LGGs would be predictive of the tumor genomics. We also determined whether a model pretrained on another MRI dataset showed better performance and generalization ability than other learning approaches.
Materials and Methods
Patient Population
In this institutional review board–exempt study, we analyzed patient data from The Cancer Genome Atlas (TCGA) LGG collection (10). First, we excluded patients who did not have preoperative fluid-attenuated inversion recovery (FLAIR) imaging data available. From the 120 cases that remained, we further excluded 10 patients for whom the relevant genomic data were not available. The final analyzed cohort of 110 patients contained data from the following five institutions: Thomas Jefferson University (TCGA-CS, 16 patients), Henry Ford Hospital (TCGA-DU, 45 patients), University of North Carolina (TCGA-EZ, one patient), Case Western (TCGA-FG, 14 patients), Case Western–St. Joseph’s (TCGA-HT, 34 patients). These 110 patients were used for the development of classification networks and in the radiogenomic analysis. The full list of patients included in our analysis is available in Appendix E1 (supplement).
Imaging Data
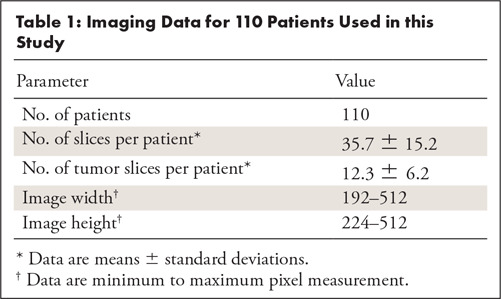
We obtained imaging data for our study from The Cancer Imaging Archive (TCIA) sponsored by the National Cancer Institute, which contains MR images for some of the patients from TCGA repository. All 110 patients included in our analysis had FLAIR sequences available, which we used for prediction of molecular subtypes. The number of slices in each sequence varied from 20 to 88. The size of images ranged from 256 × 192 to 512 × 512 pixels. Voxel spatial dimensions ranged from 0.39 to 1.02 mm and slice thickness was between 2 and 7.5 mm. All images were saved in 8-bit gray-scale lossless tagged image file format (TIFF). The characteristics of the imaging data are summarized in Table 1. Additional imaging metadata for each patient is provided in Appendix E1 (supplement). The FLAIR abnormality for tumors on all images was manually outlined by a researcher in our laboratory who used an in-house MATLAB tool developed for this task. The final annotations were approved by a board-eligible radiologist. All imaging data (preprocessed and labeled images from the TCGA-LGG collection) and annotations used in this study were made available at the following link: https://www.kaggle.com/mateuszbuda/lgg-mri-segmentation.
Table 1:
Imaging Data for 110 Patients Used in this Study
Genomic Data
We used genomic classifications developed in a recent publication (1) defining the molecular landscape of LGGs. Genomic data came from TCGA-LGG collection and were derived based on DNA methylation, gene expression, DNA copy number, microRNA expression, and the measurement of IDH mutation and 1p/19q codeletion. Specifically, in our analysis we considered three CoC molecular subtypes: CoC1, CoC2, and CoC3. This subclassification has shown a strong correlation with imaging data using handcrafted tumor shape features in a previous study (6). Our data contained 55 cases for cluster CoC1, 25 cases for CoC2, and 30 cases for CoC3.
Deep Learning for Prediction of Molecular Subtypes Based on MR Images
Preparation of the data for training of neural networks.—To obtain comparable results between all tested deep learning methods, we applied the same preprocessing of images across different methods. In a series of preliminary experiments, we identified the following transformations and data preparation steps to be essential to achieve satisfactory results for classification of genomic subtypes. All slices were first padded to square aspect ratio, resized to 256 × 256 pixels, and were contrast-normalized by stretching pixel values between 1st and 99th percentile in the histogram. Then, we applied a mask from manual segmentation of tumors to guide network and provide shape information. Finally, image patches used for training and inference were cropped to 80 × 80 pixels centered in the middle of the tumor. Only the slices that contained some tumor were considered. The optimal patch size was chosen based on a series of preliminary experiments.
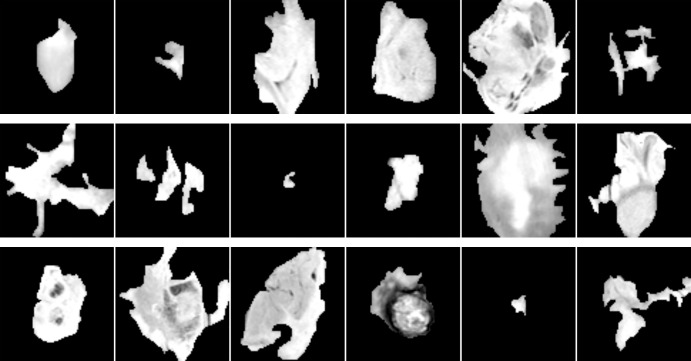
The total number of extracted patches was 1648. Example patches for each cluster are shown in Figure 1. In addition, we performed data augmentation to generate extra training examples, a common technique in deep learning (11). Specifically, each patch was repeated five times with random rotation by ±10 degrees and random shift by ±16 pixels in horizontal and vertical direction, then sampled independently. This procedure resulted in 8240 examples in total. To alleviate the problem of imbalance, we applied random minority oversampling to make class distribution uniform (12).
Figure 1:
Example patches for tumors from cluster CoC1 (top), cluster CoC2 (middle), and cluster CoC3 (bottom) before applying rotation and shift augmentation. CoC = cluster of clusters.
Training custom network from random initialization.—The first tested approach was training a custom network from random initialization of weights (aka from scratch). The architecture of our trained-from-scratch network consisted of three standard blocks with convolutional layer, rectified linear unit, activation, max-pooling layer, and batch normalization (13–16). After that, we added two fully connected layers followed by dropout layers with 50% dropout ratio (17). The last layer contained three output units corresponding to predicted clusters. A detailed description of the architecture and the training hyperparameters are provided in Appendix E2 (supplement).
Transfer learning.—It has been shown that deep convolutional neural networks (CNNs) trained on large datasets learn general feature representations (18,19). Shallow filters detect simple shapes (eg, edges) whereas deeper layers are responsible for recognizing more complex structures and objects (20). The most common transfer learning method is fine-tuning of a model trained on another dataset. It involves training the final classification layer from random initialization and adjustment of weights in early layers using a small learning rate. In our experiments, we fine-tuned GoogLeNet (21) network pretrained on ImageNet dataset of natural images (22). We also fine-tuned a CNN developed for classification of patches extracted from another brain MRI dataset of patients with GBM. The network was trained to distinguish different parts of the tumor and normal brain tissue with the ultimate goal of segmenting the images (23). For both of the fine-tuned models, the fully connected layers were replaced and randomly initialized. To match the number of input channels, we repeated FLAIR sequence three times. Detailed description of the network pretrained on GBM MRI data and the training hyperparameters are provided in Appendix E2 (supplement).
Model Evaluation and Statistical Analysis
We performed the evaluation using 22-fold cross-validation. Specifically, we split the data by patients into 22 folds with five cases each. Then we trained the model using 21 folds (105 cases) and tested it using one fold (five cases). We repeated the process 22 times such that each fold was used as the test set once. Because each patient had several slices containing tumor and we trained classifiers to predict molecular subtype of a single image, we averaged the predicted scores across tumor slices, independently for each class, to arrive at the final prediction.
We used the area under the receiver operating characteristic curve (AUC) (24) computed by pooling predictions from all folds, as the evaluation metric. We evaluated how well the classifier can distinguish each given subtype (CoC1, CoC2, CoC3) from all other subtypes combined (eg, CoC1 vs CoC2 and CoC3) as well as all possible pairs for clusters (ie, CoC1 vs CoC2, CoC1 vs CoC3, CoC2 vs CoC3). For evaluation of all these binary tasks we trained a single multiclass neural network with three outputs corresponding to probabilities of three CoC clusters. In each case, we took the score from the CNN for a given class, averaged across slices as the score for computing receiver operating characteristic curves. Our particular focus was on cluster CoC2 which has been shown to be associated with a lower survival (1). Statistical tests for comparison of models and computation of confidence intervals (CIs) was performed using a bootstrapping tool implemented in Python.
Results
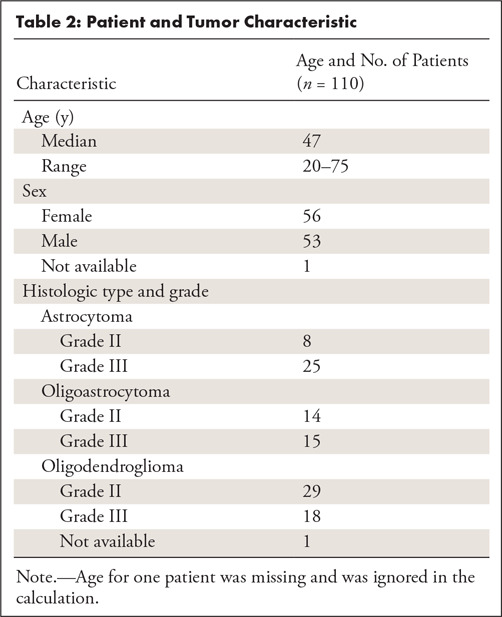
The characteristics of our patient population are shown in Table 2. The average age was 47 years (one unknown). Fifty-six patients were women and 53 were men (one unknown). Among 109 patients with histologic data present, 47 were oligodendrogliomas, 29 were oligoastrocytomas, and 33 were astrocytomas. In terms of tumor grade, 51 tumors were of grade II and 58 were of grade III.
Table 2:
Patient and Tumor Characteristic
The results of testing our methods for the task of discriminating cluster CoC2 from all other clusters in terms of receiver operating characteristic curves are presented in Figure 2. The best performing method was transfer learning utilizing GBM MRI for pretraining with AUC of 0.730 (95% CI: 0.605, 0.844). In comparison, for the network trained from scratch, AUC was 0.680 (95% CI: 0.538, 0.811) and for GoogLeNet pretrained on natural images, it was 0.640 (95% CI: 0.521, 0.763). The differences between GBM pretrained model and other models were not statistically significant (P >.1). All deep learning methods showed performance statistically significantly higher than chance (ie, none of the CIs overlap with AUC = 0.5).
Figure 2a:
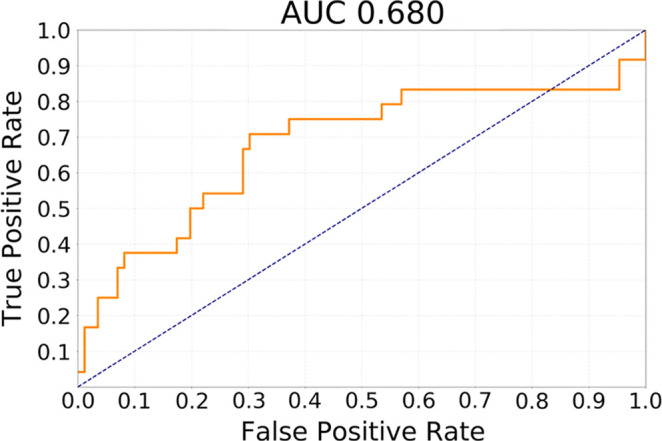
Receiver operating characteristic curves for the task of discriminating cluster CoC2 from all other clusters (CoC1 and CoC3) combined for (a) training from scratch, (b) transfer learning from ImageNet, and (c) transfer learning from glioblastoma MRI. AUC = area under the receiver operating characteristic curve, CoC= cluster of clusters.
Figure 2b:
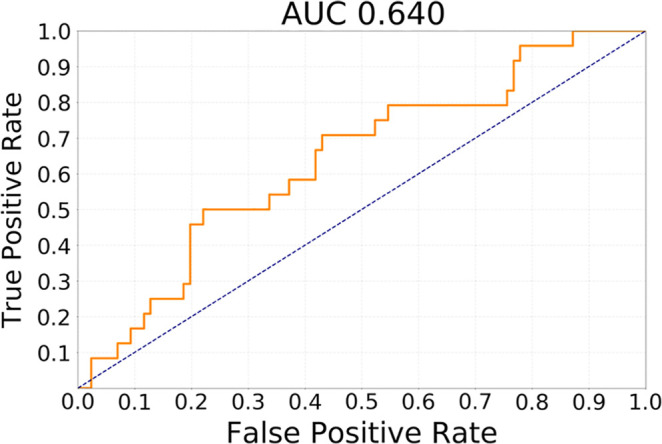
Receiver operating characteristic curves for the task of discriminating cluster CoC2 from all other clusters (CoC1 and CoC3) combined for (a) training from scratch, (b) transfer learning from ImageNet, and (c) transfer learning from glioblastoma MRI. AUC = area under the receiver operating characteristic curve, CoC= cluster of clusters.
Figure 2c:
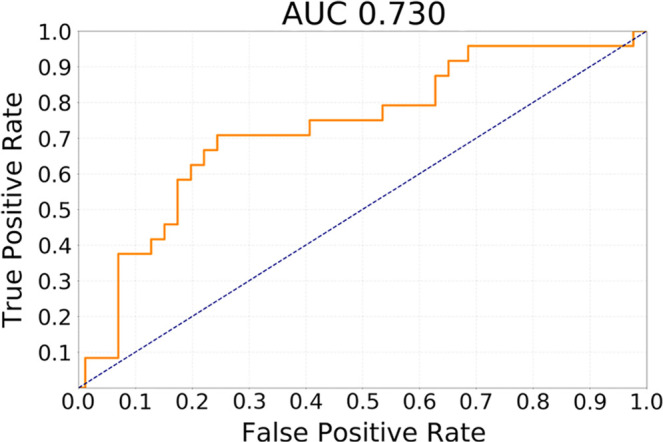
Receiver operating characteristic curves for the task of discriminating cluster CoC2 from all other clusters (CoC1 and CoC3) combined for (a) training from scratch, (b) transfer learning from ImageNet, and (c) transfer learning from glioblastoma MRI. AUC = area under the receiver operating characteristic curve, CoC= cluster of clusters.
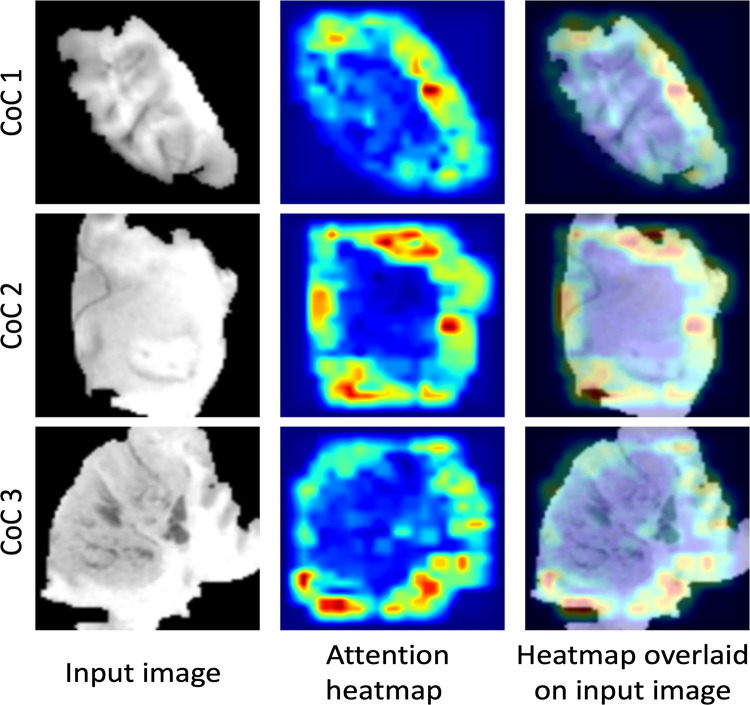
For the transfer learning method using GBM data for pretraining, Table 3 shows the ability of the deep learning method to classify different subtypes. The classifier showed the highest predictive ability for distinguishing between CoC2 and CoC3 and the lowest for distinguishing CoC1 and CoC3. Figure 3 offers a visual representation of these results. In Figure 4, we show network attention heatmaps, which indicate parts of the image responsible for prediction. Increased response by the network was for tumor margin regions of high irregularity which provides additional validation of results from previous studies (6). Additional results for discriminating between all possible combinations of CoC clusters for the two other deep learning methods tested in the study are provided in Appendix E3 (supplement).
Table 3:
AUC with 95% Confidence Intervals for the Transfer Learning from GBM MRI Experiment

Figure 3a:
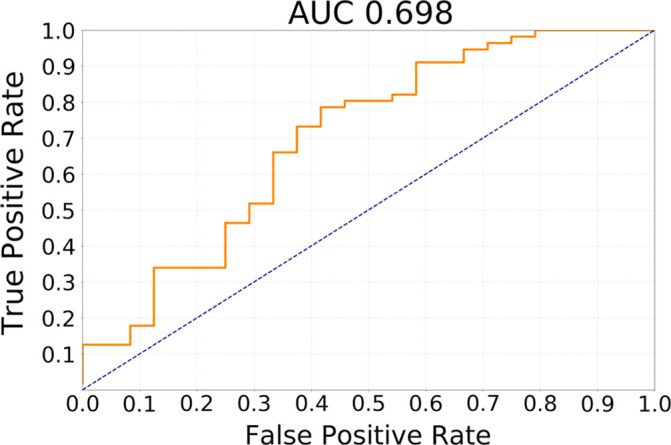
Receiver operating characteristic curves for transfer learning from glioblastoma MRI experiment for the task of discriminating (a) cluster CoC1 versus CoC2 and (b) cluster CoC2 versus CoC3. AUC = area under the receiver operating characteristic curve, CoC = cluster of clusters.
Figure 4:
Attention heatmaps from the network pretrained on glioblastoma dataset that indicate the parts of an image responsible for prediction. CoC = cluster of clusters.
Figure 3b:
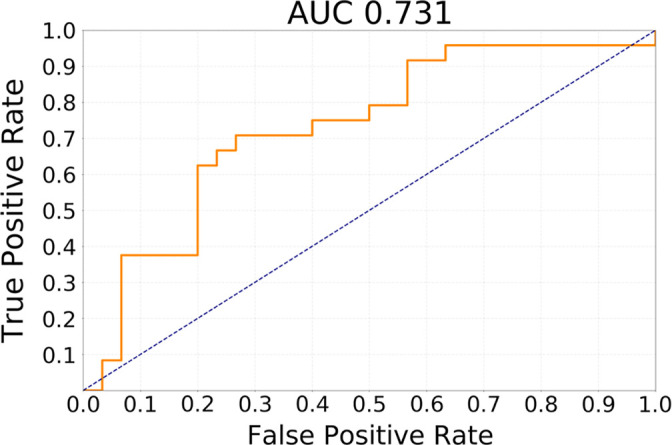
Receiver operating characteristic curves for transfer learning from glioblastoma MRI experiment for the task of discriminating (a) cluster CoC1 versus CoC2 and (b) cluster CoC2 versus CoC3. AUC = area under the receiver operating characteristic curve, CoC = cluster of clusters.
Discussion
In this study, we demonstrated that deep learning–based algorithms are capable of classifying molecular subtypes of LGG tumors with a moderate performance. The model that showed the highest AUC utilized previous GBM imaging data for model pretraining.
Although at this stage of the development, the imaging-based models could not be used as a one-to-one replacement for genomic testing, the correlations between genomics and imaging data are important to identify and can be applied in various ways. First, the genomic assays described in this article are very expensive and are rarely acquired in the clinical setting. Therefore, even an imprecise prediction of a sophisticated genomics subtype could be of value in deciding the course of treatment. Second, even if a sophisticated genomic analysis is planned, it requires extraction of tumor tissue and additional time for analysis. This step means that genomic information is delayed, particularly for patients who do not undergo immediate surgery. The approximate information provided by already available imaging could immediately help with the decision process during the time when genomic information is absent. Third, an imperfect, but sufficiently accurate, model could stratify patients for genomic testing and limit the testing only to the patients where the imaging-based surrogate is not confident about the prediction. Finally, in addition to the potential clinical uses just described, the ability of deep learning to identify some characteristics of images that represent the underlying genomics could be of high value in further understanding of genotype-phenotype relationships in cancer.
The imaging-based approach to identifying the underlying tumor genomics has some very clear strengths. In addition to the low cost (MRI is already available) and immediate access to the information, imaging offers a way to analyze the tumor as a whole rather than individual tissue samples. This allows for visualizing the tumor in its surrounding and the ability to assess tumor shape, which reflects the growth pattern as well as tumor enhancement which illustrates its vascular structure. Finally, the overall look at a tumor is of utmost importance given the intratumor genomic heterogeneity of cancer. While the results of a genomic test can differ based on which part of the tumor was analyzed, the imaging offers a global view that is free of this limitation. It is noted that the intratumor heterogeneity is likely a part of the reason imaging cannot predict tumor genomics with a 100% accuracy. Because the reference standard may depend on the tissue sampling strategy, it is unlikely that any predictive model can achieve perfect prediction. This limitation, caused by intratumor genomic heterogeneity, affects all studies using genomics data.
Our findings may translate to the prognosis of outcomes for patients with LGG. Specifically, we found that imaging can predict, with moderate performance, whether the tumor belongs to the CoC2 cluster or to one of the remaining genomic subtypes. The CoC2 cluster has also been shown to be highly associated with dramatically poorer survival. For example, the hazard ratio between groups CoC2 and CoC3 was 9.2 (95% CI: 4.2, 20.0), while the risk in groups CoC1 and CoC3 is similar (hazard ratio = 1.7) (1). This shows the potential utility of the imaging-based tools to predict patient outcomes and guide treatment decisions. In addition, the task of classifying CoC2 cluster performed better than for other clusters. This could be attributed to the aggressiveness of the CoC2 cluster which is revealed in the imaging features that can be captured by a CNN model (eg, angular standard deviation of tumor shape) (6).
An interesting finding of our study was that the deep neural network that performed best was the one that utilized images of GBMs in the pretraining stage which was followed by additional training specific to LGGs. This finding illustrates that given a small set of cases such as the one used in this study, it is beneficial to allow the network to acquire general concepts of head MRIs and brain tumors even if there are some differences in the specifics of the task. It might be possible to achieve even better performance if more LGG data are available. Other recent studies have explored prediction of different relevant genomic subtypes for LGG using various methods and datasets (25–27).
Our study had some limitations, which included the limited size of the dataset as well as the fact that it was retrospectively and observationally collected. This is a common limitation in studies using comprehensive genomic analysis. While the dataset was small, it was encouraging that we were able to find meaningful relationships between genomic and imaging data. Furthermore, to extract patches for prediction, we still needed manual segmentation masks of the tumor on each slice. Therefore, the system was not fully automatic. However, with recent advances in deep learning segmentation techniques, automatic segmentation is capable of achieving performance of an expert human reader. This implies that this step can be automated in the future, making the entire process presented in this article fully automatic.
To conclude, we were able to demonstrate that deep learning algorithms, especially those that utilize transfer learning, are able to find the association between imaging and genomics of LGGs. While the developed tool cannot yet serve as a direct replacement for genomic testing, it shows promise in aiding clinical decisions and science of lower grade gliomas.
APPENDIX
Disclosures of Conflicts of Interest: M.B. disclosed no relevant relationships. E.A.A. disclosed no relevant relationships. A.S. disclosed no relevant relationships. M.A.M. Activities related to the present article: advisory role with Gradient Health. Activities not related to the present article: institution has received grant money from Bracco Diagnostics. Other relationships: disclosed no relevant relationships.
Abbreviations:
- AUC
- area under the receiver operating characteristic curve
- CoC
- cluster of clusters
- CI
- confidence interval
- CNN
- convolutional neural network
- FLAIR
- fluid-attenuated inversion recovery
- GBM
- glioblastoma
- IDH
- isocitrate dehydrogenase
- LGG
- lower-grade glioma
- TCGA
- The Cancer Genome Atlas
- TCIA
- The Cancer Imaging Archive
References
- 1.Cancer Genome Atlas Research Network , Brat DJ, Verhaak RG, et al. Comprehensive, integrative genomic analysis of diffuse lower-grade gliomas. N Engl J Med 2015;372(26):2481–2498. [DOI] [PMC free article] [PubMed] [Google Scholar]
- 2.Zhang CM, Brat DJ. Genomic profiling of lower-grade gliomas uncovers cohesive disease groups: implications for diagnosis and treatment. Chin J Cancer 2016;35:12. [DOI] [PMC free article] [PubMed] [Google Scholar]
- 3.Eckel-Passow JE, Lachance DH, Molinaro AM, et al. Glioma groups based on 1p/19q, IDH, and TERT promoter mutations in tumors. N Engl J Med 2015;372(26):2499–2508. [DOI] [PMC free article] [PubMed] [Google Scholar]
- 4.Mazurowski MA. Radiogenomics: what it is and why it is important. J Am Coll Radiol 2015;12(8):862–866. [DOI] [PubMed] [Google Scholar]
- 5.Mazurowski MA, Clark K, Czarnek NM, Shamsesfandabadi P, Peters KB, Saha A. Radiogenomic analysis of lower grade glioma: a pilot multi-institutional study shows an association between quantitative image features and tumor genomics. In: Armato SG III, Petrick NA, eds. Proceedings of SPIE: medical imaging 2017—computer-aided diagnosis. Vol 10134. Bellingham, Wash: International Society for Optics and Photonics, 2017; 101341T. [Google Scholar]
- 6.Mazurowski MA, Clark K, Czarnek NM, Shamsesfandabadi P, Peters KB, Saha A. Radiogenomics of lower-grade glioma: algorithmically-assessed tumor shape is associated with tumor genomic subtypes and patient outcomes in a multi-institutional study with The Cancer Genome Atlas data. J Neurooncol 2017;133(1):27–35. [DOI] [PubMed] [Google Scholar]
- 7.Yu J, Shi Z, Lian Y, et al. Noninvasive IDH1 mutation estimation based on a quantitative radiomics approach for grade II glioma. Eur Radiol 2017;27(8):3509–3522. [DOI] [PubMed] [Google Scholar]
- 8.LeCun Y, Bengio Y, Hinton G. Deep learning. Nature 2015;521(7553):436–444. [DOI] [PubMed] [Google Scholar]
- 9.Mazurowski MA, Buda M, Saha A, Bashir MR. Deep learning in radiology: An overview of the concepts and a survey of the state of the art with focus on MRI. J Magn Reson Imaging 2019;49(4):939–954. [DOI] [PMC free article] [PubMed] [Google Scholar]
- 10.Pedano N, Flanders AE, Scarpace L, et al. Radiology data from the cancer genome atlas low grade glioma [TCGA-LGG] collection. Cancer Imaging Archive. https://wiki.cancerimagingarchive.net/display/Public/TCGA-LGG. Published 2016. Accessed October 9, 2018.
- 11.Zhang C, Bengio S, Hardt M, Recht B, Vinyals O. Understanding deep learning requires rethinking generalization. ArXiv 1611.03530. [preprint] https://arxiv.org/abs/1611.03530. Posted November 10, 2016. Accessed DATE.
- 12.Buda M, Maki A, Mazurowski MA. A systematic study of the class imbalance problem in convolutional neural networks. Neural Netw 2018;106:249–259. [DOI] [PubMed] [Google Scholar]
- 13.Krizhevsky A, Sutskever I, Hinton GE. Imagenet classification with deep convolutional neural networks. Advances in Neural Information Processing Systems. https://papers.nips.cc/paper/4824-imagenet-classification-with-deep-convolutional-neural-networks. Published 2012. Accessed October 9, 2018. [Google Scholar]
- 14.Simonyan K, Zisserman A. Very deep convolutional networks for large-scale image recognition. ArXiv 1409.1556. [preprint] https://arxiv.org/abs/1409.1556. Posted September 4, 2014. Accessed October 9, 2018.
- 15.Ioffe S, Szegedy C. Batch normalization: Accelerating deep network training by reducing internal covariate shift. ArXiv 1502.03167. [preprint] https://arxiv.org/abs/1502.03167. Posted February 22, 2015. Accessed October 9, 2018.
- 16.Glorot X, Bordes A, Bengio Y. Deep sparse rectifier neural networks. Proceedings of the Fourteenth International Conference on Artificial Intelligence and Statistics, 2011; 315–323. http://proceedings.mlr.press/v15/glorot11a.html. [Google Scholar]
- 17.Srivastava N, Hinton G, Krizhevsky A, Sutskever I, Salakhutdinov R. Dropout: a simple way to prevent neural networks from overfitting. J Mach Learn Res 2014;15(1):1929–1958. http://jmlr.org/papers/v15/srivastava14a.html. [Google Scholar]
- 18.Razavian AS, Azizpour H, Sullivan J, Carlsson S. CNN features off-the-shelf: an astounding baseline for recognition. Proceedings of the 2014 IEEE Conference on Computer Vision and Pattern Recognition Workshops, 2014; 806–813. [Google Scholar]
- 19.Azizpour H, Razavian AS, Sullivan J, Maki A, Carlsson S. From generic to specific deep representations for visual recognition. 2015 IEEE Conference on Computer Vision and Pattern Recognition Workshops, 2015; 36–45. [Google Scholar]
- 20.Zeiler MD, Fergus R. Visualizing and understanding convolutional networks. European Conference on Computer Vision, 2014; 818–833. [Google Scholar]
- 21.Szegedy C, Liu W, Jia Y, et al. Going deeper with convolutions. 2015 IEEE Conference on Computer Vision and Pattern Recognition Workshops, 2015; 1–9. [Google Scholar]
- 22.Russakovsky O, Deng J, Su H, et al. Imagenet large scale visual recognition challenge. Int J Comput Vis 2015;115(3):211–252. [Google Scholar]
- 23.AlBadawy EA, Saha A, Mazurowski MA. Deep learning for segmentation of brain tumors: Impact of cross-institutional training and testing. Med Phys 2018;45(3):1150–1158. [DOI] [PubMed] [Google Scholar]
- 24.Bradley AP. The use of the area under the ROC curve in the evaluation of machine learning algorithms. Pattern Recognit 1997;30(7):1145–1159. [Google Scholar]
- 25.Jakola AS, Zhang YH, Skjulsvik AJ, et al. Quantitative texture analysis in the prediction of IDH status in low-grade gliomas. Clin Neurol Neurosurg 2018;164:114–120. [DOI] [PubMed] [Google Scholar]
- 26.Park YW, Han K, Ahn SS, et al. Prediction of IDH1-mutation and 1p/19q-codeletion status using preoperative MR imaging phenotypes in lower grade gliomas. AJNR Am J Neuroradiol 2018;39(1):37–42. [DOI] [PMC free article] [PubMed] [Google Scholar]
- 27.Buda M, Saha A, Mazurowski MA. Association of genomic subtypes of lower-grade gliomas with shape features automatically extracted by a deep learning algorithm. Comput Biol Med 2019;109:218–225. [DOI] [PubMed] [Google Scholar]
Associated Data
This section collects any data citations, data availability statements, or supplementary materials included in this article.


