Abstract
Purpose
To investigate the diagnostic accuracy of cascading convolutional neural network (CNN) for urinary stone detection on unenhanced CT images and to evaluate the performance of pretrained models enriched with labeled CT images across different scanners.
Materials and Methods
This HIPAA-compliant, institutional review board–approved, retrospective clinical study used unenhanced abdominopelvic CT scans from 535 adults suspected of having urolithiasis. The scans were obtained on two scanners (scanner 1 [hereafter S1] and scanner 2 [hereafter S2]). A radiologist reviewed clinical reports and labeled cases for determination of reference standard. Stones were present on 279 (S1, 131; S2, 148) and absent on 256 (S1, 158; S2, 98) scans. One hundred scans (50 from each scanner) were randomly reserved as the test dataset, and the rest were used for developing a cascade of two CNNs: The first CNN identified the extent of the urinary tract, and the second CNN detected presence of stone. Nine variations of models were developed through the combination of different training data sources (S1, S2, or both [hereafter SB]) with (ImageNet, GrayNet) and without (Random) pretrained CNNs. First, models were compared for generalizability at the section level. Second, models were assessed by using area under the receiver operating characteristic curve (AUC) and accuracy at the patient level with test dataset from both scanners (n = 100).
Results
The GrayNet-pretrained model showed higher classifier exactness than did ImageNet-pretrained or Random-initialized models when tested by using data from the same or different scanners at section level. At the patient level, the AUC for stone detection was 0.92–0.95, depending on the model. Accuracy of GrayNet-SB (95%) was higher than that of ImageNet-SB (91%) and Random-SB (88%). For stones larger than 4 mm, all models showed similar performance (false-negative results: two of 34). For stones smaller than 4 mm, the number of false-negative results for GrayNet-SB, ImageNet-SB, and Random-SB were one of 16, three of 16, and five of 16, respectively. GrayNet-SB identified stones in all 22 test cases that had obstructive uropathy.
Conclusion
A cascading model of CNNs can detect urinary tract stones on unenhanced CT scans with a high accuracy (AUC, 0.954). Performance and generalization of CNNs across scanners can be enhanced by using transfer learning with datasets enriched with labeled medical images.
© RSNA, 2019
Supplemental material is available for this article.
An earlier incorrect version appeared online. This article was corrected on August 6, 2019.
Summary
A cascading convolutional neural network model, enriched with labeled CT images, detected the presence of urinary tract stones on unenhanced abdominopelvic CT scans with high accuracy (area under the receiver operating characteristic curve, 0.954).
Key Points
■ Convolutional neural networks can detect urolithiasis on unenhanced CT scans and potentially can be used to prioritize studies for interpretation by a radiologist.
■ A cascading convolutional neural network model detected urinary tract stones on unenhanced CT scans with an area under the receiver operating characteristic curve of 0.954.
Introduction
The prevalence of urolithiasis is increasing. Almost 1.3 million visits in the emergency setting are attributable to suspected urinary stone disease (1,2). Although clinical history can suggest urinary stone disease, unenhanced CT allows accurate and timely diagnosis (3). These strengths have led to a continued increase in the use of CT for suspected urolithiasis (4,5) but have also contributed to a rise in imaging volume, longer turnaround times, an increased burden on radiologists, and longer hospital stays (6).
Remarkable progress in machine learning algorithms for medical image analysis has been made for various tasks through use of different imaging modalities (7–9). The algorithms also have a promising role in triaging cases and improving workflow in the emergency department (ED) (10,11). Nevertheless, two important challenges need to be addressed to achieve satisfactory performance of deep-learning (DL) systems in medicine. The first is access to large, well-annotated, balanced datasets (12). The second is reliability of DL models across multiple scanners. High performance of DL algorithms from one scanner may not be reproducible when deployed at another. This poor generalization is due to differences in image features resulting from variation in acquisition and reconstruction protocols with use of different imaging systems (13–15).
To address the challenge of insufficient and imbalanced data, prior research has applied transfer learning with convolutional neural network (CNN) models pretrained on a large set of natural images (such as ImageNet) to biomedical applications despite substantial differences between natural and medical images (9,16,17). Recent studies have demonstrated that for medical applications, models trained on datasets from the same imaging modality domain achieved better performance than out-of-domain trained models (18,19). Because transfer learning improves when features between the source and target tasks are similar (20), we hypothesized that DL models for CT-related tasks, such as stone detection, that are pretrained on CT images may exhibit better generalization, where generalization is defined as the accuracy of a model trained on images from one vendor and tested on images acquired from another vendor. The performance of a CNN model that has been pretrained with medical images has not yet been studied for its ability to handle class imbalance or images acquired from different sources, to our knowledge (21).
In this study, we aimed to investigate the diagnostic accuracy of a cascading DL system for urinary stone detection on unenhanced CT images. In addition, we evaluated the effect of transfer learning by using pretrained models enriched with labeled CT images to assess whether the performance of the pretrained model is consistent across scanners.
Materials and Methods
Our institutional review board approved this Health Insurance Portability and Accountability Act–compliant retrospective study and waived the requirement for written informed consent.
Data Collection, Annotation, and Distribution
An online software tool (Radimetrics; Bayer Healthcare, Whippany, NJ) that extracts protocol information by using Digital Imaging and Communications in Medicine (DICOM) tags and secondarily serves as a repository for CT scans in a quaternary referral hospital was queried for CT examinations. A total of 540 patients who underwent true non–contrast material–enhanced abdominopelvic CT for suspected urolithiasis (complaints of flank pain, hematuria) between January and October 2016 were identified. Scans from two manufacturers—scanner 1 (hereafter S1) (Discovery CT750 HD, GE Healthcare, Milwaukee, Wis) and scanner 2 (hereafter S2) (Somatom Definition Force, Siemens Healthcare, Erlangen, Germany)—were included. The acquisition parameters are tabulated in Table 1. On S1, scans were acquired by using single-energy CT, whereas acquisition on S2 was performed with dual-energy CT (dual-source platform). For S2, single-energy CT equivalent blended image datasets (0.6 dual-energy decomposition) were used.
Table 1:
CT Acquisition Parameters
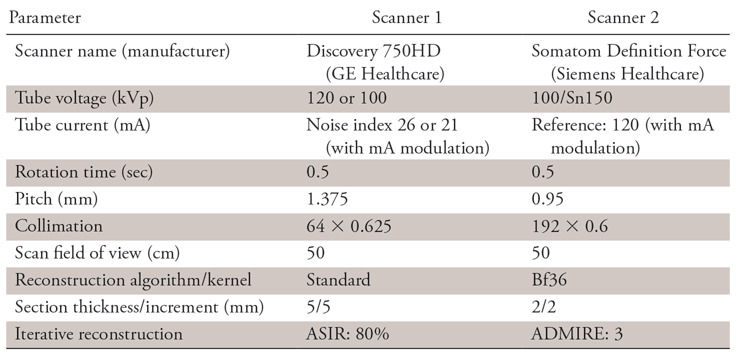
Note.—All scans were acquired in true unenhanced phase. ADMIRE = advanced modeled iterative reconstruction; ASIR = adaptive statistical iterative reconstruction.
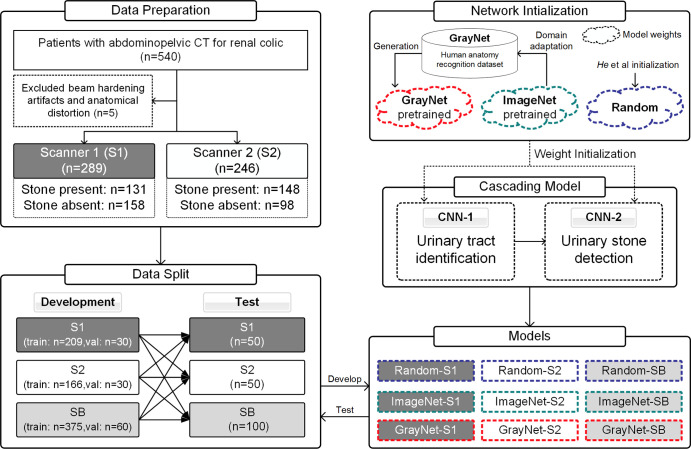
Axial reconstructions from all CT scans were manually reviewed by a radiologist (R1; A.P., 6 years of experience) for presence or absence of stones and to ensure diagnostic image quality. The findings of R1 were confirmed with original radiology reports (by board-certified radiologists) and medical records from the urology consultation that were available on the hospital information system. CT scans (n = 5) with prominent beam hardening artifacts or substantially altered postoperative anatomic features were excluded. A total of 535 unenhanced CT scans (S1: n = 289; S2: n = 246) were included (Fig 1). Patients with urinary stones were further categorized into three groups according to largest stone size: group A (<4 mm), group B (4–9.9 mm), and group C (≥10 mm). A total of 435 scans (stone absent: n = 206; stone present: n = 229) were used for model development. From the development dataset, 60 scans (n = 30 from each scanner) were randomly reserved as the validation dataset for model hyperparameter tuning and best model selection. One hundred random scans (n = 50 from each scanner) were reserved as the test dataset for evaluation of model performance. Test cases were discrete from the development dataset. Patient and data distributions are described in Table 2.
Figure 1:
Flowchart of the study process depicting patient selection and study design. The “Random” model was initialized by using the method described by He et al (26). Performance analysis for assessment of model generalization was evaluated at section level (convolutional neural networks 1 [CNN-1] and 2 [CNN-2]). Patient-level prediction for diagnostic accuracy was performed with training and testing dataset from both scanners. SB = data from both scanners (scanner 1 plus scanner 2); val = validation datasets.
Table 2:
Patient and Data Distribution of 535 Scans Used for Development and Testing
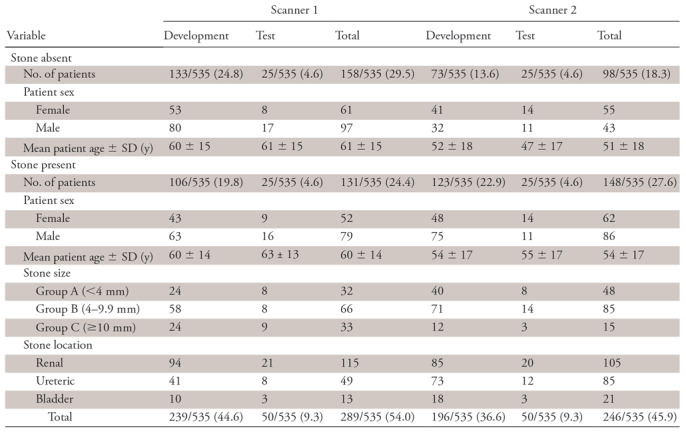
Note.—Test cases were discrete from development dataset. Unless indicated, data are numbers of patients with percentages in parentheses. SD = standard deviation.
CNN Architecture and Generation of Pretrained Model (GrayNet)
Inception-v3 (22) CNN architecture was selected to develop the cascading urinary stone detection system because it achieved excellent classification performance in the ImageNet Large Scale Visual Recognition Challenge (23). This CNN was pretrained with ImageNet that contains 1.2 million natural images from 1000 categories (24). The ImageNet pretrained model was fine-tuned on GrayNet, an in-house–built dataset that contains labeled CT images for human anatomy recognition to generate a pretrained model (GrayNet pretrained model). The GrayNet pretrained model was then used for weight initialization of CNN models for urinary tract identification and stone detection.
The goal for creating GrayNet was to build a pretrained model that would potentially be generalizable to all CT applications. GrayNet includes heterogeneous data (ie, images varying in acquisition protocol, vendor, sex, window settings, and contrast enhancement from 322 CT examinations of head, neck, chest, abdomen, and pelvis scanned on two vendors). Details on GrayNet data distribution and GrayNet pretrained model generation can be viewed in Appendix E1 (supplement).
Cascading Model for Urinary Stone Detection
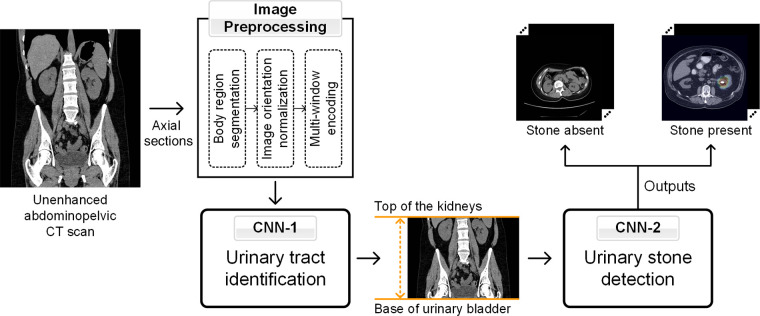
The cascading model (Fig 2) consisted of two CNNs. The first (CNN-1) identified the CT sections containing the urinary tract (top of the kidneys to base of urinary bladder). The sections within the urinary tract, as identified by CNN-1, were then presented to the second CNN (CNN-2) for classification into presence or absence of stones. The two CNNs were developed by training the Inception-v3 models on two-dimensional sections of the development dataset (Appendix E2 [supplement]). Inception-v3 models with or without pretrained models were trained on each training dataset after the last fully connected layers were replaced with a sigmoid classification layer for binary output (within or outside urinary tract for CNN-1; presence or absence of stones for CNN-2).
Figure 2:
Schematic representation of the image preprocessing steps and cascading convolutional neural network (CNN) model for urinary tract region (CNN model 1 [CNN-1]) and stone (CNN model 2 [CNN-2]) identification.
Image Preprocessing
All DICOM images went through a pipeline of preprocessing functions before being used as input to CNN models. First, body regions were segmented by Hounsfield unit thresholding at −300 HU (25). Images were then normalized such that all scans were oriented in the supine position. Full-resolution (512 × 512 pixels) CT images were converted into grayscale and encoded into a multiwindow RGB image by using three different window widths and levels (Fig 2, Appendix E3 [supplement]).
Network Training
For models trained without weight initialization (“random”), CNNs were trained on datasets from scratch by using a method described by He et al (26), wherein samples are drawn from a normal distribution with a range that depends on the number of neurons in the previous layer to efficiently find minimum global training loss. For ImageNet- and GrayNet-pretrained models, weights were initialized according to the pretrained model (ImageNet or GrayNet, respectively) and further fine-tuned on the training dataset for both CNN-1 and CNN-2. All models (CNN-1 and CNN-2) were trained for 30 epochs with a minibatch stochastic gradient descent with 0.9 Nesterov (27) momentum, 64 batch size, and 5 × 10⁻⁵ weight decay. Three different base learning rates (0.001, 0.005, and 0.01) were used for model hyperparameter tuning, and each was decayed by 10 every 10 epochs to obtain a stable convergence of training cost function. The best models were selected on the basis of validation losses. To improve model generalization, data were augmented for training by applying geometric transformations, such as horizontal flipping, scaling (80%–100% at 1% interval), rotation (−30° to 30° at 1° interval), and translation (−15 to 15 pixels in x and y directions at an interval of 1 pixel). These parameters were randomly selected on the fly during training. To address class imbalance, the minority class (“outside urinary tract” for CNN-1; “stone present” for CNN-2) was oversampled to the same numbers of the majority class: “within urinary tract” for CNN-1; “stone absent” for CNN-2) and augmented in every batch (28). All DL models were implemented by using Keras (version 2.1.1) with a TensorFlow backend (version 1.3.0), and all experiments were performed on an NVIDIA Devbox (Santa Clara, Calif) equipped with four Titan X graphical processing units (GPUs) with 12 GB of memory per GPU.
Experiment Setting
The first experiment was performed to evaluate the generalization of models. This was studied by using models that (a) varied in network initialization and (b) were trained on images acquired with different acquisition and reconstruction protocols. Thus, nine different models were defined: GrayNet pretrained model fine-tuned with training datasets from S1 (GrayNet-S1), S2 (GrayNet-S2), and both (hereafter SB) (GrayNet-SB); ImageNet pretrained model fine-tuned with training datasets from S1 (ImageNet-S1), S2 (ImageNet-S2), and both (ImageNet-SB); and randomly initialized model trained from scratch, using He et al initialization (26), with training datasets from S1 (Random-S1), S2 (Random-S2), and both (Random-SB). These nine models were then evaluated at section level by using the test dataset from S1, S2, or both. This experiment was conducted by developing CNN-2 models to predict presence or absence of stone at section level.
The second experiment was to evaluate the diagnostic accuracy of the cascading model for urinary stone detection at the patient level. Three models from the above experiment (Random-SB, ImageNet-SB, and GrayNet-SB) were assessed in this setup to evaluate overall diagnostic accuracy on the patient level. For this, each patient’s entire CT scan was passed through the cascade of CNN-1 that identified the sections from the top of the kidney to the base of the urinary bladder; the identified sections were then presented to CNN-2 to detect the presence of a stone on any section (Fig 2). The test dataset from both scanners was used for evaluation of performance at the patient level (overall and in subanalysis according to size, location, and presence of phleboliths).
Statistical Analysis
Statistical evaluation for assessing categorical and continuous demographic and patient data were performed using χ2 and t tests on SPSS software, version 25 (IBM, Chicago, Ill) (29). Average precision (AP) was used as the evaluation metric for comparing the generalization of models at section level. It is a fair performance metric when a binary classifier has class imbalance, such as our data (30). AP summarizes the relationship between precision (ratio of true-positives to the sum of true- and false-positives [ie, positive predictive value]) and recall (ratio of true-positives to the sum of true-positives and false-negatives [ie, sensitivity]). Area under the receiver operating characteristic curve (AUC) was used to evaluate the cascading model for patient-level prediction for the presence of stones, and the Delong method was used to compare the AUCs. Sensitivity, specificity, negative predictive value, positive predictive value, and accuracy were determined for the models from the optimal threshold that was selected on the basis of the sum of sensitivity and specificity on the validation dataset. McNemar and Pearson χ2 tests were used to compare the models for these metrics. Mean of intersection over union was used as the evaluation metric for measuring the accuracy of CNN-1 for identification of the urinary tract. AP and AUC values were computed by using Scikit-learn, version 0.19.1 (31), a machine learning library available in Python 2.7.12. We calculated 95% confidence intervals (CIs) by using a nonparametric bootstrap approach for AP and differences in AP between paired models and AUC; a binomial proportion CI method was used for sensitivity, specificity, negative and positive predictive values, and accuracy. Post hoc power analysis revealed that this study’s 100-case (data from both scanners) test sample size had a 64.9% power to detect a significant difference between Random-SB and GrayNet-SB and 37.0% power for ImageNet-SB versus GrayNet-SB at a two-sided significance level of .05.
Results
Among the 535 patients, stones were present in 279 patients (165 men and 114 women) and absent in 256 (140 men and 116 women). The mean age ± standard deviation in both cohorts were 56 years ± 15 and 56 years ± 16, respectively. Age and sex did not significantly differ between patients with and without stones (P >.05). Mean stone size was 6 mm (range, 1–32 mm). Stones were in the kidney alone (n = 133), ureter alone (n = 40), bladder alone (n = 35), or in more than one location (n = 75). Baseline patient characteristics (age, sex, stone size, location, presence of stent or phleboliths) did not significantly differ between training and testing datasets (P >.05). Across scanners, in patients with stones, a significant difference was found in stone size and location between scanners 1 and 2 (P < .05). Distribution of patients with phleboliths is presented in Appendix E4 (supplement). Test performance of CNN-1 models (Random-SB, ImageNet-SB, and GrayNet-SB) for identifying the extent of urinary tract were mean of intersection over union of 0.982, 0.985, and 0.987, respectively.
Evaluation of Model Generalization across Scanners (Section-Level Analysis)
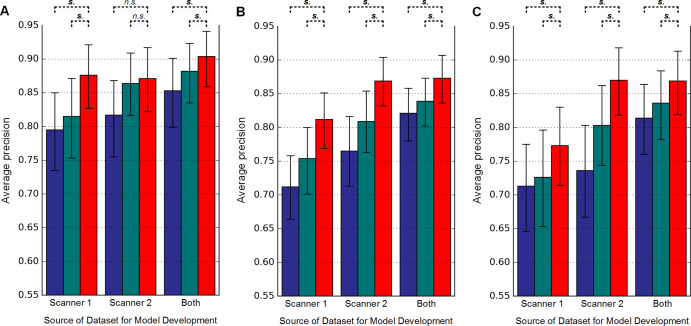
The APs for detecting urinary stone by the nine models on a per-section level are shown in Figure 3. GrayNet-pretrained models showed higher classifier performance with use of test data from the same or different scanner. This was significant for all iterations except for GrayNet-S2 versus Random-S2 and GrayNet-S2 versus ImageNet-S2 when S1 was used as the test dataset (Table 3). For all test datasets, highest AP was seen when training data consisted of images from both scanners, irrespective of the method of network initialization. Cross-scanner testing showed higher AP with training data from S2 compared with S1.
Figure 3:
Evaluation of generalization (section-level analysis) for urinary stone detection by convolutional neural networks 1 and 2. Models were developed by using different datasets (indicated on x-axis: scanner 1, scanner 2, and both scanners) and used different pretrained models: Random (blue), ImageNet (green), and GrayNet (red). In each plot, average precision and 95% confidence intervals (represented by error bars) of the nine models are shown when tested on test datasets from, A, scanner 1, B, scanner 2, and, C, both scanners. Statistical significance between average precision of GrayNet and ImageNet or Random models are also denoted. n.s. = not statistically significantly different, s. = statistically significantly different.
Table 3:
Comparison of Model Generalization
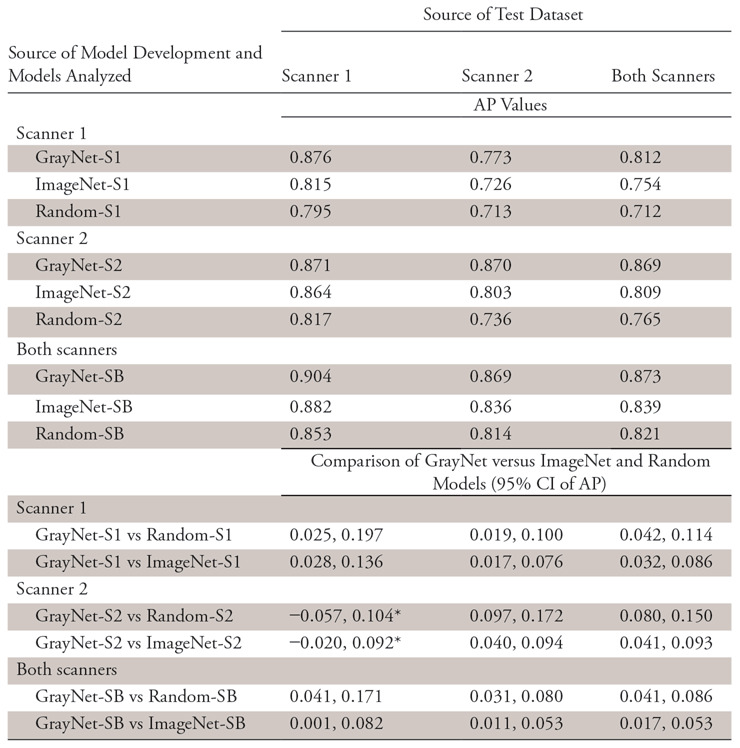
Note.—Average precision and 95% confidence intervals for different pretrained models. AP = average precision; CI = confidence interval.
*No significant difference.
Evaluation of Diagnostic Accuracy (Patient-Level Analysis)
With images from both scanners used as the test cohort at the patient level, the AUC (Fig 4) for GrayNet-SB (0.954) was higher, but not statistically significantly different, than the AUCs for ImageNet-SB (0.936) and Random-SB (0.925). Sensitivity, specificity, accuracy, and negative and positive predictive values are presented in Table 4. Accuracy of GrayNet-SB (95%) was higher than that of ImageNet-SB (91%) and Random-SB (88%). For smaller (group A) stones, false-negative findings for GrayNet-SB, ImageNet-SB, and Random-SB were one of 16, three of 16, and five of 16, respectively. All three models demonstrated equivalent performance for groups B (false-negative, two of 22) and C (false negative, 0 of 12). The number of false-negative scans for GrayNet-SB, ImageNet-SB, and Random-SB were as follows: for renal stones, one of 41, three of 41, and five of 41; for ureteric stones, one of 20, two of 20, and two of 20; and for bladder stones, two of six, one of six, and one of six, respectively. Twenty-two of 50 patients in the test dataset had obstructive uropathy secondary to stone disease, and GrayNet-SB identified stones in all 22 patients with obstructive uropathy. However, both ImageNet-SB and Random-SB had one false-negative scan each. The presence of phleboliths did not influence GrayNet-SB.
Figure 4:
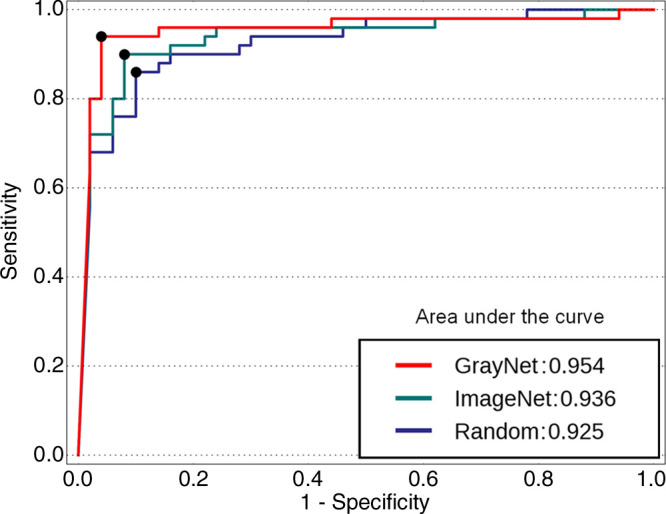
Receiver operating characteristic curves of the three models (GrayNet-SB, ImageNet-SB, and Random-SB) for patient-level analysis. SB = data from both scanners (scanner 1 plus scanner 2).
Table 4:
Statistical Analysis of Three Models Developed with Datasets from Both Scanners (Patient Level) Depicting Diagnostic Accuracy for Stone Detection

Note.—Data are expressed as percentages, with numbers in parentheses the numerators and denominators for each proportional performance; numbers in brackets represent 95% confidence intervals for the percentages. AUCs were compared by using Delong method. The McNemar test was used to compare sensitivity, specificity, and accuracy. Pearson χ2 was used to compare positive and negative predictive values. AUC = area under receiver operating characteristic curve.
*P values represent comparison of Random-SB with GrayNet-SB.
†P values represent comparison of ImageNet-SB with GrayNet-SB.
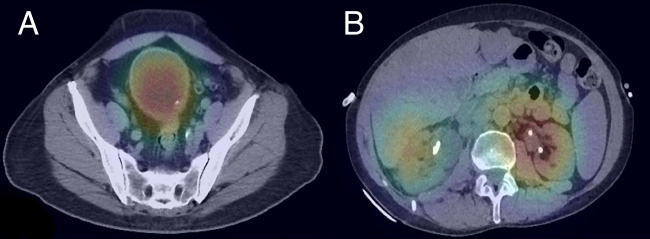
With GrayNet-SB, the two false-positive examinations (Fig 5) were from both S1 and S2. In one examination, CNN predicted calcific speck along the bladder wall as stone. This, however, was part of focal nodular thickening and cytologically proven as transitional cell carcinoma. The second examination contained bilateral nephrostomy tubes that were erroneously predicted by CNN as “stone.” All three false-negative examinations (Fig 6) were from S1, two had stones smaller than 5 mm in size, and one had layered stones within a bladder diverticulum.
Figure 5:
False-positive examination results in two patients. A, Heat map overlaid on axial CT image in one patient shows calcific speck within focal nodular thickening proven as transitional cell carcinoma. B, Heat map in second patient shows bilateral nephrostomy tubes predicted as “stone-positive” areas.
Figure 6:
False-negative examination results in three patients. Coronal reformatted CT images show, A, punctate renal stone (arrow) in the left lower pole and, B, 4-mm stone (arrow) in the distal left ureter. C, Axial CT scan shows tiny calculi (arrow) layered in a posterior bladder diverticulum.
Discussion
In this study, we have developed a cascading CNN model, enriched with modality-specific (CT) radiology images, that detects stone within the urinary tract at unenhanced abdominopelvic CT with a high accuracy (AUC, 0.954).
In the realm of emergency radiology, high sensitivity is necessary and turnaround time or lack of resources may pose challenges. On a patient level, the current model achieved a 94% sensitivity and 96% specificity for stone detection where two of three false-negative examinations comprised small-sized stones. On the basis of stone location, the performance was high for all locations, with one scan false-negative for kidney and ureter and two scans false-negative for bladder. Unenhanced CT has 96.6% sensitivity and 94.9% specificity, with superior performance of thin-section and coronal CT reformats for evaluation of small stones (32–35). One false-positive examination in our study did have focal tumor-associated bladder wall thickening and calcification, which, despite being a “false” scan, would warrant radiologist review. Our proposed model thus has the potential to accelerate triage in an urgent setting, allowing for rapid prioritization of examinations for review by radiologists and referring physicians.
In our study, when training and test data were from the same scanner, the section-level performance was similar (AP, 0.87). Model generalization improved with GrayNet-SB upon using disparate training data (ie, from both scanners) in the section-level experiment. In addition, models trained with data from both scanners showed a trend for better or similar performance than when test and training data were from the same scanner. This can be attributed to more images in the training dataset.
The purpose of performing section-level analysis was to evaluate the performance across different scanners and pretrained models. A recent investigation by AlBadawy et al (13) found reduced model performance (Dice coefficient decreased from 0.72–0.76 to 0.68) for segmenting brain tumors on MRI with cross-institution test datasets. Similar conclusions have also been drawn from other modalities (15). The high cross-vendor performance in the current investigation was statistically significant for all test scenarios, except with S2-trained models tested on S1 test datasets. This high cross-vendor performance was obtained despite differences in section thickness, acquisition parameters, reconstruction techniques, and vendors. Our results can partly be attributed to presence of a standardized grayscale calibration (Hounsfield units) across CT platforms, unlike in other imaging modalities (36). However, Hounsfield unit is influenced by tube voltage and may affect the performance in CT. Our training dataset consisted of scans with varying kilovoltage peaks. Interestingly, in the current study, cross-scanner performance was higher with training data from S2 versus S1 (AP, 0.87 vs 0.77). A possible reason for the higher metric is the larger number of training images from S2 because thinner sections were used for S2 (2 mm) compared with S1 (5 mm). Another difference, although not specifically evaluated in this study, is that images from S2 were virtually generated from a dual-energy acquisition, whereas those from S1 were acquired with a single kilovoltage peak.
Our stone dataset is relatively small (<600 cases) and imbalanced, with approximately 14 times more sections without stone than with. Therefore, we created a GrayNet-pretrained model, which is an ImageNet-pretrained CNN model enriched with CT images labeled according to human anatomy. This approach was inspired by the standard medical education wherein students learn human anatomy before learning pathology. Images in GrayNet vary in terms of acquisition parameters, window settings, contrast enhancement, and patient demographic characteristics. Our results for the patient-level experiment show a trend of better performance with use of GrayNet-pretrained models in all test scenarios compared with the other two pretrained models, irrespective of stone location, particularly for smaller stones (<4 mm). The patient-level results followed the trend of section-level point estimates, and a possible cause of its low statistical significance is a small test size. Nevertheless, the trend implies that transfer learning with medical images such as GrayNet-pretrained models can be an effective baseline for biomedical DL applications. Such an approach has also been applied in other modalities where use of modality- and body part–specific training data, in tandem with transfer learning from natural images, improved task performance and generalization (37). In our study, GrayNet differs in that it contains CT images annotated to denote the extent of different anatomic regions.
CT is commonly used for renal colic in the ED. Schoenfeld et al (38) found that up to 82.6% patients with symptoms of renal colic undergo CT. Processes are being studied to reduce diagnostic delay and improve patient flow in the ED (39). Studies have implicated imaging as a prominent cause of longer ED length of stay (40). Although a recent publication demonstrated that CT interpretation time accounted for only 32% of the CT workflow and 9.4% of ED length of stay, the use of initial interpretations may be a reason for the low CT turnaround time percentages in Wang et al (6). As use of imaging continues to increase, artificial intelligence–assisted workflow may help triage and streamline patients. CNN models such as ours have the potential to aid in this task by identifying positive examinations to prioritize patient care.
This preliminary, pilot, proof-of-concept study had a few limitations. First, the sample size was underpowered, particularly for subanalysis according to stone site and size. However, low numbers of falsely predicted scans with use of the GrayNet-pretrained model indicated an efficient way to streamline CT scans for stone detection, irrespective of size, location, obstruction, and presence of phleboliths. Future direction would include dedicated analysis for ureteric stones, especially when small, because they often pose a problem in a busy practice as a result of partial volume averaging, image noise, and mimic vascular calcifications. Second, the pretraining for development of GrayNet did not involve dedicated annotation of ureters, and the cascading model was limited to detection. It would be interesting to use DL for comprehensive evaluation by comparing prior imaging and determining stone volume and composition that would aid in guiding management. Training with a larger number of scans containing anatomic variants, calyceal and bladder diverticula, ureteric stents, and percutaneous nephrolithotomy tubes in this scenario would also be clinically relevant. Third, this was a retrospective study, and data for model development were obtained on two scanners from a single institution. However, between the two scanners, the acquisition parameters and section thickness were dissimilar. Prospective validation of the model should be pursued to evaluate reproducibility of this work on data from different institutions and scanners. Fourth, the Inception-v3 model used in this study may not be ideal, and performance of CNN in the biomedical arena may be enhanced by creating a customized neural network architecture.
In conclusion, DL with cascading model of CNNs is feasible for accurately detecting urinary tract stones on unenhanced CT scans. The performance and generalization of neural networks can be enhanced by using transfer learning with datasets enriched with medical images.
APPENDIX
SUPPLEMENTAL FIGURES
Acknowledgments
Acknowledgments
The authors would like to thank Aushee Khamesra for assistance in data management and acknowledge Isabelle Hartnett for help in establishing GrayNet.
A.P. and H.L. contributed equally to this work.
Current address: Department of Radiology, University of Washington, Seattle, Wash
Disclosures of Conflicts of Interest: A.P. disclosed no relevant relationships. H.L. disclosed no relevant relationships. J.H.L. disclosed no relevant relationships. B.H.E. Activities related to the present article: disclosed no relevant relationships. Activities not related to the present article: has stock in and is medical advisor to Sonomotion. Other relationships: disclosed no relevant relationships. D.V.S. Activities related to the present article: disclosed no relevant relationships. Activities not related to the present article: consultant for GE Healthcare (CT protocol optimization and workflow improvements and DECT workshops); institution receives grants from GE Healthcare (dual-energy CT workflow and contrast media utilization); receives royalties from Elsevier for textbook on abdominal imaging; receives accommodations from Philips for speaking at spectral CT user event. Other relationships: disclosed no relevant relationships. S.D. Activities related to the present article: disclosed no relevant relationships. Activities not related to the present article: consultant for Nulogix Health and Doai; receives research support from ZCAI, Tplus, and MediBloc. Other relationships: disclosed no relevant relationships.
Abbreviations:
- AP
- average precision
- AUC
- area under the receiver operating characteristic curve
- CNN
- convolutional neural network
- DICOM
- Digital Imaging and Communications in Medicine
- DL
- deep learning
- ED
- emergency department
References
- 1.Chen Z, Prosperi M, Bird VY. Prevalence of kidney stones in the USA: the National Health and Nutrition Evaluation Survey. J Clin Urol 2018 Nov 26 [Epub ahead of print] 10.1177/2051415818813820. [DOI] [Google Scholar]
- 2.Foster G, Stocks C, Borofsky MS. Emergency Department Visits and Hospital Admissions for Kidney Stone Disease, 2009: Statistical Brief #139. Healthcare Cost and Utilization Project (HCUP) Statistical Briefs. Rockville, Md: Agency for Healthcare Research and Quality, 2012. https://www.ncbi.nlm.nih.gov/pubmed/23016164. Accessed February 16, 2019. [PubMed] [Google Scholar]
- 3.American College of Radiology . ACR appropriateness criteria. Acute onset flank pain-suspicion of stone disease (urolithiasis). https://acsearch.acr.org/docs/69362/Narrative/. Accessed February 12, 2019. [PubMed]
- 4.Westphalen AC, Hsia RY, Maselli JH, Wang R, Gonzales R. Radiological imaging of patients with suspected urinary tract stones: national trends, diagnoses, and predictors. Acad Emerg Med 2011;18(7):699–707. [DOI] [PMC free article] [PubMed] [Google Scholar]
- 5.Fwu CW, Eggers PW, Kimmel PL, Kusek JW, Kirkali Z. Emergency department visits, use of imaging, and drugs for urolithiasis have increased in the United States. Kidney Int 2013;83(3):479–486. [DOI] [PMC free article] [PubMed] [Google Scholar]
- 6.Wang DC, Parry CR, Feldman M, Tomlinson G, Sarrazin J, Glanc P. Acute abdomen in the emergency department: is CT a time-limiting factor? AJR Am J Roentgenol 2015;205(6):1222–1229. [DOI] [PubMed] [Google Scholar]
- 7.Lee H, Tajmir S, Lee J, et al. Fully automated deep learning system for bone age assessment. J Digit Imaging 2017;30(4):427–441. [DOI] [PMC free article] [PubMed] [Google Scholar]
- 8.Prevedello LM, Erdal BS, Ryu JL, et al. Automated critical test findings identification and online notification system using artificial intelligence in imaging. Radiology 2017;285(3):923–931. [DOI] [PubMed] [Google Scholar]
- 9.Lakhani P, Sundaram B. Deep learning at chest radiography: automated classification of pulmonary tuberculosis by using convolutional neural networks. Radiology 2017;284(2):574–582. [DOI] [PubMed] [Google Scholar]
- 10.Levin S, Toerper M, Hamrock E, et al. Machine-learning-based electronic triage more accurately differentiates patients with respect to clinical outcomes compared with the emergency severity index. Ann Emerg Med 2018;71(5):565–574.e2. [DOI] [PubMed] [Google Scholar]
- 11.Berlyand Y, Raja AS, Dorner SC, et al. How artificial intelligence could transform emergency department operations. Am J Emerg Med 2018;36(8):1515–1517. [DOI] [PubMed] [Google Scholar]
- 12.Greenspan H, van Ginneken B, Summers RM. Guest editorial: Deep learning in medical imaging: overview and future promise of an exciting new technique. IEEE Trans Med Imaging 2016;35(5):1153–1159. [Google Scholar]
- 13.AlBadawy EA, Saha A, Mazurowski MA. Deep learning for segmentation of brain tumors: Impact of cross-institutional training and testing. Med Phys 2018;45(3):1150–1158. [DOI] [PubMed] [Google Scholar]
- 14.Cole JH, Poudel RPK, Tsagkrasoulis D, et al. Predicting brain age with deep learning from raw imaging data results in a reliable and heritable biomarker. Neuroimage 2017;163:115–124. [DOI] [PubMed] [Google Scholar]
- 15.Mordang JJ, Janssen T, Bria A, Kooi T, Gubern-Mérida A, Karssemeijer N. Automatic microcalcification detection in multi-vendor mammography using convolutional neural networks. In: Tingberg A, Lång K, Timberg P, eds. Breast Imaging. IWDM 2016. Lecture Notes in Computer Science, vol 9699. Cham, Switzerland: Springer International, 2016; 35–42. [Google Scholar]
- 16.Esteva A, Kuprel B, Novoa RA, et al. Dermatologist-level classification of skin cancer with deep neural networks. Nature 2017;542(7639):115–118 [Published correction appears in Nature 2017;546(7660):686.] 10.1038/nature21056. [DOI] [PMC free article] [PubMed] [Google Scholar]
- 17.Gulshan V, Peng L, Coram M, et al. Development and validation of a deep learning algorithm for detection of diabetic retinopathy in retinal fundus photographs. JAMA 2016;316(22):2402–2410. [DOI] [PubMed] [Google Scholar]
- 18.Amit G, Ben-Ari R, Hadad O, Monovich E, Granot N, Hashoul S. Classification of breast MRI lesions using small-size training sets: comparison of deep learning approaches. In: Armato S III, Petrick NA, eds. Proceedings of SPIE: medical imaging 2017—computer-aided diagnosis. Vol 10134. Bellingham, Wash: International Society for Optics and Photonics, 2017; 101341H. [Google Scholar]
- 19.Kim HG, Choi Y, Ro YM. Modality-bridge transfer learning for medical image classification. 2017 10th International Congress on Image and Signal Processing, BioMedical Engineering and Informatics (CISP-BMEI), 2017; 1–5. [Google Scholar]
- 20.Yosinski J, Clune J, Bengio Y, Lipson H. How transferable are features in deep neural networks? In: Advances in Neural Information Processing Systems. 2014;3320–3328. https://papers.nips.cc/paper/5347-how-transferable-are-features-in-deep-neural-networks. Accessed May 11, 2019. [Google Scholar]
- 21.Shin HC, Roth HR, Gao M, et al. Deep convolutional neural networks for computer-aided detection: CNN architectures, dataset characteristics and transfer learning. IEEE Trans Med Imaging 2016;35(5):1285–1298. [DOI] [PMC free article] [PubMed] [Google Scholar]
- 22.Szegedy C, Vanhoucke V, Ioffe S. Rethinking the inception architecture for computer vision. CVPR 2016. http://www.cv-foundation.org/openaccess/content_cvpr_2016/html/Szegedy_Rethinking_the_Inception_CVPR_2016_paper.html. Published 2016. Accessed September 5, 2018. [Google Scholar]
- 23.Russakovsky O, Deng J, Su H, et al. ImageNet large scale visual recognition challenge. Int J Comput Vis 2015;115(3):211–252. [Google Scholar]
- 24.Deng J, Dong W, Socher R, Li LJ, Li K, Fei-Fei L. ImageNet: a large-scale hierarchical image database. 2009 CVPR 2009 IEEE Conference on Computer Vision and Pattern Recognition, 2009; 248–255. [Google Scholar]
- 25.Wang J, Li F, Li Q. Automated segmentation of lungs with severe interstitial lung disease in CT. Med Phys 2009;36(10):4592–4599. [DOI] [PMC free article] [PubMed] [Google Scholar]
- 26.He K, Zhang X, Ren S, Sun J. Delving deep into rectifiers: surpassing human-level performance on ImageNet classification. 2015 IEEE International Conference on Computer Vision (ICCV), 2015; 1026–1034. [Google Scholar]
- 27.Nesterov Y. A method for unconstrained convex minimization problem with the rate of convergence O (1/k^ 2). Doklady AN USSR. ci.nii.ac.jp. https://ci.nii.ac.jp/naid/20001173129/. Published 1983. Accessed September 5, 2018. [Google Scholar]
- 28.Buda M, Maki A, Mazurowski MA. A systematic study of the class imbalance problem in convolutional neural networks. ArXiv 1710.05381 [cs.CV]. [preprint] http://arxiv.org/abs/1710.05381. Posted 2017. Accessed September 5, 2018. [DOI] [PubMed]
- 29.IBM Corporation . SPSS Statistics for Macintosh, Version 25.0. Armonk, NY: IBM Corporation, 2017. [Google Scholar]
- 30.Davis J, Goadrich M. The relationship between precision-recall and ROC curves. Proceedings of the 23rd International Conference on Machine Learning. New York, NY: ACM, 2006; 233–240. [Google Scholar]
- 31.Pedregosa F, Varoquaux G, Gramfort A, et al. Scikit-learn: machine learning in python. J Mach Learn Res. 2011;12(Oct):2825–2830. [Google Scholar]
- 32.Türk C, Petřík A, Sarica K, et al. EAU guidelines on interventional treatment for urolithiasis. Eur Urol 2016;69(3):475–482. [DOI] [PubMed] [Google Scholar]
- 33.Lin WC, Uppot RN, Li CS, Hahn PF, Sahani DV. Value of automated coronal reformations from 64-section multidetector row computerized tomography in the diagnosis of urinary stone disease. J Urol 2007;178(3 Pt 1):907–911; discussion 911. [DOI] [PubMed] [Google Scholar]
- 34.Dobbins JM, Novelline RA, Rhea JT, Rao PM, Prien EL, Dretler SP. Helical computed tomography of urinary tract stones: accuracy and diagnostic value of stone size and density measurements. Emerg Radiol 1997;4(5):303–308. [Google Scholar]
- 35.Metser U, Ghai S, Ong YY, Lockwood G, Radomski SB. Assessment of urinary tract calculi with 64-MDCT: the axial versus coronal plane. AJR Am J Roentgenol 2009;192(6):1509–1513. [DOI] [PubMed] [Google Scholar]
- 36.Kohli MD, Summers RM, Geis JR. Medical image data and datasets in the era of machine learning. Whitepaper from the 2016 C-MIMI Meeting Dataset Session. J Digit Imaging 2017;30(4):392–399. [DOI] [PMC free article] [PubMed] [Google Scholar]
- 37.Hadad O, Bakalo R, Ben-Ari R, Hashoul S, Amit G. Classification of breast lesions using cross-modal deep learning. 2017 IEEE 14th International Symposium on Biomedical Imaging (ISBI 2017), 2017; 109–112. [Google Scholar]
- 38.Schoenfeld EM, Pekow PS, Shieh MS, Scales CD Jr, Lagu T, Lindenauer PK. The diagnosis and management of patients with renal colic across a sample of US hospitals: high CT utilization despite low rates of admission and inpatient urologic intervention. PLoS One 2017;12(1):e0169160. [DOI] [PMC free article] [PubMed] [Google Scholar]
- 39.Al Kadhi O, Manley K, Natarajan M, et al. A renal colic fast track pathway to improve waiting times and outcomes for patients presenting to the emergency department. Open Access Emerg Med 2017;9:53–55. [DOI] [PMC free article] [PubMed] [Google Scholar]
- 40.Kanzaria HK, Probst MA, Ponce NA, Hsia RY. The association between advanced diagnostic imaging and ED length of stay. Am J Emerg Med 2014;32(10):1253–1258. [DOI] [PMC free article] [PubMed] [Google Scholar]
Associated Data
This section collects any data citations, data availability statements, or supplementary materials included in this article.


