Abstract
This dataset is intended to be used for machine learning and is composed of annotations with bounding boxes for pulmonary opacity on chest radiographs which may represent pneumonia in the appropriate clinical setting.
Summary
This dataset is intended to be used for machine learning and is composed of annotations with bounding boxes for pulmonary opacity on chest radiographs which may represent pneumonia in the appropriate clinical setting.
Key Points
■ This 30 000-image dataset augments part of the National Institutes of Health Clinical Center’s CXR8 chest radiograph collection by specifying the location of radiographic findings of possible pneumonia.
■ The dataset was used for the RSNA 2018 Machine Learning Challenge.
■ The dataset, a collaboration of the Radiological Society of North America and the Society of Thoracic Radiology, is available to the public to create high-quality machine-learning algorithms to help diagnose pneumonia.
Introduction
In the United States, pneumonia accounted for more than 500 000 visits to emergency departments (1) and more than 50 000 deaths in 2015 (2), keeping the ailment on the list of top 10 causes of death in the country. Diagnosing pneumonia on a chest radiograph typically involves highly trained specialists and confirmation through clinical history, vital signs, and laboratory examinations. Our goal was to provide an annotated dataset to help develop machine learning algorithms that can assist in diagnosis of pneumonia, especially for areas of the world lacking the requisite expertise.
Although machine learning algorithms can be trained with categorical labels (eg, “pneumonia” vs “no pneumonia”), accurate object-class detectors typically require a large set of images in which objects (eg, pneumonia) have been annotated manually with bounding boxes (3). Subsequent algorithms will be more likely to provide better information for the location and size of any pneumonia detected, which has potential benefits for clinicians who have to decide whether or not to trust the algorithm (by being able to see where an algorithm localizes a pneumonia) and their decisions for treatment (eg, small pneumonia vs large pneumonia).
Our dataset comprised 30 000 frontal view chest radiographs from the 112 000-image public National Institutes of Health (NIH) CXR8 dataset (4), which contains only frontal views (posteroanterior or anteroposterior) in the Portable Network Graphics image format. Random unique identifiers were generated for each of the 30 000 examinations. Within this 30 000 subset of examinations, there were 16 248 posteroanterior views and 13 752 anteroposterior views. The Portable Network Graphics images were converted into Digital Imaging and Communications in Medicine format, and patient sex, patient age, and projection (anteroposterior or posteroanterior) were added to the Digital Imaging and Communications in Medicine tags. This work was a joint effort by radiologists from the Radiological Society of North America (RSNA) and Society of Thoracic Radiology (STR).
The original NIH dataset contained categorical labels derived in an automated fashion from radiology reports by using natural language processing with the understanding that the labels were not always accurate. The original category labels included “infiltration,” a term not recommended by the Fleischner Society (5), and synonyms such as “consolidation” and “infiltration.” Original labels such as “infiltration,” “consolidation,” and “atelectasis” describe imaging findings. The terms “pneumonia” and “edema” refer to disease processes that can manifest as “consolidation” or “infiltration,” appear similar on images, and require correlation with clinical information and laboratory values for diagnosis. Additional disease entities such as pulmonary hemorrhage and cryptogenic organizing pneumonia also can manifest as “consolidation.” By reclassifying the 30 000 selected examinations which included 15 000 examinations with pneumonia-like labels (“pneumonia,” “infiltration,” and “consolidation”), a random selection of 7500 examinations with a “no findings” label, and another random selection of 7500 examinations without the pneumonia-like labels and without the “no findings” label, we aimed to improve the accuracy of categorical labels by removing overlapping terms and improving clinical relevance of the dataset. The annotated dataset also contains bounding boxes to localize the pneumonia-like opacities, which are clinically relevant information not available in the original NIH dataset.
Materials and Methods
Annotation
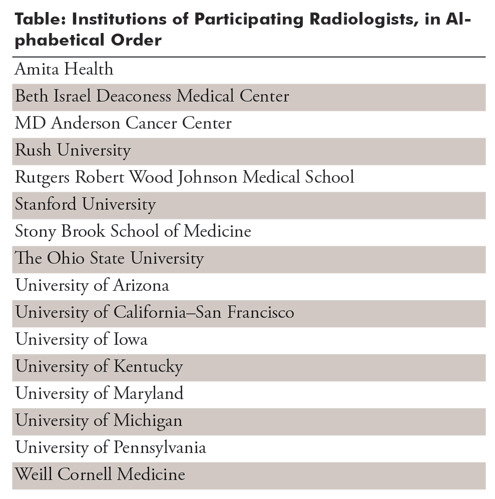
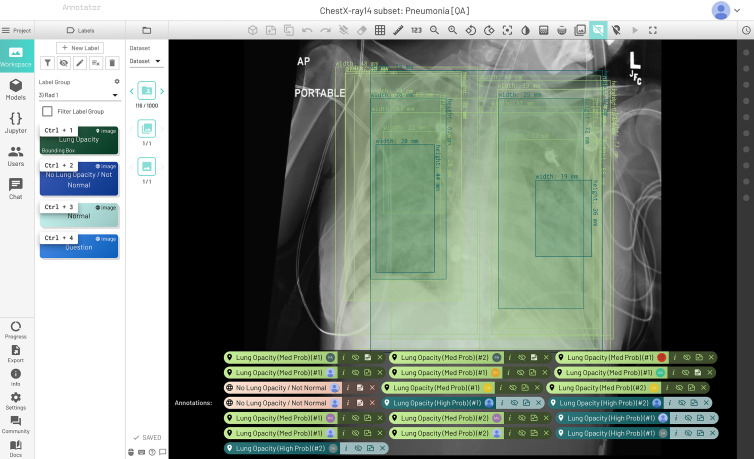
No institutional review board approval was obtained; the examinations were part of a publicly available NIH dataset (4). Eighteen board-certified radiologists from 16 academic institutions served as readers (Table); they had a mean of 10.6 years of experience (age range, 3–35 years). Six radiologists (T.S.C., S.S.H., M.D.K., L.M.P., A. Sharma, G.S.; all annotated more than 1000 cases) represented RSNA, and 12 thoracic imaging experts (J.K.A., V.A.*, M.G., R.R.G.*, M.G.B.G.*, S.H.*, J.J.*, A.L.*, P.N.S.*, D.V.*, C.C.W.*, K.Y.; asterisk indicates those who annotated more than 1000 cases) represented STR. Annotation was performed by using a commercial annotation platform provided at no cost (MD.ai, New York, NY), for which two of the authors (G.S. and A. Stein) serve as consultants. Readers used a variety of personal computers to view and annotate the images and did not use a diagnostic picture archiving and communication system environment; they were blinded to the other readers’ annotations. The annotation system allowed adjustment of the brightness, contrast, and magnification of the images. All participating radiologists first practiced on the same set of 50 randomly selected warm-up chest radiographs blinded to other readers’ annotations. Readers were then unblinded to the other radiologists’ annotations for the same set of 50 chest radiographs (Fig 1) as an initial calibration and to allow for questions (eg, Question: Does a radiograph with healed rib fractures and no other findings count as “Normal”? Answer: Yes.). The list of labels included “Opacity (High Probability),” “Opacity (Medium Probability),” “Opacity (Low Probability),” “No Opacity/Not Normal,” and “Normal.” A “Question” label was available for readers to flag a case that needed to be reviewed by a chest radiologist with 11 years of experience (C.C.W.) and resolved into one of the categories. The number of initial cases was chosen for readers to become familiar with the annotation tool and to expose potential problems. For example, some readers initially drew one box that encompassed both lungs, rather than a separate box for areas in each lung.
Table:
Institutions of Participating Radiologists, in Alphabetical Order

Figure 1:
Initial quality assurance dataset that let radiologists practice annotations together on the same 50 chest radiographs and compare results with each other. All the radiologists provided bounding boxes where they thought opacities were seen. There was variation in the probability (medium vs high) for several readers, while two readers thought there were no opacities suspicious for pneumonia.
The six RSNA representatives each annotated a set of 5000 randomly assigned chest radiographs. Bounding boxes were drawn by using a click-and-drag method with the ability to edit the resulting rectangle. Readers were asked to make each bounding box as small as possible but to encompass the entire suspicious opacity. In cases with two or more discontinuous opacities, multiple bounding boxes were placed.
The 12 STR readers were responsible primarily for annotating the test set used to determine the winner of the 2018 RSNA Pneumonia Detection Machine Learning Challenge. Each of the 4527 chest radiographs in the test set was annotated by two different STR readers, in addition to one RSNA reader. The number of cases in the subset was a reflection of the number of cases that could be completed in the time frame allotted based on the timeline of the RSNA Machine Learning Challenge. The goal was to have 3000 cases for the test set. Any cases above that number were to be incorporated into the training set released for the RSNA Machine Learning Challenge. Each image in the final test set cases was annotated by three radiologists: two STR readers and one RSNA reader. For the RSNA Machine Learning Challenge, we used a training-to-test split of 90:10, resulting in 3000 cases for test.
Assumptions
Readers were given the following information prior to both the warm-up round and the main annotation task: (a) Lung opacity (bounding box) was considered to be an area more opaque than the surrounding area (Fleischner Society definition of opacity [5]) on a chest radiograph that, in a patient with cough and fever, has a low, medium, or high likelihood of being pneumonia. (b) In the absence of clinical information, lateral radiographs, and serial examinations, readers were required to make assumptions. (c) Readers were advised to exclude obvious masses, nodules, lobar collapse, and linear atelectasis.
Cases labeled “No Opacity/Not Normal” may have lung opacity, but no opacity suspicious for pneumonia.
Adjudication
A total of 4527 cases were annotated by three readers (two STR readers and one RSNA reader). In these cases, the final categorical label was the majority of three votes. There were 1455 cases that had a majority “Normal” label and 1200 that had a majority “No Opacity/Not Normal” label. A total of 1214 cases had intersecting bounding boxes. A bounding box in a multiread case was considered isolated if it did not overlap with the bounding boxes of either of the other two readers. That is, the two other readers did not flag that area of the image as being suspicious for pneumonia. Cases could have intersecting and isolated boxes on the same image, as well as a majority categorical label and isolated boxes.
Triple-read cases without a majority categorical label and cases with isolated bounding boxes (some examinations had both overlapping and isolated bounding boxes) were adjudicated by one of two STR readers with more than 10 years of experience (C.C.W., M.C.B.G.). Cases that contained annotations by one of the adjudicators would be assigned to the other adjudicator. The adjudicator saw the annotations of all three readers. A total of 1380 (30%) of the 4527 triple-read cases were individually adjudicated, so that an STR reader viewed the case and made the decision on whether to agree with the isolated bounding boxes or categorical labels.
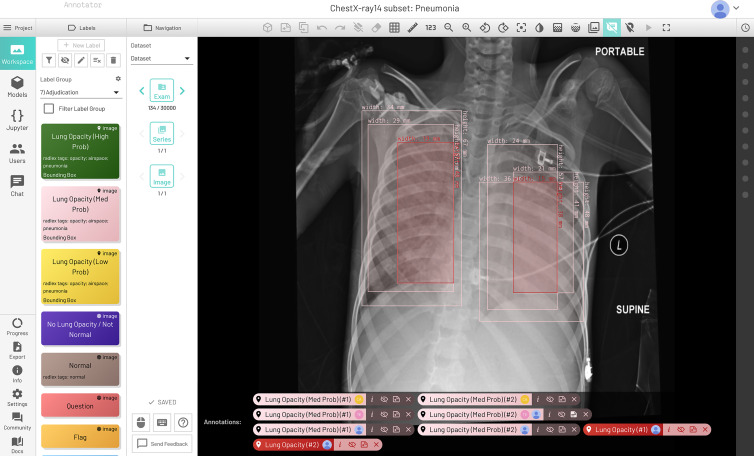
If the adjudicator agreed that the isolated box was valid, the box remained as a positive minority opinion. Otherwise, it was removed. For the remaining bounding boxes, the intersection was used if there was at least a 50% overlap by one of the boxes. Three thousand of the triple-read cases were used to create the test set, and the remainder were included in the training set. An additional 707 cases were read by one RSNA radiologist and one STR radiologist. These cases could not be triple read in time, so only the reading of the STR radiologist was used, and the RSNA reading was disregarded. Initially, the bounding boxes were given a confidence score (“high probability,” “medium probability,” and “low probability”) (Fig 2). For the adjudicated dataset, low confidence boxes were removed and high and medium were combined into one category of likely pneumonia. If the case only had a solitary low probability bounding box, the box was removed and the case was labeled “No Opacity/Not Normal.”
Figure 2:
Final dataset with low, medium, and high probability pneumonia-like findings with adjudication. Medium probability bilateral opacities were annotated by the three radiologists (in pink), and final adjudicated bilateral opacities are in red.
Resulting Datasets
This radiologist recruiting effort took approximately 6 months and included 18 radiologists from 16 different institutions, including 12 chest radiologists from the STR. To our knowledge, no such effort has been attempted on such a large scale in radiology with expert radiologists from so many institutions and may provide a new framework for creating machine learning datasets in medicine. This dataset is available in two versions, the original unadjudicated and the adjudicated version. The original unadjudicated version, of which approximately 4500 cases contain categorical labels from three radiologists, and the bounding boxes were given a confidence score of “high probability,” “medium probability,” and “low probability.” The adjudicated version of the dataset consisted of only a single bounding box category of likely pneumonia (combined “medium probability” and “high probability”). The final dataset had 17 006 male patients, 12 888 female patients, 1639 minors, 28 255 adults, 16 225 posteroanterior views, and 13 669 anteroposterior views. There were 12 274 unique patients (6747 male and 5527 female patients) in the 30 000 examination dataset, so several patients had several different examinations, with 75 radiographs being the most for a patient. There were 106 cases of the 30 000 examinations that were excluded from annotations because the image was either an abdominal radiograph, a lateral chest radiograph, or too much of the chest was excluded from view for accurate assessment. A mapping of the 30 000 examination dataset unique identifiers to the original NIH dataset is provided later in this article.
The adjudicated version of the dataset was used for the RSNA Pneumonia Detection Machine Learning Challenge hosted on Kaggle, the popular data science competition website (https://www.kaggle.com/c/rsna-pneumonia-detection-challenge). Both datasets can be found at the following address: https://rsna.org/challenge-datasets/2018.
Limitations and Future Work
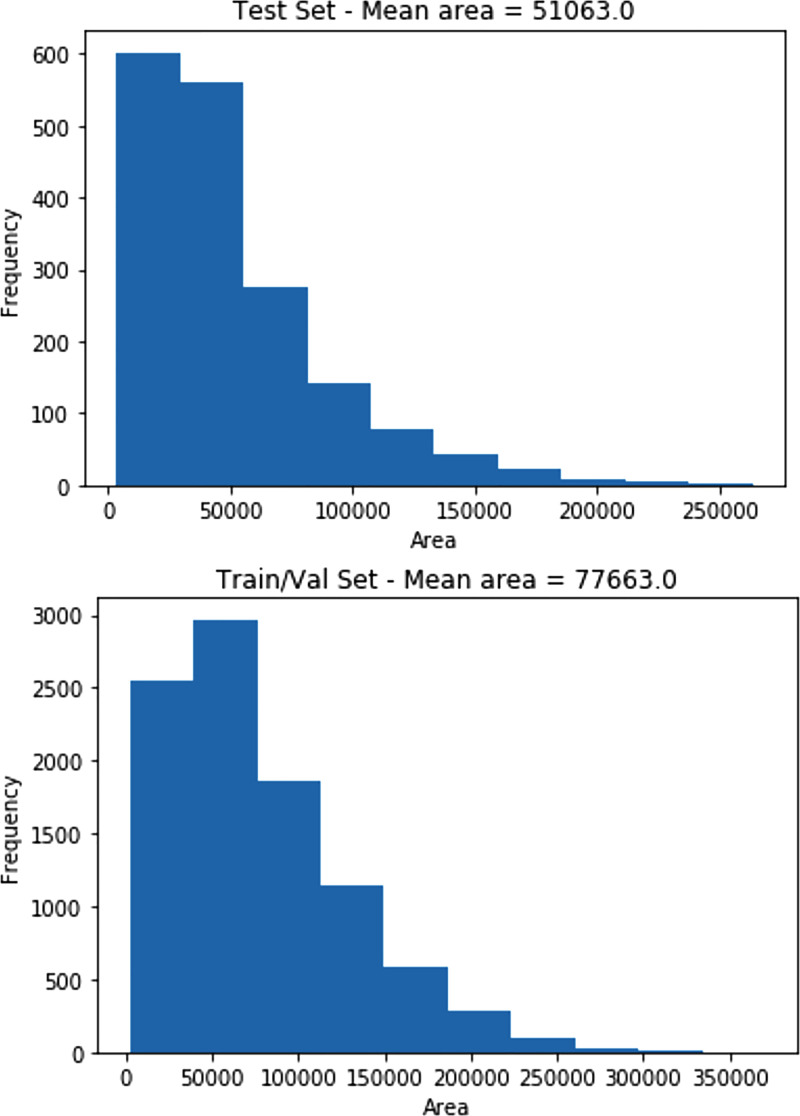
Creating a large annotated dataset for use by medical imaging algorithms involves many physicians, who donated their time and expertise. As a result, one limitation was that only 4527 cases of 30 000 were read by three different radiologists, instead of the entire dataset, and therefore, a limited number of examinations from the entire set of 30 000 possible images were adjudicated. In the future, we hope that better coordination with the numerous academic radiology societies will provide more volunteers for such efforts. Another limitation was that the authors did not annotate any specific pathologic finding other than pneumonia because of time constraints. For example, annotating findings that may mimic pneumonia may have been useful for algorithm development. A limitation of the final dataset creation was in the use of bounding box intersections rather than a weighted average or other system for calculating the combined box coordinates. This made the final test set bounding boxes smaller than those of the training set (average area for test set = 51 063 pixels, average area for training set = 77 663 pixels). Histogram distributions of bounding box size for each dataset are shown in Figure 3. By releasing the original set of annotations, users of the data can create their own bounding box rules. Future work will be to demonstrate whether providing these more localized annotated datasets with different probabilities of diseases will in fact allow for better (more informative) or more accurate machine learning algorithms. The authors hope to undertake the effort to analyze the top 10 algorithms from the recently completed Kaggle competition and compare those results with pneumonia algorithms (eg, ChexNet [6]) that did not use this annotated dataset for training.
Figure 3:
Histograms of area in pixels of final bounding boxes in the test set and the training and validation set.
Current address: Department of Radiology, University of Arizona, Tucson, Ariz
Disclosures of Conflicts of Interest: G.S. Activities related to the present article: MD.ai board member, consultant, and shareholder. Activities not related to the present article: MD.ai board member, consultant, and shareholder. Other relationships: disclosed no relevant relationships. C.C.W. disclosed no relevant relationships. S.S.H. disclosed no relevant relationships. M.D.K. Activities related to the present article: disclosed no relevant relationships. Activities not related to the present article: travel reimbursement for board meetings from SIIM; income and travel support from Medical Sciences Corporation for work on x-ray truck in Kenya and work on datasets for machine learning in Kenya; ACR Innovation grant for LI-RADS, CAR/DS, and CDE work; Gilead, Fuji Medical Systems (UCSF CME) paid for lecture on machine learning at Gilead headquarters to Gilead employees, nothing related to Gilead products; gave lecture on machine learning to SIIM 2017 attendees at Fiji reception; presenter at UCSF Palm Springs CME course. Other relationships: disclosed no relevant relationships. L.M.P. disclosed no relevant relationships. T.S.C. Activities related to the present article: disclosed no relevant relationships. Activities not related to the present article: travel expenses to board meetings and retreats covered by RSNA and SIIM; grant from Beryl Institute and ACRIN; receives royalties from Osler Institute for lectures originally give in 2012-2013. Other relationships: serves on committees and boards for multiple radiology and medical societies, including AUR, RSNA, SIIM, ACR, PRS, PRRS, SPIE, and AMIA and is not paid for this work. A. Sharma Activities related to the present article: disclosed no relevant relationships. Activities not related to the present article: consultant for IBM developing their Watson Health Service. Other relationships: disclosed no relevant relationships. J.K.A. disclosed no relevant relationships. V.A. disclosed no relevant relationships. M. G. disclosed no relevant relationships. R.R.G. disclosed no relevant relationships. M.C.B.G. disclosed no relevant relationships. S.H. Activities related to the present article: disclosed no relevant relationships. Activities not related to the present article: received payment from Potomac Center for Medical Education and Academy for Continued Healthcare Learning for preparation and delivery of CME lectures; book royalties from Wolters Kluwer Health and Elsevier. Other relationships: disclosed no relevant relationships. J.J. disclosed no relevant relationships. A.L. disclosed no relevant relationships. P.N.S. disclosed no relevant relationships. D.V. Activities related to the present article: disclosed no relevant relationships. Activities not related to the present article: consultant for Boehringer Ingelheim; travel paid by Boehringer Ingelheim for Open Source Imaging Consortium in interstitial lung disease meetings. Other relationships: disclosed no relevant relationships. K.Y. Activities related to the present article: disclosed no relevant relationships. Activities not related to the present article: received payment for lecture (speakers bureau) from Boerhinger Ingelheim. Other relationships: disclosed no relevant relationships. A. Stein Activities related to the present article: employed by MD.ai, which provided the annotation tool for the project; patent issued for MD.ai. Activities not related to the present article: disclosed no relevant relationships. Other relationships: disclosed no relevant relationships.
Abbreviations:
- NIH
- National Institutes of Health
- RSNA
- Radiological Society of North America
- STR
- Society of Thoracic Radiology
References
- 1.Rui P, Kang K. National Ambulatory Medical Care Survey: 2015 emergency department summary tables. Table 27. https://www.cdc.gov/nchs/data/nhamcs/web_tables/2015_ed_web_tables.pdf. Accessed October 1, 2018.
- 2.Deaths: Final data for 2015 . Supplemental tables. Tables I-21, I-22. https://www.cdc.gov/nchs/data/nvsr/nvsr66/nvsr66_06_tables.pdf. Accessed October 1, 2018.
- 3.Wang X, Peng Y, Lu L, Lu Z, Bagheri M, Summers RM. ChestX-ray8: Hospital-scale chest x-ray database and benchmarks on weakly-supervised classification and localization of common thorax diseases. IEEE CVPR 2017. http://openaccess.thecvf.com/content_cvpr_2017/papers/Wang_ChestX-ray8_Hospital-Scale_Chest_CVPR_2017_paper.pdf. (Images: https://nihcc.app.box.com/v/ChestXray-NIHCC). Accessed December 1, 2018. [Google Scholar]
- 4.Everingham M, Van Gool L, Williams CKI, Winn J, Zisserman A. The PASCAL Visual Object Classes (VOC) Challenge. Int J Comput Vis 2010;88(2):303–338. [Google Scholar]
- 5.Hansell DM, Bankier AA, MacMahon H, McLoud TC, Müller NL, Remy J. Fleischner Society: glossary of terms for thoracic imaging. Radiology 2008;246(3):697–722. [DOI] [PubMed] [Google Scholar]
- 6.Rajpurkar P, Irvin J, Ball RL, et al. Deep learning for chest radiograph diagnosis: a retrospective comparison of the CheXNeXt algorithm to practicing radiologists. PLoS Med 2018;15(11):e1002686. [DOI] [PMC free article] [PubMed] [Google Scholar]


