

Abstract
Purpose
To determine if weakly supervised learning with surrogate metrics and active transfer learning can hasten clinical deployment of deep learning models.
Materials and Methods
By leveraging Liver Tumor Segmentation (LiTS) challenge 2017 public data (n = 131 studies), natural language processing of reports, and an active learning method, a model was trained to segment livers on 239 retrospectively collected portal venous phase abdominal CT studies obtained between January 1, 2014, and December 31, 2016. Absolute volume differences between predicted and originally reported liver volumes were used to guide active learning and assess accuracy. Overall survival based on liver volumes predicted by this model (n = 34 patients) versus radiology reports and Model for End-Stage Liver Disease with sodium (MELD-Na) scores was assessed. Differences in absolute liver volume were compared by using the paired Student t test, Bland-Altman analysis, and intraclass correlation; survival analysis was performed with the Kaplan-Meier method and a Mantel-Cox test.
Results
Data from patients with poor liver volume prediction (n = 10) with a model trained only with publicly available data were incorporated into an active learning method that trained a new model (LiTS data plus over- and underestimated active learning cases [LiTS-OU]) that performed significantly better on a held-out institutional test set (absolute volume difference of 231 vs 176 mL, P = .0005). In overall survival analysis, predicted liver volumes using the best active learning–trained model (LiTS-OU) were at least comparable with liver volumes extracted from radiology reports and MELD-Na scores in predicting survival.
Conclusion
Active transfer learning using surrogate metrics facilitated deployment of deep learning models for clinically meaningful liver segmentation at a major liver transplant center.
© RSNA, 2019
Summary
Surrogate metrics and active transfer learning can facilitate the deployment and validation of deep learning–based segmentation methods on clinical datasets.
Key Points
■ By leveraging Liver Tumor Segmentation challenge 2017 public data, natural language processing of radiology reports, and an active learning method, a model was trained to segment livers on 239 retrospective portal venous phase abdominal CT studies in 187 patients.
■ Two newly created active learning datasets (Liver Tumor Segmentation plus overestimated cases and Liver Tumor Segmentation plus both over- and underestimated cases) performed significantly better on a held-out institutional test set than did the Liver Tumor Segmentation–only trained model.
■ Predicted liver volumes using the best active learning–trained model (Liver Tumor Segmentation plus both over- and underestimated cases) were at least comparable with liver volumes extracted from radiology reports and Model for End-Stage Liver Disease with sodium scores in predicting survival.
Introduction
Liver segmentation has an important role in clinical radiology by aiding presurgical planning in transplant and hepatectomy candidates, by guiding dosing for radioembolization of liver tumors, and by tracking liver volume in an array of hepatic diseases (1–3). Obtaining liver volumes can be time-intensive, as segmentation typically requires loading studies into third-party software followed by nontrivial user interaction (4). To encourage the development of computational tools to assist with routine liver volumetry and tumor segmentation, there have been two major competitions (Liver Tumor Segmentation [LiTS] challenge; and Segmentation of the Liver 2007, or SLIVER) to investigate the ability of machine learning models to automatically segment livers, as well as tumor lesions in LiTS (5,6). In both cases, standard metrics such as the Jaccard score or Sørensen–Dice (hereafter, Dice) score were used to assess the ability of algorithms to segment livers compared with that of the reference standard of segmentation by trained radiologists.
Recent successes at abdominal organ and liver segmentation have relied on deep learning techniques (7,8). Most notable of these is the convolutional neural network (CNN), which uses a framework analogous to human vision to automatically learn features associated with a given output (7). In the case of segmentation, this output is a segmentation mask, and CNN algorithms have achieved remarkable results measured by Dice score at several recent competitions (9,10). CNNs, however, are exquisitely sensitive to input data, and without appropriate control, are even capable of fitting highly accurate models to random noise (11). Most deep learning studies with radiologic images do not validate on external datasets. How well CNNs generalize to external data remains an open question, with some initial results suggesting active transfer learning techniques are required to ensure they do (12,13). The need for expert segmentations across both the internal training set and the external dataset further complicates this task.
We investigated the use of liver volumes included in clinical radiology reports, assessed with the aid of commercial software at initial interpretation, as a surrogate for Dice score to evaluate liver segmentation quality. By using this scalable surrogate, we tested the adaptability of a CNN trained on the LiTS dataset to imaging from our institution with an active learning approach (13,14). By segmenting a small subset of institutional data to include in CNN training, we hypothesized predictions would improve globally for institutional imaging. We concluded by using the adapted CNN for segmentation in a series of patients from our institution and correlated the automated, serial liver volume measurements with Model for End-Stage Liver Disease (MELD) score and outcomes to demonstrate potential for clinical translation.
Materials and Methods
Imaging Studies
LiTS challenge.—The LiTS dataset is composed of 131 CT studies with manual liver and tumor segmentations in patients with known liver lesions composed of either metastatic disease or primary hepatocellular carcinoma. Data were collected from six different institutions with heterogeneous acquisition parameters and liver segmentation techniques. A more detailed selection criteria is discussed in Appendix E1 (supplement).
Institutional data from Mount Sinai Health System.—All relevant ethical regulations were followed as part of image collection for this cross-sectional study at a high-volume liver transplantation center. This study was part of an institutional review board–approved computer vision initiative within the radiology department and part of our institution’s AI Consortium. The institutional review board granted a consent waiver for retrospective imaging data. This study is Health Insurance Portability and Accountability Act compliant. Study accession identifiers and reports were gathered with a retrospective query of the Mount Sinai Health System (MSHS) picture archiving and communication system (PACS) by using software (Montage; Nuance Communications, New York, NY). Inclusion criteria included abdominal CT studies from January 1, 2014, to December 31, 2016, containing the keyword “liver volume.” Exclusion criteria constituted studies without total liver volume measurements. Demographic and clinical data including age, sex, indication for imaging, prior surgeries or cancer treatment, comorbidities, laboratory values, and date of death or transplantation were obtained by a retrospective electronic medical record (Epic, Verona, Wis) review in patients with multiple imaging studies for the purpose of assessing correlation between predicted liver volume and clinical outcomes.
Routine Liver Segmentation Methods
Liver volumetry plays a critical role in presurgical planning, for instance, for determining future liver remnant volume before major hepatectomy or portal vein embolization, for associating liver partition and portal vein ligation for staged hepatectomy procedure, and for living transplantation donors (15). It is also relied on for dosing in radioembolization of liver tumors (16). Liver volumes from the MSHS were calculated by using third-party segmentation software (Vitrea Advanced Visualizations; Vital Images, Minnetonka, Minn) that allows radiologists to delineate liver surface boundaries on evenly spaced key axial images. Automatic interpolation between axial images generates a refinable preliminary volume. However, these segmentations are not stored in PACS and were therefore not available for active learning. Liver segmentation in active learning patients (n = 10) was performed as part of this study by using 3D Slicer (https://www.slicer.org/) and its GrowCut feature (17). On various evenly spaced key axial and sagittal images, on- and off-target regions were manually labeled before initiation of the GrowCut algorithm. Resulting preliminary volumes were smoothed by using a Gaussian filter (Fig E1 [supplement]).
Natural Language Processing, Preprocessing, and Computer Vision Pipelines
Natural language processing (NLP)–based liver volume extraction was performed with Python programming language (https://www.python.org/). Exported radiology reports were manually reviewed to identify how liver volume measurements were described. A collection of regular expressions was designed and iteratively refined to automatically extract liver volume measurements from reports. This yielded volumes for 270 of 283 reports, a selection of which was randomly reviewed to confirm the correct term was extracted representing total liver volume. The remaining 13 reports were reviewed and determined to lack volume measurements. These volumes were found subsequently by matching unique study identifiers to their corresponding imaging studies. Of the 270 imaging studies with NLP-extracted liver volumes, portal venous phase CT series were successfully extracted from 249 (92%). Images from our MSHS PACS and the LiTS dataset (n = 131) were then preprocessed using a standard pipeline (see Appendix E1 [supplement] for details) yielding 128 × 128 × 128 image arrays per patient. A well-described 3D U-Net (8) with four resolution steps and skip connections at identical resolution layers was used for each training with an 80/20 training/validation split.
Active Learning Set Creation
For the active transfer learning approach, a two-step training process was used. First, our 3D U-Net model was trained using images and segmentations available in the LiTS dataset and then was used for inference on the MSHS dataset. Model-predicted liver volumes were compared with NLP-extracted liver volumes from radiologist reports (Fig 1). Five patients with the greatest positive and negative differences between predicted and measured liver volumes were selected. These groups demonstrated discrepancy relative to the mean cohort volume difference between predicted and measured volumes of 4025 mL/45 mL (8944%) and −1190 mL/45mL (2644%), respectively, which suggests critical feature differences exist between MSHS and LiTS populations not accounted for in the LiTS-only trained CNN. These 10 CT studies were annotated by using the semiautomated GrowCut method from Slicer 3D (18) and replicated six times to enable creation of active learning sets. Next, active learning sets were combined with the original LiTS dataset to create three new additional training sets (Fig 2). Six identical copies of each active learning image were made to sufficiently weight our model toward accommodating these outliers sufficiently relative to remaining LiTS data. Three new active datasets were as follows: LiTS plus overestimated active learning cases trained (LiTS-O), LiTS plus underestimated active learning cases trained (LiTS-U), and LiTS plus both over- and underestimated active learning cases trained (LiTS-OU). These new active learning training sets were then used to create new weights for our 3D U-Net model. Studies used for active learning were removed from the test set. Only seven studies from patients with a study used for active learning remained. By using differences between predicted and liver volumes from radiology reports as a surrogate metric, we were able to easily select outlier cases for active learning. This iterative active learning approach has led to improved results with increased data efficiency in several computer vision trials (19–21).
Figure 1:

Predicted liver volumes without active learning in a Liver Tumor Segmentation (LiTS)–only trained three-dimensional model. Representative (first and third columns) axial and (second and fourth columns) coronal images for standard liver volumetry and LiTS-only trained prediction model where liver volumes are concordant, overestimated, and underestimated.
Figure 2:

Training models using active learning. Four liver segmentation models were trained using a 3D U-Net convolutional neural network. After training with, A, only Liver Tumor Segmentation (LiTS) CT data, Mount Sinai Health System (MSHS) test cases that overestimated or underestimated liver volume compared with standard volumetry measurements were then segmented manually and added to the LiTS dataset to produce three new active learning training datasets with the following inclusions: B, six copies of five overestimated cases, C, six copies of five underestimated cases, and, D, six copies of both sets of five over- and underestimated cases. All data were sorted randomly before training, then tested on an MSHS hold-out dataset excluding cases used for active learning. LiTS-O = LiTS plus overestimated active learning cases trained, LiTS-OU = LiTS plus over- and underestimated active learning cases trained, LiTS-U = LiTS plus underestimated active learning cases trained.
Clinical Applicability of Active Learning for Liver Volume Prediction
To investigate clinical applicability of our active learning–based model for liver volume prediction, average liver volumes normalized to ideal body weight (calculated by using the Devine formula [22]) from the best performing active learning model, LiTS-OU, and NLP-extracted liver volumes were calculated along with the MELD with sodium (MELD-Na) scores. Inclusion criteria included patients with more than one imaging study from the MSHS dataset. Patients were excluded if they had a history of hepatectomy or living donor transplant or if they had local-regional interventions after the initial scan. Major events were defined as time to death or transplantation. Date of last available clinic note in the absence of a major event was used for censorship.
Statistical Analysis
Statistical analysis was performed with Prism 7 software (GraphPad Software, La Jolla, Calif). Differences in absolute liver volume between active learning prediction models and those extracted from radiology reports were compared with the paired Student t test, intraclass correlation, and Bland-Altman analysis. Differences in Dice score distributions were assessed by using the Student t test. Model comparison was assessed by using two-way analysis of variance tests. Survival analysis was performed by using the Kaplan-Meier method and a Mantel-Cox test for significance. A P value less than .05 indicated a statistically significant difference.
Results
Imaging Studies
After retrospective collection, the MSHS test dataset contained 239 studies from 187 patients after removing images that were used as active learning training sets. Within the MSHS test set, the average age was 59.3 years (age range, 30–82 years) and 94 studies (39%) were in women. Indications for imaging included 143 (60%) cases of cirrhosis, 135 (57%) pretransplant evaluations, 79 (33%) hepatocellular carcinomas, eight (3.4%) hepatobiliary surgery evaluations, and 16 (6.7%) living liver donor evaluations (Table 1).
Table 1:
Demographic Data of Mount Sinai Health System Abdominal CT Studies with Known Standard Liver Volumetry Values
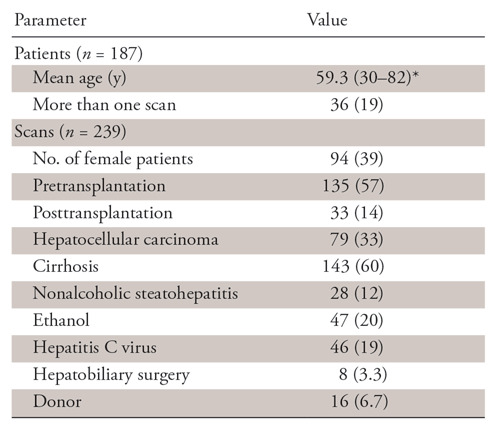
Note.—Unless otherwise indicated, data are numbers, with percentages in parentheses. Using commercial software (Montage) and natural language processing methods, standard liver volumetry values were extracted from 249 study reports among 187 patients, then used as a surrogate marker for a Dice score to guide active learning set creation for model training. Patient diagnoses are representative of a high-volume liver transplant center.
*Data are means, with ranges in parentheses.
Active Learning Improves Performance
Liver volumes for overestimated and underestimated outliers that were used for active learning training had average differences with NLP-extracted volumes of 1983 mL ± 797 and −508 mL ± 76, respectively, with representative cases shown in Figure 2. After training with added active learning sets, Dice scores on the LiTS validation dataset decreased from 0.903 for LiTS-only to 0.866 for LiTS-U, 0.841 for LiTS-O, and 0.812 for LiTS-OU (Table 2) (P < .0001), which reflects the shift in CT variation away from the LiTS dataset alone.
Table 2:
Summary Statistics of Trained Liver Volume Prediction Models
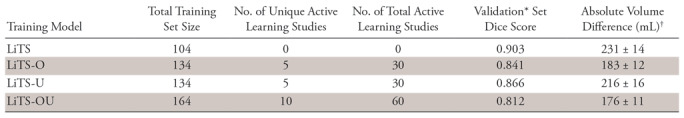
Note.—Summary of Dice scores for four training models in over- and underestimated cases used for active learning and in a subset of LiTS data that was used for tuning during model training. Summary of absolute liver volume differences across training models between predicted and standard liver volumetry values in the Mount Sinai Health System test set, with interquartile range and percentage of successful segmentations defined as predictions where absolute percentage of liver volume difference is less than 10%. LiTS = Liver Tumor Segmentation challenge data; LiTS-O = LiTS plus overestimated active learning cases trained; LiTS-U = LiTS plus underestimated active learning cases trained; LiTS-OU = LiTS plus over- and underestimated active learning cases trained.
*Validation performed exclusively on LiTS data.
†Data are means ± standard error.
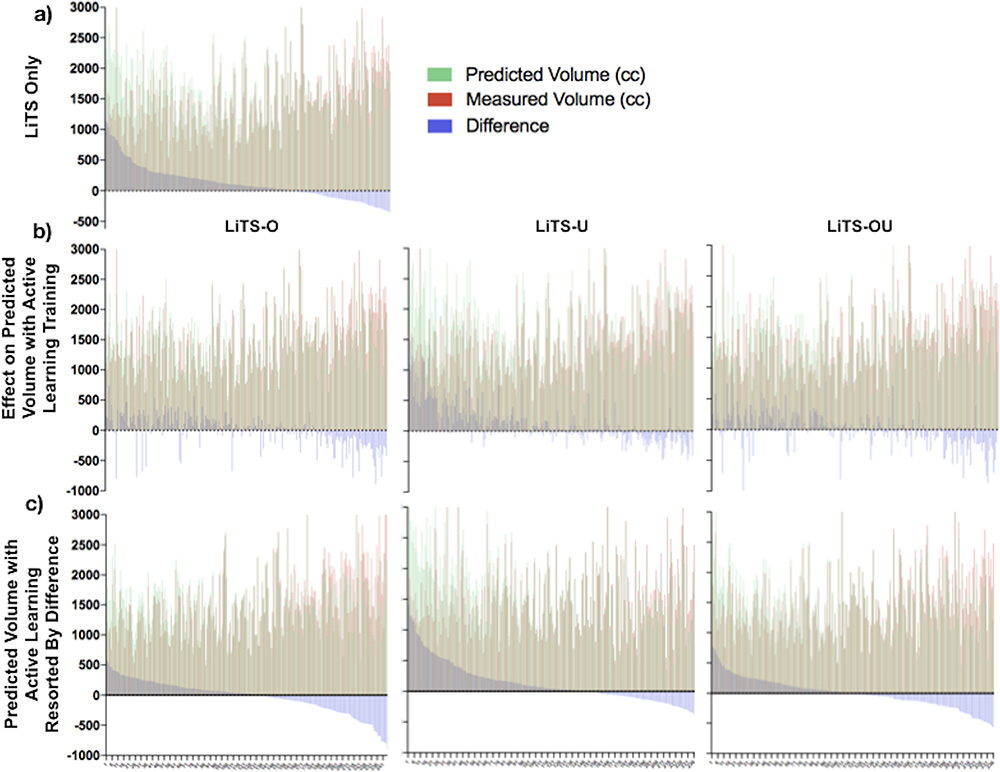
By contrast, in the MSHS hold-out test set (n = 239) using our surrogate performance metric (absolute volume difference between NLP-extracted and model-predicted liver volumes), there was a significant difference between the LiTS-only trained model (231 mL ± 14) and LiTS-O (183 mL ± 12, P = .0018) and LiTS-OU (176 mL ± 11, P = .0005) and a trend toward improvement for LiTS-U (216 mL ± 16) (Fig 3). Improved performance of active learning compared with the LiTS-only model was also demonstrated with intraclass correlation analysis with coefficients of 0.87 (95% confidence interval [CI]: 0.82, 0.90), 0.83 (95% CI: 0.78, 0.86), and 0.88 (95% CI: 0.82, 0.92) for LiTS-O, LiTS-U, and LiTS-OU, respectively. Visualized Bland-Altman plots (Fig 4) of percentage volume difference between NLP-extracted and model-predicted volumes demonstrated fewer overall overestimated cases for the active learning trained models, in particular for LiTS-O and LiTS-OU models.
Figure 3:

Liver volume prediction using active learning training models. Graph shows absolute difference (95% confidence interval [CI]) in liver volume prediction relative to standard volumetry in a 239 portal venous abdominal CT image test set. Liver Tumor Segmentation (LiTS)–only trained (131 labeled portal venous abdominal CT images) model achieved a mean 231 mL (95% CI: 202, 260) absolute volume difference. Top five overestimated and underestimated cases were then selected, annotated, and used as LiTS plus overestimated active learning cases trained (LiTS-O) and LiTS plus underestimated active learning cases trained (LiTS-U) active learning sets, respectively. Both sets of five over- and underestimated cases were used for the LiTS plus over- and underestimated active learning cases trained (LiTS-OU) dataset. LiTS-O, LiTS-U, and LiTS-OU demonstrated improved absolute volume differences of 183 mL (95% CI: 160, 206), 216 mL (95% CI: 186, 247), and 176 mL (95% CI: 154,198), respectively. There was a significant improvement between LiTS and the LiTS-O (P = .0018) and LiTS-OU (P = .0005) models. cc = milliliters.
Figure 4:

Bland-Altman plots across active learning training models. Bland-Altman analysis was calculated across all training models on the Mount Sinai Health System test set (n = 239) and excluded any training images. For, A, Liver Tumor Segmentation (LiTS), B, LiTS plus overestimated active learning cases trained (LiTS-O), C, LiTS plus underestimated active learning cases trained (LiTS-U), and, D, LiTS plus over- and underestimated active learning cases trained (LiTS-OU) datasets, intraclass correlation was 0.81 (95% confidence interval [CI]: 0.74, 0.86), 0.87 (95% CI: 0.82, 0.90), 0.83 (95% CI: 0.78, 0.86), and 0.88 (95% CI: 0.82, 0.92), respectively. cc = milliliters.
NLP-derived Liver Volumes as Surrogate Metric to Guide Active Learning
Use of NLP-extracted volumes to provide a surrogate metric for guiding our active learning method relies on its ability to recapitulate the Dice loss function value that compares predicted and ground-truth segmentations during training. When examining predicted absolute volume difference values and Dice values across all models in segmented outlier patients (n = 10), there was a clear inverse correlation with average absolute volume differences of 1185 mL, 1059 mL, 292 mL, and 211 mL (F = 6.98, P = .023) and Dice values of 0.61, 0.70, 0.78, and 0.85 (F = 8.54, P = .006) for LiTS-only, LiTS-U, LiTS-O, and LiTS-OU models, respectively (Fig 5a). Pearson correlation of absolute volume difference and Dice values across all models in segmented outlier patients (n = 40) was strong (R2 = 0.67, P < .0001) (Fig 5b).
Figure 5:

Dice score as surrogate for absolute volume difference (in milliliters) to train 3D U-Net liver volume prediction models. A, Graph shows training active learning sets as a test set to illustrate relationship between Dice score and absolute liver volume difference (n = 10) across training models. Dice scores consistently increased (0.61, 0.70, 0.78, and 0.85 [F = 8.54, P = .006]) and absolute liver volume difference decreased (1185 mL, 1059 mL, 292 mL and 211 mL [F = 6.98, P = .023]) in Liver Tumor Segmentation (LiTS), LiTS plus underestimated active learning cases trained (LiTS-U), LiTS plus overestimated active learning cases trained (LiTS-O), and LiTS plus over- and underestimated active learning cases trained (LiTS-OU) models, respectively. B, Graph shows significant inverse correlation between Dice score and absolute liver volume difference across patients and models (R2 = 0.67, P < .0001). AL = active learning, cc = milliliters.
Automated Liver Volume Assessments Predict Clinical Outcomes
Thirty-four (18%) patients from the MSHS dataset had undergone serial imaging and met inclusion criteria for survival analysis (Fig E2 [supplement]). Average liver volumes for each patient was calculated over an average of 11.6 months (range, 1.8–31.5 months) including a mean of 2.5 scans (two to five scans) per patient. Included among these diagnoses were hepatocellular carcinoma in eight (24%), cirrhosis in 24 (71%), and nonalcoholic steatohepatitis in five (15%) patients. The median liver volume was 1584 mL (range, 591–3194 mL). Patients were stratified according to being over or under the median liver volume per ideal body weight, calculated with the Devine formula, for predicted and manual segmentations, and also according to MELD-Na score for survival analysis. For patients with an average predicted liver volume per ideal body weight below the median, there was a significantly elevated event occurrence rate (odds ratio = 4.15; 95% CI: 1.1, 15.7; P = .036) (Fig 6). Notably, average MELD score across this time was not associated with a difference in event occurrence (odds ratio = 1.27; 95% CI: 0.34, 4.70; P = .724). There was a higher event occurrence in patients with average manual liver volume per ideal body weight below the median, but this did not rise to the level of statistical significance (odds ratio = 2.96; 95% CI: 0.80, 11.0; P = .104).
Figure 6:

Ability of active learning–trained 3D U-Net liver volumetry to predict mortality or transplantation compared with standard liver volumetry and Model for End-Stage Liver Disease with sodium (MELD-Na). Split median Mantel-Cox time to death or transplant analysis was performed for predicted average liver volume per ideal body weight, standard volumetry average liver volumes per ideal body weight, and average MELD-Na score in patients where liver volumetry was performed on two or more scans between January 1, 2014, and December 31, 2016. Patients with any history of partial hepatectomy or living donor transplant and those with local-regional intervention after the initial scan were excluded. A, Average predicted liver volume using the Liver Tumor Segmentation plus over- and underestimated active learning cases (LiTS-OU) model per ideal body weight above versus below a median value of 23.9 mL/kg was significantly different (P = .036, χ2= 4.39). B, Radiologist report–extracted average liver volumes per ideal body weight above and below a median value of 20.7 mL/kg was not significantly different (P = .104, χ2 = 2.64). C, Average MELD-Na score above and below median value of 8.7 was not significantly different (P = .72, χ2 = 0.125).
Discussion
We found that NLP-extracted liver volumes from the radiology report could be used to create a surrogate metric for assessing segmentation performance instead of Dice scores. These volumes, measured by using a heuristic technique as part of the standard practice of care for patients with hepatic disease undergoing abdominal imaging at our institution, provided a scalable alternative to measuring Dice score from manual segmentations. By using this surrogate loss, we were able to identify institutional images with poorly predicted liver volumes that could be used for model training with an active learning method. This demonstrated significantly improved performance of our model, and in serial volume measurements using this model, we were able to show how liver volumes predicted by our model were comparable with radiologist-reported volumes in showing an association between decreased liver volumes and diminished overall survival. We selected those with multiple studies, as repeated segmentation is particularly tedious, yet also the most valuable for these patients, and represent a best use case group. Indeed, liver volumes are a known prognostic indicator and are crucial for surveillance of patients awaiting liver transplant (1,2,23). Our development of an automated method of assessing liver volume is a step toward making liver volume a standard metric for abdominal imaging. Just as hepatomegaly is a routine part of the physical examination, automated liver volumetry could be a standard parameter that is calculated in patients and used for surveillance and screening purposes. Even after a model has been trained, testing CNN segmentation by measuring Dice score or Jaccard metric requires further expert segmentations that can take up to 5–10 minutes, which makes the present system valuable for the purposes of routine quality control (23). By demonstrating the feasibility of assessing segmentation quality by using volume alone, we showed that developing machine learning approaches for clinical applications can become less resource intensive.
To improve on our results, which are dependent on training on a publicly available dataset, LiTS, by testing on images from our local institution, we implemented an active learning–based scheme whereby we selected edge cases, manually segmented them, and included them in our training set. This strategy of including hard cases, often referred to as active learning, has been shown to improve data efficiency in nonmedical cases (21). Because of our inclusion of cases from our local institution into the training set, this inclusion of out-of-sample data also served as a form of transfer learning similar to Ghafoorian et al (14), although rather than fine-tuning on the new domain, we incorporated it directly into our training set. Our results showed significant gains in predictive accuracy and demonstrate how few active learning cases can lead to meaningful adaptation.
An interesting point of consideration becomes the susceptibility of such models in production to the concept of drift because of the initial training happening on a fixed set of segmentations while ongoing evaluation is performed with surrogate metrics. While the anatomic boundaries of the liver are relatively consistent across individual patients, changes in patient population over time can lead to a shift in the underlying distribution of liver features across populations with deep learning models being particularly susceptible to differences in populations (24). To properly handle this, it is our belief that such models will require serial retraining or fine-tuning on new fully segmented cases to reflect the current clinical population. The timing and necessity of this remain open and are interesting avenues for further research.
There were several limitations worth mentioning. Our ground-truth assessment for segmentation of MSHS data was routinely recorded liver volumes extracted by simple NLP from radiology reports. As is common at most institutions, raw segmentation labels were not stored and would have served as ideal reference standards for performance. These volumes were also obtained by a wide range of individuals, across a variety of pathologic conditions, and used volume averaging across several sections, all but guaranteeing a certain degree of deviation from the underlying liver volume. Ground-truth LiTS segmentations were similarly performed by a number of individuals and are only estimates of true liver volume. We note that one of the advantages of this, however, is that we were able to report real-world results of how well our research model translated into practice at our present institution—and did so in a way that we easily assessed by using the NLP-extracted volumes. We analyzed only the adaptability of a liver segmentation model trained on the LiTS dataset to our own local institution. It is possible that other institutions could have different acquisition protocols that require extensive adaptation of LiTS-trained models.
One of the most substantial barriers toward developing deep learning–based techniques for use in clinical practice is the need for manually segmented ground-truth data to assess how well techniques generalize to a given practice. Our experience developing an automated liver volumetry tool for use at our MSHS demonstrated that NLP-extracted liver volumes are a viable surrogate for out-of-sample Dice and allowed implementation of a simple active learning method that led to significantly improved liver volume prediction that could predict overall survival in a group of patients with advanced liver disease at a major tertiary care medical center.
APPENDIX
SUPPLEMENTAL FIGURES
Disclosures of Conflicts of Interest: B.M. disclosed no relevant relationships. M.K. disclosed no relevant relationships. M.M. disclosed no relevant relationships. J.R.Z. disclosed no relevant relationships. J.T. disclosed no relevant relationships. S.C. Activities related to the present article: disclosed no relevant relationships. Activities not related to the present article: consultant for Zimmer Biomet, Globus, and Corentec (medical device companies). Other relationships: disclosed no relevant relationships. A.B.C. disclosed no relevant relationships. E.K.O. Activities related to the present article: disclosed no relevant relationships. Activities not related to the present article: consultant for Whiteboard Coordinator and Predictivity AI; employed by Google; received grant from Intel. Other relationships: disclosed no relevant relationships.
Abbreviations:
- CI
- confidence interval
- CNN
- convolutional neural network
- LiTS
- Liver Tumor Segmentation
- LiTS-O
- LiTS plus overestimated active learning cases trained
- LiTS-OU
- LiTS plus over- and underestimated active learning cases trained
- LiTS-U
- LiTS plus underestimated active learning cases trained
- MELD
- Model for End-Stage Liver Disease
- MELD-Na
- Model for End-Stage Liver Disease with sodium
- MSHS
- Mount Sinai Health System
- NLP
- natural language processing
- PACS
- picture archiving and communication system
References
- 1.Tong C, Xu X, Liu C, Zhang T, Qu K. Assessment of liver volume variation to evaluate liver function. Front Med 2012;6(4):421–427. [DOI] [PubMed] [Google Scholar]
- 2.Urata K, Kawasaki S, Matsunami H, et al. Calculation of child and adult standard liver volume for liver transplantation. Hepatology 1995;21(5): 1317–1321. [PubMed] [Google Scholar]
- 3.Lee CS, Jung YJ, Kim SS, et al. Liver volume-based prediction model stratifies risks for hepatocellular carcinoma in chronic hepatitis B patients on surveillance. PLoS One 2018;13(1):e0190261. [DOI] [PMC free article] [PubMed] [Google Scholar]
- 4.Gotra A, Chartrand G, Massicotte-Tisluck K, et al. Validation of a semiautomated liver segmentation method using CT for accurate volumetry. Acad Radiol 2015;22(9):1088–1098. [DOI] [PubMed] [Google Scholar]
- 5.Christ P, Ettlinger F, Lipkova J, Kaissis G. Liver Tumor Segmentation Challenge. https://competitions.codalab.org/competitions/17094. Published 2017. Accessed May 20, 2018.
- 6.Heimann T, van Ginneken B, Styner MA, et al. Comparison and evaluation of methods for liver segmentation from CT datasets. IEEE Trans Med Imaging 2009;28(8):1251–1265. [DOI] [PubMed] [Google Scholar]
- 7.Dou Q, Chen H, Jin Y, Yu L, Qin J, Heng PA. 3D deeply supervised network for automatic liver segmentation from CT volumes. arXiv:1607.00582 [cs.CV] [preprint] https://arxiv.org/abs/1607.00582. Posted July 3, 2016. Accessed April 2018. [DOI] [PubMed]
- 8.Çiçek Ö, Abdulkadir A, Lienkamp SS, Brox T, Ronneberger O. 3D U-Net: learning dense volumetric segmentation from sparse annotation. arXiv arXiv:1606.06650 [cs.CV] [preprint] https://arxiv.org/abs/1606.06650. Posted June 21, 2016. Accessed April 2018.
- 9.Kamnitsas K, Ledig C, Newcombe VFJ, et al. Efficient multi-scale 3D CNN with fully connected CRF for accurate brain lesion segmentation. Med Image Anal 2017;36:61–78. [DOI] [PubMed] [Google Scholar]
- 10.Ehteshami Bejnordi B, Veta M, Johannes van Diest P, et al. Diagnostic assessment of deep learning algorithms for detection of lymph node metastases in women with breast cancer. JAMA 2017;318(22):2199–2210. [DOI] [PMC free article] [PubMed] [Google Scholar]
- 11.Zhang C, Bengio S, Hardt M, Recht B, Vinyals O. Understanding deep learning requires rethinking generalization. arXiv:1611.03530 [cs.LG] [preprint] https://arxiv.org/abs/1611.03530. Posted November 10, 2016. Last revised February 26, 2017. Accessed April 2018.
- 12.Ghafoorian M, Teuwen J, Manniesing R, et al. Student beats the teacher: deep neural networks for lateral ventricles segmentation in brain MR. arXiv:1801.05040 [cs.CV] [preprint] https://arxiv.org/abs/1801.05040. Posted January 15, 2018. Last revised March 3, 2018. Accessed April 2018.
- 13.van Opbroek A, Ikram MA, Vernooij MW, de Bruijne M. A Transfer-Learning Approach to Image Segmentation Across Scanners by Maximizing Distribution Similarity. In: Wu G, Zhang D, Shen D, Yan P, Suzuki K, Wang F, eds. Machine Learning in Medical Imaging. MLMI 2013. Lecture Notes in Computer Science, vol 8184. Cham, Switzerland: Springer, 2013; 49–56. [Google Scholar]
- 14.Ghafoorian M, Mehrtash A, Kapur T, et al. Transfer learning for domain adaptation in MRI: application in brain lesion segmentation. arXiv:1702.07841 [cs.CV] [preprint] https://arxiv.org/abs/1702.07841. Posted February 25, 2017. Accessed April 2018.
- 15.Gotra A, Sivakumaran L, Chartrand G, et al. Liver segmentation: indications, techniques and future directions. Insights Imaging 2017;8(4):377–392. [DOI] [PMC free article] [PubMed] [Google Scholar]
- 16.Ertreo M, Choi H, Field D, et al. Comparison of cone-beam tomography and cross-sectional imaging for volumetric and dosimetric calculations in resin yttrium-90 radioembolization. Cardiovasc Intervent Radiol 2018;41(12):1857–1866. [DOI] [PubMed] [Google Scholar]
- 17.Vezhnevets V, Konouchine V. GrowCut: interactive multi-label ND image segmentation by cellular automata. in proc. of Graphicon 1, 150–156, Citeseer. http://citeseerx.ist.psu.edu/viewdoc/summary?doi=10.1.1.59.8092. Published 2005. Accessed April 2018.
- 18.Fedorov A, Beichel R, Kalpathy-Cramer J, et al. 3D Slicer as an image computing platform for the Quantitative Imaging Network. Magn Reson Imaging 2012;30(9):1323–1341. [DOI] [PMC free article] [PubMed] [Google Scholar]
- 19.Kapoor A, Horvitz E, Basu S. Selective supervision: guiding supervised learning with decision-theoretic active learning. in IJCAI-07, 877–882. aaai.org. http://www.aaai.org/Library/IJCAI/2007/ijcai07-141.php. Published 2007. Accessed April 2018.
- 20.Settles B. Active learning. Synthesis Lectures on Artificial Intelligence and Machine Learning 2012;6(1):1–114. [Google Scholar]
- 21.Collins B, Deng J, Li K, Fei-Fei L. Towards scalable dataset construction: an active learning approach. In: Forsyth D, Torr P, Zisserman A, eds. Computer vision – ECCV 2008. ECCV 2008. Lecture motes in computer science, vol 5302. Berlin, Germany: Springer, 2008. [Google Scholar]
- 22.Hagan MT, Sayuk GS, Lisker-Melman M, et al. Liver volume in the cirrhotic patient: does size matter? Dig Dis Sci 2014;59(4):886–891. [DOI] [PMC free article] [PubMed] [Google Scholar]
- 23.Nakayama Y, Li Q, Katsuragawa S, et al. Automated hepatic volumetry for living related liver transplantation at multisection CT. Radiology 2006;240(3):743–748. [DOI] [PubMed] [Google Scholar]
- 24.Zech JR, Badgeley MA, Liu M, Costa AB, Titano JJ, Oermann EK. Variable generalization performance of a deep learning model to detect pneumonia in chest radiographs: A cross-sectional study. PLoS Med 2018;15(11):e1002683. [DOI] [PMC free article] [PubMed] [Google Scholar]
Associated Data
This section collects any data citations, data availability statements, or supplementary materials included in this article.