Abstract
Purpose
To compare sensitivity in the detection of lung nodules between the deep learning (DL) model and radiologists using various patient population and scanning parameters and to assess whether the radiologists’ detection performance could be enhanced when using the DL model for assistance.
Materials and Methods
A total of 12 754 thin-section chest CT scans from January 2012 to June 2017 were retrospectively collected for DL model training, validation, and testing. Pulmonary nodules from these scans were categorized into four types: solid, subsolid, calcified, and pleural. The testing dataset was divided into three cohorts based on radiation dose, patient age, and CT manufacturer. Detection performance of the DL model was analyzed by using a free-response receiver operating characteristic curve. Sensitivities of the DL model and radiologists were compared by using exploratory data analysis. False-positive detection rates of the DL model were compared within each cohort. Detection performance of the same radiologist with and without the DL model were compared by using nodule-level sensitivity and patient-level localization receiver operating characteristic curves.
Results
The DL model showed elevated overall sensitivity compared with manual review of pulmonary nodules. No significant dependence regarding radiation dose, patient age range, or CT manufacturer was observed. The sensitivity of the junior radiologist was significantly dependent on patient age. When radiologists used the DL model for assistance, their performance improved and reading time was reduced.
Conclusion
DL shows promise to enhance the identification of pulmonary nodules and benefit nodule management.
© RSNA, 2019
Summary
A deep learning model showed improved overall sensitivity compared with manual identification of pulmonary nodules and was insensitive to radiation dose, patient age, or CT manufacturer; the model also enhanced manual review by increasing sensitivity and reducing reading time.
Key Points
■ Detection performance (both sensitivity and false-positive detection rate) of a deep learning (DL) model to depict pulmonary nodules did not depend on the radiation dose level, patient age, or device manufacturer, indicating that the DL model can be broadly applied under different imaging conditions with no restrictions.
■ As shown by a two-way tabulation test, performance of the less-experienced radiologist could be significantly dependent on patient age.
Introduction
Lung cancer continued to have the highest incidence and mortality rates worldwide in 2018 (1). Because of its aggressive and heterogeneous nature, detection and intervention at an early stage when the cancer manifests as pulmonary nodules are vital to improve the survival rate (2). Currently, low-dose CT is widely used in early stage lung cancer screening, as extensive studies have shown that the mortality rate can be significantly reduced (3–6).
Although detection of pulmonary nodules has been improved by using new-generation CT scanners, certain nodules may still be overlooked due to nodule appearance, image quality, or perception error by the radiologist, which could be caused by inappropriate reading conditions, fatigue, or distraction (7,8). In a frequently used dataset (a subset of the lung cancer screening program from 1996 to 1999 in Nagano, Japan [9]), the original manual misdetection rate was 76% (38 of 50 nodules were missed) (10). All missed nodules were later proven to be cancerous, and some were missed repeatedly for up to 3 years. Computer-aided detection systems have been developed to improve the nodule detection rate (10–13). However, on the basis of conventional image processing techniques, these systems typically require convoluted image processing steps and may not be robust across various data sources and nodule types.
The deep learning (DL) technique using convolutional neural networks (CNNs) takes advantage of the most recent development in artificial intelligence and has shown promise in assisting lung nodule detection and management (14–17). The DL model is fundamentally different from conventional computer-aided detection systems and can be easily optimized and readily applied to read a large amount of data. However, fully automated nodule detection with high sensitivity, which would be the precondition for reliable nodule management, remains a challenge.
In this study, we developed a fully automated DL model using DenseNet (18) as the backbone and a Faster R-CNN (19) model as the detector. The performance of the DL model was compared with that of the radiologists regarding various data attributes, including radiation dose, patient age, and CT manufacturer. Next, to assess whether manual review could be enhanced when using the DL model as a first-pass reader, radiologist detection accuracies with and without the DL model were compared while mimicking the real-world clinical reading environment.
Materials and Methods
Data Preparation and Categorization
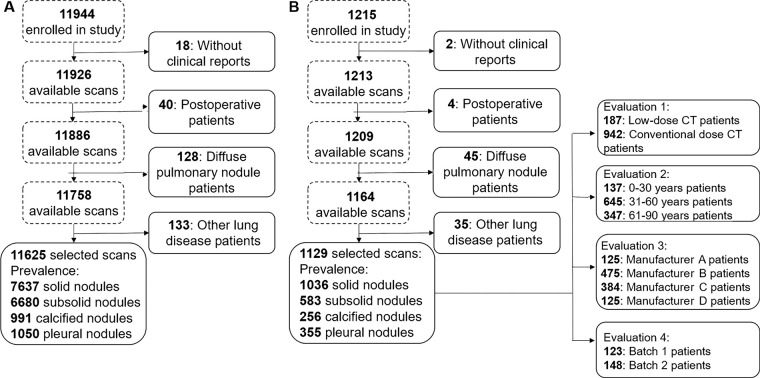
Infervision (Beijing, China) provided software and hardware support. Authors who were not affiliated with Infervision had control of data and information submitted for publication. Institutional review board approval from all hospitals was received, and written informed consent was waived since the study had minimal risk and would not adversely affect the subjects’ rights or welfare. A total of 13 159 thin-section chest CT scans from January 2012 to June 2017 from multiple hospitals in China were retrospectively collected with convenience sampling. The dataset comprised both screening and in-patient scans, and patient age (≥18 years) was the one eligibility criterion. Scans were excluded from the study if (a) not all lung lobes were fully visible in the field of view, (b) the image had motion artifacts, (c) the image did not comply with Digital Imaging and Communications in Medicine standards, or (d) the radiologists who were responsible for ground truth labeling were unable to annotate the images confidently. After the selection procedure shown in Figure 1, 12 754 scans were included in our study. A total of 11 625 scans (91.1%) from three top-tier hospitals were selected for model training and validation, and 1129 scans (8.9%) from more than 10 other hospitals were used for testing. The split ratio between training and validation scans was approximately nine to one, and the model was tuned based on the fixed validation set. For the training and validation dataset, 5777 scans (approximately 49.7%) were obtained in male subjects (mean age, 54 years ± 15 [standard deviation]), and 5848 (approximately 50.3%) were obtained in female subjects (mean age, 55 years ± 15). In the testing dataset, mean patient age was 57 years ± 20. All acquired axial images had a matrix size of 512 × 512, and section thickness ranged from 0.8 to 2.0 mm.
Figure 1:
Schematic shows preparation procedures for the, A, training-validation and, B, testing datasets. Qualified profiles were selected based on four steps: First, profiles with no clinical reports were excluded. Next, postoperative scans were excluded. Then, profiles indicating diffuse pulmonary nodules were excluded. Finally, patients with other lung diseases, such as pneumonia and tuberculosis, were excluded. The testing dataset was further divided into different cohorts based on the factors to be investigated.
To generate ground truth for the entire dataset, two radiologists (radiologists A and B), each with approximately 10 years of experience reviewing chest CT images, independently reviewed all 12 754 scans in the original radiology report. The studies were reviewed by using RadiAnt DICOM Viewer (version 4.2.0; Medixant, Poznan, Poland). Window level and window width were typically set at −600 and 1500 HU, respectively. To guarantee the best reading, the radiologists were able to make preferential adjustments based on scan-specific properties and were allotted unlimited reading time. The detected nodule was marked by a square bounding box, with the nodule at the center. On the basis of the National Comprehensive Cancer Network guidelines for lung cancer screening (version 2.2019) (20), nodules in our dataset were categorized into four types: solid nodule (≤6 or >6 mm), subsolid nodule (≤5 or >5 mm), calcified nodule, and pleural nodule. The size standards for solid and subsolid nodules were different because they had different follow-up management. These ground truth nodule types were later used to assess differences in detection rate across all nodule types.
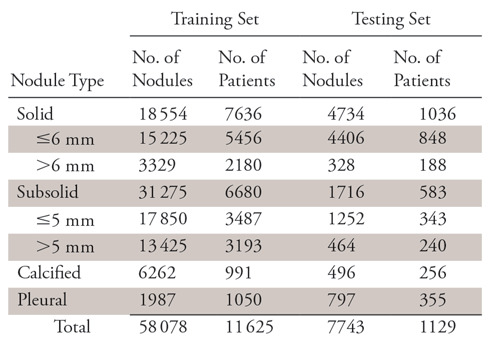
There was a significant overlap between the two radiologists’ annotations, and nodule size was determined by taking the average of their measurements. Samples that were differently annotated by radiologists A and B were checked by a third radiologist (radiologist C) who had approximately 15 years of experience, and consensus was reached by the three radiologists. For the entire dataset, 65 821 nodules were annotated, with an average occurrence of 5.2 nodules per patient, and the distribution was shown in Table 1. Since the focus of this study was on nodule detection, to reduce manual annotation cost, different types of ground-glass nodules were generally categorized as subsolid nodules, and no further diagnosis or pathologic details about nodules were studied.
Table 1:
Categorization and Number of Retrospectively Detected Pulmonary Nodules
DL Model Development
The DL model in our study consists of two CNN models: a DenseNet model as the feature map extractor and a Faster R-CNN–based model as the detector. The original implementation of Faster R-CNN takes only one image as input then feeds the extracted features into a regional proposal network to propose potential regions of interest, which are further processed to generate potential objects’ classification and their bounding boxes. Given that the CT scan is a three-dimensional image volume, we modified the Faster R-CNN network to take successive sections as input, thus forming a multichannel 2.5D CNN (21). Here, 2.5D simply means the model could take successive sections as input but does not use three-dimensional convolution, since the third dimension (axial) was not continuous and resolution was not consistent.
The DenseNet model was used for feature extraction and back propagation in our model. Different from regular CNN, in which feature maps are mostly connected once, in DenseNet all maps are directly linked, thus forming a densely connected network. Such a network could reduce the number of layers, maintain feature density during propagation, and improve overall expressive power of the model. Detailed model structure is shown in Figure 2.
Figure 2:
Framework of the proposed model. N successive sections before and after the center section are collected together as the input. Convolution is performed on each image, and feature maps are extracted using the DenseNet model. The features are fed into a regional proposal network (RPN) to obtain potential regions first, then features inside the proposed regions are further processed to obtain both nodule classification and nodule location. ROI = region of interest.
DL Model Training and Testing
To improve learning efficiency of the model, nearly all input for model training was in the form of nodule-positive sections. Each training step consisted of nine successive sections, which typically covered an entire nodule, given our thin-section scans. For every 100 nodule-positive sections, one nodule-negative section randomly selected from all the lung regions was inserted for model training to avoid bias. The training process was monitored by using the validation dataset to prevent overfitting or to determine whether additional training was needed.
Although the training data were nearly all nodule-positive sections, the DL model was evaluated using the testing data, including all sections of each test patient’s scan. Similar to the training process, nine successive sections were loaded into the DL model for each computation step (ie, sections 1–9 for the first step, sections 2–10 for the second step, etc) until the entire scan was inferred. The CT images were not downsized. Output of the model was the detection marked with a square bounding box. The nodule type and the model’s confidence in its prediction were also included.
Testing Data Differentiation
Radiation dose, patient age, and CT manufacturer were investigated in our study. Ohno et al concluded that there was no significant difference between radiologists’ detection with low-dose CT and that with standard-dose CT (22). They did not compare DL model detection performance for scans using different doses. On the basis of national lung cancer screening guidelines used in China (23), a scan was deemed low dose if the x-ray tube current was less than 60 mAs; otherwise, scans were considered to have been obtained with a conventional dose. For all scans, the peak voltage was not differentiated and was typically 120 kVp.
Since pulmonary structure and texture are age dependent, which might affect lung nodule detection (24,25), the test data were empirically stratified into three groups based on patient age: younger than 30 years, 31–60 years, and older than 61 years. Although a smaller age interval or even regression with age could be used, such analysis was not performed in our study in consideration of clinical necessity and the relatively slow change of pulmonary structures with age.
The third variation was made regarding the CT manufacturer, as different machines might use different image acquisition techniques and image reconstruction algorithms that affect detection performance of the DL model. Our dataset included scans from devices manufactured by Canon Medical Systems (Otawara, Japan), GE Healthcare (Chicago, Ill), Philips (Amsterdam, Netherlands), and Siemens (Erlangen, Germany).
Experimental Design and Data Analysis
Performance of the DL model was first demonstrated using the free-response receiver operating characteristic (FROC) curve, in which sensitivity was plotted versus the number of false-positive findings per scan. To compare sensitivity between the DL model and radiologists, the testing data were also independently examined by two testing radiologists (radiologists 1 [K.L.] and 2 [Q.L.], 5 and 10 years of experience, respectively; note that these were not the radiologists determining ground truth), and exploratory data analysis was conducted.
Radiologists 1 and 2 were given similar instructions and a similar reading environment as the radiologists who established the reference set. However, they did not have access to the original radiology reports as a reference, and the nodule type was not required to be reported. For both the DL model and the testing radiologists, nodule types from the ground truth analysis were used to assess their detection variance across all types. Detection sensitivities of all nodule types were cross-tabulated with the reading subjects and data attributes. For each reading subject (the DL model, radiologists 1 and 2), two-way tabulation χ2 tests were individually conducted to examine the dependence of their detection sensitivities on dose level, age range, and manufacturer. For each attribute, three-way tabulation tests were conducted to compare sensitivity between the DL model and the averaged performance of the radiologists. Dependence of the DL model false-positive detection rate (FPDR) (the number of false-positive detections divided by a model’s total number of detections) on the three attributes was also tested. Note that the conventional false-positive rate (the number of false-positive detections divided by total number of negatives) was not used because the true-negatives of the DL model were difficult to quantify. Since there were three variations, Bonferroni correction was used for the critical significance level (ie, α = .05/3, so approximately .0167).
To verify that the DL model could enhance manual detection in clinical situations, two smaller data batches (batches 1 and 2) containing 123 and 148 scans, respectively, were examined by two additional radiologists (radiologists 3 [W.T.] and 4 [Y.W.], each with approximately 10 years of experience) with and without the DL model. Batch 1 was used to test the nodule-level detection enhancement, while batch 2 was used to test the patient-level detection enhancement. The radiologists first read the scans alone without using the DL model, then they would use the DL model for assistance during their second reading. A washout period of 1 week was used between the two readings, and the scans within each batch were shuffled. Such data amounts were selected by approximating the radiologists’ 2-day clinical workload, and their reading time was limited for each scan (up to approximately 20 minutes, a typical reading period for radiologists at a top-tier hospital). The nodule type and confidence level (range, 0–1 with a step of 0.1) were required to be reported for each detection. In consideration of the clinical significance, only solid nodules larger than 3 mm were included in this analysis.
Radar plots and localization receiver operating characteristic (LROC) curves were used to show the results of the nodule- and patient-level analyses, respectively (26,27). For patient-level analysis, the true-positive, false-positive, true-negative, and false-negative findings were defined as follows: at a certain confidence threshold, a patient would be counted as having true-positive findings only if all nodules were correctly detected (location and type). Likewise, a patient would be counted as having true-negative findings only if no nodules were detected in a patient with no nodules. On the other hand, if the scan was partially correctly annotated (nodules may be missed or incorrectly categorized or located), the patient was counted as having false-negative findings. Finally, if lesions were detected in a patient with no nodules, the patient was counted as having false-positive findings. The true-positive and false-positive rates were then calculated accordingly to generate the LROC data points. Area under the patient-level LROC curve was calculated for both radiologists as well.
Results
Detection Performance of the DL Model
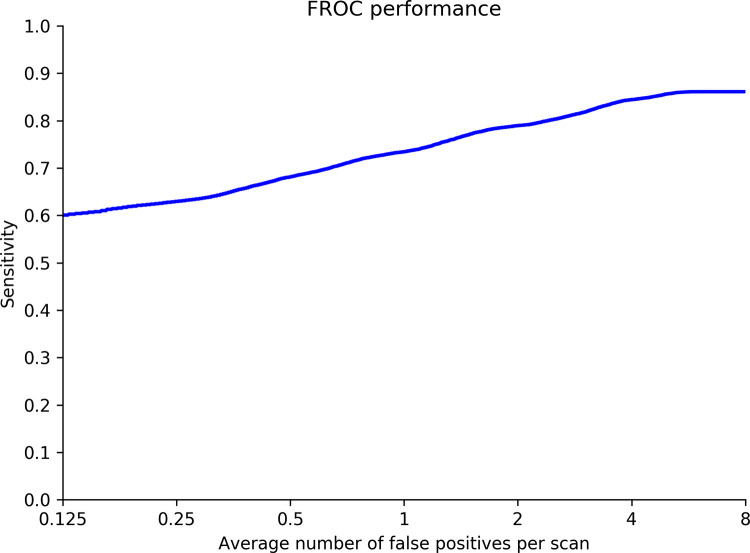
Nodule detection performance of the DL model was demonstrated using the FROC curve. On average, when there was one false-positive detection per scan, sensitivity was 0.74. Sensitivity improved at the cost of specificity and reached a maximum of 0.86 when there were eight false-positive detections per scan. The FROC curve is shown in Figure 3.
Figure 3:
Free-response receiver operating characteristic (FROC) curve shows detection performance of the deep learning model.
Next, we showed the performance of the DL model across radiation dose, patient age, and CT manufacturer. Since the dose, age, and CT manufacturer information might not have been complete for certain scans, the total number of nodules in each cohort might not be consistent.
Effect of Radiation Dose
The two-way χ2 test showed that for the DL model there was no dose-level dependence of detection sensitivity (χ2 = 1.1036, P = .9538). The same result was observed for the radiologists, which was consistent with results reported in the literature (21) (radiologist 1: χ2 = 1.6562, P = .8944; radiologist 2: χ2 = 1.5293, P = .9097). The results are summarized in Table 2.
Table 2:
Dose-related Detection Sensitivity of the Deep Learning Model and Radiologists
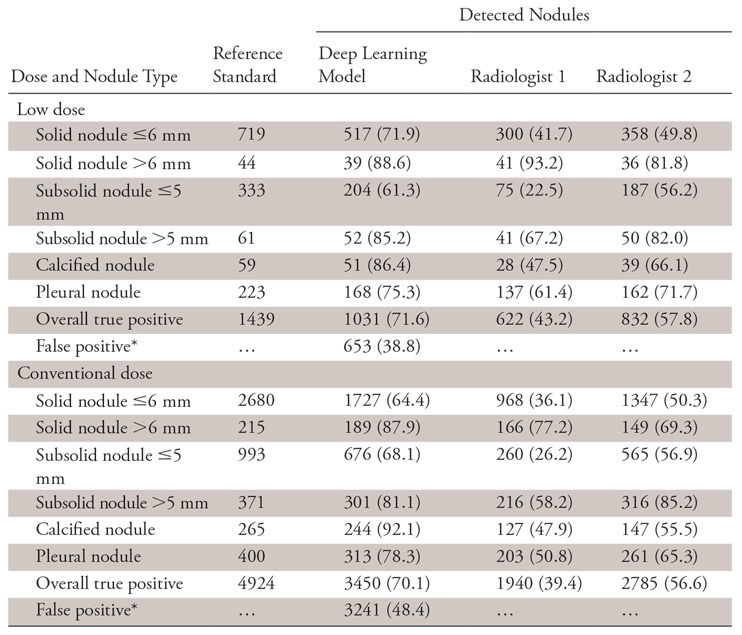
Note.—Data are number of nodules. Unless otherwise indicated, data in parentheses are the sensitivity.
*Data in parentheses are the false discovery rate and are percentages.
Effect of Patient Age
Different patient age dependence between the DL model and the radiologists was observed. While detection sensitivity of the DL model was independent of patient age (χ2 = 6.1676, P = .8010), the less-experienced radiologist showed a significant association (χ2 = 46.0263, P < .0001). The more experienced radiologist showed no significant dependence (χ2 = 20.6033, P = .0240), but the P value was only slightly higher than the corrected critical level. The results are summarized in Table 3.
Table 3:
Age-related Detection Sensitivity of the Deep Learning Model and Radiologists
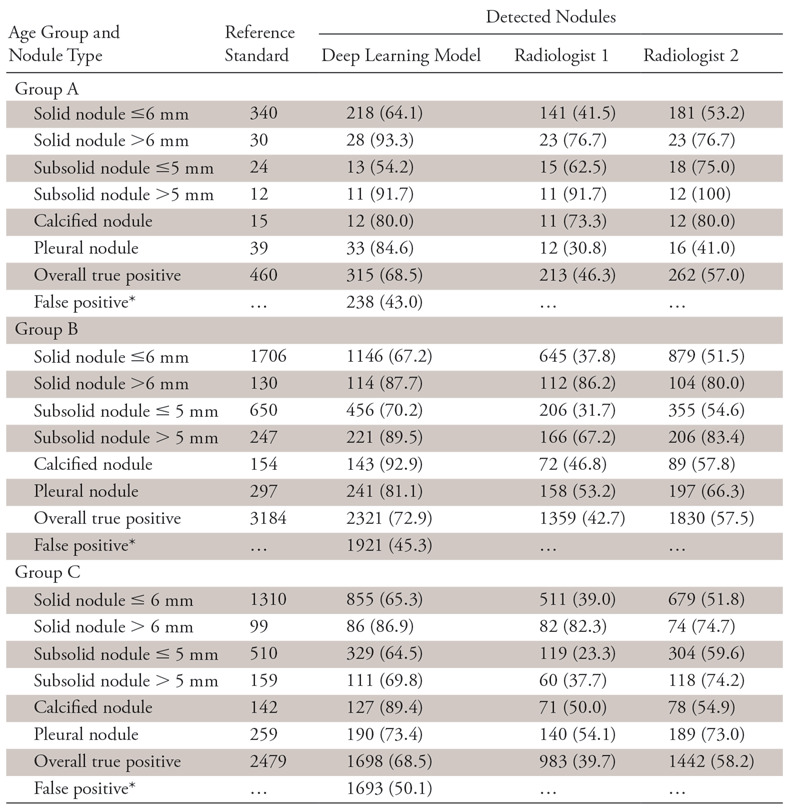
Note.—Data are number of nodules. Unless otherwise indicated, data in parentheses are the sensitivity.
*Data in parentheses are the false discovery rate and are percentages.
Effect of Scanner Manufacturer
As expected, sensitivities of the DL model and both radiologists showed no association with the device manufacturer (DL model: χ2 = 10.5136, P = .7862; radiologist 1: χ2 = 9.0240, P = .8763; radiologist 2: χ2 = 14.6075, P = .4800). The results are summarized in Table 4.
Table 4:
Manufacturer-related Detection Sensitivity of the Deep Learning Model and Radiologists
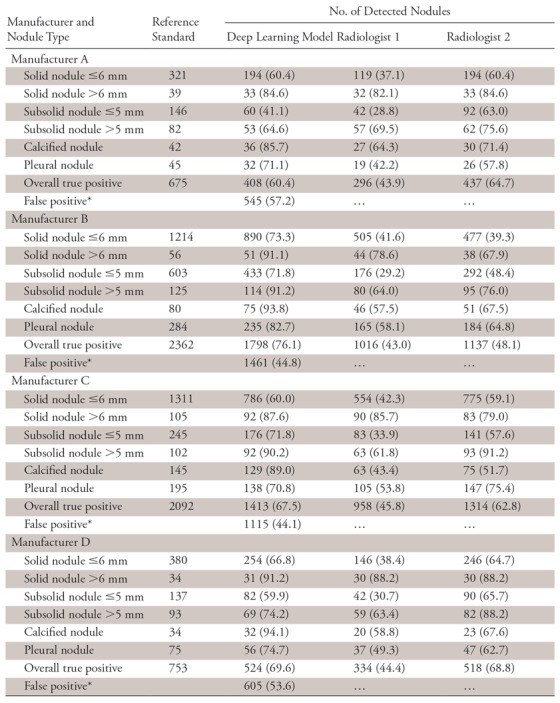
Note.—Data are number of nodules. Unless otherwise indicated, data in parentheses are the sensitivity.
*Data in parentheses are the false discovery rate and are percentages.
In addition to the two-way tabulation tests, the three-way tests were also performed within each data attribute (dose: χ2 = 14.3354, P = .5737; age range: χ2 = 47.3468, P = .0091; manufacturer: χ2 = 39.8508, P = .3877). Thus, except for the patient age cohort, there was no significant association of sensitivity between the DL model and the averaged performance of the radiologists across all nodule types. Nonetheless, on average, the DL model showed improved overall sensitivity for each attribute.
False-Positive Nodule Detections
Besides sensitivity, false-positive results for the DL model were also counted for the three aspects and are reported in the Tables 2–4. Since there were no true-negative nodules, we calculated the FPDR. The χ2 independence test was performed for the FPDR of the DL model, and no dependence on the three factors was observed (dose: χ2 = 0.5640, P =.4527; age: χ2 = 0.4734, P =.7892; CT manufacturer: χ2 = 3.7270, P =.2925).
Radiologist Performance Using the DL Model
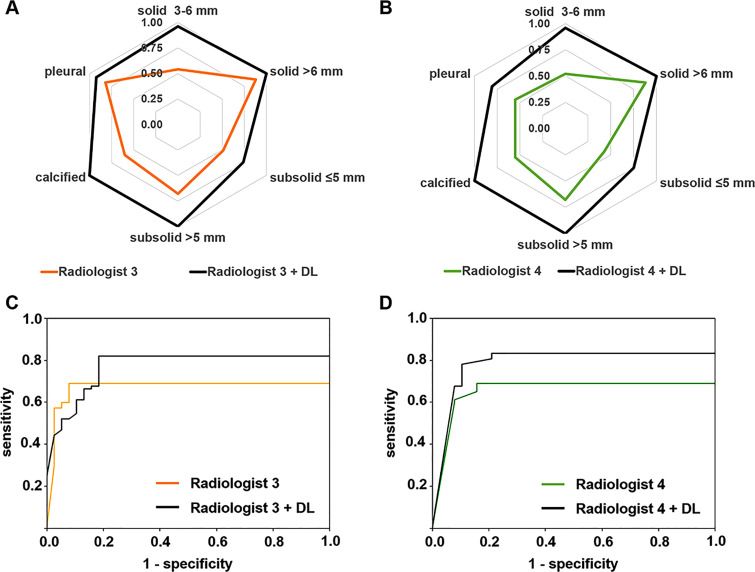
Detection performance of radiologists 3 and 4 using the DL model is shown in Figure 4. For batch 1, the radiologists’ detection sensitivity improved across all nodule types. For batch 2, the patient-level detection also improved, with area under the patient-level LROC curve increasing from 0.67 to 0.77 for radiologist 3 and from 0.65 to 0.78 for radiologist 4. Both radiologists experienced shorter reading time with the model, with a reduction from approximately 15 minutes per patient to approximately 5–10 minutes per patient.
Figure 4:
Nodule-level detection sensitivity comparison for, A, radiologist 3 and, B, radiologist 4 without and with the assistance of the deep learning (DL) model. Patient-level detection localization receiver operating characteristic curve comparison for, C, radiologist 3 and, D, radiologist 4 without and with the assistance of the DL model.
Extra LROC plots using different nodule size cutoffs are shown in Figure E1 (supplement).
Discussion
The FROC curve showed that the DL model could detect most of the nodules when choosing a relatively low specificity standard. Success of this model relied on the combination of two CNN structures. When considering the nonhomogeneous features of pulmonary nodules, the DenseNet model played a critical role in sufficiently extracting the features and maintaining their density through model propagation. Meanwhile, capability of Faster R-CNN to yield nodule location makes the LROC available for more reliable model performance assessment. Robustness of the model was also considered by constructing the data from multiple hospitals. The testing data were never exposed to the model until training was finished, and decent sensitivity could still be achieved.
The contingency test using all listed nodule types showed that detection performance of the DL model (both sensitivity and FPDR) does not depend on the radiation dose level, patient age, or device manufacturer, indicating that the DL model can be broadly applied under different imaging conditions with no restrictions. However, as shown by the two-way tabulation test, performance of the less-experienced radiologist could be significantly dependent on patient age. Such a result might be caused by the structure and texture variation of the lungs in an elderly patient. Scans should be more carefully inferred by the junior radiologist when screening the elderly population. Meanwhile, the DL model might be used by the junior radiologist as a training tool to accumulate experience.
Although the model was insensitive to the investigated attributes, it showed different sensitivities across nodule types. The model had relatively higher sensitivity for the solid nodule larger than 6 mm and the calcified nodule and lower sensitivity for the smaller nodules. Such results were consistent with expectations: larger nodules had more abundant features, and the calcified nodules typically had higher signal intensity on CT images. Adjusting detection layer resolution of the model may improve the detection of smaller nodules.
It was also interesting to note that when using the DL model for assistance, the pattern of the patient-level LROC curves was largely different between radiologists 3 and 4. The difference could be caused by how the radiologists interpreted the DL model detection. When using the model, radiologist 3 annotated some nodules that were indeed true-positive nodules with 100% confidence; thus, the curve started above the (0, 0) point, where the confidence threshold was highest. However, since the DL model could have low specificity, overreliance on the model might cost the radiologist specificity as well. At the high-specificity region (close to the 0 point), the curve of the DL model was shifted to the right, with no benefit for sensitivity. On the other hand, radiologist 4 might have cautiously referred to the model’s detection and her sensitivity was steadily improved without negatively affecting specificity.
Limitations of this study do exist. The first limitation was the relatively high FPDR of the model, which is approximately 49% for the entire testing data. Although false-negatives have more severe consequences than false-positive detection, a high FPDR may mislead and add burden to radiologists (like radiologist 3 in our study). To reduce FPDR in the future, we may inject more nodule-negative sections for training. Another approach may be to use maximum intensity projection image volumes for model training and testing. Since maximum intensity projection has been shown to improve manual detection (28), it may help achieve a similar effect for the DL model.
Another limitation lies in data collection. Although patient age was examined, patients’ smoking history (number of pack-years) was not investigated. This was because smoking history was stored separately from the Digital Imaging and Communications in Medicine information and could not be accessed. Besides, nodule biopsy information was not collected since this was a CT image–based retrospective study using numerous samples, and no diagnosis or grading was involved. However, this would be critical to further verify efficacy of the DL model. Biopsy confirmation of the nodules may be performed in the future using certain testing samples.
For the patient-level LROC analysis, sensitivity and specificity might appear to be not quite satisfactory. This might be because we chose a strict nodule size cutoff, where solid nodules larger than 3 mm and all subsolid nodules were considered in the analysis. However, for baseline screening, nodules 6 mm or smaller usually do not require immediate investigation. Extra LROC plots using adjusted cutoff size are shown in Figure E1 (supplement), and detection enhancement can be observed.
In conclusion, the automatic DL model achieved decent pulmonary nodule detection sensitivity with high robustness. The performance of this model did not depend on multiple external factors and can be used with no restrictions. It could also potentially enhance the manual identification of pulmonary nodules and reduce reading time when used for assistance. Performance of the model may be improved by fine-tuning the model and by using different data curations in the future.
SUPPLEMENTAL FIGURES
Supported by Shanghai Technology Committee Research Program (17411952400) and Shanghai Hygiene Committee Intelligence Medical Research Program (2018ZHYL0101).
Disclosures of Conflicts of Interest: K.L. disclosed no relevant relationships. Q.L. disclosed no relevant relationships. J.M. disclosed no relevant relationships. Z.Z. disclosed no relevant relationships. M.S. disclosed no relevant relationships. Y.D. disclosed no relevant relationships. W.T. disclosed no relevant relationships. Y.W. disclosed no relevant relationships. L.F. disclosed no relevant relationships. C.X. disclosed no relevant relationships. Y.X. disclosed no relevant relationships. R.Z. disclosed no relevant relationships. S.L. disclosed no relevant relationships.
Abbreviations:
- CNN
- convolutional neural network
- DL
- deep learning
- FPDR
- false-positive detection rate
- FROC
- free-response receiver operating characteristic
- LROC
- localization receiver operating characteristic
References
- 1.Bray F, Ferlay J, Soerjomataram I, Siegel RL, Torre LA, Jemal A. Global cancer statistics 2018: GLOBOCAN estimates of incidence and mortality worldwide for 36 cancers in 185 countries. CA Cancer J Clin 2018;68(6):394–424. [DOI] [PubMed] [Google Scholar]
- 2.Siegel RL, Miller KD, Jemal A. Cancer statistics, 2018. CA Cancer J Clin 2018;68(1):7–30. [DOI] [PubMed] [Google Scholar]
- 3.van Klaveren RJ, Oudkerk M, Prokop M, et al. Management of lung nodules detected by volume CT scanning. N Engl J Med 2009;361(23):2221–2229. [DOI] [PubMed] [Google Scholar]
- 4.National Lung Screening Trial Research Team , Aberle DR, Adams AM, et al. Reduced lung-cancer mortality with low-dose computed tomographic screening. N Engl J Med 2011;365(5):395–409. [DOI] [PMC free article] [PubMed] [Google Scholar]
- 5.National Lung Screening Trial Research Team , Church TR, Black WC, et al. Results of initial low-dose computed tomographic screening for lung cancer. N Engl J Med 2013;368(21):1980–1991. [DOI] [PMC free article] [PubMed] [Google Scholar]
- 6.Diederich S, Wormanns D, Semik M, et al. Screening for early lung cancer with low-dose spiral CT: prevalence in 817 asymptomatic smokers. Radiology 2002;222(3):773–781. [DOI] [PubMed] [Google Scholar]
- 7.Manning DJ, Ethell SC, Donovan T. Detection or decision errors? missed lung cancer from the posteroanterior chest radiograph. Br J Radiol 2004;77(915):231–235. [DOI] [PubMed] [Google Scholar]
- 8.Hossain R, Wu CC, de Groot PM, Carter BW, Gilman MD, Abbott GF. Missed lung cancer. Radiol Clin North Am 2018;56(3):365–375. [DOI] [PubMed] [Google Scholar]
- 9.Sone S, Takashima S, Li F, et al. Mass screening for lung cancer with mobile spiral computed tomography scanner. Lancet 1998;351(9111):1242–1245. [DOI] [PubMed] [Google Scholar]
- 10.Armato SG 3rd, Li F, Giger ML, MacMahon H, Sone S, Doi K. Lung cancer: performance of automated lung nodule detection applied to cancers missed in a CT screening program. Radiology 2002;225(3):685–692. [DOI] [PubMed] [Google Scholar]
- 11.Arimura H, Katsuragawa S, Suzuki K, et al. Computerized scheme for automated detection of lung nodules in low-dose computed tomography images for lung cancer screening. Acad Radiol 2004;11(6):617–629. [DOI] [PubMed] [Google Scholar]
- 12.Liang M, Tang W, Xu DM, et al. Low-dose CT screening for lung cancer: computer-aided detection of missed lung cancers. Radiology 2016;281(1):279–288. [DOI] [PubMed] [Google Scholar]
- 13.Li F, Arimura H, Suzuki K, et al. Computer-aided detection of peripheral lung cancers missed at CT: ROC analyses without and with localization. Radiology 2005;237(2):684–690. [DOI] [PubMed] [Google Scholar]
- 14.Shen W, Zhou M, Yang F, Yang C, Tian J. Multi-scale convolutional neural networks for lung nodule classification. In: International Conference on Information Processing in Medical Imaging. Vol 9123. Cham, Switzerland: Springer International, 2015; 588–599. [DOI] [PubMed] [Google Scholar]
- 15.Ciompi F, Chung K, van Riel SJ, et al. Towards automatic pulmonary nodule management in lung cancer screening with deep learning. Sci Rep 2017;7:46479. [DOI] [PMC free article] [PubMed] [Google Scholar]
- 16.Causey JL, Zhang J, Ma S, et al. Highly accurate model for prediction of lung nodule malignancy with CT scans. Sci Rep 2018;8(1):9286. [DOI] [PMC free article] [PubMed] [Google Scholar]
- 17.Hua KL, Hsu CH, Hidayati SC, Cheng WH, Chen YJ. Computer-aided classification of lung nodules on computed tomography images via deep learning technique. Onco Targets Ther 2015;8:2015–2022. [DOI] [PMC free article] [PubMed] [Google Scholar]
- 18.Huang G, Liu Z, van der Maaten L, Weinberger KQ. Densely connected convolutional networks. In: 2017 IEEE Conference on Computer Vision and Pattern Recognition (CVPR). Honolulu: IEEE, 2017; 4700–4708. [Google Scholar]
- 19.Ren S, He K, Girshick R, Sun J., Faster R-CNN: towards real-time object detection with region proposal networks. IEEE Trans Pattern Anal Mach Intell 2017;39(6):1137–1149. [DOI] [PubMed] [Google Scholar]
- 20.National Comprehensive Cancer Network . Lung cancer screening. version 1. 2017. https://www.nccn.org/patients. Published 2017. Accessed August 28, 2018.
- 21.Roth HR, Lu L, Seff A, et al. A new 2.5D representation for lymph node detection using random sets of deep convolutional neural network observations. In: Golland P, Hata N, Barillot C, Hornegger J, Howe R, eds. Medical Image Computing and Computer-Assisted Intervention–MICCAI 2014. Cham, Switzerland: Springer International, 2014; 520–527. [DOI] [PMC free article] [PubMed] [Google Scholar]
- 22.Ohno Y, Koyama H, Yoshikawa T, et al. Standard-, reduced-, and no-dose thin-section radiologic examinations: comparison of capability for nodule detection and nodule type assessment in patients suspected of having pulmonary nodules. Radiology 2017;284(2):562–573. [DOI] [PubMed] [Google Scholar]
- 23.Zhou Q, Fan Y, Wang Y, et al. China national lung cancer screening guideline with low-dose computed tomography (2018 version) [in Chinese]. Zhongguo Fei Ai Za Zhi 2018;21(2):67–75. [DOI] [PMC free article] [PubMed] [Google Scholar]
- 24.Turner JM, Mead J, Wohl ME. Elasticity of human lungs in relation to age. J Appl Physiol 1968;25(6):664–671. [DOI] [PubMed] [Google Scholar]
- 25.Gillooly M, Lamb D. Airspace size in lungs of lifelong non-smokers: effect of age and sex. Thorax 1993;48(1):39–43. [DOI] [PMC free article] [PubMed] [Google Scholar]
- 26.Park SH, Goo JM, Jo CH. Receiver operating characteristic (ROC) curve: practical review for radiologists. Korean J Radiol 2004;5(1):11–18. [DOI] [PMC free article] [PubMed] [Google Scholar]
- 27.Gifford HC, King MA, Wells RG, Hawkins WG, Narayanan MV, Pretorius PH. LROC analysis of detector-response compensation in SPECT. IEEE Trans Med Imaging 2000;19(5):463–473. [DOI] [PubMed] [Google Scholar]
- 28.Gruden JF, Ouanounou S, Tigges S, Norris SD, Klausner TS. Incremental benefit of maximum-intensity-projection images on observer detection of small pulmonary nodules revealed by multidetector CT. AJR Am J Roentgenol 2002;179(1):149–157. [DOI] [PubMed] [Google Scholar]
Associated Data
This section collects any data citations, data availability statements, or supplementary materials included in this article.


