

Abstract
The interrelationships among long-term ambient air pollution exposure, emotional distress and cognitive decline in older adulthood remain unclear. Long-term exposure may impact cognitive performance and subsequently impact emotional health. Conversely, exposure may initially be associated with emotional distress followed by declines in cognitive performance. Here we tested the inter-relationship between global cognitive ability, emotional distress, and exposure to PM2.5 (particulate matter with aerodynamic diameter <2.5 μm) and NO2 (nitrogen dioxide) in 6,118 older women (aged 70.6 ± 3.8 years) from the Women’s Health Initiative Memory Study. Annual exposure to PM2.5 (interquartile range [IQR] = 3.37 μg/m3) and NO2 (IQR=9.00ppb) was estimated at the participant’s residence using regionalized national universal kriging models and averaged over the 3-year period before the baseline assessment. Using structural equation mediation models, a latent factor capturing emotional distress was constructed using item-level data from the 6-item Center for Epidemiological Studies Depression Scale and the Short Form Health Survey Emotional Well-Being scale at baseline and one-year follow-up. Trajectories of global cognitive performance, assessed by the Modified-Mini Mental State Examination (3MS) annually up to 12 years, were estimated. All effects reported were adjusted for important confounders. Increases in PM2.5 (β =−.144 per IQR; 95% CI = −.261; −.028) and NO2 (β=−.157 per IQR; 95% CI = −.291; −.022) were associated with lower initial 3MS performance. Lower 3MS performance was associated with increased emotional distress (β=−.008; 95% CI = −.015; −.002) over the subsequent year. Significant indirect effect of both exposures on increases in emotional distress mediated by exposure effects on worse global cognitive performance were present. No statistically significant indirect associations were found between exposures and 3MS trajectories putatively mediated by baseline emotional distress. Our study findings support cognitive aging processes as a mediator of the association between PM2.5 and NO2 exposure and emotional distress in later-life.
Keywords: Air pollution, cognition, emotional distress, aging
Introduction
Emotional distress and cognitive decline are both common in later life (Reynolds et al., 2015; Wimo et al., 2017), disproportionally affect women (Snyder et al., 2016), and adversely impact the health and well-being of older people and their caregivers (Mohamed et al., 2010). Long-term exposure to ambient fine particulate matter (PM2.5; particulate matter with aerodynamic diameter <2.5 μm) and gaseous air pollutants, such as NO2 (nitrogen dioxide) have been identified as environmental risk factors for depressive symptoms, emotional distress, cognitive decline, and dementia in older adulthood (Cacciottolo et al., 2017; Peters et al., 2019; Petkus et al., 2019).
Emotional distress and cognitive decline commonly co-occur in later life, as individuals with a past history of depression are at a higher risk for cognitive decline and dementia (Byers and Yaffe, 2011). Conversely, late-life emotional distress may be a prodromal symptom of dementia (Singh-Manoux et al., 2017). It is important to examine how air pollution affects the inter-relation between emotional distress and cognitive functioning, because long-term exposure to air pollutants may contribute to neurotoxicological changes in the brain, such as neuroinflammation, oxidative stress, cerebral vascular damage and neurodegeneration (Bejot et al., 2018; Block and Calderon-Garciduenas, 2009), all implicated in the neurobiological underpinnings of both emotional distress (van Agtmaal et al., 2017) and cognitive decline in later-life. Research on the complex associations among air pollution, global cognitive performance, and emotional distress may contribute to better understanding of the interplay between these phenotypes affected by exposures and help identify individuals at high risk for cognitive decline and emotional distress who can be targeted for preventative interventions.
The temporal relationships between air pollution exposure, changes in cognition, and emotional distress remains unclear. Specifically, it is unclear whether emotional distress precedes changes in cognitive performance or vice versa. Our recent work examining the longitudinal associations among ambient air pollution, depressive symptoms and episodic memory suggests that air pollution-related memory decline may precede increases in emotional distress (Petkus et al., 2020). Specifically, we found that exposure to PM2.5 was associated with episodic memory declines, which was then associated with subsequent increases in depressive symptoms. However, we only examined single domain-specific performance of episodic memory, and did not study the global cognitive abilities, which represent a common dimension of the cognitive aging processes and account for a greater variance in the between-individual differences in cognitive decline (Tucker-Drob, 2011). Additionally, our prior work only included data on depressive symptoms, missing other aspects of emotional well-being, such as symptoms of anxiety. Anxiety symptoms are more common than depressive symptoms in later-life and are implicated with negative health consequences (Wolitzky-Taylor et al., 2010). It is important to examine exposure in relation to a broader range of symptoms of emotional distress given emerging research highlighting commonalities between depression and anxiety (Brown and Barlow, 2009; Sauer-Zavala et al., 2017) and conceptualization and push for transdiagnostic treatment (Barlow et al., 2017; Sauer-Zavala et al., 2017). Our previous work was further limited by only studying PM2.5, while the associations between other air pollution exposures, such as NO2, and increased risks for depressive symptoms (Lim et al., 2012) or dementia risk have been reported separately in different populations (Chen et al., 2017; Oudin et al., 2016). To the best of our knowledge, no studies have examined how air pollution exposure affects the interrelation between emotional distress and global cognitive performance in later-life.
In this longitudinal study of older women, we examined the association between PM2.5 and NO2 exposures with the longitudinal interrelationships between emotional distress and global cognitive performance. Based off our previous findings (Petkus et al., 2020) we hypothesize that global cognitive performance will mediate associations between exposure and increases in emotional distress.
Materials and Methods
Study design and population
We conducted a longitudinal study that included 6,118 community-dwelling women enrolled in the Women’s Health Initiative (WHI) Memory Study (WHIMS) (Shumaker et al., 1998). WHIMS participants were postmenopausal women (N=7,479) aged 65 or older across 48 states and free of dementia as determined by standardized study protocols, described elsewhere (Shumaker et al., 2004; Shumaker et al., 2003). The WHIMS was an ancillary study to the Hormonal Treatment arms of WHI Clinical Trial (WHI-CT; N = 68,132) (WHI Study Group; 1998). At the WHI-CT screening visits, which we refer to as the WHI baseline, all women completed assessments of emotional distress. A second assessment of emotional distress was administered approximately one-year after the baseline. The in-person assessment of global cognitive performance started at the WHIMS inception in 1996–1999 and continued annually thereafter until the clinic visits stopped in 2008. On average the cognitive assessment occurred 42.2 days (SD = 36.8; range = −30 to 408) after the baseline assessment of emotional distress. The one-year follow-up of emotional distress occurred on average 415.5 (SD = 46.3; range = 231 to 784) days after the WHI baseline. To better define the temporality while testing the global cognitive performance as a mediator of change in emotional distress, we excluded 100 women who were administered the one-year follow-up of emotional distress within six months of the initial WHIMS assessment of global performance. The analytic subpopulation consisted of 6,118 women who completed the WHI baseline and one-year follow-up, had air pollution exposure data, met aforementioned inclusion criteria for temporality of assessments, and had no missing covariate data. See Figure 1 panel A for a flowchart of study participation and panel B for a timeline of assessments.
Fig. 1.
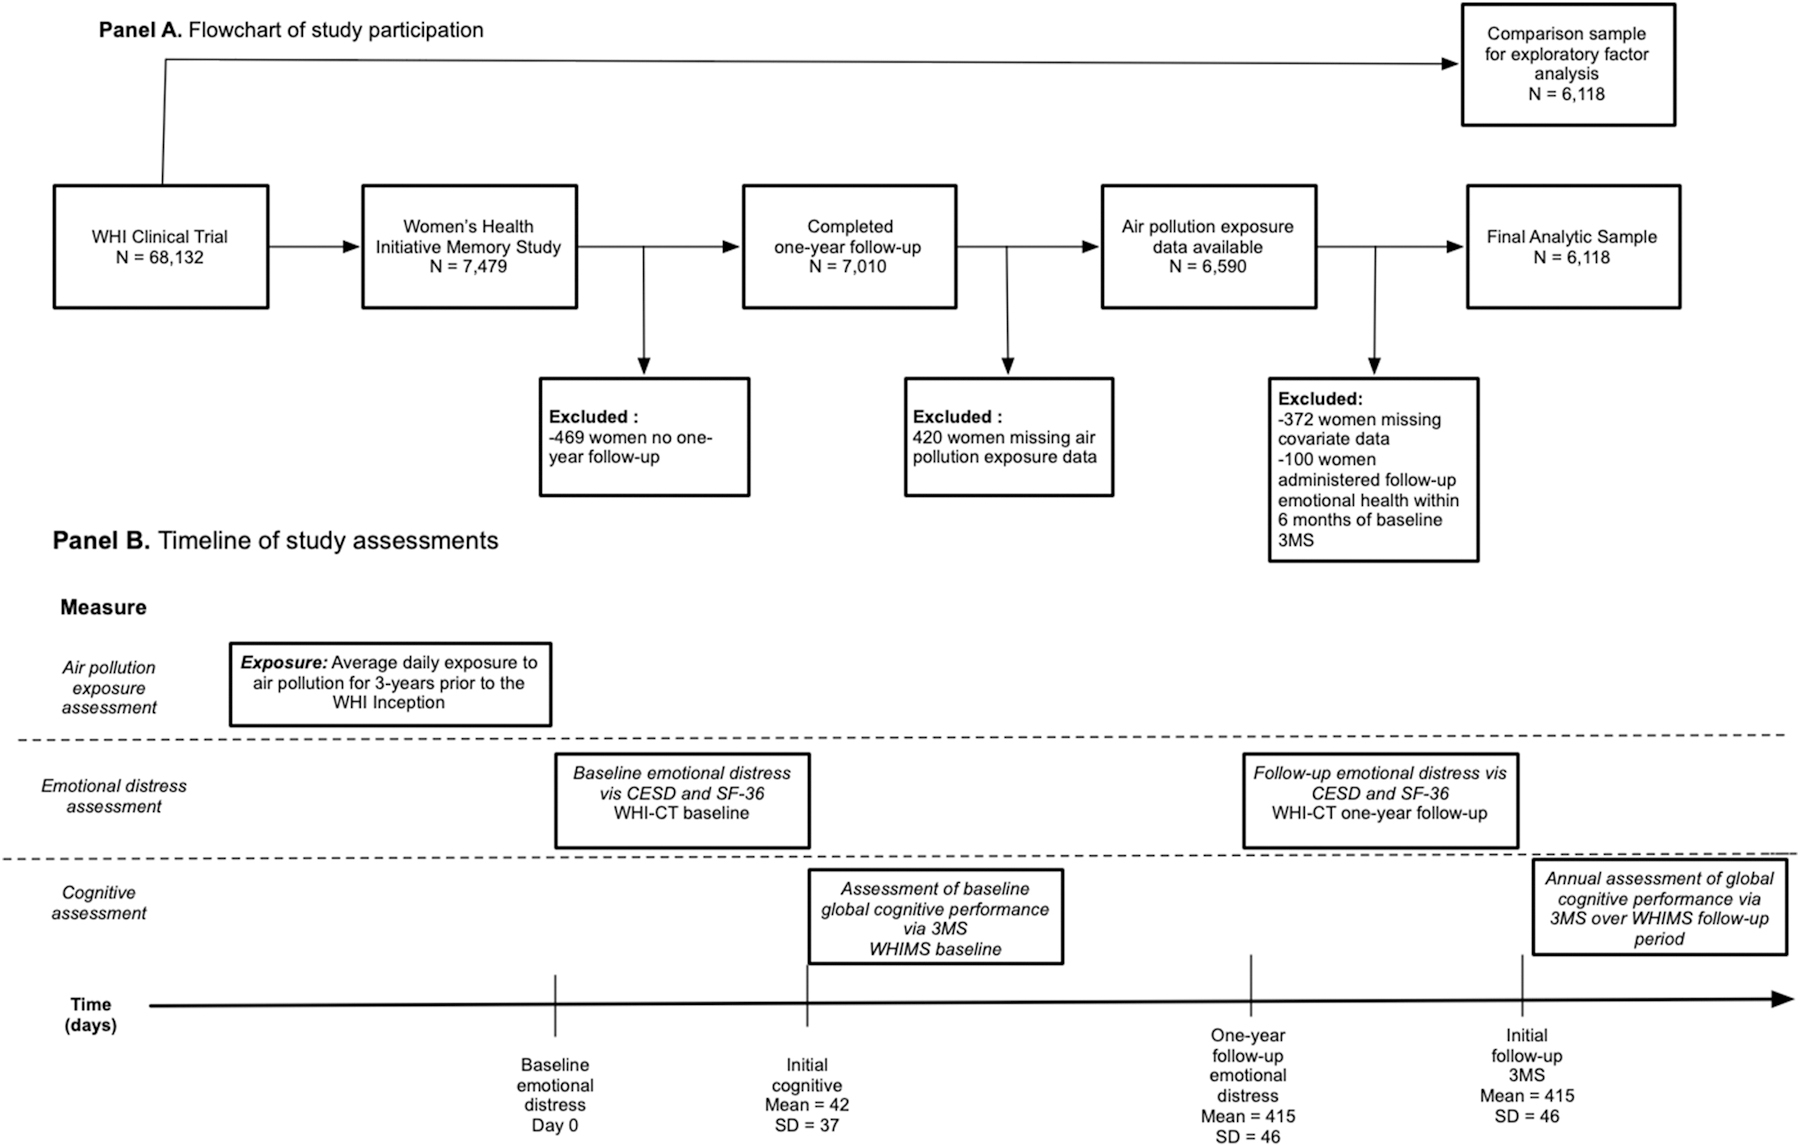
Panel A depicts the flowchart of study participation while panel B illustrates the timeline of study assessments.
Assessment of emotional distress
Emotional distress was characterized using the item-level data. To more broadly define emotional distress in late life, we combined data from the modified 6-item Center for Epidemiological Studies Depression Scale (CES-D) (Radloff, 1977) and the emotional well-being scale from the Short Form Health Survey-36 (SF-36) (Ware and Sherbourne, 1992). The CES-D and SF-36 were administered at the WHI baseline and the one-year follow-up assessment. We chose to combine these measures in order to capture multiple components of emotional distress such as anxiety, which were assessed in two items of the SF-36 scale. The modified CES-D consisted of six of the standard 20 items, each rated on a 4-point Likert-type scale. The emotional well-being scale from the SF-36 consisted of 5 items rated on a 6-point Likert-type scale. All of the items loaded onto a single latent factor of emotional distress which was utilized in all analyses related to the main study hypotheses.
To establish the psychometric appropriateness of combining these items and that these combined items captured a unidimensional construct of emotional distress, we first examined the factor structure of these items using exploratory factor analytic methods in randomly selected comparison sample of 6,118 women from the WHI-CT participants not enrolled in WHIMS. Propensity score matching (Ho et al., 2011) was utilized to select women who were comparable to the WHIMS analytic sample on age, region of residence, and education. As compared to the WHIMS analytic sample, the selected comparison sample had similar proportions of White (non-Hispanic), African American, and Hispanic, but there were slightly more women who self-identified as having an “other” racial background. Characteristics of the comparison sample are provided in supplemental eTable 1.
A description of each item with item-response frequencies was provided in eTable 2. To examine the dimensionality of the latent construct of emotional distress, an exploratory factor analysis (EFA) was first run with the WHI-CT comparison sample, followed by a confirmatory factor analysis (CFA) with the WHIMS analytic sample (see eMethods for more details). Results from the EFA and CFA both demonstrate the unidimensional nature of our latent construct, supporting our decision to combine these items onto a single latent factor (see eFigure 2–3 and eTables 3–5). The latent emotional distress factor at baseline was constrained to have a mean of zero and a variance of 1.0 (see eFigure 4 for diagram of the emotional distress factor with all indicators). The distribution of the latent emotional distress factors at baseline and one-year follow-up are presented in panel A and B in eFigure 5.
Assessment of global cognitive performance
The Modified-Mini Mental State Examination (3MS) (Teng and Chui, 1987) was administered to assess global cognitive performance. The 3MS consists of 15 items that capture multiple cognitive abilities (scored 0–100), with higher scores reflecting better global cognitive ability. The 3MS contains four additional items compared to the original Mini Mental State Examination (MMS), some changes in the item content, and order of administration. The 3MS contains more specific test administration instructions which are designed to increase the standardization of the test. The 3MS has a larger range of possible scores (0–100) and less of a ceiling effect that is commonly seen in the MMSE (see panel C of eFigure 5 for distribution of 3MS scores at baseline). The 3MS was administered at the initial WHIMS assessment and during annual in-person clinic visits. On average women completed 8.23 (SD=2.58) times of 3MS assessments over follow-up period.
Assessment of ambient PM2.5 and NO2
Participants’ addresses were collected at the initial WHI assessment and geocoded using standardized procedures (Whitsel et al., 2004). Annual averages of PM2.5 and NO2 concentrations at each residence were estimated using regionalized universal kriging models. The model is based on US Environmental Protection Agency (EPA) monitoring data and incorporates a partial least-squares regression of geographic covariates and has been validated in past research (Bergen et al., 2013; Sampson et al., 2013; Young et al., 2016). Over 600 geographic covariates were used to estimate exposure including distances to roads, population density, and vegetation in the vicinity. The cross-validated R2 for the models was 0.88 for PM2.5 and 0.84 for NO2. Our air pollution estimates accounted for residential mobility during the 3-year period. The main interest in this study was the effect of long-term exposure; therefore, we utilized the average annual estimates of exposure for the 3-years prior to the initial WHI assessment. An illustration of the study area, approximate participant locations, and estimated exposures are presented in Figure 2 (PM2.5) and Figure 3 (NO2).
Fig. 2.

Map of WHIMS participants approximate locations with estimated average annual PM2.5 exposure for the 3-years prior to the study baseline.
Fig. 3.

Map of WHIMS participants approximate locations with estimated average annual NO2 exposure for the 3-years prior to the study baseline.
Covariate data
A structured questionnaire was administered at WHI baseline to gather information on the time-independent covariates. Participants self-reported demographics (age, race/ethnicity), geographic region of residence (Northeast, South, Midwest, and West), socioeconomic status (education; family income), employment status, and lifestyle factors (smoking; alcohol use; physical activities). Clinical characteristics were also self-reported, including history of postmenopausal hormone treatment, history of cardiovascular disease (including previous coronary heart, stroke, or transient ischemic attack), hypertension (defined as elevated blood pressure or use of antihypertensive medication), and diabetes mellitus (defined as physician diagnosis plus oral medications, or insulin therapy). Data on histories of depression (Robins et al., 1981) and census track-level neighborhood socioeconomic characteristics (nSES) capturing multiple domains of wealth in the neighborhood including: median household income, owner-occupied housing units, percent of households with interest, dividends or rent income, education, and occupation were collected using standard methods (Qi et al., 2012) (see eMethods).
Statistical Analysis
Bivariate models to examine associations between 3-year average exposures and the inter-relation of global cognitive function and emotion distress
Bivariate structural equation models (SEMs) for multiple-indicator latent change scores (LCS) (Kievit et al., 2018) were constructed to examine the associations between exposure and emotional distress, including the baseline measure and one-year change of the latent factor (defined by multiple item-level indicators; see eMethods). The bivariate LCS also assessed whether initial 3MS performance mediated the putative association between exposures and changes in emotional distress (bivariate LCS is depicted in the panel A of Figure 4). In the multiple-indicator LCS SEM, the CES-D and SF-36 items all loaded onto a latent factor of emotional distress at each assessment. The direct exposure effects on baseline emotional distress (βexposure on distress) and on one-year change in emotional distress (βexposure on Y∆distress) were estimated, as illustrated in panel A of Figure 4. The initial 3MS score was included as a manifest variable in the LCS model and exposure effects on initial 3MS (βexposure on 3MS) and effects of 3MS on one-year change in emotional distress (β3MS on Y∆distress) were estimated. The indirect effect, defined as the extent to which initial 3MS score mediated the exposure effect on one-year change in emotional distress, was estimated by multiplying two SEM paths: (a) the exposure effect on initial 3MS score (βexposure on baseline 3MS); and (b) initial 3MS score effect on one-year change in emotional distress (β3MS on ∆distress). The resulting effect estimates were adjusted for all demographic, lifestyle, region of residence, and clinical covariates. Asymmetric confidence intervals were calculated via Monte Carlo simulation with 10,000 replications using the MCMED macro (Hayes, 2018) to determine significance of the indirect effects estimated in the bivariate SEMs. Separate models were constructed for PM2.5 and NO2.
Fig. 4.

Depiction of the bivariate structural equation models estimating the indirect effect of 3-year average PM2.5 or NO2 exposure on change in emotional distress (Panel A) and global cognitive performance (Panel B).
Exposure = Estimate of the average annual particulate matter (PM2.5) or nitrogen dioxide (NO2) for the three-years prior to the WHI baseline. Baseline emotional distress = Latent variable consisting of the 6-items from the Center for Epidemiological Studies Depression Scale and the 5-items from the Short Form Health Survey-36 Emotional Well-Being subscale measured at the WHI study baseline. Change in emotional distress = Latent variable consisting of total change in the latent emotional distress variable from WHI baseline to the one-year follow-up. 1 /year difference = The individual-specific reciprocal of the difference in years between the WHI baseline and the one-year follow-up. One-year change emotional distress = Latent variable estimating total change in emotional distress over a one-year period. Baseline 3MS = Individual-specific estimate of initial performance on the Modified Mini Mental State examination (3MS) derived from the within-portion of the multilevel structural equation model. Linear change 3MS = Individual-specific estimate of annual linear change on the Modified Mini Mental State examination (3MS) derived from the within-portion of the multilevel structural equation model. Quadratic change 3MS = Individual-specific estimate of annual quadratic change on the Modified Mini Mental State examination (3MS) derived from the within-portion of the multilevel structural equation model. Covariates = vector of covariates including: age at WHIMS baseline, race/ethnicity, geographic region of residence, education, household income, employment status, lifestyle factors (smoking, alcohol use, physical activities) and clinical characteristics (use of hormone treatment; hypercholesterolemia, hypertension, diabetes, and history of cardiovascular disease).
Multilevel parallel-process SEMs (Cheong et al., 2003) were constructed to examine whether baseline emotional distress mediated any effect of exposure on linear and quadratic changes in 3MS performance over the WHIMS study period. Individual-specific trajectories in the 3MS over the study period were estimated using years across the assessments as the timescale with the initial 3MS administration date designated as the time zero. A random intercept (representing estimated initial 3MS performance for each individual), a random linear slope (estimating individual-specific annual linear changes over the follow-up), and a random quadratic slope (estimating individual-specific annual quadratic changes) were estimated in the within-individual portion of the multilevel SEM, while accounting for a practice effect. To assess associations between exposure and 3MS trajectories, these individual-specific parameters were then entered into the between-individual portion of the multilevel SEM, as depicted in the panel B of Figure 4. We estimated the direct exposure effects on initial 3MS (βexposure on 3MS), annual linear (βexposure on linear ∆3MS), and annual quadratic (βexposure on quadratic ∆3MS) change. Baseline emotional distress, the putative mediator, was also included in the between-individual portion of the multilevel SEM. The indirect effect of exposure on trajectories of 3MS was estimated by multiplying two SEM paths: (a) the exposure effect on baseline emotional distress (βexposure on distress); and (b) the effect of baseline emotional distress on linear (βdistress on linear ∆3MS) or the quadratic (βdistress on quadratic ∆3MS) changes in 3MS. All models included statistical adjustment of the same covariates described above with separate models for each exposure.
We chose the structural equation mediation models with the product of coefficients approach, as this approach generally has superior performance compared to other approaches. Compared to the traditional Baron and Kenny approach to mediation, the SEM approach generally has higher statistical power to examine mediation (Mackinnon et al., 2002; Fritz & Mackinnon, 2007). The SEM approach also allows for examination of mediation with latent factors in a single statistical model which cannot be done in either the traditional Baron and Kenny or the ordinary least square regression approach with the Sobel test. We also chose the product of coefficients approach in a SEM framework, as it is easier to incorporate latent factors into these models.
We conducted the first set of supplemental mediation analyses to examine whether one-year change in emotional distress mediated associations between exposure and 3MS changes characterized by different temporal structure. The second set of supplemental analyses was conducted to further examine whether the observed exposure effects on changes in emotional distress, with the hypothesized mediation by baseline 3MS, persisted after further adjusting for other possible mediation paths with the indirect effects involving baseline emotional distress (depicted in eFigure 7). Furthermore, we conducted a series of sensitivity analyses to examine the robustness of our study findings (see eMethods). Sensitivity analyses were conducted to: (1) ensure we were not overfitting covariate structure in SEM, (2) ensure the temporality between exposure mediator, and outcome, (3) explore whether any observed associations could reflect underlying dementia risk, (4) explore confounding by depression before late-life, (5) explore whether findings could be explained by stroke risk, (6) examine the potential confounding by nSES, (7) ensure hormone treatment assignment did not confound our results, and (8) examined the consistency of our results if emotional distress was measured by only the 6-item CESD or only the 5-item SF-36 emotional well-being scale. All analyses were performed using MPLUS version 8 (Muthén and Muthén, 1998–2018) via the MPLUS automation package (Hallquist and Wiley, 2018) in R version 3.5.1. Robust maximum likelihood estimator was utilized to account for the deviations from non-normality.
Results
Table 1 compares the distribution of the 3-year average exposures to PM2.5 and NO2 prior to the WHI assessment, stratified by population characteristics. Women who self-identified as African American or reported an annual household income of less than 9,999 dollars, were exposed to higher levels of both PM2.5 and NO2 compared to Caucasian women and women reporting incomes between 10,000–74,999 dollars. Women residing in the south were exposed to higher levels of PM2.5 compared to other regions, while women residing in the northeast and west were exposed to higher levels of NO2 compared to other regions. Women exposed to higher levels of PM2.5 were more likely to have hypercholesterolemia while women exposed to more NO2 were more likely to have diabetes.
Table 1.
Comparison of Estimated PM2.5 and NO2 Exposures by Population Characteristics at Baseline (N = 6,118).
| Distribution of 3-year averagea PM2.5 exposure(µg/m3) |
Distribution of 3-year averagea NO2 exposure (ppb) |
||||||
|---|---|---|---|---|---|---|---|
| Population Characteristics | N | Mean ± SD | (25th, Median, 75th) | Pb | Mean ± SD | (25th, Median, 75th) | pb |
| Overall | 6118 | 13.5 ± 2.70 | (11.8,13.6,15.2) | 16.1 ± 6.90 | (10.9,15.6,19.9) | ||
| Region of Residence | <.01 | <.01 | |||||
| Northeast | 1729 | 13.5 ± 1.99 | (12.0,13.4,14.6) | 17.6 ± 7.17 | (12.3,16.6,21.4) | ||
| South | 1237 | 14.0 ± 2.16 | (12.5,14.3,15.6) | 13.8 ± 6.45 | (8.4,12.8,18.0) | ||
| Midwest | 1486 | 13.6 ± 2.18 | (12.2,13.5,15.2) | 14.3 ± 4.71 | (10.4,14.4,17.9) | ||
| West | 1666 | 13.3 ± 3.84 | (10.4,13.2,15.5) | 17.8 ± 7.66 | (12.6,17.3,21.4) | ||
| Race/Ethnicity | <.01 | <.01 | |||||
| African-American | 365 | 15.4 ± 2.13 | (14.2,15.4,16.4) | 21.3 ± 7.66 | (15.9,21.0,25.9) | ||
| Hispanic White | 131 | 13.9 ± 3.09 | (11.8,13.0,15.6) | 20.3 ± 8.54 | (15.1,17.4,24.1) | ||
| Non-Hispanic White | 5469 | 13.4 ± 2.66 | (11.7,13.4,15.0) | 15.5 ± 6.53 | (10.6,15.1,19.3) | ||
| Other or Missing | 153 | 14.8 ± 3.28 | (12.9,14.6,16.3) | 20.1 ± 8.27 | (14.6,18.9,26.0) | ||
| Education | .20 | <.01 | |||||
| Less than high school | 419 | 13.7 ± 2.71 | (11.9,13.8,15.4) | 16.2 ± 7.39 | (10.4,15.8,20.1) | ||
| High school | 1337 | 13.5 ± 2.54 | (11.8,13.4,15.2) | 15.5 ± 6.41 | (10.8,15.1,19.2) | ||
| More than high school | 4362 | 13.6 ± 2.75 | (11.9,13.6,15.2) | 16.2 ± 6.99 | (10.9,15.8,20.0) | ||
| Employment | .24 | .09 | |||||
| Currently working | 759 | 13.7 ± 2.65 | (12.0,13.6,15.2) | 16.4 ± 6.91 | (11.2,16.3,20.0) | ||
| Not working | 546 | 13.6 ± 2.74 | (12.1,13.6,15.4) | 15.6 ± 6.69 | (10.5,15.0,19.1) | ||
| Retired | 4813 | 13.5 ± 2.71 | (11.8,13.5,15.2) | 16.1 ± 6.92 | (10.9,15.6,19.9) | ||
| Income (in USD) | .01 | <.01 | |||||
| < 9,999 | 313 | 13.9 ± 2.82 | (11.9,14.1,15.8) | 17.3 ± 7.56 | (11.4,17.4,21.2) | ||
| 10,000–34,999 | 2953 | 13.4 ± 2.73 | (11.7,13.4,15.1) | 15.6 ± 6.78 | (10.3,15.2,19.4) | ||
| 35,000–49,999 | 1193 | 13.6 ± 2.71 | (11.9,13.6,15.2) | 16.0 ± 6.84 | (10.9,15.4,19.9) | ||
| 50,000–74,999 | 833 | 13.7 ± 2.65 | (12.2,13.8,15.3) | 16.7 ± 6.98 | (11.8,16.1,20.2) | ||
| 75,000 or more | 471 | 13.9 ± 2.59 | (12.3,13.9,15.3) | 17.1 ± 7.07 | (11.8,16.3,20.9) | ||
| Don’t know | 355 | 13.5 ± 2.51 | (12.0,13.5,15.2) | 16.4 ± 6.69 | (11.6,15.7,20.3) | ||
| Lifestyle | |||||||
| Smoking status | .64 | <.01 | |||||
| Never smoked | 3266 | 13.6 ± 2.70 | (11.9,13.5,15.2) | 15.7 ± 6.77 | (10.6,15.2,19.5) | ||
| Past smoker | 2436 | 13.5 ± 2.70 | (11.8,13.6,15.2) | 16.4 ± 6.99 | (11.2,16.1,20.2) | ||
| Current Smoker | 416 | 13.6 ± 2.74 | (11.9,13.6,15.3) | 16.7 ± 7.24 | (11.6,16.1,20.7) | ||
| Alcohol use | <.01 | <.01 | |||||
| Non-drinker | 774 | 13.8 ± 2.73 | (12.1,13.8,15.5) | 15.0 ± 7.46 | (9.2,13.7,18.8) | ||
| Past drinker | 1178 | 13.6 ± 2.78 | (11.8,13.6,15.5) | 16.1 ± 6.90 | (11.0,15.6,20.0) | ||
| Less than 1 drink per day | 3417 | 13.5 ± 2.67 | (11.8,13.5,15.1) | 16.3 ± 6.83 | (11.3,16.0,20.1) | ||
| More than 1 drink per day | 749 | 13.3 ± 2.66 | (11.8,13.5,14.9) | 15.9 ± 6.52 | (11.1,15.7,19.5) | ||
| Moderate or strenuous activities ≥ 20 minutes | .01 | .55 | |||||
| No activity | 3536 | 13.6 ± 2.69 | (11.9,13.6,15.3) | 16.1 ± 6.92 | (10.9,15.8,20.0) | ||
| Some activity | 309 | 13.8 ± 2.58 | (12.1,13.8,15.3) | 16.4 ± 6.79 | (10.9,16.6,20.0) | ||
| 2–4 episodes/week | 1215 | 13.4 ± 2.78 | (11.7,13.3,15.2) | 16.0 ± 7.10 | (10.8,15.2,19.9) | ||
| ≥4 episodes/week | 1058 | 13.3 ± 2.69 | (11.6,13.4,15.0) | 15.8 ± 6.63 | (10.9,15.3,19.5) | ||
| Physical Health | |||||||
| Hypertension | .33 | .11 | |||||
| No | 3730 | 13.5 ± 2.72 | (11.8,13.5,15.2) | 15.9 ± 6.88 | (10.7,15.6,19.8) | ||
| Yes | 2388 | 13.6 ± 2.68 | (11.9,13.7,15.3) | 16.2 ± 6.93 | (11.1,15.7,20.1) | ||
| Treated hypercholesterolemia | .01 | .09 | |||||
| No | 5040 | 13.5 ± 2.71 | (11.8,13.5,15.2) | 16.0 ± 6.85 | (10.8,15.6,19.8) | ||
| Yes | 1078 | 13.7 ± 2.65 | (11.9,13.7,15.3) | 16.4 ± 7.14 | (11.2,15.7,20.2) | ||
| Diabetes Mellitus | .27 | .05 | |||||
| No | 5729 | 13.5 ± 2.71 | (11.8,13.5,15.2) | 16.0 ± 6.89 | (10.8,15.5,19.8) | ||
| Yes | 389 | 13.9 ± 2.60 | (11.9,13.9,15.4) | 16.7 ± 7.00 | (11.5,16.3,20.3) | ||
| Cardiovascular disease | .48 | .65 | |||||
| No | 5061 | 13.6 ± 2.70 | (11.9,13.5,15.2) | 16.1 ± 6.87 | (10.9,15.5,19.9) | ||
| Yes | 1057 | 13.5 ± 2.72 | (11.7,13.6,15.2) | 16.0 ± 7.04 | (10.5,15.9,19.8) | ||
| Prior hormone therapy | .15 | .41 | |||||
| No | 3312 | 13.6 ± 2.49 | (12.0,13.6,15.1) | 16.1 ± 6.83 | (10.9,15.7,19.9) | ||
| Yes | 2806 | 13.5 ± 2.93 | (11.6,13.52,15.3) | 16.0 ± 6.98 | (10.8,15.5,19.8) | ||
Note:
3-year average of the annual exposure estimated each participant’s location using the regionalized universal kriging approach
p values estimated from ANOVA F-tests or t-tests comparing the mean exposures.
The results of the EFA and CFA support the unidimensional nature of the items from the CES-D and SF-36 (eTables 4–5). In CFA with the analytic sample, all items were significant contributors (over the recommended cutoff of .30) of the latent factor of emotional distress. Items related to depressed mood (factor loading λ=.87) had the highest loading and two anxiety-related items also loaded onto the factor with moderate strengths (λ = .59 to .72), while the items related to restless sleep had the lowest loading (λ=.37).
The results of bivariate SEMs examining the indirect effects of PM2.5 and NO2 on changes in emotional distress are presented in Table 2. The total effects of NO2 (β= −.025; 95% Confidence Interval [CI] = −.054; .005) and PM2.5 (β=−.014; 95% CI = −.046; .019) on changes in emotional distress were not significant. Residing in areas with higher levels of NO2 and PM2.5 was associated with lower initial 3MS performance. As compared with the effect of age on 3MS at the WHIMS baseline (βage = −.128, 95% CI = −.152, −.104), the magnitude of effect estimates for PM2.5 or NO2 exposure (per inter-quartile increment) was slightly more than being one-year older at the WHIMS baseline. Higher NO2 exposure was also associated with more emotional distress at baseline (elevated by .056 standard deviations, per inter-quartile increment of 9.00 ppb), equivalent to half the effect of having high blood pressure (βhypertension =.106, 95% CI = .048, .165). In contrast, PM2.5 exposure was not associated with baseline emotional distress. There was a statistically significant negative effect of baseline 3MS on change of emotional distress (β3MS on Y∆distress= −.008), indicating that older women with lower global cognitive function at baseline tended to report increased emotional distress over the following year. Consequently, there were statistically significant indirect effects of both PM2.5 and NO2 on increased emotional distress mediated by lower performance in baseline 3MS. These significant indirect effects of .001 mean that an IQR increase in exposure was associated with an increase in .001 standard deviations of emotional distress mediated by global cognitive performance. Applying recently published guidelines for effect size interpretation, this observed effect size is considered small yet potentially consequential (Funder & Ozer, 2019). Furthermore, studies show that modest increases in emotional distress may have important subsequent clinical outcomes (Ezzati et al. 2019).
Table 2.
Bivariate Associations between Air Pollution Exposures and Change in Emotional Distress Mediated by Global Cognitive Function from the Women’s Health Initiative Memory Study (N = 6,118).
| Effect Estimates for 3-year average exposures before the baselinea | ||||
|---|---|---|---|---|
| PM2.5b | NO2c | |||
| Outcome | βd | (95% CI) | β d | (95% CI) |
| Estimatesa of Direct Effect | ||||
| Exposure effect on change in emotional distress (βexposure on YΔdistress) | −.026 | (−.056, .004) | −.015 | (−.047, .018) |
| Estimatesa of Indirect Effects and Associated Paths | ||||
| Exposure effects on baseline emotional distress (βexposure on distress) | .013 | (−.023, .049) | .056 | (.016, .096) |
| Exposure effects on baseline 3MS (βexposure on baseline 3MS) | −.144 | (−.261, −.028) | −.157 | (−.291, −.022) |
| Effects of baseline 3MS on change in emotional distress (β3MS on YΔdistress) | −.008 | (−.015, −.002) | −.008 | (−.015, −.002) |
| Indirect exposure effect on changes in emotional distress mediated by baseline 3MS (βexposure on 3MS * β3MS on Δdistress) | .001 | (.001, .003)e | .001 | (.001, .004)e |
| Total exposure effect on changes in emotional distress | −.014 | (−.046, .019) | −.025 | (−.054, .005) |
Note: 3MS = Modified Mini Mental State Examination; Emotional distress = latent emotional distress factor consisting of the 6-items of the Center for Epidemiological Studies Depression Scale and the 5-items of the Short Form Health Survey-36 emotional limitation subscale
All effect estimates were derived from the bivariate multiple-indicator LCS mediation structural equation model as depicted in panel A of Figure 2.
PM2.5 estimates represent the average annual exposure (per interquartile range of 3.37 μg/m3)for the 3-years prior to the WHI baseline assessment.
NO2 estimates represent the average annual exposure (per interquartile range of 9.00 ppb) for the 3-years prior to the WHI baseline assessment.
All reported effect estimates are adjusted for age at WHIMS baseline, race/ethnicity, geographic region of residence, education, household income, employment status, lifestyle factors (smoking, alcohol use, physical activities) and clinical characteristics (use of hormone treatment; hypercholesterolemia, hypertension, diabetes, and history of cardiovascular disease).
Asymmetric 95% confidence interval for indirect effect estimated via Monte Carlo simulation.
Bolded estimates denote PM2.5 or NO2 effects that are statistically significant at p<.05.
In Table 3, we presented the results of multilevel parallel-process SEMs, examining the indirect effect of exposures on longitudinal changes in 3MS with hypothesized mediation by emotional distress at baseline. There were no significant total effects of NO2 or PM2.5 on either linear or quadratic changes in 3MS scores. Emotional distress at baseline was positively associated with NO2 exposure, but not with PM2.5. There were no significant associations between baseline emotional distress and linear (βdistress on linear ∆3MS) or quadratic changes (βdistress on quadratic ∆3MS) in the 3MS. Consequently, there were no statistically significant indirect effects of either PM2.5 or NO2 exposure on changes in 3MS putatively mediated by baseline emotional distress.
Table 3.
Bivariate Associations between Air Pollution Exposures and Change in Global Cognitive Performance Mediated by Baseline Emotional Distress from the Women’s Health Initiative Memory Study (N = 6,118)
| Effect Estimates for 3-year average exposures before the baselinea | ||||
|---|---|---|---|---|
| PM2.5b | NO2c | |||
| Outcome | βd | (95% CI) | βd | (95% CI) |
| Estimatesa of Direct Effects | ||||
| Effect of exposure on annual linear changes in 3MS (βexposure on linear Δ3MS) | .029 | (−.061, .120) | −.037 | (−.155, .081) |
| Effect of exposure on annual quadratic changes in 3MS (βexposure on quadratic Δ3MS) | −.101 | (−.213, .010) | .038 | (−.090, .145) |
| Estimatesa of Indirect Effects and Associated Paths | ||||
| Effects of exposure on baseline emotional distress (βexposure on distress) | .016 | (−.020, .053) | .058 | (.018, .098) |
| Effects of baseline emotional distress on annual linear changes in 3MS (βdistress on linear Δ3MS) | .029 | (−.061, .120) | .032 | (−.059, .123) |
| Effects of baseline emotional distress on annual quadratic changes in 3MS (βdistress on quadratic Δ3MS) | −.040 | (−.139, .059) | −.042 | (−.142, .057) |
| Indirect effect of exposure on linear changes in 3MS (βexposure on distress * βdistress on linear Δ3MS) | .0005 | (−.002, .004)e | .002 | (−.004, .008)e |
| Indirect effect of exposure on quadratic changes in 3MS (βexposure on distress * βexposure on quadratic Δ3MS) | −.0006 | (−.005, .002)e | −.0013 | (−.001, .004)e |
| Total exposure effect on linear changes in 3MS | .030 | (−.062, .121) | −.035 | (−.155, .081) |
| Total exposure effect on quadratic changes in 3MS | −.101 | (−.214, .011) | .037 | (−.089, .144) |
Note: 3MS = Modified Mini Mental State Examination; Emotional distress = latent variable consisting of the 6-items of the Center for Epidemiological Studies Depression Scale and the 5-items of the Short Form Health Survey-36 emotional limitation subscale.
All effect estimates were derived from the bivariate multilevel parallel process structural equation model as depicted in panel B of Figure 2. The baseline emotional distress latent factor was scaled on a z-score metric.
PM2.5 estimates represent the average annual exposure (per interquartile range of 3.37 μg/m3) for the 3-years prior to the WHI baseline assessment.
NO2 estimates represent the average annual exposure (per interquartile range of 9.00 ppb) for the 3-years prior to the WHI baseline assessment.
All reported effect estimates on baseline emotional distress, annual linear and quadratic changes were adjusted for age at WHIMS baseline, race/ethnicity, geographic region of residence, education, household income, employment status, lifestyle factors (smoking, alcohol use, physical activities) and clinical characteristics (use of hormone treatment; hypercholesterolemia, hypertension, diabetes, and history of cardiovascular disease).
Effect estimates on annual linear and quadratic changes on the 3MS are adjusted for region of residence, race/ethnicity, employment status, age, alcohol use, diabetes, and hypertension.
Asymmetric 95% confidence interval for indirect effect estimated via Monte Carlo simulation.
Bolded estimates denote PM2.5 or NO2 effects that are statistically significant at p<.05.
In the supplemental analyses considering the change of emotional health as the putative mediator (eTable 6), we found no direct associations between exposures and the observed one-year change in the latent construct of emotional distress, which did not mediate any hypothesized indirect effects on change in 3MS. In another set of supplemental analyses only using the baseline data (eTable 7), we found empirical evidence supporting the cross-sectional mediation by lower performance in 3MS, leading to statistically significant indirect effects of both exposures on baseline emotional distress. However, after accounting for the alternative paths involving the exposure effects on baseline emotional distress including the above- mentioned cross-sectional mediation (eFigure 8), the observed indirect exposure effects changes in emotional distress mediated by baseline 3MS remained statistically significant (eTable 8) with no notable differences from the results of our main analyses (Table 2).
Results of sensitivity analyses also support the robustness of our findings. Regressing linear and quadratic changes in 3MS on only covariates that were significantly predictive of changes during the follow-up (age at WHIMS, geographic region of residence, education, employment status, alcohol use, hypertension, and diabetes) did not have any notable impacts on the results (eTable 9). After excluding initial 3MS data points that occurred before the assessment of baseline emotional distress, we still found no evidence supporting any observed exposure effect on baseline emotional distress (βexposure on distress) to possibly mediate the air pollution effects on 3MS trajectories (eTable 10). When excluding women who developed dementia by 2010, the associations between PM2.5 exposure and baseline 3MS performance was greatly attenuated and no longer statistically significant (eTable 11). The observed adverse effect of NO2 on baseline 3MS was modestly attenuated but remained statistically significant. The observed positive association between NO2 and baseline emotional distress, however, was largely unchanged in older women who remained cognitively intact until 2010. The indirect association between PM2.5 exposure and changes in emotional distress mediated by baseline 3MS was no longer statistically significant (eTable 11). In contrast, excluding women with incident dementia resulted in mild attenuation of the indirect exposure effect-associated paths (βexposure on 3MS; β3MS on Y∆distress), which remained statistically significant, although the estimate did not reach statistical significance for the indirect association between NO2 exposure and changes in emotional distress mediated by 3MS. Among older women with no self-reported depression before late-life, the observed associations (PM2.5-baseline 3MS; and NO2-baseline 3MS) were slightly attenuated, but all remained statistically significant (eTable 12). The effect of NO2 on baseline emotional distress was also slightly attenuated and no longer statistically significant. Excluding older women with prior depression did not diminish the estimated indirect exposure effects on changes in emotional distress mediated by baseline 3MS (eTable 12). Excluding women with prevalent or incident stroke until 2010 did not diminish the estimated indirect exposure effects on changes in emotional distress mediated by baseline 3MS (eTable 13). When we further adjust for neighborhood socioeconomic characteristics (eTable 14) and hormone assignment (eTable 15), the results were largely unchanged. Lastly, results were largely unchanged if we measured emotional distress when we examine the 6-item CESD (eTable 16) or 5-item SF-36 (eTable 17) separately.
Discussion
In a geographically diverse cohort of women aged 65 or older, long-term exposures to ambient PM2.5 and NO2 estimated at participants’ addresses were directly associated with lower global cognitive performance at baseline, which was associated with increases in emotional distress. We also found that NO2 exposure, but not PM2.5, was directly associated with greater emotional distress at baseline, which however did not lead to any significant indirect effects on the observed trajectories of global cognitive function. There were no direct associations between either PM2.5 or NO2 exposure with the longitudinal increase in emotional distress or change in global cognitive performance. These results were not confounded by socio-demographic factors (age; geographic region; race/ethnicity; education; income), lifestyle (smoking; alcohol; physical activity), employment status or clinical characteristics (diabetes; high cholesterol; hypertension; cardiovascular diseases; hormone therapy). Our findings do not support emotional distress as a neuropsychological mediator of the association between exposures and declining global cognitive performance. Taken together, these results further advance our understanding of the interrelationship of global cognitive ability and emotional distress with air pollution exposure.
Our study provides supporting evidence for indirect adverse associations between exposure to PM2.5 and NO2 on increased emotional distress that are mediated by exposure-associated declines in global cognitive performance. Only one epidemiologic study had examined whether the putative adverse effect of air pollution on mental health is mediated by cognitive ability (Ren et al., 2019). Analyzing cross-sectional data from the China Family Panel Survey, Ren et al. found that exposure to PM2.5 was associated with depressive symptoms, and the reported association was partially mediated by a composite cognitive score consisting of word recall, digit span, word reading, and math ability. Several major methodological limitations of the Ren et al. were addressed in the current study. Using the longitudinal study design, we correctly specified the temporality between repeated neuropsychological assessments, which further allow us to examine the bidirectional associations between cognitive abilities and mental health. Lastly, we examined two measures of air pollutants (PM2.5 and NO2) using well-validated spatiotemporal models. In the current study using SEM, we statistically adjusted for the influences of multiple covariates, and the indirect adverse effect on change in emotional distress mediated by baseline 3MS was found with both long-term exposure to PM2.5 and NO2 (Table 2).
Our study results support the association between cognitive aging and neurotoxic effects of late-life exposure to ambient air pollution. Given the carefully monitored WHIMS clinical data on incident dementia (Shumaker et al., 1998), we were able to restrict the bivariate SEMs to older women who remained cognitively intact throughout the follow-up until 2010. Results of these supplemental analyses (eTable 11) suggest that the observed indirect PM2.5 effect on increased emotional distress mediated by baseline 3MS was attenuated and no longer statistically significant after excluding women who subsequently developed dementia. The attenuation of this indirect effect suggests that the observed indirect PM2.5 effect on increased emotional distress, mediated by baseline global cognitive performance, might coincide with the neuropathological processes underlying dementia. We could not however, rule out other neuropathological processes that may contribute to the observed indirect NO2 effect, since both the estimated adverse exposure effect on 3MS (βexposure on baseline 3MS) and the negative association between baseline 3MS and one-year change in emotional distress (β3MS on ∆distress) remained statistically significant. Observed associations after excluding older women with stroke (eTable 13) suggest that cerebrovascular damage may not have major contributions to the adverse effects on emotional health and cognitive aging affected by neurotoxicity of air pollution exposure in late life. Findings of the current study expand our earlier report that PM2.5 exposure may initially impact memory function and subsequently lead to depressive symptoms (Petkus et al., 2020). In addition to our previous report of associations restricted to episodic memory, our current findings also provide evidence that exposures impact global cognitive ability. In the current report, we showed that in addition to PM2.5, NO2 exposure was associated with lower global cognitive ability which subsequently is associated with emotional distress. One interpretation of these findings is that long-term exposure to air pollution may negatively impact cognitive performance, and the emotional reaction and psychosocial consequences of lower cognitive performance may contribute to increased emotional distress. The observed indirect effect also suggests that air pollution neurotoxicity may perpetuate some underlying brain aging processes, causing damage to brain regions and neural networks essential to maintain episodic memory and emotional health in late life. The latter is supported by the theoretic basis for cognitive control of emotion (Lantrip and Huang, 2017) in older adults and also consistent with recent epidemiological and clinical data (Singh-Manoux et al., 2017) suggesting late-life depressive symptoms as the neuropsychiatric manifestation of dementia.
Our data do not support emotional health as the neuropsychological mediator of global cognitive aging accelerated by air pollution exposure. We observed significant effects of PM2.5 and NO2 exposure on level of 3MS performance but not linear or quadratic change over time. The exposure effect on level of global cognitive performance, but not change, may possibly be due to measurement limitations of the 3MS and minimal observed decline in the 3MS over time. In the bivariate SEMs, we found no statistically significant indirect effects of either PM2.5 or NO2 exposure on annual 3MS trajectories (linear change; quadratic changes), regardless of whether the mediator was defined by the baseline measure (Table 3) or change of emotional distress (eTable 6). Similar lack of significant indirect exposure effects on global cognitive decline was also found in two sets of sensitivity analyses, one based on a simplified SEM only with statistical adjustment for covariates that were significantly associated with 3MS decline during the follow-up (eTable 9) and the other excluding the cognitive measures taken before the initial assessment of emotional distress to better align the temporal relation between the defined mediator and 3MS trajectories (eTable 10). Two published studies attempted to test the hypothesis for the mediation role of emotional health in later life accelerated by air pollution exposure. Tallon et al. (Tallon et al., 2017) found that exposures to PM2.5 and NO2 were associated with worse global cognitive performance and that depressive symptoms partially mediated these associations. However, limited by only two repeated measures, Tallon et al. were unable to examine the change in either the hypothesized mediator or the cognitive outcome, and their reported direct exposure effect was cross-sectional in nature. Using data from the Women’s Health Initiative Study of Cognitive Aging (Petkus et al., 2020), we applied the longitudinal dual-change score SEM models and showed that there was no significant indirect effect of PM2.5 exposure on episodic memory decline putatively mediated by depressive symptoms. Collectively, these epidemiological data suggest that change in emotional distress in late life, including the aggravation of depressive symptoms, is not the primary manifestation of PM2.5 neurotoxicity.
Our study adds several important insights to the emerging field of environmental neurosciences of air pollution neurotoxicity on emotional and cognitive aging. We not only corroborate some observations in the extant literature, but also suggest new evidence for the heterogeneity of exposure effect in late life. First, neither PM2.5 nor NO2 exposure was directly associated with increased emotional distress at one-year follow-up (Table 2). This lack of direct association was consistent with three other reports (Kioumourtzoglou et al., 2017; Pun et al., 2017; Zhang et al., 2019) that studied long-term PM2.5 exposures and included longitudinal data on CES-D with two repeated measures to assess depressive symptoms or define depression in adults, all showing no statistically significant associations. The scenario of a significant indirect effect, in the absence of a significant total effect or direct effect, is also common and called indirect-only mediation (Zhao, Lynch, & Chen, 2010). An explanation for the pattern of findings we observed is that there may be several unmodeled indirect effects of exposure on changes in emotional distress, some of which are in the opposite direct. These unmodeled indirect effects end up canceling each other out, resulting in a total effect of exposure that is not statistically significant in the presence of significant indirect pathways. We do have evidence of an additional indirect effect of exposure on change in emotional distress that is in the opposite direction. Exposure to both NO2 and PM2.5 were associated with higher baseline emotional distress. Due to regression to the mean, women who reported higher emotional distress at baseline tend to report lower depressive symptoms at follow-up. Therefore, a second indirect effect is likely present in that exposure may be indirectly associated with declines in emotional distress at follow-up mediated by exposure effects on baseline depressive symptoms. This negative indirect exposure effect on increases in emotional distress is likely to suppress the total exposure effect of exposure on emotional distress. Another potential biological explanation of the significant indirect effect, in the absence of a total effect, is that air pollution is primarily associated with increases in emotional distress via negative impacts on cognitive performance. Again, suggesting that neurotoxic effects of exposure may contribute first to worse cognitive ability, followed by increased emotional distress. Specific biological responses of long-term exposure to air pollution that are implicated with both emotional distress and worse cognitive performance include neuroinflammation (Block & Calderon-Garciduenas, 2009), atrophy to the prefrontal cortex (Gale et al., 2020), and cerebrovascular disease (Bourdrel et al., 2017). Second, although both exposures had direct associations with lower 3MS, which might then mediate the indirect association with greater emotional distress (Table 3), results from our supplemental analyses (eTable 11) suggest that the neuropathological processes underlying dementia risk may play a more significant role in these associations with PM2.5, but less so for NO2 exposure effects. Third, while there were indirect effects of both exposures on increased emotional distress at baseline (eTable 7) and one-year follow-up (Table 2), only NO2 exposure had a direct positive association with emotional distress at baseline. Fourth, the direct positive association between NO2 exposure and baseline emotional distress was only partly explained by the neuropathological processes underlying dementia risk (eTable 11), and not confounded by prior depression (eTable 12). The consistency in various estimates of direct and indirect exposure effects on emotional distress speaks to the need for studying the neural underpinnings of air pollution neurotoxicity in late life, which may involve networks for general cognitive processes and emotion regulation (Ochsner et al., 2012; Oner, 2018). The prefrontal cortex is an important brain structure that may be vulnerable to the negative impact of air pollution and implicated in emotional regulation and cognitive performance in later life. Future studies should examine the role of the prefrontal cortex as a possible structural mediator of the association between air pollution exposure and emotional distress in later life.
We recognize several limitations of our study. First, although the national spatiotemporal models to estimate annual PM2.5 and NO2 exposure were statistically cross-validated, the resulting exposure estimates were still subject to measurement errors. Second, emotional distress was only measured at two time points which prevented the examination of trajectories of emotional distress via multilevel SEM. Third, we only focused on two measures of outdoor air pollution and did not investigate other sources (e.g., indoor or occupational) of exposures or their possible interactions. Lastly, our findings on women participating in the WHI clinical trials may not be generalizable to men and or other women from the same geographic areas.
Conclusions
Our study provides epidemiologic evidence that long-term PM2.5 and NO2 exposure in late-life may impact cognitive and emotional health. Exposure was indirectly associated with increases in emotional distress through lower global cognitive performance. Our data did not support emotional distress as the neuropsychological mediator of PM2.5 and NO2 exposure related declines on global cognitive performance. Increases in emotional distress may result indirectly from lower global cognitive performance associated with late-life exposure to ambient air pollutants.
Supplementary Material
Highlights.
We examined exposure to air pollution with emotional and cognitive health.
Women with higher PM2.5 and NO2 exposure had worse baseline cognitive performance.
Women with worse cognitive performance had increases in emotional distress.
Cognitive ability mediated pollutant effects on increases in emotional distress.
Acknowledgments:
We would like to acknowledge and thank the women who participated in this study and Mr. Karl O’Sharkey for his work formatting the manuscript.
Funding:
The WHIMS was funded by Wyeth Pharmaceuticals, St Davids, PA,USA, and Wake Forest University. This study and related research are supported by the National Institute of Environmental Health Sciences (R01ES025888; 5P30ES007048), the National Institute on Aging (R01AG033078) and The Alzheimer’s Disease Research Center at USC (P50AG005142). Petkus and Chen are supported in part by the RF1AG054068. Younan and Chen are also supported by the P01AG055367. The Women’s Health Initiative Study of Cognitive Aging was supported by the Department of Health and Human Services and the National Institute on Aging (N01-AG-1–2106), The WHI program is funded by the National Heart, Lung, and Blood Institute (NIH) through contracts HHSN268201100046C, HHSN268201100001C, HHSN268201100002C, HHSN268201100003C, HHSN268201100004C and HHSN271201100004C. The air pollution models were developed under a STAR research assistance agreement, No. RD831697 (MESA Air) and RD-83830001 (MESA Air Next Stage), awarded by the US Environmental Protection Agency (EPA).
Footnotes
Publisher's Disclaimer: This is a PDF file of an unedited manuscript that has been accepted for publication. As a service to our customers we are providing this early version of the manuscript. The manuscript will undergo copyediting, typesetting, and review of the resulting proof before it is published in its final form. Please note that during the production process errors may be discovered which could affect the content, and all legal disclaimers that apply to the journal pertain.
Code availability: Available upon request
Availability of data and material: Access to all data elements used in this study may be made available following the established Women’s Health Initiative policies.
Consent to participate: All participants provided informed consent to participate.
Consent for publication: All coauthors provided consent to submit paper for publication.
Declaration of interests
The authors declare that they have no known competing financial interests or personal relationships that could have appeared to influence the work reported in this paper.
References
- Barlow DH, Farchione TJ, Bullis JR, Gallagher MW, Murray-Latin H, Sauer-Zavala S, Bentley KH, Thompson-Hollands J, Conklin LR, Boswell JF, Ametaj A, Carl JR, Boettcher HT, Cassiello-Robbins C, 2017. The Unified Protocol for Transdiagnostic Treatment of Emotional Disorders Compared With Diagnosis-Specific Protocols for Anxiety Disorders: A Randomized Clinical Trial. JAMA Psychiatry 74, 875–884. [DOI] [PMC free article] [PubMed] [Google Scholar]
- Bejot Y, Reis J, Giroud M, Feigin V, 2018. A review of epidemiological research on stroke and dementia and exposure to air pollution. Int J Stroke 13, 687–695. [DOI] [PubMed] [Google Scholar]
- Bergen S, Sheppard L, Sampson PD, Kim SY, Richards M, Vedal S, Kaufman JD, Szpiro AA, 2013. A national prediction model for PM2.5 component exposures and measurement error-corrected health effect inference. Environ Health Perspect 121, 1017–1025. [DOI] [PMC free article] [PubMed] [Google Scholar]
- Block ML, Calderon-Garciduenas L, 2009. Air pollution: mechanisms of neuroinflammation and CNS disease. Trends Neurosci 32, 506–516. [DOI] [PMC free article] [PubMed] [Google Scholar]
- Bourdrel T, Bind MA, Bejot Y, Morel O, Argacha JF, 2017. Cardiovascular effects of air polltution. Arch Cardiovasc Dis 110, 634–642. [DOI] [PMC free article] [PubMed] [Google Scholar]
- Brown TA, Barlow DH, 2009. A proposal for a dimensional classification system based on the shared features of the DSM-IV anxiety and mood disorders: implications for assessment and treatment. Psychol Assess 21, 256–271. [DOI] [PMC free article] [PubMed] [Google Scholar]
- Byers AL, Yaffe K, 2011. Depression and risk of developing dementia. Nat Rev Neurol 7, 323–331. [DOI] [PMC free article] [PubMed] [Google Scholar]
- Cacciottolo M, Wang X, Driscoll I, Woodward N, Saffari A, Reyes J, Serre ML, Vizuete W, Sioutas C, Morgan TE, Gatz M, Chui HC, Shumaker SA, Resnick SM, Espeland MA, Finch CE, Chen JC, 2017. Particulate air pollutants, APOE alleles and their contributions to cognitive impairment in older women and to amyloidogenesis in experimental models. Transl Psychiatry 7, e1022. [DOI] [PMC free article] [PubMed] [Google Scholar]
- Chen H, Kwong JC, Copes R, Hystad P, van Donkelaar A, Tu K, Brook JR, Goldberg MS, Martin RV, Murray BJ, Wilton AS, Kopp A, Burnett RT, 2017. Exposure to ambient air pollution and the incidence of dementia: A population-based cohort study. Environ Int 108, 271–277. [DOI] [PubMed] [Google Scholar]
- Cheong J, Mackinnon DP, Khoo ST, 2003. Investigation of Mediational Processes Using Parallel Process Latent Growth Curve Modeling. Struct Equ Modeling 10, 238. [DOI] [PMC free article] [PubMed] [Google Scholar]
- Ezzati A, Katz MJ, Derby CA, Zimmerman ME, Lipton RB, 2019. Depressive symptoms predict incident dementia in a community sample of older adults: Results from the Einstein Aging Study. J Geriatr Psychiatry Neurol [DOI] [PMC free article] [PubMed] [Google Scholar]
- Funder DC, Ozer DJ, 2019. Evaluating effect size in psychological research: Sense and nonsense. Advances in Methods and Practices in Psychological Science 2, 156–168. [Google Scholar]
- Gale SD, Ercickson LD, Anderson JE, Brown BL, Hedges DW, 2020. Association between exposure to air pollution and prefrontal cortical volume in adults: A cross-sectional study from the UK biobank. Environmental Research 185, 109365. [DOI] [PubMed] [Google Scholar]
- Hallquist MN, Wiley JF, 2018. MplusAutomation: An R Package for Facilitating Large-Scale Latent Variable Analyses in Mplus. Structural Equation Modeling: A Multidisciplinary Journal 25, 621–638. [DOI] [PMC free article] [PubMed] [Google Scholar]
- Hayes A, 2018. Introduction to mediation, moderation, and conditional process analysis: A regression-based approach, 2nd ed. Guilford Press, New York. [Google Scholar]
- Ho D.a.E., Imai K, King G, Stuart EA, 2011. Matchit: Nonparametric preprocessing for parametric causal inference. Journal of Statistical Software 42, 1–28. [Google Scholar]
- Kievit RA, Brandmaier AM, Ziegler G, van Harmelen AL, de Mooij SMM, Moutoussis M, Goodyer IM, Bullmore E, Jones PB, Fonagy P, Consortium N, Lindenberger U, Dolan RJ, 2018. Developmental cognitive neuroscience using latent change score models: A tutorial and applications. Dev Cogn Neurosci 33, 99–117. [DOI] [PMC free article] [PubMed] [Google Scholar]
- Kioumourtzoglou MA, Power MC, Hart JE, Okereke OI, Coull BA, Laden F, Weisskopf MG, 2017. The Association Between Air Pollution and Onset of Depression Among Middle-Aged and Older Women. Am J Epidemiol 185, 801–809. [DOI] [PMC free article] [PubMed] [Google Scholar]
- Lantrip C, Huang JH, 2017. Cognitive Control of Emotion in Older Adults: A Review. Clin Psychiatry (Wilmington) 3. [DOI] [PMC free article] [PubMed] [Google Scholar]
- Lim YH, Kim H, Kim JH, Bae S, Park HY, Hong YC, 2012. Air pollution and symptoms of depression in elderly adults. Environ Health Perspect 120, 1023–1028. [DOI] [PMC free article] [PubMed] [Google Scholar]
- Mohamed S, Rosenheck R, Lyketsos CG, Schneider LS, 2010. Caregiver burden in Alzheimer disease: cross-sectional and longitudinal patient correlates. Am J Geriatr Psychiatry 18, 917–927. [DOI] [PMC free article] [PubMed] [Google Scholar]
- Muthén LK, Muthén BO, 1998–2018. Mplus User’s Guide. Eighth Edition. Muthén & Muthén, Los Angeles, CA. [Google Scholar]
- Ochsner KN, Silvers JA, Buhle JT, 2012. Functional imaging studies of emotion regulation: a synthetic review and evolving model of the cognitive control of emotion. Ann N Y Acad Sci 1251, E1–24. [DOI] [PMC free article] [PubMed] [Google Scholar]
- Oner S, 2018. Neural substrates of cognitive emotion regulation: A brief review. Psychiatry and Clinical Psychopharmacology 28. [Google Scholar]
- Oudin A, Forsberg B, Adolfsson AN, Lind N, Modig L, Nordin M, Nordin S, Adolfsson R, Nilsson LG, 2016. Traffic-Related Air Pollution and Dementia Incidence in Northern Sweden: A Longitudinal Study. Environ Health Perspect 124, 306–312. [DOI] [PMC free article] [PubMed] [Google Scholar]
- Peters R, Ee N, Peters J, Booth A, Mudway I, Anstey KJ, 2019. Air Pollution and Dementia: A Systematic Review. J Alzheimers Dis 70, S145–S163. [DOI] [PMC free article] [PubMed] [Google Scholar]
- Petkus AJ, Younan D, Wang X, Serre M, Vizuete W, Resnick S, Espeland MA, Gatz M, Chui H, Manson JE, Chen JC, 2019. Particulate Air Pollutants and Trajectories of Depressive Symptoms in Older Women. Am J Geriatr Psychiatry 27, 1083–1096. [DOI] [PMC free article] [PubMed] [Google Scholar]
- Petkus AJ, Younan D, Widaman K, Gatz M, Manson JE, Wang X, Serre M, Vizuete W, Chui H, Espeland MA, Resnick S, Chen JC, 2020. Exposure to fine particulate matter and temporal dynamics of episodic memory and depressive symptoms in older women. Environ Int 135, 105196. [DOI] [PMC free article] [PubMed] [Google Scholar]
- Pun VC, Manjourides J, Suh H, 2017. Association of Ambient Air Pollution with Depressive and Anxiety Symptoms in Older Adults: Results from the NSHAP Study. Environ Health Perspect 125, 342–348. [DOI] [PMC free article] [PubMed] [Google Scholar]
- Qi L, Nassir R, Kosoy R, Garcia L, Curb JD, Tinker L, Howard BV, Robbins J, Seldin MF, 2012. Relationship between diabetes risk and admixture in postmenopausal African-American and Hispanic-American women. Diabetologia 55, 1329–1337. [DOI] [PMC free article] [PubMed] [Google Scholar]
- Radloff LS, 1977. The CES-D scale: A self-report depression scale for research in the general population. Applied Psychological Measurement 1, 385–401. [Google Scholar]
- Ren T, Yu X, Yang W, 2019. Do cognitive and non-cognitive abilities mediate the relationship between air pollution exposure and mental health? PLoS One 14, e0223353. [DOI] [PMC free article] [PubMed] [Google Scholar]
- Reynolds K, Pietrzak RH, El-Gabalawy R, Mackenzie CS, Sareen J, 2015. Prevalence of psychiatric disorders in U.S. older adults: findings from a nationally representative survey. World Psychiatry 14, 74–81. [DOI] [PMC free article] [PubMed] [Google Scholar]
- Robins LN, Helzer JE, Croughan J, Ratcliff KS, 1981. National Institute of Mental Health Diagnostic Interview Schedule. Its history, characteristics, and validity. Arch Gen Psychiatry 38, 381–389. [DOI] [PubMed] [Google Scholar]
- Sampson PD, Richards M, Szpiro AA, Bergen S, Sheppard L, Larson TV, Kaufman JD, 2013. A regionalized national universal kriging model using Partial Least Squares regression for estimating annual PM2.5 concentrations in epidemiology. Atmos Environ (1994) 75, 383–392. [DOI] [PMC free article] [PubMed] [Google Scholar]
- Sauer-Zavala S, Wilner JG, Barlow DH, 2017. Addressing neuroticism in psychological treatment. Personal Disord 8, 191–198. [DOI] [PubMed] [Google Scholar]
- Shumaker SA, Legault C, Kuller L, Rapp SR, Thal L, Lane DS, Fillit H, Stefanick ML, Hendrix SL, Lewis CE, Masaki K, Coker LH, Study W.s.H.I.M., 2004. Conjugated equine estrogens and incidence of probable dementia and mild cognitive impairment in postmenopausal women: Women’s Health Initiative Memory Study. JAMA 291, 2947–2958. [DOI] [PubMed] [Google Scholar]
- Shumaker SA, Legault C, Rapp SR, Thal L, Wallace RB, Ockene JK, Hendrix SL, Jones BN, Assaf AR, Jackson RD, Kotchen JM, Wassertheil-Smoller S, Wactawski-Wende J, Investigators W, 2003. Estrogen plus progestin and the incidence of dementia and mild cognitive impairment in postmenopausal women: the Women’s Health Initiative Memory Study: a randomized controlled trial. JAMA 289, 2651–2662. [DOI] [PubMed] [Google Scholar]
- Shumaker SA, Reboussin BA, Espeland MA, Rapp SR, McBee WL, Dailey M, Bowen D, Terrell T, Jones BN, 1998. The Women’s Health Initiative Memory Study (WHIMS): a trial of the effect of estrogen therapy in preventing and slowing the progression of dementia. Control Clin Trials 19, 604–621. [DOI] [PubMed] [Google Scholar]
- Singh-Manoux A, Dugravot A, Fournier A, Abell J, Ebmeier K, Kivimaki M, Sabia S, 2017. Trajectories of Depressive Symptoms Before Diagnosis of Dementia: A 28-Year Follow-up Study. JAMA Psychiatry 74, 712–718. [DOI] [PMC free article] [PubMed] [Google Scholar]
- Snyder HM, Asthana S, Bain L, Brinton R, Craft S, Dubal DB, Espeland MA, Gatz M, Mielke MM, Raber J, Rapp PR, Yaffe K, Carrillo MC, 2016. Sex biology contributions to vulnerability to Alzheimer’s disease: A think tank convened by the Women’s Alzheimer’s Research Initiative. Alzheimers Dement 12, 1186–1196. [DOI] [PMC free article] [PubMed] [Google Scholar]
- Tallon LA, Manjourides J, Pun VC, Salhi C, Suh H, 2017. Cognitive impacts of ambient air pollution in the National Social Health and Aging Project (NSHAP) cohort. Environ Int 104, 102–109. [DOI] [PMC free article] [PubMed] [Google Scholar]
- Teng EL, Chui HC, 1987. The Modified Mini-Mental State (3MS) examination. J Clin Psychiatry 48, 314–318. [PubMed] [Google Scholar]
- The Women’s Health Initiative Study Group, 1998. Design of the Women’s Health Initiative clinical trial and observational study. Control Clin Trials 19, 61–109. [DOI] [PubMed] [Google Scholar]
- Tucker-Drob EM, 2011. Global and domain-specific changes in cognition throughout adulthood. Dev Psychol 47, 331–343. [DOI] [PMC free article] [PubMed] [Google Scholar]
- van Agtmaal MJM, Houben A, Pouwer F, Stehouwer CDA, Schram MT, 2017. Association of Microvascular Dysfunction With Late-Life Depression: A Systematic Review and Meta-analysis. JAMA Psychiatry 74, 729–739. [DOI] [PMC free article] [PubMed] [Google Scholar]
- Ware JE Jr., Sherbourne CD, 1992. The MOS 36-item short-form health survey (SF-36). I. Conceptual framework and item selection. Med Care 30, 473–483. [PubMed] [Google Scholar]
- Whitsel EA, Rose KM, Wood JL, Henley AC, Liao D, Heiss G, 2004. Accuracy and repeatability of commercial geocoding. Am J Epidemiol 160, 1023–1029. [DOI] [PubMed] [Google Scholar]
- Wimo A, Guerchet M, Ali GC, Wu YT, Prina AM, Winblad B, Jonsson L, Liu Z, Prince M, 2017. The worldwide costs of dementia 2015 and comparisons with 2010. Alzheimers Dement 13, 1–7. [DOI] [PMC free article] [PubMed] [Google Scholar]
- Wolitzky-Taylor KB, Castriotta N, Lenze EJ, Stanley MA, Craske MG, 2010. Anxiety disorders in older adults: a comprehensive review. Depress Anxiety 27, 190–211. [DOI] [PubMed] [Google Scholar]
- Young MT, Bechle MJ, Sampson PD, Szpiro AA, Marshall JD, Sheppard L, Kaufman JD, 2016. Satellite-Based NO2 and Model Validation in a National Prediction Model Based on Universal Kriging and Land-Use Regression. Environ Sci Technol 50, 3686–3694. [DOI] [PMC free article] [PubMed] [Google Scholar]
- Zhang Z, Zhao D, Hong YS, Chang Y, Ryu S, Kang D, Monteiro J, Shin HC, Guallar E, Cho J, 2019. Long-Term Particulate Matter Exposure and Onset of Depression in Middle-Aged Men and Women. Environ Health Perspect 127, 77001. [DOI] [PMC free article] [PubMed] [Google Scholar]
Associated Data
This section collects any data citations, data availability statements, or supplementary materials included in this article.