

Abstract
Neuroinflammation is a key element of AD pathology and conceivably a result of a disturbed resolution. Resolution of inflammation is an active process which is strictly orchestrated following the acute inflammatory response after removal of the inflammatory stimuli. Acute inflammation is actively terminated by specialized pro‐resolving mediators (SPMs) thereby promoting healing and return to homeostasis. Failed resolution may contribute to persistent neuroinflammation and aggravate AD pathology. BLT1 (leukotriene B4 receptor) and ChemR23 (chemerin receptor 23) are receptors for the SPM resolvin (Rv) E1 and are important clinical targets for ending inflammation. In AD, the levels of SPMs are decreased, and pro‐inflammatory mediators are increased. In the current study, the distribution of BLT1 and ChemR23 receptors in control brains and in AD as well as correlations with AD pathology was examined for the first time. BLT1 and ChemR23 were analyzed in different regions of post‐mortem human brain from cases with AD, early‐onset AD and mild cognitive impairment (MCI) and healthy controls, using western blotting and immunohistochemistry. BLT1 and ChemR23 were detected in neurons and glial cells in all examined regions of the human brain, with markedly higher levels in AD than in controls. The receptor levels correlated with the density of staining for the inflammation markers HLA‐DR and YKL‐40 for microglia and astrocytes, respectively, and elevated staining coincided with high Braak stages in AD. The relative staining densities of these receptors were higher in the basal forebrain, cingulate gyrus and hippocampal regions compared to the cerebellum and frontal cortex (BA46).
In conclusion, alterations in the expression of the resolution receptor BLT1 in AD have not been reported previously and the changes in both BLT1 and ChemR23 suggest a disturbed resolution pathway in several regions of the AD brain that may play a role in disease pathology.
Keywords: Alzheimer's disease, amyloid, Braak, immunohistochemistry, resolution of inflammation, specialized pro‐resolving mediators
Abbreviations
- AA
arachidonic acid
- Aβ
amyloid β
- AD
Alzheimer's disease
- AP
alkaline phosphatase
- BF
basal forebrain
- BLT1
leukotriene B4 receptor
- CA
cornu Ammonis
- CB
cerebellum
- CG
cingulate gyrus
- ChemR23
chemerin receptor 23 or Chemokine‐like receptor 1
- CNS
central nervous system
- COX‐2
cyclooxygenase‐2
- DAB
diaminobenzidine
- DG
dentate gyrus
- eAD
early‐onset AD
- ENT
entorhinal cortex
- EPA
eicosapentaenoic acid
- GFAP
glial fibrillary acidic protein
- GPCRs
G protein‐coupled receptors
- HLA‐DR
human leukocyte antigen–D‐related
- HRP
horseradish peroxidase
- H2O2
hydrogen peroxide
- LTB4
leukotriene B4
- LC
locus coeruleus
- MCI
mild cognitive impairment
- MDD
major depressive disorder
- MVA
multivariate analysis
- MW
molecular weight
- NK
natural killer
- NFTs
neurofibrillary tangles
- α7nAChR
α7 nicotinic acetylcholine receptor
- NF‐κB
nuclear factor κB
- OPLS
orthogonal projections to latent structures
- OPLS‐DA
orthogonal projections to latent structure–discriminant analysis
- PBS
phosphate‐buffered saline
- PCA
principal component analysis
- p‐Tau
phosphorylated tau
- PMI
post‐mortem interval
- RvE1
resolvin E1
- RT
room temperature
- SPMs
specialized pro‐resolving mediators
- TNF‐α
tumor necrosis factor α
- TNFR1
TNF receptor 1
- TB
true black
- YKL‐40
chitinase 3‐like protein 1
- 5‐LOX
5‐lipoxygenase
- WB
western blot
Background
Inflammation with activated glia and increased levels of pro‐inflammatory and cytotoxic factors characterizes the brain pathology in Alzheimer's disease (AD) 19, 32, in addition to the classical pathological hallmarks, intracellular aggregates of hyper‐phosphorylated tau protein (p‐Tau) in neurofibrillary tangles (NFTs) and extracellular deposits of amyloid β (Aβ) peptide in amyloid plaques. Neuroinflammation has received increasing attention in the AD field with a potential for development of novel drug therapies that can prevent accumulation of AD pathologies. Because completely blocking inflammation may not be the best solution [see eg, 91], we have focused on the end of inflammation—the resolution process.
Resolution of inflammation represents the end stage of inflammation, actively mediated by specialized pro‐resolving lipid mediators (SPMs). The SPMs are derived from the omega‐3 and omega‐6 fatty acids (FAs) docosahexanoic acid (DHA), eicosapentaenoic acid (EPA) and arachidonic acid (AA) and have been shown to mediate downregulation of pro‐inflammatory markers and mediators, as well as other actions that promote the return to homeostasis 69, 72, 75. The initial and executive immune responses, such as activation and recruitment of immune cells, phagocytosis and destruction of pathogens also have detrimental and damaging effects on the surrounding tissue. When the activating stimuli are removed, the inflammation is meant to be downregulated by entering a state of resolution 69, 72, 76. A failure in the resolution phase of inflammation has been shown in disorders with a deleterious inflammatory component, including cystic fibrosis, asthma, atherosclerosis, periodontitis and cancer [22, 27, 33, 40, 43, 49, see also 70, 71]. Considerable knowledge has been acquired regarding the resolution of inflammation in the periphery, whereas the resolution stage of inflammation in the brain and neurodegenerative disorders is relatively unexplored so far.
We and others have shown that the resolution pathway is disturbed in AD 47, 85, 92, a disease characterized by a chronic inflammatory process in the brain. Thus, decreased levels of the SPMs neuroprotectin D1 (NPD1), and its precursor DHA, were shown in post‐mortem AD brain tissue 47, and, more recently, we demonstrated decreased levels of the SPMs lipoxin A4 (LXA4), maresin 1 (MaR1) and resolvin (Rv) D5 in AD brain 85, 92, as well as reduced levels of LXA4 in cerebrospinal fluid (CSF) samples from AD patients 85.
The abnormally high levels of Aβ peptide in AD conceivably induce inflammation as a protective host response including the activation of glial cells, as shown in in vitro studies 18. Conversely, activation of glia causes increased Aβ peptide formation resulting in a vicious circle 31, and ultimately chronic inflammation in which persistent activation caused by long‐lasting increases in Aβ induces the release of free radicals, cytokines, chemokines, leukotrienes and prostaglandins that can impair the function of and eventually kill neurons. The resolution is an active process that “normally” terminates inflammation during an infection or local injury and is intimately linked to the regenerative processes that promote healing of the tissue. Thus, inflammation is downregulated and the affected tissue shows restorative and regenerative activities such as increased phagocytosis of cellular and molecular debris together with increased trophic activity 72. These actions are orchestrated by the SPMs produced through an enzymatic pathway involving the activities of cyclooxygenase‐2 (COX‐2) and 5‐ and 15‐lipoxygenases (LOX) 64.
SPMs act through multi‐ligand receptors, leading to down‐regulation of pro‐inflammatory markers and mediators, as well as other actions that promote the return to homeostasis 69, 72, 75. Resolvin E1(RvE1), a derivative of EPA, is generated by the activity of the COX‐2 and 5‐LOX enzymes 73. RvE1 inhibits migration of neutrophils into sites of inflammation, reduces inflammatory mediators and induces anti‐inflammatory cytokines to promote homeostasis 62, 74. Pro‐resolving signals of RvE1 are conveyed through two G protein‐coupled receptors (GPCRs), that is, ChemR23 (chemerin receptor 23 or chemokine‐like receptor 1), and BLT1 (leukotriene B4 receptor 1) 4.
ChemR23 is detected in many tissues such as the spleen, thymus, liver and bone marrow and has a role in modulating leukocyte functions 24. It is expressed on monocytes, macrophages, natural killer (NK) cells, adipocytes and endothelial cells 28, 41, 55, 65. We have demonstrated the presence of ChemR23 in both glial cells and neurons 85. ChemR23 is considered to induce pro‐inflammatory, anti‐inflammatory and pro‐resolving activities depending on the ligand, active chemerin/synthetic chemerin or RvE1, respectively 3, 12, 86. Binding of chemerin increases cell migration by stimulating chemotaxis of dendritic cells and macrophages 46. Interaction of RvE1 with ChemR23 has the opposite effect, that is, decreased leukocyte infiltration, together with decreased pro‐inflammatory gene expression and tumor necrosis factor (TNF)‐α‐induced nuclear factor (NF)‐κB activation, as well as increased phagocytic clearance of granulocytes 3. A recent study showed that Aβ can induce microglial migration in a ChemR23‐dependent way 56. In animal models, RvE1 promotes resolution of inflammation in a ChemR23‐dependent manner 52.
BLT1 is a high‐affinity receptor for leukotriene (LT) B4, and RvE1 is a partial agonist competing with LTB4 for binding 6, and there is evidence from electric cell substrate impedance sensing (ECIS) analysis that also MaR1 interacts with BLT1 as a partial agonist as well as antagonizes the activation of BLT1 by LTB4 14. The BLT1 receptor is widely expressed in different subsets of leukocytes (granulocytes, monocytes and macrophages) and non‐myeloid cells (vascular smooth muscle and endothelial cells) 68, 80, 90. Until now, there is no information regarding the occurrence of BLT1 in the human brain, and its role in AD is unknown. It is important to investigate the distribution and role of BLT1 in AD in order to reveal potential translational use of BLT1 antagonists for clinical intervention.
In AD, inflammation is prominent and detrimental, with impaired phagocytic clearance of Aβ and dysfunctional neurotrophic signaling. One cause for this may be the disturbed resolution of inflammation that we have previously shown to exist in the AD hippocampus, a brain region that is strongly affected at an early stage of the disease, and that plays an important role for learning and memory 57. Other brain regions are also affected in AD, motivating analysis of the state of resolution not only in the hippocampus.
Several lines of evidence have shown that tau and Aβ deposition result in early pathological changes in basal forebrain (BF). Cholinergic neurons in BF degenerate in the early stages of AD and are strongly associated with the deterioration of cognitive processes 26. Drugs enhancing the function of BF cholinergic neurons represent one out of only a few existing drug intervention strategies for AD 34, demonstrating the strong contribution of these neurons to memory and learning processes. In terms of the progressive spread of neurodegeneration, inflammation and molecular pathology throughout more severe stages of AD, it is important to know which mechanisms that contribute to vs. stop this spread of pathology if an effective treatment for AD is to be developed. The multiple functions of the BLT1 and ChemR23 receptors make them good candidates for contributing to the spread of AD pathology if the levels of pro‐resolving ligands are decreased, while at the same time, pro‐inflammatory and neurotoxic ligands such as Aβ, chemerin or LTB4 are increased. Therefore, it is important to investigate whether these receptors are altered in AD and whether their cellular or regional expression correlates with other pathological alterations of AD.
In the current study, we hypothesized that SPM receptors would be altered in the brain of people with AD, both in a regional and cell‐specific manner, and that these alterations would reflect reduced capability of resolving inflammation. We therefore characterized the distribution of resolution receptors, microglial number and activation, inflammation and molecular pathology of AD in different regions of the brain in well‐characterized post‐mortem human tissues. These findings may provide a better understanding of whether the resolution pathways via the BLT1 and ChemR23 receptors are altered at different stages of AD, and whether potential alterations coincide with or precede AD pathology, thus providing potential new targets for drug development.
Methods
Post‐mortem brain tissue
Brain specimens from 22 autopsy cases, aged 53–100 were analyzed. The cases included one case clinically diagnosed with mild cognitive impairment (MCI), 3 early‐onset (e) AD cases (<60 years old at the time of diagnosis), 9 clinically diagnosed AD cases, and 9 age‐matched control subjects with no clinically reported cognitive impairments (Table 1). The post‐mortem consent, brain collection, fixation and standardized neuropathological assessments were performed according to the protocol of the Alzheimer's Disease Neuroimaging Initiative (ADNI) 10 and according to standard operating procedures (SOP) of the Carroll A. Campbell Jr. Neuropathology Laboratory (CCNL) Brain Bank at the Medical University of South Carolina (MUSC). The brain tissues, that is, BF, hippocampus, entorhinal cortex (ENT), Brodmann area 46 (BA46), cingulate gyrus (CG) and cerebellum (CB), were dissected in the CCNL Brain Bank at the Medical University of South Carolina (MUSC) in Charleston, SC.
Table 1.
Demographic and pathological data. Information on age, gender, post‐mortem interval, Braak stage, Thal phase, neuritic plaque scoring and cause of death for the subjects in the study. Silver‐stained hippocampal and temporal cortex sections from all cases were given scores according to established criteria. Natural progression = Death from the progression of AD. Pneumonia is a common cause of death for patients with AD because of impaired swallowing that lets food or drinks enter the lungs and result in infection. Abbreviations: AD = Alzheimer's disease, Ctl = control, eAD = early onset AD, F = female, M = male, MCI = mild cognitive impairment, PMI = post‐mortem interval in hours, N/A = not available.
| Group | Sex | Age (years) | PMI (h) | APOE | Braak stage (0–VI) | Thal phase (0–5) | Neuritic plaques (0–3) | Cause of death |
|---|---|---|---|---|---|---|---|---|
| AD | F | 82 | 6 | E3/E4 | V | 5 | 3 | Natural progression |
| AD | F | 91 | 3.5 | E3/E4 | VI | 4 | 1 | Natural progression |
| AD | M | 84 | 11.8 | E3/E4 | VI | 5 | 1.5 | Natural progression |
| AD | F | 89 | 10.5 | E3/E3 | VI | 5 | 2 | Natural progression |
| AD | M | 84 | 11 | E4/E4 | VI | 4 | 1 | Natural progression |
| AD | F | 81 | 20 | E3/E4 | VI | 5 | 3 | Natural progression |
| AD | M | 70 | 8.5 | E3/E4 | V–VI | 5 | 2 | Acute stroke |
| AD | F | 85 | 4.8 | E3/E4 | VI | 5 | 3 | COPD complication |
| AD | M | 86 | 25.5 | E3/E3 | VI | 5 | 3 | Natural progression |
| eAD | F | 60 | 4.3 | E3/E4 | IV | 5 | 2 | Respiratory failure, cardiac arrest |
| eAD | F | 55 | 8.3 | E3/E4 | IV | 2 | 1 | Natural progression |
| eAD | M | 74 | N/A | N/A | III | 5 | 1 | Multisystem organ failure |
| MCI | F | 95 | 4.7 | E3/E3 | V–VI | 5 | 1 | Heart failure |
| Ctl | M | 88 | N/A | E3/E3 | IV | 2 | 0 | N/A |
| Ctl | F | 85 | 22 | E3/E3 | 0 | 0 | 0 | N/A |
| Ctl | F | 100 | 11.5 | E3/E3 | I | 3 | 0.5 | Heart failure |
| Ctl | M | 61 | 16 | E2/E3 | II | 0 | 0 | Cardiac arrest |
| Ctl | M | 59 | 16.3 | E3/E3 | II | 0 | 0 | Cardiac arrest |
| Ctl | F | 56 | 17.3 | N/A | I–II | 0 | 0 | Respiratory failure |
| Ctl | F | 53 | 19.8 | E3/E3 | I–II | 0 | 0 | Cardiac pulmonary, aneurysm |
| Ctl | M | 78 | 9.3 | E3/E4 | I | 0 | 0 | Cardiac pulmonary, aneurysm |
| Ctl | F | 80 | 7 | E3/E3 | 0 | 0 | 0 | Cancer metastasized |
Each brain was cut in 1‐cm coronal slices which were photographed, and the left hemisphere was dissected, frozen and stored at −80°C for biochemical analysis. The right hemisphere slices from each brain were fixed for 72 h free‐floating in 4% paraformaldehyde, after which they were transferred to a cryoprotectant solution and stored in −20°C until dissection. Tissue blocks from different regions were dissected and embedded in paraffin for morphological analysis. Neuropathological staging of AD cases was performed using haematoxylin and eosin routine staining, Bielschowsky silver stain, p‐Tau immunostaining (AT8 antibodies) and Aβ staining (Amylo‐Glo/EB kit, TR‐400‐AG, Biosensis, Australia), according to the published NIA/AA staging protocol 39. The tissue blocks were cut into 5‐µm‐thick sections on a sliding microtome and mounted onto polarized glass slides.
There was no statistical difference in age or post‐mortem interval (PMI) between the AD and control group (Table 2), suggesting that PMI was not responsible for group differences observed. The studies were conducted according to Good Clinical Practice guidelines, the Declaration of Helsinki, US 21CFR Part 50—Protection of Human Subjects, and Part 56—IRB, and they were conducted according to the state and federal HIPAA regulations, and were approved by the University of Denver (DU) IRB (1064064‐1). Post‐mortem consent was obtained from each donor according to the tissue donation laws in South Carolina (SC Anatomical Gift Act, Article 1, Chapter 44, Title 44, Code of SC Laws 1976). The studies were performed under an approved Non‐Human Research (NHR) protocol from the appropriate local IRB committee.
Table 2.
Comparison of age and PMI in the AD and control groups. The AD group includes 9 AD cases. Abbreviations: AD = Alzheimer's disease, Ctl = control, NS = not significant, PMI = post‐mortem interval.
| Group | Sex | Age (years) | PMI (h) | Braak stage | Thal Phase | CERAD score |
|---|---|---|---|---|---|---|
| Ctl | 4M/5F | 73.3 ± 15.6 | 14.9 ± 4.9 | 1.4 ± 1.1 | 0.6 ± 1.1 | 0.1 ± 0.2 |
| AD | 4M/5F | 83.6 ± 5.7 | 11.3 ± 6.8 | 5.8 ± 0.3 | 4.8 ± 0.4 | 2.2 ± 0.8 |
| P | NS | NS | <0.0001 | <0.0001 | <0.00001 |
Brain staging
Neuropathological assessment of AD was performed in sections of frontal, parietal, temporal, insular and occipital cortex, ENT, amygdala, thalamus, caudate/putamen, BF and hippocampus using the distribution and density of NFTs according to Braak and colleagues 8. The neuropathological staging was carried out without knowledge of clinical symptoms. Neuropathological diagnosis is provided by the CCNL Brain Bank to family members by a team of neurologists and pathologists for each post‐mortem case, considering both clinical and pathological data. Plaque load was determined by estimation of Aβ deposits in neocortex, allocortex, striatum and brainstem nuclei 82. After characterizing neuropathological changes with standardized grading systems, scoring was adapted to a 4‐point scale (0–3) with three parameters including: Braak stage 0‐VI, Thal phases including both neuritic and diffuse plaques, and CERAD (neuritic plaques only, A–C) (Table 2) according to NIA—Alzheimer's Association guidelines for the neuropathological assessment of AD 51.
Immunohistochemistry
Immunohistochemistry using antibodies directed against BLT1, ChemR23 and human leukocyte antigen–D‐related (HLA‐DR) [a major histocompatibility complex class II (MHC‐CII)] antigen, was performed on the 5‐µm‐thick sections of paraffin‐embedded human brain tissue. The sections were deparaffinized and pre‐treated for antigen retrieval in citrate buffer (pH 6, 120°C, 20 min). Endogenous peroxidase activity was blocked by 1% hydrogen peroxide (H2O2, Sigma Aldrich). Subsequently, the sections were blocked with 5% normal goat serum for 30 minutes at room temperature (RT), followed by incubation over night at 4°C with primary antibodies raised against BLT1 (1:200, Cayman Chemical), ChemR23 (1:200, Cayman Chemical) and HLA‐DR (1:25, Dako). After washing in 0.01 M phosphate‐buffered saline (PBS), pH 7.4, the sections were incubated with biotin‐conjugated secondary antibodies (Jackson Immunoresearch) for 1.5 h at RT. Following another wash in PBS, the sections were incubated for 30 minutes at RT with streptavidin‐horseradish peroxidase (HRP) complex (ABC Vectastain kit, Vector Laboratories). The sections were developed with 1 mg/ml diaminobenzidine (DAB) solution containing 0.02% H2O2. The sections were then dehydrated, mounted and analyzed using a Nikon Eclipse E800 microscope linked to a Nikon Ri2 high‐resolution camera. All sections stained with a certain antibody were processed together to avoid batch‐to‐batch differences.
The specificity of the BLT1 and ChemR23 antibodies was validated in adjacent sections by pre‐incubation of the primary antibodies with a 50‐fold (by mass) excess of the respective blocking peptide (Cayman Chemical) over night at 4°C with shaking before applying to the slides (see Supporting Figure S1A,B). After incubation and washing in PBS, the sections were incubated for 30 minutes at RT with MACH 2 Double stain 1 secondary antibody (polymer HRP‐conjugated goat anti‐rabbit antibodies, Biocare Medical, Pacheco, California). The immunoreactivity was detected by the HRP‐Green kit. Stained sections were dehydrated, mounted and analyzed using a Nikon Eclipse E800 microscope linked to a high‐resolution camera. Negative controls also consisted of sections incubated without primary antibodies.
The specificity of the antibodies was also validated by performing immunofluorescence staining experiments. Paraffin sections were deparaffinized and pre‐treated for antigen retrieval in DIVA Deckloaker 1X (Biocare Medical) for 5 minutes inside a pressure cooker (Biocare Medical). The slides were cooled down at RT for 30 minutes, rinsed with PBS‐Tween 0.05% (PBS‐T) and blocked with TNB blocking buffer (TSA Fluorescein System‐Perkin Elmer) for 30 minutes at RT. Subsequently, the sections were incubated with the primary antibodies (BLT1 1:200, Cayman Chemical; ChemR23 1:200, Cayman Chemical) over night at 4˚C. After washing in PBS‐T, secondary antibodies (biotinylated goat anti‐rabbit and anti‐mouse antibodies, Vector Laboratories) were applied for 1 h at RT and, following another wash, the sections were incubated with streptavidin‐HRP solution (TSA Fluorescein System‐Perkin Elmer) at RT for 30 minutes, washed and incubated with Tyramide (1:50) for 10 minutes at RT. Cyanine 3 (Cy‐3) signal amplification was developed for 10 minutes at RT (TSA Cyanine 3 System‐Perkin Elmer). The sections were incubated with True Black Lipofuscin Autofluorescence Quencher (TB) (Biotium) and after washes with PBS‐T, mounted with Fluoroshield (Sigma Aldrich). In order to block specific labeling, the primary antibodies to BLT1 were incubated with 50 times (mass) excess of blocking peptide over night at 4˚C before applying to the sections. Consecutive sections were incubated with so‐called control serum (BLT1 antibodies + peptide), with BLT1 antibodies or without primary antibodies (negative control) following the staining protocol described above. Images were acquired in a Zeiss 710 confocal microscope with a 63x/1.40 DC oil immersion objective (see Supporting Figure S1C).
Immunofluorescence staining was performed also to exclude that the staining for BLT1 and ChemR23 was not because of the labeling of autofluorescent structures (see Supporting Figure S7A,B). The immunofluorescence staining for BLT1 or ChemR23 was performed with or without TB on sections from control and AD cases. In addition, some sections were incubated with or without TB (without immunohistochemistry) in order to analyze the presence of endogenous autofluorescence. The sections were stained with DAPI to visualize nuclei. With confocal microscopy, images were acquired by increasing the gain in order that the background (noise) was rendered visible (see Supporting Figure S7C,D).
Double‐labeling
Double‐labeling was performed to analyze the cellular localization of BLT1 and ChemR23. Paraffin sections were prepared as described above for the controls of autofluorescence and the TSA detection system (TSA Fluorescein System‐Perkin Elmer) was used for the immunofluorescence (see section on Immunohistochemistry above). The primary antibodies used were markers for microglia (HLA‐DR and transmembrane protein 119, TM119) and astrocytes (glial fibrillary acidic protein, GFAP and S100 calcium‐binding protein β, S100β). For double‐labeling, stained sections were stripped with the antigen retrieval protocol and stained with another antibody according to the described protocol. Images were acquired in a Zeiss 710 confocal microscope with a 63x/1.40 DC oil immersion objective. Colocalization was demonstrated using profile display mode and ortho‐view of z‐stack images (1024x1024 pixels) for intensity profile graphs (LSM image browser, Zeiss, Germany).
To estimate the proportion of microglia and astrocytes stained for BLT1, sections from the CG from eight AD and four control cases were double‐labeled. The same analysis was performed for ChemR23 on sections from the BA46 from six AD and four control cases. After pre‐treatment and blocking as described above for single staining, the human brain sections were incubated over night at 4°C with BLT1 or ChemR23 antibodies, mixed with antibodies against GFAP (1:600, Abcam, Cambridge) or HLA‐DR (1:25). After washing in PBS, the sections were incubated for 30 minutes at RT with MACH 2 Double stain 1 secondary antibody cocktail (polymer alkaline phosphatase (AP)‐conjugated goat anti‐mouse antibodies and polymer HRP‐conjugated goat anti‐rabbit antibodies, Biocare Medical, Pacheco, California). Double‐labeled (BLT1/HLA‐DR, ChemR23/HLA‐DR, BLT1/GFAP and ChemR23/GFAP) cells were counted in three fields of the gray matter and three fields of the white matter in each section with a 40x objective. In addition, single‐labeled cells for HLA‐DR and GFAP respectively, were counted in the same fields of view. The percentage double‐labeled cells of single‐labeled cells was calculated and expressed as means for gray and white matters respectively, in AD and controls.
Subjective scoring and densitometry
Analysis of BLT1 and ChemR23 immunoreactivity was performed in the BF, ENT, CG, BA46, CB, different regions of the hippocampus cornu Ammonis (CA) (CA1 and CA2) and the granule cell layer of the dentate gyrus (DG), by visual scoring as well as by semi‐quantitative density measurements in images captured by a Nikon Eclipse E800 microscope with a 20x objective. The optical density of staining was determined using NIH Image J 1.5 software program (with a grayscale of 0–256) by subtracting background. Subjective assessment of staining was performed by two investigators, which were both blinded to the clinical and pathological diagnoses. The staining was scored from 0 to 3 on a subjective scale as follows: 0, not detected; 1, mild; 2, moderate; 3, strong (see Supporting Figure S2). The scores of two investigators blinded to the diagnosis of each case were averaged to yield the data for statistical analysis. The distinct advantage of this protocol for subjective scoring is that neuronal vs. glial immunostaining can be assessed; this can neither be obtained by density measurements nor by western blots (WBs) and adds significantly to the results presented herein.
Analysis of microglia
Human brain sections stained with antibodies against HLA‐DR were analyzed to assess microglia in the different brain regions. HLA‐DR‐positive cells were counted regardless of their morphology as one parameter, and in addition we counted amoeboid and stout microglia which were identified with an enlarged cell body and with or without short processes extending from the soma (ie, activated morphology). The images were taken within the gray matter of the cortical regions (BF, ENT, BA46, CG and CB), and the CA1, CA2, DG (granular layer cells) of the hippocampus. For the assessment of white matter microglia count, the white matter within gyri of the CG and BA46 region respectively, were analyzed, as these two regions contained the most readily visible white matter of all regions included in this study. Images were acquired using a Nikon Eclipse E800 light microscope equipped with the Nikon Digital Sight DS‐Fi2 and a 20x objective. All images for each antibody were acquired with identical microscope and camera settings, and NIH Image J 1.5 software was utilized for counting by an observer blinded to the diagnosis.
Western blot
Tissue homogenates of the BF (Control = 5, AD = 5), CG (Control = 5, AD = 6), BA46 (Control = 5, AD = 10) and the hippocampus (Control = 5, AD = 9) without ENT, were analyzed by WB for BLT1, ChemR23 and YKL40. YKL40, also named chitinase‐3‐like protein 1, is utilized for its capability of identifying preclinical stages in the CSF in both AD and other tauopathies, and antibodies to YKL‐40 stain a subset of astrocytes thought to be involved in disease‐modifying neuroinflammation 59. Samples of 40‐µg total protein were separated by electrophoresis on 10% SDS‐polyacrylamide gels, and the proteins transferred to nitrocellulose membranes (Bio‐Rad Laboratories). The membranes with transferred proteins were then analyzed for total protein using Revert™ 700 total protein stain (LI‐COR Biosciences; Lincoln, NE). After scanning and imaging in an Odyssey Clx Infrared Imaging System (LI‐COR Biosciences; Lincoln, NE), the total protein stain was removed using the reversal solution supplied with the kit. After this, the membranes were incubated with Odyssey TBS (Tris‐buffered saline)‐based blocking buffer (LI‐COR Biosciences; Lincoln, NE), and incubated over night at 4°C with primary antibodies against BLT1 (1:200, Cayman Chemical), ChemR23 (1:100, Santa Cruz, CA, USA) and YKL‐40 (1:1000, R&D Systems). After washing in TBS, the membranes were incubated with the fluorescence‐labeled secondary antibodies at a dilution of 1:15000 in Odyssey TBS blocking buffer with 0.2% Tween‐20 for 2 h at RT. The immunoblots were then scanned and imaged using the Odyssey Clx Infrared Imaging System.
The density of the bands was analyzed with densitometry using Image Studio Lite v. 5.2 software (LI‐COR Biosciences; Lincoln, NE). Total protein staining was used as a loading standard, to which all receptor bands were normalized, and subsequently to an internal control (a mixture of homogenates from all cases for each region). The full blots have been included in Supporting Figure S3. As negative control, primary antibodies were omitted. To test specificity, the primary antibodies were incubated with their respective peptide antigen in a ratio of 1:50 and this pre‐absorbed antibody solution was applied to the membranes (see Results section and Supporting Figure S1D–F).
Statistics
Data from WB and immunohistochemistry on brain samples from different regions were analyzed by a non‐parametric Mann–Whitney U‐test, using Statistica software (V13; Statsoft, Tulsa, OK). The analyses by orthogonal projections to latent structures (OPLS) and by principal component analysis (PCA) were performed in SIMCA v. 14 (MKS Umetrics AB, Sweden). P < 0.05 was considered statistically significant.
Results
This study was performed to analyze the occurrence of receptors for pro‐resolving lipid mediators, so called SPMs, in different regions, that is, hippocampus, ENT, BF, BA46, CG and CB, of the human brain in relation to AD neuropathology and inflammation. Post‐mortem brain tissue from AD patients and controls were analyzed using immunohistochemistry and WB, showing localization of BLT1 and ChemR23, receptors for RvE1, in neurons, astrocytes and microglia, and a wide distribution within the brain, as described in the first section below. The distribution of BLT1 will be discussed first, followed by the distribution of ChemR23 as well as glial immunostaining. Analysis of brain tissue from AD patients showed higher levels of BLT1 than in control subjects, as described in the section below. Our previous studies have shown increased levels of ChemR23 in the hippocampus of AD patients 85, and we here extend these studies to include other regions of the brain for comparison with BLT1. In addition, inflammation in the brain tissue in terms of microglia was assessed in the different regions and correlated with density of immunostaining of BLT1 and ChemR23.
Distribution of BLT1 in the human brain in control and AD cases
Immunohistochemistry with antibodies to BLT1 on post‐mortem human brain sections from healthy controls, that is, with no clinical signs of AD, showed a wide distribution of this receptor for RvE1, including all regions analyzed in this study, that is, hippocampus, ENT, BF, BA46, CG and CB (Figures 1 and 2), but with weaker staining observed in the CB compared to other areas of the brain. BLT1 was expressed in many cell populations throughout the brain. The staining for BLT1 was prominent in the perikarya of neurons, astrocytes and microglia (Figures 1, 2, 3, 4), with staining showing a granular appearance and extending into dendrites and axons of neurons (Figures 1 and 2), while the strongest staining was observed surrounding the nucleus. The granular appearance of the BLT1 staining was validated as separate from autofluorescent lipofuscin granules (see Supporting Figure S7). Neurons generally showed slightly weaker staining intensity than glial cells. The specificity of immunohistochemical staining for BLT1 was validated by incubation of human brain sections with antibodies pre‐incubated with excess of the antigenic peptide (see Supporting Figure S1A,C).
Figure 1.
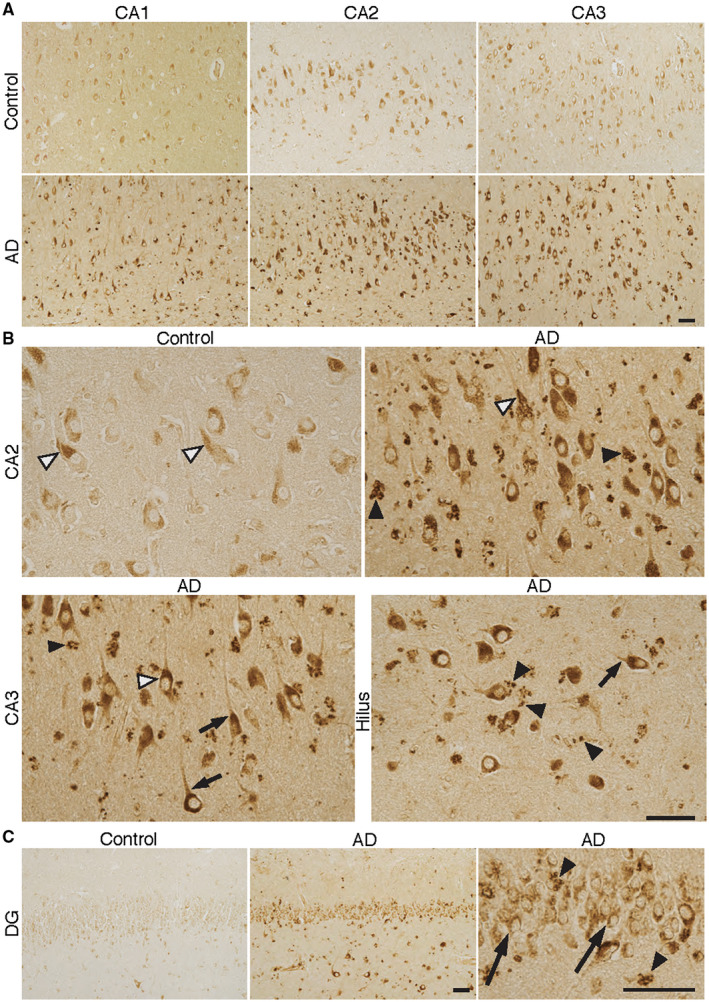
BLT1—receptor for the SPM resolvin E1 (RvE1) in different regions of Alzheimer's disease (AD) and control brain. A–C. Sections from the human hippocampus including CA1, CA2, CA3 and the dentate gyrus (DG) from AD and control cases were incubated with antibodies to BLT1. The signal for BLT1 is clearly stronger in AD in all of these areas, with the largest difference in CA2 and CA3. B. The granular appearance of the staining in pyramidal neurons is seen in both control and AD (black and white arrow heads in CA2 and CA3). A similarly strong level of BLT1 immunoreactivity in AD can be seen in neurons in the hilus region, also with a granular appearance. The BLT1 signal is also seen in axons close to the neuronal cell somata (short black arrows in CA3 and hilus). A strong signal for BLT1 is seen in glial cells, also with a granular appearance (black arrow heads in CA2, CA3, hilus and DG (C)). C. Granular cells in the DG are also positive for BLT1 (long black arrows), with markedly stronger staining in AD. Bars = 50 µm. The high magnification micrographs are part of the corresponding low magnification micrographs. BLT1 = leukotriene B4 receptor, CA = cornu Ammonis, SPM = specialized pro‐resolving mediator.
Figure 2.

BLT1—receptor for the SPM resolvin E1 (RvE1) in different regions of Alzheimer's disease (AD) and control brain. A–B. Sections from the human entorhinal cortex (ENT), basal forebrain (BF), Brodmann area (BA) 46, cingulate gyrus (CG), cerebellum (CB) and corpus callosum (CC) from AD and control cases were incubated with antibodies to BLT1. The signal for BLT1 in neurons is clearly stronger in AD in all of these areas, but with a minor difference in the Purkinje cells of the CB (short arrows). B. A granular staining is evident in the neurons of both control and AD brains, for example, seen here in the large neurons of BF in AD (arrowhead), extending into the axon (long arrows), and in BA46 in a control case (arrowhead). Varicose fibers with BLT1 immunoreactivity can be seen in higher magnification of the BA46 cortex (long arrows). Numerous glial cells with a strong signal for BLT1 are seen in the CC in AD, whereas only a few weakly labeled glia can be seen in control brain. Bars = 50 µm. BLT1 = leukotriene B4 receptor, SPM = specialized pro‐resolving mediator.
Figure 3.

Colocalization of BLT1 with HLA‐DR and TM119 in microglia. Z‐stack images were created by merging serial confocal microscopy scans of 5 µm sections of double immunofluorescence labeling for BLT1 and HLA‐DR or TM119. Co‐localization of the signal for BLT1 (green) can be seen with HLA‐DR (red) (A–C) or with TM119 (red) (G–I) in the gray matter of CG of an Alzheimer's disease (AD) case. The graphs show the fluorescence intensity profile from a line crossing over the microglia shown in E and K, and intensity peaks for both red and green display the co‐localization of BLT1 with HLA‐DR (D, E) and TM119 (J, K). The ortho‐view of the z‐stack images shows that BLT1 is expressed in the cell soma of microglia (F, L). Bar = 20 µm. BLT1 = leukotriene B4 receptor, CG = cingulate gyrus, HLA‐DR = human leukocyte antigen‐D‐related, TM119 = transmembrane protein 119.
Figure 4.

Colocalization of BLT1 with GFAP and S100β in astrocytes. Z‐stack images were created by merging serial confocal microscopy scans of 5 µm sections of double immunofluorescence labeling for BLT1 and GFAP or S100β. Co‐localization of the signal for BLT1 (green) can be seen with GFAP (red) (A–C) or s100β (red) (G–I) in the gray matter of CG of an Alzheimer's disease (AD) case. The graphs show the fluorescence intensity profile from a line crossing over the astrocytes shown in E and K, and intensity peaks for both red and green display the co‐localization of BLT1 with GFAP (D, E) and S100β (J, K). The ortho‐view of the z‐stack images shows that BLT1 is expressed in the cell soma of the astrocytes (F, L). Bar = 20 µm. BLT1 = leukotriene B4 receptor, CG = cingulate gyrus, GFAP = glial fibrillary acidic protein, s100β = S100 calcium binding protein β.
Neuronal BLT1
The hippocampus displayed a distinctive pattern for BLT1 expression with staining in the CA regions, the DG and subiculum (Figure 1A). Pyramidal neurons were labeled for BLT1 from the hilar region through to the CA1 and subiculum, with the strongest signal in the CA2–CA4 and hilus region, whereas weaker staining was seen in the CA1 and subiculum (Figure 1). In the DG, cell bodies of the granule cells showed weak staining intensity (Figure 1). In the ENT, strong staining for BLT1 in neurons was observed in all layers (Figure 2).
In the BF, BA46 and CG regions, neurons with large and small cell bodies (Figure 2) showed immunoreactivity for BLT1 to a similar degree. The cerebellar cortex revealed weak BLT1 immunostaining in the granular layer as well as in Purkinje cells (Figure 2). Interneurons within the molecular layer were faintly labeled. When the BLT1 staining in all of the cortical and subcortical areas was analyzed in AD cases and compared to controls, distinctly stronger staining was observed in neurons as well as glial cells of the AD cases (Figures 1 and 2), except for the CB, where staining intensity was similar in the two groups (Figure 2).
The increased staining intensity of BLT1 in AD brains was especially prominent in the BF, ENT and hippocampus, supported by the results from the double‐blind visual scoring of the BLT1 immunoreactivity in both neurons and glia (Figure 5A). Significant differences between AD and control were observed in the large BF neurons, presumably cholinergic (Figure 2), in neurons in the hilar region of the hippocampus and in the pyramidal cells of CA2–CA4 and ENT (Figures 1 and 2). Both the visual scoring and densitometric quantification performed in the gray matter (Figure 5A) confirmed the observed higher BLT1 staining levels in AD cases compared to controls in CA2, ENT, BF, BA46 and CG, whereas only visual scoring revealed a significant difference in the CA1 and DG (Figure 5A). Neither visual scoring nor semiquantitative densitometry showed a significant difference between the two groups in the CB, confirming histological observations shown in Figure 2A.
Figure 5.

Analysis of BLT1 immunoreactivity in different regions of Alzheimer's disease (AD) and control brain. A. Densitometric analysis of BLT1 immunoreactivity in CA1, CA2, entorhinal cortex (ENT), dentate gyrus (DG), basal forebrain (BF), Brodmann area (BA) 46, cingulate gyrus (CG) and cerebellum (CB), as well as visual scoring of the BLT1 staining in the same regions. The visual scoring is performed on glia (G) and neurons (N). B. Western blot (WB) analysis of BLT1 receptor protein of 55‐kDa molecular weight (MW). Representative images of bands from each region of AD and control cases. Horizontal bars indicate median. C. Expression of BLT1 during disease progression. Increased staining intensity of BLT1 in all investigated brain regions is associated with disease pathology based on Braak stage. BLT1 = leukotriene B4 receptor, CA = cornu Ammonis, eAD = early onset AD, HPC = hippocampus, MCI = mild cognitive impairment, N/A = not available.
Glial BLT1
In order to determine the cellular identity of BLT1 immunoreactive glial cells, double immunohistochemical labeling was performed with markers for microglia (HLA‐DR, TM119) and astrocytes (GFAP, S100b) (Figures 3 and 4). The staining for BLT1 in microglia and astrocytes was seen in the cell somata and had a granular appearance (Figures 3 and 4). Staining for HLA‐DR and GFAP was present also in the glial processes, whereas BLT1 could only be seen in cell bodies (Figures 3 and 4).
BLT1‐labeled glial cells were observed in both the gray and white matter of all regions analyzed, as well as in major tracts such as the anterior commissure (AC) and corpus callosum (CC) (Figs, 1 and 2). In BA46 and CG, glial cells labeled for BLT1 were most abundant in the molecular layer (layer I), whereas moderate numbers were observed in the deeper cortical layers (layers II–VI). As in the case of neuronal BLT1 the staining in glial cells was markedly enhanced in AD compared to control brains, as evident, for example, in the CC (Figure 2).
Distribution of ChemR23 in the human brain in control and AD cases
Immunohistochemical analysis of ChemR23 showed both neuronal and glial staining in all of the regions examined (hippocampus, ENT, BF, BA46, CG and CB) (Figures 6 and 7). The data reported here extend our previous findings 85, and confirmed that ChemR23 staining density in the hippocampus was highest in pyramidal neurons and glial cells. The neuronal immunoreactivity was stronger in the hilus, CA3 and CA2 than in the CA1 region. Compared to BLT1, ChemR23 immunoreactivity in granule cells of the DG was markedly weaker and concentrated to the outer perimeter of the cells (cf. Figures 1 and 6) (for further comparison of BLT1 and ChemR23 see Regional co‐distribution of BLT and ChemR23 below). In the ENT, pyramidal cells had ChemR23‐like immunoreactivity (Figure 7). In the BF, strong neuronal staining was observed for ChemR23 to a similar degree in neurons with small or large cell bodies (Figure 7). A weak staining for ChemR23 was observed in Purkinje cells and in neurons in the granular and molecular layer of the CB (Figure 7). The appearance of neuronal staining for ChemR23 in different brain regions is seen in higher magnification (Figure 6) and shows a granular appearance of various degree and intensity. The granular appearance of the ChemR23 staining was validated as separate from autofluorescent lipofuscin granules (see Supporting Figure S7).
Figure 6.

ChemR23—receptor for the SPM resolvin E1 (RvE1) in different regions of the Alzheimer's disease (AD) and control brain. A–B. Sections from the hippocampus including CA1, CA2 and the dentate gyrus (DG) from AD and control cases, and a section of the hilus region from AD, were incubated with antibodies to ChemR23. The signal for ChemR23 is clearly stronger in AD in all of these areas, with a particularly strong signal in pyramidal cells in the CA regions and hilus. B. The signal for ChemR23 has a granular appearance (black and white arrow heads in CA1 and CA2). In DG, a few granular cells have a weak ChemR23 labeling (black arrow heads). Glial cells with a strong signal in AD are seen in all of the regions (white arrows in CA1, CA2, DG and hilus). Bars = 50 µm. ChemR23 = chemerin‐like receptor‐1, CA = cornu Ammonis, SPM = specialized pro‐resolving mediator.
Figure 7.

ChemR23—receptor for the SPM resolvin E1 (RvE1) in different regions of the Alzheimer's disease (AD) and control brain. Sections from the entorhinal cortex (ENT), basal forebrain (BF), Brodmann area (BA) 46, cingulate gyrus (CG), cerebellum (CB) and corpus callosum (CC) from AD and control cases were incubated with antibodies to ChemR23. The signal for ChemR23 in neurons is clearly stronger in AD in all of these areas, but with a smaller difference with regard to CB, including the Purkinje cells (arrows). Particularly strong signal for ChemR23 is observed in the large neurons of BF. Note also neurons with distorted morphology in AD (arrow heads in BF and BA46). Many glial cells with a strong signal for BLT1 are seen in the CC in AD, whereas only few weakly labeled glia can be seen in control. Bar = 50 µm. ChemR23 = chemerin‐like receptor‐1, SPM = specialized pro‐resolving mediator.
In all areas except for the CB, ChemR23 immunoreactivity was markedly stronger in AD cases than in controls (Figures 6 and 7). The double‐blind visual scoring of immunoreactivity confirmed significant differences in staining intensity for both neuronal and glial ChemR23 staining in the hippocampus, BF, ENT, BA46 and CG, while the CB did not show a difference between the two groups (Figure 8A). Densitometry confirmed the observed increase in ChemR23 immunoreactivity seen also in the CA1 and CA2 (Figure 8A). In the CA1, however, only the semi‐quantitative visual scoring showed a significant difference between AD and controls for glial cells (Figure 8A). In addition, the visual scoring did not reveal a difference in ChemR23 in the DG (Figure 8A). As mentioned above, the value of including both visual scoring and densitometry lies in the discrimination between glial vs. neuronal staining that can only be included in the visual scoring paradigm. The immunohistochemical staining for ChemR23 was validated by incubation of human brain sections with antibodies pre‐incubated with excess of the antigenic peptide (see Supporting Figure S1B).
Figure 8.

Analysis of ChemR23 immunoreactivity in different regions of Alzheimer's disease (AD) and control brain. A. Densitometric analysis of ChemR23 immunoreactivity in CA1, CA2, entorhinal cortex (ENT), dentate gyrus (DG), basal forebrain (BF), Brodmann area (BA) 46, cingulate gyrus (CG) and cerebellum (CB), as well as visual scoring of the BLT1 staining in the same regions. The visual scoring is performed on glia (G) and neurons (N). B. Western blot (WB) analysis for ChemR23 receptor protein of 42‐kDa molecular weight (MW). Representative images of bands from AD and control cases. Horizontal bars indicate median. C. Staining intensity of ChemR23 using densitometry analysis is summed for all brain regions investigated to show the relationship between ChemR23 expression and AD pathology (NFTs and Aβ plaques). Aβ = β amyloid, CA = cornu Ammonis, ChemR23 = chemerin‐like receptor‐1, eAD = early onset AD, HPC = hippocampus, MCI = mild cognitive impairment, N/A = not available, NFTs = neurofibrillary tangles.
BLT1 and ChemR23 levels in relation to AD pathology
The relation between the resolution receptors and the progression of pathology (Braak and Thal staging system) across the brain regions investigated was analyzed using the data from densitometry and visual scoring. High staining intensity for the BLT1 and ChemR23 receptors coincided with high Braak scoring by summing densitometry values for all regions of each patient (see Figures 5C and 8C). We also created a heat map of ChemR23 and BLT1 scores for each region studied (see Supporting Figure S4). In the low Braak cases, the intensity of receptor staining received lower score because of their weak expression in neurons and glial cells, while in later Braak stages the visual scoring indicated higher levels of ChemR23 and BLT1. The scores for the receptors did not follow Thal phases in a linear way, instead high scores for BLT1 and ChemR23 appeared rather abruptly at later Thal stages (Figures 5C and 8C and Supporting Figure S4). Constitutive expression of BLT1 and ChemR23 was found in neuronal and glial cells in control cases with no AD pathology according to Braak or CERAD scoring. However, slightly elevated Braak scores for NFTs and scores for Aβ plaques were observed in some of the control cases. In general, brain tissues from these cases had higher immunoreactivity and intensity for BLT1 and ChemR23 compared to controls with no NFTs or Aβ plaques, but lower compared with the AD cases, all regions considered.
In the CG of the AD patients there was high abundance of NFTs, and neurons as well as glia exhibited strong ChemR23 and BLT1 immunoreactivity. Strong labeling for BLT1 and ChemR23 was also seen in both neurons and glia in the BA46 of cases with an AD diagnosis.
Examination of two cases with eAD showed a high number of preserved neurons that exhibited strong staining intensity for BLT1 and ChemR23, suggesting that the elevation of these receptors occurs prior to frank neuronal loss and may be an early mechanism. Within the control group, the cases of old age and a case with a clinical history of several head concussions displayed high levels of ChemR23 and BLT1, hypothetically as a consequence of inflammation in the brain occurring with general aging and from head injury. The WB analysis of BLT1 and ChemR23 performed on a subgroup of AD and control cases did not reveal statistically significant differences between the groups in any of the regions analyzed (Figures 5B and 8B), probably because of a “dilution” effect when examining whole tissue levels by WB, while the differences in staining levels observed by immunohistochemistry were largely limited to subsets of neurons and glial cells in the examined regions.
Analysis of the antibody specificity for BLT1 and ChemR23 was performed by WB on brain tissue homogenates. For BLT1, the band at 55‐kDa molecular weight (MW) was blocked by pre‐incubation with 50‐fold excess of the blocking peptide, and this band was used for quantification (see Supporting Figure S1D). In the case of ChemR23, pre‐incubation of the antibodies with 50‐fold excess of the antigenic peptide resulted in absence of a band at approximately 42 kDa that was used for quantification (see Supporting Figure S1E).
Regional analysis of microglia in AD and control brain using the HLA‐DR marker
In order to correlate the expression of BLT1 and ChemR23 to microglial changes, adjacent sections of the different brain regions of all AD and control cases were immunolabeled with antibodies directed against the microglial marker HLA‐DR (Figures 9 and 10). In all of the five brain regions examined, microglia with different morphological phenotypes were observed. The number of all HLA‐DR‐immunoreactive cells and the number of these with amoeboid/stout (activated) morphology within each brain region were estimated (Supporting Figure S5). In control subjects, microglia mainly showed a ramified phenotype with long and thin processes in both the gray and white matter. In general, the number of HLA‐DR‐immunoreactive cells was higher in white than in gray matter, although variability in microglial numbers could be accounted for by the clinical or neuropathological state of the different cases. Furthermore, one control subject, who had suffered repeated head concussions according to the medical history, exhibited increased numbers of both NFTs and HLA‐DR immunoreactive microglia in several areas of the brain.
Figure 9.

Microglial activation in different regions of the Alzheimer's disease (AD) and control brain. A. Sections from the CA1, CA2, dentate gyrus (DG) and hilus region from AD and control cases were incubated with antibodies to human leukocyte antigen–D‐related (HLA‐DR). A clear increase in labeling intensity for HLA‐DR and density of labeled microglia is seen in AD compared to control in all of these regions. B. High magnification of CA2 (part of CA2 (AD) in A) shows unlabeled neurons (arrow heads) surrounded and contacted by microglial processes. A cluster of microglia is observed in the hilus region of an AD brain. Bars = 50 µm. CA = cornu Ammonis.
Figure 10.
Microglia in different regions of the Alzheimer's disease (AD) and control brain. A. Sections from the entorhinal cortex (ENT), basal forebrain (BF), Brodmann area (BA) 46, cingulate gyrus (CG) and cerebellum (CB) from AD and control cases were incubated with antibodies to human leukocyte antigen–D‐related (HLA‐DR). A clear increase in labeling intensity for HLA‐DR and density of labeled microglia is seen in AD compared to control in all of these regions. B. Unlabeled neurons (arrow heads) in BF of an AD brain are surrounded and contacted by microglial processes. The low density of labeled microglia in control is exemplified by the high‐magnification micrograph of BA46. Bars = 50 µm.
Both the gray and white matter of AD cases demonstrated abundant HLA‐DR‐positive microglia with all different morphological phenotypes. As clearly illustrated in Figures 8 and 9, major differences in HLA‐DR staining were observed between AD cases and non‐demented controls in the gray matter with regard to the distribution and morphology of microglia. In the gray matter, estimated numbers of all HLA‐DR‐positive cells and all HLA‐DR‐positive cells with activated morphology were higher in AD than in controls within the CG, BF, BA46, ENT, DG, CA1 and CA2 (see Supporting Figure S5A). There was no difference between groups in the CB which indicates that the inflammation and neuropathology in the AD brain does not spread to the CB in the same way as it spreads, for example, to cortical regions.
HLA‐DR expression was low in the control brains with the exception of white matter. HLA‐DR‐immunoreactive microglia in the white matter of the BA46 (see Supporting Figure S5C) was significantly higher in AD cases than in controls (see Supporting Figure S5B,C), but there was no significant difference between AD and non‐demented controls in the CG (see Supporting Figure S5C) although the visual inspection suggested this (see Supporting Figure S5B).
Analysis of the astrocyte inflammation marker YKL‐40 in AD and control brain
A fairly recently discovered and characterized marker for astrocyte activation, YKL‐40, was investigated by WB analysis of the hippocampus, BA46, CG and BF (Figure 11). Using anti‐human YKL‐40 antibodies we found two bands with a MW of 40 and approximately 49 kDa, respectively, and the sum of these two bands was used for analysis. Significantly higher levels of YKL‐40 were found in the hippocampus and BF of AD cases compared to control subjects, whereas no difference was observed in BA46 or CG (Figure 11A). To elucidate the role of ApoE isoforms in YKL‐40 expression, we compared ApoE4 carriers and non‐carriers, and found a significant increase in YKL‐40 expression levels in the hippocampus region of ApoE4 carriers (Figure 11B), whereas no differences were detected in the other regions investigated in this study. Immunohistochemistry with the same antibodies confirmed the presence of YKL‐40 in astrocytes 59. Analysis of the antibody specificity for YKL‐40 was performed for WB on human brain homogenates. Pre‐incubation of the antibodies with excess of the antigenic peptide resulted in absence of the two bands analyzed (see Supporting Figure S1F).
Figure 11.

Analysis of the inflammatory marker YKL‐40 in different regions of Alzheimer's disease (AD) and control brain. A. Western blot (WB) analysis of the hippocampus (HPC), and basal forebrain (BF), show higher levels of YKL‐40 in AD patients compared to controls, whereas no difference was seen in Brodmann area (BA) 46 or cingulate gyrus (CG). B. Relationship between YKL‐40 levels and the presence of the E4 allele of apolipoprotein (Apo). Horizontal bars indicate median. YKL40 = Chitinase‐3‐Like Protein 1.
Multivariate discriminant analysis (OPLS‐DA)
To shed further light on the association between AD and inflammation and its resolution, as well as to complement the univariate statistical analysis of differences between the cases diagnosed with AD dementia and non‐demented controls, multivariate analysis (MVA) was performed. Orthogonal projections to latent structure–discriminant analysis (OPLS‐DA) was used to model the classification of AD and cognitively normal controls in two different models based on the data on: (A) expression of BLT1 and ChemR23 (Figure 12A) and (B) inflammation in the different regions as assessed by the total number of HLA‐DR‐positive microglia, and the number of microglia with activated morphology (Figure 12B). In addition, the PMI and age of the cases were included in the two models.
Figure 12.
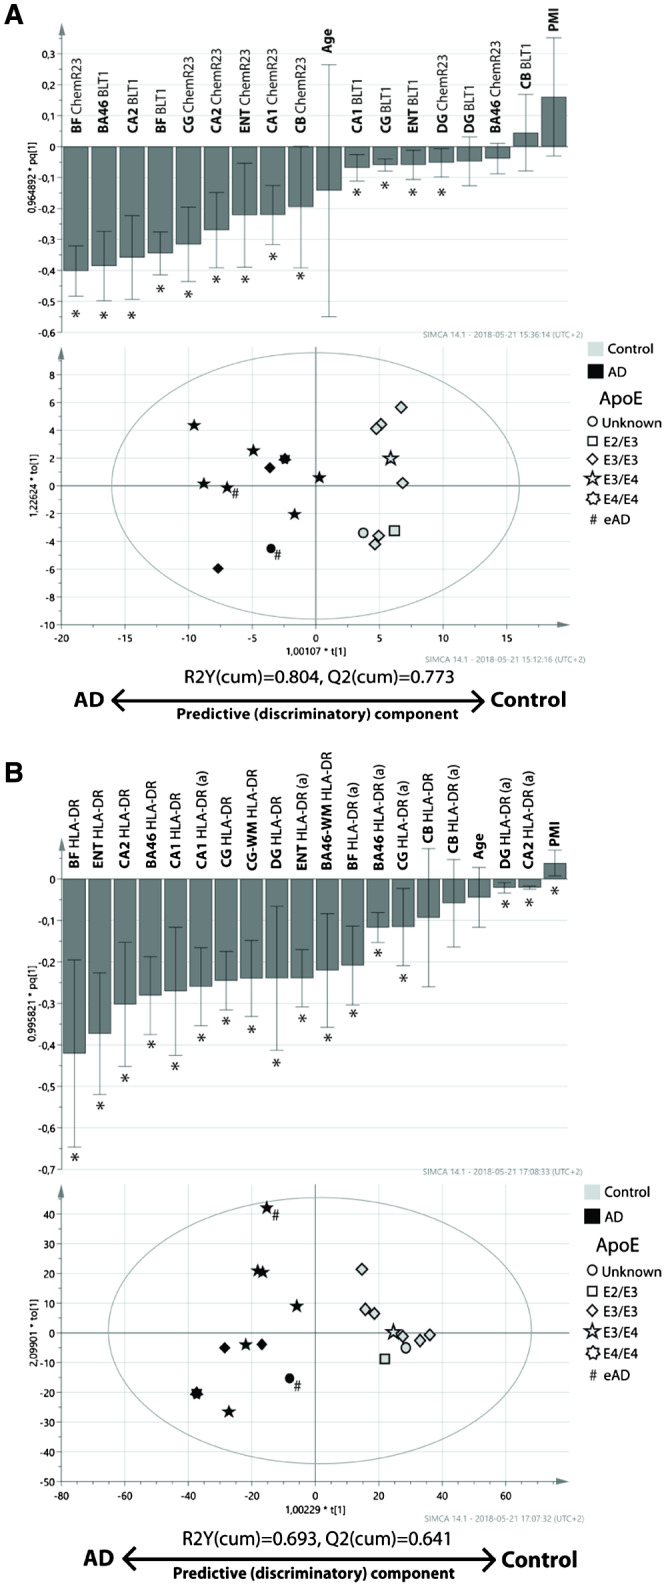
Multivariate analysis (MVA) of data on the SPM‐receptors BLT1 and ChemR23 and the number of HLA‐DR‐positive microglia in different regions of the Alzheimer's disease (AD) and control brain. The orthogonal projections to latent structures (OPLS) analysis was performed on A densitometric measurements of BLT1 and ChemR23 immunohistochemical staining, and B cell counts of HLA‐DR immunoreactive microglia. The data were obtained from analysis of BA46, basal forebrain (BF), CA1, CA2, cerebellum (CB), cingulate gyrus (CG) and dentate gyrus (DG) in post‐mortem brain tissue from individuals diagnosed with AD (black symbols) and cognitively normal controls (gray symbols). For HLA‐DR (B), estimated number of positive cells, as well as the number of positive cells with activated morphology (indicated by a following the region), in the regions were included in the analysis. Furthermore, the analysis of HLA‐DR included data from the white matter (WM) regions of BA46 and CG. The OPLS‐DA models for BLT1 and ChemR23, as well as HLA‐DR, showed good ability to discriminate individuals with AD from cognitively normal controls (R2Y(cum) = 0.804 (A), and R2Y(cum) = 0.693 (B), respectively). * indicates variables with a significant impact on the model. The symbols are coded for the presence of the E2, E3 and E4 alleles of apolipoprotein (Apo) (see legend in figure). # indicates individuals with early‐onset AD (eAD). BA46 = Brodmann area 46, BLT1 = leukotriene B4 receptor 1, ChemR23 = chemokine‐like receptor 23, HLA‐DR = human leukocyte antigen–D‐related, SPM = specialized pro‐resolving mediator.
Model A—expression of BLT1 and ChemR23
The A model had a R2Y(cum) value of 0.804 (R2Y(cum) of 1.0 represents 100% fit), meaning that the model has a quite good ability to explain the variability in the data that discriminate cases into the two classes (ie, AD and controls). The ability of model A to predict which class a case belonged to, Q2(cum), was also good: 0.773 (Q(cum) of 1.0 represents 100% predictability). In Figure 12A, the scatterplot shows that only one case (an AD case), was just barely misclassified as a cognitively normal control. In general, cognitively normal controls were more homogeneous in their distribution along the discriminatory component as compared to the AD cases. The bar plot in Figure 12A shows that the expression of BLT1, as well as ChemR23 in most of the regions, influenced model A in a fashion that was parallel to the univariate analyses, that is, with higher expression in AD cases. Both BLT1 and ChemR23 exhibited a strong and significant contribution to the discriminatory ability of the model (ie, discriminating between AD and controls) in the hippocampus, where CA2 was the most prominent subregion, and in which BLT1 expression contributed somewhat stronger than ChemR23. At the other end of the spectrum, the expression of BLT1 and ChemR23 in the DG exerted negligible impact. In the BF, the expression of ChemR23 as well as BLT1 contributed significantly and strongly to the discrimination between AD and controls. Similarly, the expression of BLT1 in BA46 exerted a notable and significant impact. In contrast, the impact of ChemR23 in BA46 was negligible and insignificant. This pattern was reversed in the CG and ENT, where the impact of ChemR23 on the discriminatory ability of model A was strong, and the contribution of BLT1 significant but considerably less.
Neither age nor PMI exerted any significant impact on the model. The orthogonal component (Y‐axis), showed considerable heterogeneity in both the AD and control group, suggesting that there are other factors contributing to the variability in the data. To help understand how ApoE genotype, Braak staging and gender were important for the distribution along the discriminatory and orthogonal components, the cases were symbol coded in the scatter plot. The cases with ApoE4 genotype (see scatter plot in Figure 12A) and high Braak staging (not shown in scatter plot in Figure 12A) were distributed toward the AD pole of the discriminatory component, but when looking at the AD cases separately, these two factors did not seem to influence how close an AD case was to the AD pole. Neither did gender influence the position of a case in the scatterplot (data not shown). Hence, we confer that the expression of BLT1 and ChemR23 in multiple brain regions is sufficient to discriminate between AD and control.
Model B—inflammation as measured by HLA‐DR‐positive microglia
In addition to the regions analyzed in model A, the OPLS‐DA model B also included the white matter regions of BA46 and CG. Model B resulted in fairly good R2Y(cum) and Q2(cum) values: 0.693 and 0.641, respectively. No cases were misclassified according to their diagnosis as can be seen in the scatterplot in Figure 12B. The control cases showed a tight distribution in both the discriminatory and orthogonal component. The general impression is that the total number of HLA‐DR‐positive microglia contributes with a stronger impact to the discrimination between the AD and control group than the number of microglia with activated morphology (see bar plot in Figure 12B).
Similar to model A, BF exerted a strong impact on the model with regard to discriminatory ability. This was true for the total number of HLA‐DR‐positive microglia, but less so for the number of activated microglia, a result also seen for ENT. Furthermore, the hippocampal and cortical (CG and BA46) regions showed a similar pattern: the total number of HLA‐DR‐positive microglia was helpful in discriminating between AD and controls, while the number of activated microglia was quite weak in this regard, although still significant. The exception was the CA1 region, where the total number of microglia as well as the number of activated microglia exhibited an equal contribution to the model.
In contrast to the observation in model A, PMI showed a significant, although very weak impact on the discriminatory ability of model B, while the age of the cases was without significant influence. Similar to model A, there appeared to be a heterogeneous distribution along the orthogonal component with regard to the AD cases, while the cognitively normal controls were clustered together. No additional information could be gained when visualizing all the cases in the scatter plot when assigning symbols for gender (data not shown). However, when indicating the ApoE4 genotype (see Figure 11B) and Braak‐stage of the AD cases, the one case homozygous for ApoE4 was positioned comparatively close to the AD pole on the discriminatory component (scatter plot in Figure 12B), while Braak‐stage was uninformative (not shown in Figure 12B). Furthermore, this AD case also deviates in the orthogonal component, indicating that a characteristic other than being on the scale between AD and control is active in this case. We therefore draw the conclusion that microglial number, and to a lesser degree activated microglia, in multiple regions of the brain is sufficiently increased in AD cases to separate them from controls, and that being homozygous for the ApoE4 allele may be associated with more severe inflammation in multiple regions of the brain, thus suggesting that inflammation is an integral part of the AD pathological progression.
Regional co‐distribution of BLT1 and ChemR23
Although the levels if BLT1 and ChemR23 appeared to follow each other from the perspective of Alzheimer pathology, we investigated their relationship further by performing univariate correlative analysis, as well as multivariate PCA. When looking for correlative relationships between the levels of BLT1 and ChemR23 using Spearman rank‐order test, we found that such a relationship exists only in BF (R = 0.76, P < 0.0001), but not in the other regions studied. Using PCA, we built a model including the densitometry levels of BLT1 and ChemR23 in the regions studied. The unsupervised PCA model showed moderate quality (R2X(cum) = 0.58 and Q2(cum) = 0.252) (see Supporting Figure S6A), and exhibited a similar pattern as seen in the supervised OPLS‐DA model, that is, clusters of AD and control cases separated on Component 1 (see Supporting Figure S6C). In the loadings plot (see Supporting Figure S6B), it is apparent that the variables containing data on the levels of BLT1 as well as ChemR23 clustered in a position on Component 1 similar to the AD cases, thus showing again that the levels of these receptors are higher in AD. When regarding the distribution on Component 2, it is apparent that the variables containing data on the levels of BLT1 and ChemR23 are clustered separately, indicating that their levels are subject to an influence other than the pathology of AD, producing somewhat different expression patterns for BLT1 and ChemR23. A tentative search for factors responsible for this difference by symbolical coding of the cases in the score plot for ApoE (shown in Supporting Figure S6B), gender, plaque and tangle load (not shown), did not provide any further hints about this matter.
Discussion
We demonstrate here that the immunohistochemical staining for BLT1 as well as for ChemR23 was higher in a region‐specific manner in the presence of neuropathology and inflammation in the AD cases. Furthermore, to our knowledge, this is the first study demonstrating the distribution of BLT1 receptors in the human brain. The distribution patterns of the two RvE1 receptors, BLT1 and ChemR23, as well as the alterations in their pattern and density in AD brains showed great similarity in the brain regions studied, except for some local difference in the BA46 and CA1. However, using PCA to analyze the densitometry data a clear separation was seen between the two receptors, indicating that the heterogeneity may not be random but because of participation of the regions in different functional and neuronal networks, or to different signals inducing their expression, although some overlap does exist. In addition, regional segregation may exist because of different specificity and selectivity for different ligands (eg, Aβ, chemerin, LTB4) for BLT1 and ChemR23, leading to effects, for example, on receptor downregulation and recycling.
There were no significant effects of confounding factors such as age, gender or PMI on BLT1 and ChemR23 expression in the studied cohort. Our findings of increased levels of these two receptors add significantly to the emerging field of resolution of inflammation in the CNS and suggest a compensatory reaction to the previously shown downregulation of SPMs in AD, and thus add further strength to the proposal of a dysfunctional resolution in AD. Because there are agonists and antagonists available for these two receptors, development of novel therapeutic interventions for AD should include manipulating the resolution system, to achieve optimal resolution of inflammation.
The WB analysis confirmed detectable protein levels of BLT1 in several regions of the human brain. However, unlike our results from immunohistochemistry that showed higher levels of both BLT1 and ChemR23 in AD, WB did not reveal any significant differences between groups in any of the regions studied. Tissue homogenates analyzed by WB contain a mixture of cell types and extracellular matrix and resulting data may therefore not reflect the situation observed by immunohistochemistry, both in densitometry and in subjective scoring, where the signal in specific cells was assessed. It is also important to take into account the difference in PMI between the groups analyzed by WB. Because of the difficulty in performing microdissections of human frozen tissues, mainly the data from immunohistochemistry will be discussed hereafter.
Univariate comparison between AD and controls showed that there was a prominent increase in the expression of both BLT1 and ChemR23 in regions known to be affected in AD. This was supported by MVA in which OPLS‐DA was used to investigate which of the factors that were most informative in classifying cases as AD or control in the two models employed. The two OPLS‐DA models both showed good explainability and adequate predictability and supported the results from the univariate analyses. In the scatterplot of the model built on levels of BLT1 and ChemR23, the position of cases being ApoE4 carriers or diagnosed as eAD did not provide information on how these receptors are related to the E4 allele or eAD. However, it was interesting to note that the single E4/E4 carrier in our study was positioned furthest from the center in the scatterplot of the model built on total and activated microglia in the regions analyzed, suggesting that being an E4/E4 carrier is associated with a prominent microglia‐mediated inflammatory response in several brain regions. MVA is not subject to the same risk of false positive or negative results that can occur in univariate analyses and thus complement the univariate, hypothesis‐testing analysis. The high degree of consensus between the uni‐ and multivariate analyses in this study thus reinforces our ability to draw conclusions from our results.
In AD, increase in pro‐inflammatory cytokines and lipid mediators has been associated with disease pathogenesis 30, 53. In gray matter activated microglia and astrocytes co‐localize with neuritic plaques 19, 77. Our studies on the number of all HLA‐DR‐positive microglia, including the activated, showed a significant increase in AD, indicating elevated activation of microglia and upregulation of MHCII with AD pathology 11, 83. HLA‐DR is constitutively expressed by microglial cells, that is, all phenotypes of microglia have MHCII expression but it is increased upon activation 36. The most commonly used marker for activated microglia after HLA‐DR is CD68 which displays increased expression in AD cases, or no difference between the groups, depending on the brain region 37, 66, 87.
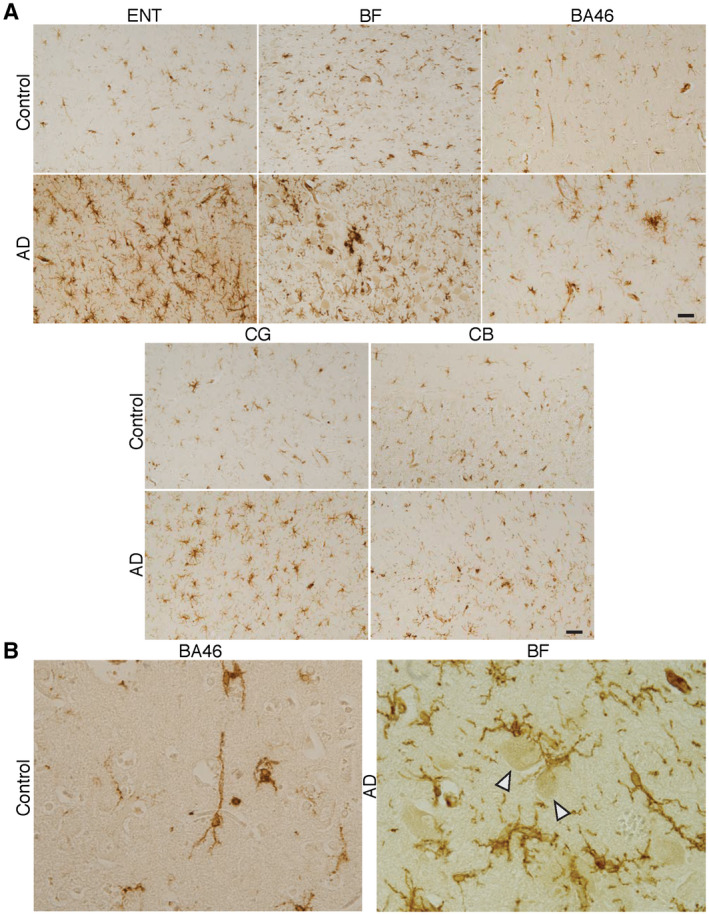
In qualitative and quantitative studies, an age‐dependent increase in activation of microglia in white matter has been shown in healthy aging and AD post‐mortem human cases. Changes at middle age (~50 years) were observed with elevated levels of CD68 and HLA‐DR indicating increased phagocytosis and antigen presentation. This early inflammation was also supported by PET‐imaging of microglial activation in white matter 60. In a quantitative approach one group investigated microglial density in white matter of cognitively normal young and old individuals (40–100 year of age) showing higher levels of microglial activation in old cases compared to young and the very old 25. In our cohort, we had two white matter regions, BA46 and CG, which showed increased HLA‐DR‐positive microglia in AD compared to control. In agreement with earlier studies 48, we observed more abundant microglia in white matter than in gray matter in control cases, whereas in AD cases we found numerous HLA‐DR‐positive cells in both the gray and white matter. We showed, for the first time, elevated HLA‐DR levels in BA46 gray matter from AD cases, similar to a study focused on schizophrenia showing increased HLA‐DR in BA46 as well as elevated inflammatory markers 21.
BLT1, a receptor on peripheral immune cells binding both the pro‐inflammatory LTB4 and the pro‐resolving RvE1, has been known over two decades to occur in peripheral tissues and in animal models 29, 42, 45, 90. We show here that it is expressed in the human brain, both in astrocytes and microglia, as well as in neurons. Our double‐labeling experiments showed that over 60% of both microglia and astrocytes express BLT1. Earlier studies showed the presence of BLT1 in mouse dorsal root ganglion cells 1 and in the rat cerebral cortex in neurons, endothelial cells and microglia, but not clearly in astrocytes 89. Binding of RvE1 to BLT1 results in a signal mediating the cessation of inflammation and the return to homeostasis, that is, resolution of inflammation is transduced 4. We have previously shown that ChemR23 is widely expressed in neurons, astrocytes and microglia in the human hippocampus 85. The present double‐labeling experiments showed that over 60% of both microglia and astrocytes express ChemR23. In the current study, we have analyzed both BLT1 and ChemR23 in subregions of the hippocampus and in other regions of the brain. This was done in the framework of AD, where resolution is impaired 85. In addition to the brain regions considered as central in the pathogenesis of AD (BF, ENT and hippocampus), we also investigated the CG, in which more than half of the neuronal population is lost in AD 67. The CG receives input from the BF, has connections with the hippocampus, amygdala and frontal cortex, and is a crucial functional component for memory, attention and emotions 89. In addition, the CB was investigated, that is, a brain region that is not affected by AD in most patients.
The results of this study are suggestive of a hitherto not described relationship between the pathology of AD, the level of inflammation, and the expression of receptors for SPMs. This hypothesis is supported in our findings by both univariate analysis and MVA that in the BF, a region shown to be affected early in AD 2, 50, there was a prominent increase in the expression of BLT1 and ChemR23, as well as in inflammation as shown by the number of microglia and the levels of YKL‐40, a protein present in astrocytes 7. We found that the stronger staining for BLT1 and ChemR23 observed in AD seemed to be restricted to larger neurons, which appear to be cholinergic neurons based on their morphological features. The subregions of the hippocampus receive cholinergic input from BF 44 and the disruption of this input in AD directly causes neuronal dysfunction in target areas, and may also have negative impact on the regulation of inflammation as acetylcholine (ACh) is known to inhibit inflammation by decreasing pro‐inflammatory cytokines, macrophage activation and migration through the α7 nicotinic ACh receptor (α7nAChR) 81.
Similar to BF, our analysis of the hippocampus showed pronounced inflammation, and the increased expression of SPM receptors distinguished AD cases from cognitively normal controls. Interestingly, it was only in the BF and hippocampus that differences in YKL‐40 levels reached statistical significance, suggesting an especially high astrocytosis in these two brain regions. Although correlation between high levels of YKL‐40 and high numbers of microglia in BF and to a lesser degree in the hippocampus (ie, CA1) did not reach statistical significance, there seemed to be a correspondence. There is evidence that elevated levels of YKL‐40 in CSF from AD patients correlate with tau pathology 15, and that increased YKL‐40 levels are observed in the prodromal phase of AD 54, supporting its use as a prognostic AD biomarker. Our findings support the relevance of YKL‐40 as a biomarker for AD by connecting it to local microglial inflammation and AD pathology.
Analysis of the hippocampal subregions showed that the DG did not completely conform to the overall pattern: the OPLS‐DA indicated that the levels of BLT1 in DG did not contribute to the ability to separate between AD and controls, and that the contribution of ChemR23 to this ability was very low, as was the number of microglia with activated morphology. The total estimated number of microglia per section in DG was more informative in this respect. Hypometabolism and atrophy in the CG has been observed in patients diagnosed as early AD or with MCI symptoms, supporting the notion that these functional changes may be a result of CG‐hippocampal disconnection 16, 79. In addition, BF neurons also send projections to the CG 13, and a study revealed that enhancing cholinergic signaling by ACh esterase inhibitor treatment resulted in restoration of cerebral blood flow in the posterior CG, concomitant with improved cognitive function in AD patients 38. A recent study showed an increase in the levels of TNF receptor 1 (TNFR1) in the posterior CG of patients with AD 63, which together with our present results on HLA‐DR show an inflammatory profile in AD also in this part of the limbic system.
The levels of BLT1 were significantly higher in the BA46 region of AD cases. Studies on inflammation in the BA46 have mostly focused on mood disorders, showing increased levels of transmembrane and soluble TNF in BA46 in major depressive disorders (MDD) 17. Furthermore, elevated mRNA and protein levels of IL‐1, IL‐1 receptor (IL‐1R), GFAP and CD11b have been found in this region in patients with bipolar disorder 61. Alterations in BA46 have been shown to cause impairment in short‐term memory 57. The BA46 region receives a dense noradrenergic innervation from the noradrenergic neurons in the locus coeruleus (LC) nucleus, and degeneration of these neurons occurs early in the course of AD 78. Neurodegeneration of noradrenergic neurons leads to accelerated neuroinflammation in AD and in mouse models [see 20], demonstrating a role for the LC noradrenergic neurons in maintaining microglial homeostasis. The LC‐BA46 pathway may be a part of the regulatory neuronal pathways that provide control over inflammation 23, and the increase in inflammation and the levels of BLT1 in BA46 may reflect the loss of this control.
Contrary to the other brain regions, the CB showed little or no differences in BLT1 or ChemR23 between AD and control, and the OPLS‐DA model indicated a negligible impact of ChemR23 levels in CB. Analysis of advanced stages of AD has shown diffuse senile plaques in the molecular layer of CB 9, and it may be that the expression of ChemR23 is increased because of a progressive increase in Aβ pathology also in this brain region. However, the CB only shows pathology at very late stages of the disease, consistent with the findings in the current study.
Although it was apparent that the expression of BLT1 and ChemR23 closely followed AD molecular pathology and inflammation, we could not discern a clear correlative relationship between AD pathology, inflammation and the RvE1 receptor expression within the AD group (data not shown).
To elucidate the cause(s) of, and to interpret the consequences of the increase in the expression of BLT1 and ChemR23 it is important to take into account the two‐faced nature of these receptors when activated by different ligands: increasing as well as resolving inflammation. An increase in the levels of SPM receptors in AD may be harmful because of the combination of reduced levels of SPMs, and thereby decreased pro‐resolving signaling, and increased levels of harmful pro‐inflammatory ligands for these receptors, which may contribute to the neurodegeneration. The increased levels of these receptors in AD may be because of the inflammation in affected areas, which could drive the expression, as discussed previously. Indeed, BLT1 protein expression was up‐regulated in human NK cells by the pro‐inflammatory cytokine IL‐2 along with increased NK cell chemotaxis 84. Upon treatment with lipopolysaccharide (LPS), cytokines (TNF‐α and IL‐1β) and LTB4, human vein endothelial cells demonstrated increased mRNA and protein levels of BLT1, suggesting consequences of an early inflammatory response to an acute treatment, inability to resolve the immune response and development of chronic inflammation 58. An animal model with systemic LPS administration showed upregulation of ChemR23 and its internalization with Aβ, demonstrating ChemR23 as a functional receptor for Aβ 56, findings suggesting that the association between ChemR23 and AD may be more intimate and consequential than previously thought. Alternatively, a feedback response to decreased levels of the pro‐resolving SPMs may stimulate their expression as a compensation mechanism 85. This is supported by our recent data showing that ChemR23 receptor expression is elevated in a mouse model for Down syndrome and AD, while the ChemR23 levels were normalized by the administration of RvE1 (Hamlett et al., in submission). A reduction in SPMs has also been shown in other chronic inflammatory diseases, characterized by elevated cytokine production and persistent inflammation 35, 43, 88.
There may be an intimate relationship between aberrant or disrupted interregional signaling, the molecular pathology of AD, and chronic activation of glia, causing an interregional effect of impaired resolution which is reflected in the changes in SPM receptor expression described in this study, and in decreased levels of the SPMs shown in other studies 47, 85, 92. The multiregional increase in BLT1 and ChemR23 can be seen as an attempt to regain homeostasis in these regions, which in AD ultimately may fail because of an imbalance of pro‐resolving vs. pro‐inflammatory signaling through these receptors. Thus, a region suffering from pathology transmits aberrant neuronal signaling to other regions, in which a reaction occurs that leads to inflammation and stimulation of AD pathology, and when upregulation of SPM receptors occurs, it does so in an environment with reduced levels of SPMs and increased levels of pro‐inflammatory ligands, leading to increased levels of inflammation and neurodegeneration.
Finally, it can be hypothesized that there is a duality in the increased levels of SPM receptors such as BLT1 and ChemR23: during the acute phase the increase helps to orchestrate and maintain the inflammatory response by binding pro‐inflammatory ligands such as chemerin and LTB4, while upon clearance of pathogen the increased levels of SPMs induce resolution through the same receptors. This argument is in concordance with what has been stated by the pioneer in resolution biology, Dr. Charles Serhan 76. In AD, however, decreased levels of SPMs have been found and this is accompanied by increased levels of enzymes and receptors involved in SPM biosynthesis and resolution pathways 5, 85, demonstrating the loss of regulation of inflammation.
Conclusions
In this study, we report, for the first time, that higher levels of BLT1 and ChemR23 levels are detectable throughout the limbic system, frontal cortex and cerebellum in AD. Importantly, the increase in these receptors may either be a primary factor in the pathogenesis of the disease or a consequence of failed resolution. The expression of BLT1 and ChemR23 was not uniform within the brain, suggesting that function of these receptors varies in a region and cell type‐specific manner. It is conceivable that RvE1, which is a ligand for both receptors, by acting on glial and neuronal receptors, may decrease the release of inflammatory cytokines and resolve chronic inflammation and may therefore represent a novel drug target for AD.
Conflict of Interest
The authors declare that they have no conflict of interests.
Author Contributions
A‐CG dissected human brain tissues and was responsible for human tissue aspects of the study together with KB and SC. MS conducted the study in her laboratory and was responsible for overall design, immunohistochemistry, WB and statistical analysis. CE conducted the immunohistochemistry, WB, including microscopy, densitometry analysis and statistics, respectively. EH performed the OPLS, OPLS‐DA and PCA statistics. CE wrote the manuscript and all authors read and contributed to the manuscript writing.
Ethics Approval and Consent to Participate
The studies were conducted according to Good Clinical Practice guidelines, the Declaration of Helsinki, US 21CFR Part 50—Protection of Human Subjects, and Part 56—IRB, and they were conducted according to the state and federal HIPAA regulations, and were approved by the University of Denver (DU) IRB (1064064‐1). Post‐mortem consent was obtained from each donor according to the tissue donation laws in South Carolina (SC Anatomical Gift Act, Article 1, Chapter 44, Title 44, Code of SC Laws 1976). The studies were performed under an approved Non‐Human Research (NHR) protocol from the appropriate local IRB committee.
Supporting information
Figure S1. Blocking experiments for non‐specific binding of BLT1, ChemR23 and YKL‐40 antibodies in immunohistochemistry (IHC) (A–C) and Western blot (WB) (D–F). BLT1 (A, C) and ChemR23 (B) antibody specificity was tested by pre‐incubating antibodies with BLT1 and ChemR23 blocking peptides, respectively. The staining observed in neurons and glial cells (left column) for BLT1 in BA46 (arrow heads on neurons) and for ChemR23 in CG (arrow heads on neurons) is absent after incubation with antigen peptide (arrows on unlabelled neurons in middle column). No labelling is seen when omitting the primary antibodies (arrows on unlabelled neurons in right column). Bar = 50 µm. D–F. WB of human hippocampus shows that the signal for BLT1 at 55 kDa (D), ChemR23 at 45 kDa (E), and YKL‐40 at approximately 40 and 49 kDa (F), are blocked after pre‐incubation of the antibodies with antigen peptide. No labelling is seen when omitting the primary antibodies (right column). BLT1 = leukotriene B4 receptor, ChemR23 = chemokine‐like receptor 23, YKL40 = chitinase‐3‐like protein 1.
Figure S2. Visual scoring of immunohistochemical staining was based on a subjective evaluation of staining intensity by two individuals blinded to the case diagnosis. The micrographs show BLT1 staining of different intensities (mild, moderate and strong). Bar = 50 μm. BLT1 = leukotriene B4 receptor.
Figure S3. Uncropped images from Western blots of hippocampus (A, C), basal forebrain (B, C), BA46 (D, E) and cingulate gyrus (F) are shown, corresponding to the results shown in Figures 4B, 7B and 10A. The total protein staining as well as the blots after incubation with primary antibodies for BLT1, YKL40 and ChemR23 are shown. Internal control (IC) for each brain region is included in all Western blots. AD = Alzheimer's disease, BLT1 = leukotriene B4 receptor, BA46 = Brodmann area 46, ChemR23 = chemokine‐like receptor 23, C = control, YKL40 = Chitinase‐3‐like protein 1.
Figure S4. Heatmap illustrating the progression of tau and amyloid plaque pathology with ChemR23 and BLT1 visual scores across the different brain regions. The box colours range between 0 and 3 demonstrating subjective scores for the receptors. Red indicates high staining intensity, while white and blue represent moderate and low staining intensity, respectively. Each column represents the mean value of receptor scores from each case belonging to the same pathology score. Grey boxes indicate unavailable samples. BLT1 = leukotriene B4 receptor, ChemR23 = chemokine‐like receptor 23
Figure S5. Estimated number of microglial cells in different regions of Alzheimer's disease (AD) and control brains. The analysis showed significantly higher numbers of HLA‐DR‐positive cells in grey matter of the Brodmann area (BA) 46, cingulate gyrus (CG), entorhinal cortex (ENT), dentate gyrus (DG), CA1, CA2 and basal forebrain (BF) of AD cases compared to controls, whereas no difference was found for the cerebellum (CB). Horizontal bar indicates median. B. Micrographs showing HLA‐DR‐positive microglia in the white matter (WM) of BA46 and CG in control and AD. Bar = 50 µm. C. Analysis of HLA‐DR‐positive microglia in white matter of BA46 and CG shows significantly higher numbers in AD than in control in the BA46, but not in CG. Horizontal bars indicate median. CA = cornu Ammonis, HLA‐DR = human leukocyte antigen‐ D related.
Figure S6. Principal component analysis (PCA) of the levels of BLT1 and ChemR23 in BA46 (BA), cingulate gyrus (CG), basal forebrain (BF), CA1 (C1), CA2 (C2), dentate gyrus (DG), entorhinal cortex (EN), and cerebellum (CB) based on densitometric analysis of cases diagnosed with Alzheimer's disease (AD) early‐onset AD (eoAD), or non‐demented controls (C). The PCA model showed moderate quality (R2X(cum) = 0.58 and Q2(cum) = 0.252). A. The AD cases were positioned in the same region of component 1 as the variables containing the levels of BLT1 and ChemR23 (B, C), indicating that the levels of these are higher in AD cases. The distribution of the levels of BLT1 and ChemR23 on component 2 showed that the two factors are distinctly separated, indicating that there are other additional factors at play in determining their levels in addition to the presence of AD. The cases in C are represented by symbols indicating their apolipoprotein (Apo) E genotype. Early‐onset AD is indicated by #. BLT1 = leukotriene B4 receptor, BA46 = Brodmann area 46, ChemR23 = chemokine‐like receptor 23.
Figure S7. Cellular localisation of BLT1 and ChemR23 in human brain in relation to autofluorescence. The brain sections were imaged in a confocal microscope through the channel for emission at 510–530 nm (green (FITC)‐excitation at 488 nm) and emission at 570–600 nm (red (Cy3)‐excitation at 561 nm). A. Single labelling for BLT1 or ChemR23, respectively, shows vesicular structures in neuronal cell bodies (arrows). Micrographs taken of the same sections but viewed through the Cy3 channel with increased gain to see the autofluorescence show some autofluorescent structures (arrow heads in middle panels). The merged pictures show that the BLT1 (or ChemR23) antibodies are not labelling these autofluorescent structures. B. Autofluorescence of lipofuscin in the red channel was quenched with True black (TB). The sections were imaged at optimal settings for visualising the labelling with BLT and ChemR23 antibodies (arrows on neurons and unfilled arrows on glia), respectively. C and D. In order to analyse the presence of endogenous autofluorescence sections of the hilus region of human hippocampus from an AD case were incubated with (C) or without (D) TB and imaged at the regular gain settings used for optimal viewing of BLT and ChemR23 staining (upper panels in both C and D) or with higher gain settings (lower panels in both C and D). The sections were stained with DAPI to visualize cellular nuclei. Lipofuscin fluorescence was masked by TB. Lipofuscin granules can be seen in sections that were not incubated with TB (lower panel in D) and in the merged image of the green and red channels the lipofuscin granules appear yellow. BLT1 = leukotriene B4 receptor, ChemR23 = chemokine‐like receptor 23, DAPI = 4′,6‐diamidino‐2‐phenylindole, FITC = fluorescein isothiocyanate.
Acknowledgments
The authors would like to thank Ms. Anah Gilmore for assistance with tissue collection and sectioning and Ms. Veronica Cortez‐Toro for assistance with tissue processing. Frozen and fixed human brain tissues were obtained from the Carroll A. Campbell Jr. (CCNL) neuropathology laboratory at the Medical University of South Carolina. The authors would like to thank the Brain Bank personnel as well as autopsy personnel for their assistance in obtaining the tissues.
This study was supported by an R21 grant to A‐CG and MS from the National Institutes on Aging (R21AG048631). The authors would also like to thank The Swedish Research Council (22743, 22744), The Knut and Alice Wallenberg Foundation, Karolinska Institutet research funds, Stiftelsen för Gamla Tjänarinnor, The Swedish Alzheimer Foundation, The Swedish Brain Foundation and Gun och Bertil Stohnes Stiftelse.
Data Availability Statement
The data that support the findings of this study are available from the corresponding author upon reasonable request.
References
- 1. Andoh T, Kuraishi Y (2005) Expression of BLT1 leukotriene B4 receptor on the dorsal root ganglion neurons in mice. Brain Res Mol Brain Res 137:263–266. [DOI] [PubMed] [Google Scholar]
- 2. Arendt T, Taubert G, Bigl V, Arendt A (1988) Amyloid deposition in the nucleus basalis of Meynert complex: a topographic marker for degenerating cell clusters in Alzheimer's disease. Acta Neuropathol 75:226–232. [DOI] [PubMed] [Google Scholar]
- 3. Arita M, Bianchini F, Aliberti J, Sher A, Chiang N, Hong S et al (2005) Stereochemical assignment, antiinflammatory properties, and receptor for the omega‐3 lipid mediator resolvin E1. J Exp Med 201:713–722. [DOI] [PMC free article] [PubMed] [Google Scholar]
- 4. Arita M, Ohira T, Sun YP, Elangovan S, Chiang N, Serhan CN (2007) Resolvin E1 selectively interacts with leukotriene B4 receptor BLT1 and ChemR23 to regulate inflammation. J Immunology 178:3912–3917. [DOI] [PubMed] [Google Scholar]
- 5. Bazan NG (2009) Neuroprotectin D1‐mediated anti‐inflammatory and survival signaling in stroke, retinal degenerations, and Alzheimer's disease. J Lipid Res 50(Suppl.):S400–S405. [DOI] [PMC free article] [PubMed] [Google Scholar]
- 6. Bomalaski JS, Mong S (1987) Binding of leukotriene B4 and its analogs to human polymorphonuclear leukocyte membrane receptors. Prostaglandins 33:855–867. [DOI] [PubMed] [Google Scholar]
- 7. Bonneh‐Barkay D, Wang G, Starkey A, Hamilton RL, Wiley CA (2010) In vivo CHI3L1 (YKL‐40) expression in astrocytes in acute and chronic neurological diseases. J Neuroinflammation 7:34. [DOI] [PMC free article] [PubMed] [Google Scholar]
- 8. Braak H, Alafuzoff I, Arzberger T, Kretzschmar H, Del Tredici K (2006) Staging of Alzheimer disease‐associated neurofibrillary pathology using paraffin sections and immunocytochemistry. Acta Neuropathol 112:389–404. [DOI] [PMC free article] [PubMed] [Google Scholar]
- 9. Braak H, Braak E, Bohl J, Lang W (1989) Alzheimer's disease: amyloid plaques in the cerebellum. J Neurol Sci 93:277–287. [DOI] [PubMed] [Google Scholar]
- 10. Cairns NJ, Taylor‐Reinwald L, Morris JC, Alzheimer's Disease Neuroimaging I (2010) Autopsy consent, brain collection, and standardized neuropathologic assessment of ADNI participants: the essential role of the neuropathology core. Alzheimers Dement 6:274–279. [DOI] [PMC free article] [PubMed] [Google Scholar]
- 11. Carpenter AF, Carpenter PW, Markesbery WR (1993) Morphometric analysis of microglia in Alzheimer's disease. J Neuropathol Exp Neurol 52:601–608. [DOI] [PubMed] [Google Scholar]
- 12. Cash JL, Hart R, Russ A, Dixon JP, Colledge WH, Doran J et al (2008) Synthetic chemerin‐derived peptides suppress inflammation through ChemR23. J Exp Med 205:767–775. [DOI] [PMC free article] [PubMed] [Google Scholar]
- 13. Chandler DJ, Lamperski CS, Waterhouse BD (2013) Identification and distribution of projections from monoaminergic and cholinergic nuclei to functionally differentiated subregions of prefrontal cortex. Brain Res 1522:38–58. [DOI] [PMC free article] [PubMed] [Google Scholar]
- 14. Colas RA, Dalli J, Chiang N, Vlasakov I, Sanger JM, Riley IR, Serhan CN (2016) Identification and actions of the maresin 1 metabolome in infectious inflammation. J Immunol 197:4444–4452. [DOI] [PMC free article] [PubMed] [Google Scholar]
- 15. Craig‐Schapiro R, Perrin RJ, Roe CM, Xiong C, Carter D, Cairns NJ et al (2010) YKL‐40: a novel prognostic fluid biomarker for preclinical Alzheimer's disease. Biol Psychiatry 68:903–912. [DOI] [PMC free article] [PubMed] [Google Scholar]
- 16. De Santi S, de Leon MJ, Rusinek H, Convit A, Tarshish CY, Roche A et al (2001) Hippocampal formation glucose metabolism and volume losses in MCI and AD. Neurobiol Aging 22:529–539. [DOI] [PubMed] [Google Scholar]
- 17. Dean B, Tawadros N, Scarr E, Gibbons AS (2010) Regionally‐specific changes in levels of tumour necrosis factor in the dorsolateral prefrontal cortex obtained postmortem from subjects with major depressive disorder. J Affect Disord 120:245–248. [DOI] [PubMed] [Google Scholar]
- 18. Del Bo R, Angeretti N, Lucca E, De Simoni MG, Forloni G (1995) Reciprocal control of inflammatory cytokines, IL‐1 and IL‐6, and β‐amyloid production in cultures. Neurosci Lett 188:70–74. [DOI] [PubMed] [Google Scholar]
- 19. Eikelenboom P, Stam FC (1982) Immunoglobulins and complement factors in senile plaques. An immunoperoxidase study. Acta Neuropathol. 57:239–242. [DOI] [PubMed] [Google Scholar]
- 20. Feinstein DL, Kalinin S, Braun D (2016) Causes, consequences, and cures for neuroinflammation mediated via the locus coeruleus: noradrenergic signaling system. J Neurochem 139(Suppl 2):154–178. [DOI] [PubMed] [Google Scholar]
- 21. Fillman SG, Cloonan N, Catts VS, Miller LC, Wong J, McCrossin T et al (2013) Increased inflammatory markers identified in the dorsolateral prefrontal cortex of individuals with schizophrenia. Mol Psychiatry 18:206–214. [DOI] [PubMed] [Google Scholar]
- 22. Fredman G, Oh SF, Ayilavarapu S, Hasturk H, Serhan CN, Van Dyke TE (2011) Impaired phagocytosis in localized aggressive periodontitis: rescue by Resolvin E1. PLoS ONE 6:e24422. [DOI] [PMC free article] [PubMed] [Google Scholar]
- 23. Galea E, Heneka MT, Dello Russo C, Feinstein DL (2003) Intrinsic regulation of brain inflammatory responses. Cell Mol Neurobiol 23:625–635. [DOI] [PMC free article] [PubMed] [Google Scholar]
- 24. Gantz I, Konda Y, Yang YK, Miller DE, Dierick HA, Yamada T (1996) Molecular cloning of a novel receptor (CMKLR1) with homology to the chemotactic factor receptors. Cytogenet Cell Genet 74:286–290. [DOI] [PubMed] [Google Scholar]
- 25. Gefen T, Kim G, Bolbolan K, Geoly A, Ohm D, Oboudiyat C et al (2019) Activated microglia in cortical white matter across cognitive aging trajectories. Front Aging Neurosci 11:94. [DOI] [PMC free article] [PubMed] [Google Scholar]
- 26. Geula C, Mesulam MM (1996) Systematic regional variations in the loss of cortical cholinergic fibers in Alzheimer's disease. Cereb Cortex 6:165–177. [DOI] [PubMed] [Google Scholar]
- 27. Gilligan MM, Gartung A, Sulciner ML, Norris PC, Sukhatme VP, Bielenberg DR et al (2019) Aspirin‐triggered proresolving mediators stimulate resolution in cancer. Proc Natl Acad Sci U S A 116:6292–6297. [DOI] [PMC free article] [PubMed] [Google Scholar]
- 28. Goralski KB, McCarthy TC, Hanniman EA, Zabel BA, Butcher EC, Parlee SD et al (2007) Chemerin, a novel adipokine that regulates adipogenesis and adipocyte metabolism. J Biol Chem 282:28175–28188. [DOI] [PubMed] [Google Scholar]
- 29. Gorman RR, Ruppel PL, Lin AH (1985) Evidence for leukotriene B4 receptors in human neutrophils. Adv Prostaglandin Thromboxane Leukot Res 15:661–665. [PubMed] [Google Scholar]
- 30. Griffin WS, Sheng JG, Roberts GW, Mrak RE (1995) Interleukin‐1 expression in different plaque types in Alzheimer's disease: significance in plaque evolution. J Neuropathol Exp Neurol 54:276–281. [DOI] [PubMed] [Google Scholar]
- 31. Griffin WS, Sheng JG, Roystom MC, Gentleman SM, McKenzie JE, Graham DI et al (1998) Glial‐neuronal interactions in Alzheimer's disease: the potential role of a “cytokine cycle” in disease progression. Brain Pathol. 8:65–72. [DOI] [PMC free article] [PubMed] [Google Scholar]
- 32. Griffin WS, Stanley LC, Ling C, White L, MacLeod V, Perrot LJ et al (1989) Brain interleukin 1 and S‐100 immunoreactivity are elevated in Down syndrome and Alzheimer disease. Proc Natl Acad Sci U S A 86:7611–7615. [DOI] [PMC free article] [PubMed] [Google Scholar]
- 33. Hamilton JA, Hasturk H, Kantarci A, Serhan CN, Van Dyke T (2017) Atherosclerosis, periodontal disease, and treatment with resolvins. Curr Atheroscler Rep 19:57. [DOI] [PubMed] [Google Scholar]
- 34. Hampel H, Mesulam MM, Cuello AC, Farlow MR, Giacobini E, Grossberg GT et al (2018) The cholinergic system in the pathophysiology and treatment of Alzheimer's disease. Brain 141:1917–1933. [DOI] [PMC free article] [PubMed] [Google Scholar]
- 35. Hasan RA, O'Brien E, Mancuso P (2012) Lipoxin A(4) and 8‐isoprostane in the exhaled breath condensate of children hospitalized for status asthmaticus. Pediatr Crit Care Med 13:141–145. [DOI] [PMC free article] [PubMed] [Google Scholar]
- 36. Hayes GM, Woodroofe MN, Cuzner ML (1987) Microglia are the major cell type expressing MHC class II in human white matter. J Neurol Sci 80:25–37. [DOI] [PubMed] [Google Scholar]
- 37. Hoozemans JJ, Rozemuller AJ, van Haastert ES, Eikelenboom P, van Gool WA (2011) Neuroinflammation in Alzheimer's disease wanes with age. J Neuroinflammation 8:171. [DOI] [PMC free article] [PubMed] [Google Scholar]
- 38. Iizuka T, Kameyama M (2017) Cholinergic enhancement increases regional cerebral blood flow to the posterior cingulate cortex in mild Alzheimer's disease. Geriatr Gerontol Int 17:951–958. [DOI] [PubMed] [Google Scholar]
- 39. Jack CR Jr, Knopman DS, Weigand SD, Wiste HJ, Vemuri P, Lowe V et al (2012) An operational approach to National Institute on Aging‐Alzheimer's Association criteria for preclinical Alzheimer disease. Ann Neurol 71:765–775. [DOI] [PMC free article] [PubMed] [Google Scholar]
- 40. Karp CL, Flick LM, Park KW, Softic S, Greer TM, Keledjian R et al (2004) Defective lipoxin‐mediated anti‐inflammatory activity in the cystic fibrosis airway. Nat Immunol 5:388–392. [DOI] [PubMed] [Google Scholar]
- 41. Kaur J, Adya R, Tan BK, Chen J, Randeva HS (2010) Identification of chemerin receptor (ChemR23) in human endothelial cells: chemerin‐induced endothelial angiogenesis. Biochem Biophys Res Commun 391:1762–1768. [DOI] [PubMed] [Google Scholar]
- 42. Kreisle RA, Parker CW (1983) Specific binding of leukotriene B4 to a receptor on human polymorphonuclear leukocytes. J Exp Med 157:628–641. [DOI] [PMC free article] [PubMed] [Google Scholar]
- 43. Levy BD, Bonnans C, Silverman ES, Palmer LJ, Marigowda G, Israel E; Severe Asthma Research Program, National Heart, Lung, and Blood Institute (2005) Diminished lipoxin biosynthesis in severe asthma. Am J Respir Crit Care Med 172:824–830. [DOI] [PMC free article] [PubMed] [Google Scholar]
- 44. Lewis PR, Shute CC (1967) The cholinergic limbic system: projections to hippocampal formation, medial cortex, nuclei of the ascending cholinergic reticular system, and the subfornical organ and supra‐optic crest. Brain 90:521–540. [DOI] [PubMed] [Google Scholar]
- 45. Lin AH, Ruppel PL, Gorman RR (1984) Leukotriene B4 binding to human neutrophils. Prostaglandins 28:837–849. [DOI] [PubMed] [Google Scholar]
- 46. Luangsay S, Wittamer V, Bondue B, De Henau O, Rouger L, Brait M et al (2009) Mouse ChemR23 is expressed in dendritic cell subsets and macrophages, and mediates an anti‐inflammatory activity of chemerin in a lung disease model. J Immunol 183:6489–6499. [DOI] [PubMed] [Google Scholar]
- 47. Lukiw WJ, Cui JG, Marcheselli VL, Bodker M, Botkjaer A, Gotlinger K et al (2005) A role for docosahexaenoic acid‐derived neuroprotectin D1 in neural cell survival and Alzheimer disease. J Clin Invest 115:2774–2783. [DOI] [PMC free article] [PubMed] [Google Scholar]
- 48. Mattiace LA, Davies P, Dickson DW (1990) Detection of HLA‐DR on microglia in the human brain is a function of both clinical and technical factors. Am J Pathol 136:1101–1114. [PMC free article] [PubMed] [Google Scholar]
- 49. Merched AJ, Ko K, Gotlinger KH, Serhan CN, Chan L (2008) Atherosclerosis: evidence for impairment of resolution of vascular inflammation governed by specific lipid mediators. FASEB J 22:3595–3606. [DOI] [PMC free article] [PubMed] [Google Scholar]
- 50. Mesulam M, Shaw P, Mash D, Weintraub S (2004) Cholinergic nucleus basalis tauopathy emerges early in the aging‐MCI‐AD continuum. Ann Neurol 55:815–828. [DOI] [PubMed] [Google Scholar]
- 51. Montine TJ, Phelps CH, Beach TG, Bigio EH, Cairns NJ, Dickson DW et al (2012) National Institute on Aging‐Alzheimer's Association guidelines for the neuropathologic assessment of Alzheimer's disease: a practical approach. Acta Neuropathol 123:1–11. [DOI] [PMC free article] [PubMed] [Google Scholar]
- 52. Oh SF, Pillai PS, Recchiuti A, Yang R, Serhan CN (2011) Pro‐resolving actions and stereoselective biosynthesis of 18S E‐series resolvins in human leukocytes and murine inflammation. J Clin Invest 121:569–581. [DOI] [PMC free article] [PubMed] [Google Scholar]
- 53. Ojala J, Alafuzoff I, Herukka SK, van Groen T, Tanila H, Pirttila T (2009) Expression of interleukin‐18 is increased in the brains of Alzheimer's disease patients. Neurobiol Aging 30:198–209. [DOI] [PubMed] [Google Scholar]
- 54. Olsson B, Hertze J, Lautner R, Zetterberg H, Nagga K, Hoglund K et al (2013) Microglial markers are elevated in the prodromal phase of Alzheimer's disease and vascular dementia. J Alzheimers Dis 33:45–53. [DOI] [PubMed] [Google Scholar]
- 55. Parolini S, Santoro A, Marcenaro E, Luini W, Massardi L, Facchetti F et al (2007) The role of chemerin in the colocalization of NK and dendritic cell subsets into inflamed tissues. Blood 109:3625–3632. [DOI] [PubMed] [Google Scholar]
- 56. Peng L, Yu Y, Liu J, Li S, He H, Cheng N, Ye RD (2015) The chemerin receptor CMKLR1 is a functional receptor for amyloid‐β peptide. J Alzheimers Dis 43:227–242. [DOI] [PubMed] [Google Scholar]
- 57. Petrides M, Pandya DN (1999) Dorsolateral prefrontal cortex: comparative cytoarchitectonic analysis in the human and the macaque brain and corticocortical connection patterns. Eur J Neurosci 11:1011–1036. [DOI] [PubMed] [Google Scholar]
- 58. Qiu H, Johansson AS, Sjostrom M, Wan M, Schroder O, Palmblad J, Haeggstrom JZ (2006) Differential induction of BLT receptor expression on human endothelial cells by lipopolysaccharide, cytokines, and leukotriene B4. Proc Natl Acad Sci U S A 103:6913–6918. [DOI] [PMC free article] [PubMed] [Google Scholar]
- 59. Querol‐Vilaseca M, Colom‐Cadena M, Pegueroles J, San Martin‐Paniello C, Clarimon J, Belbin O et al (2017) YKL‐40 (Chitinase 3‐like I) is expressed in a subset of astrocytes in Alzheimer's disease and other tauopathies. J Neuroinflammation 14:118. [DOI] [PMC free article] [PubMed] [Google Scholar]
- 60. Raj D, Yin Z, Breur M, Doorduin J, Holtman IR, Olah M et al (2017) Increased white matter inflammation in aging‐ and Alzheimer's disease brain. Front Mol Neurosci 10:206. [DOI] [PMC free article] [PubMed] [Google Scholar]
- 61. Rao JS, Harry GJ, Rapoport SI, Kim HW (2010) Increased excitotoxicity and neuroinflammatory markers in postmortem frontal cortex from bipolar disorder patients. Mol Psychiatry 15:384–392. [DOI] [PMC free article] [PubMed] [Google Scholar]
- 62. Raouf R, Quick K, Wood JN (2010) Pain as a channelopathy. J Clin Invest 120:3745–3752. [DOI] [PMC free article] [PubMed] [Google Scholar]
- 63. Ravichandran S, Michelucci A, Del Sol A (2018) Integrative computational network analysis reveals site‐specific mediators of inflammation in Alzheimer's disease. Front Physiol 9:154. [DOI] [PMC free article] [PubMed] [Google Scholar]
- 64. Recchiuti A, Serhan CN (2012) Pro‐resolving lipid mediators (SPMs) and their actions in regulating miRNA in novel resolution circuits in inflammation. Front Immunol 3:298. [DOI] [PMC free article] [PubMed] [Google Scholar]
- 65. Samson M, Edinger AL, Stordeur P, Rucker J, Verhasselt V, Sharron M et al (1998) ChemR23, a putative chemoattractant receptor, is expressed in monocyte‐derived dendritic cells and macrophages and is a coreceptor for SIV and some primary HIV‐1 strains. Eur J Immunol 28:1689–1700. [DOI] [PubMed] [Google Scholar]
- 66. Sanchez‐Mejias E, Navarro V, Jimenez S, Sanchez‐Mico M, Sanchez‐Varo R, Nunez‐Diaz C et al (2016) Soluble phospho‐tau from Alzheimer's disease hippocampus drives microglial degeneration. Acta Neuropathol 132:897–916. [DOI] [PMC free article] [PubMed] [Google Scholar]
- 67. Scheff SW, Price DA (2001) Alzheimer's disease‐related synapse loss in the cingulate cortex. J Alzheimers Dis 3:495–505. [DOI] [PubMed] [Google Scholar]
- 68. Seeley WW, Carlin DA, Allman JM, Macedo MN, Bush C, Miller BL, Dearmond SJ (2006) Early frontotemporal dementia targets neurons unique to apes and humans. Ann Neurol 60:660–667. [DOI] [PubMed] [Google Scholar]
- 69. Serhan CN (2010) Novel lipid mediators and resolution mechanisms in acute inflammation: to resolve or not? Am J Pathol 177:1576–1591. [DOI] [PMC free article] [PubMed] [Google Scholar]
- 70. Serhan CN (2014) Pro‐resolving lipid mediators are leads for resolution physiology. Nature 510:92–101. [DOI] [PMC free article] [PubMed] [Google Scholar]
- 71. Serhan CN (2017) Discovery of specialized pro‐resolving mediators marks the dawn of resolution physiology and pharmacology. Mol Aspects Med 58:1–11. [DOI] [PMC free article] [PubMed] [Google Scholar]
- 72. Serhan CN, Brain SD, Buckley CD, Gilroy DW, Haslett C, O'Neill LA et al (2007) Resolution of inflammation: state of the art, definitions and terms. FASEB J 21:325–332. [DOI] [PMC free article] [PubMed] [Google Scholar]
- 73. Serhan CN, Chiang N, Dalli J, Levy BD (2014) Lipid mediators in the resolution of inflammation. Cold Spring Harb Perspect Biol 7:a016311. Available at: https://www.ncbi.nlm.nih.gov/pubmed/25359497. [DOI] [PMC free article] [PubMed] [Google Scholar]
- 74. Serhan CN, Chiang N, Van Dyke TE (2008) Resolving inflammation: dual anti‐inflammatory and pro‐resolution lipid mediators. Nat Rev Immunol 8:349–361. [DOI] [PMC free article] [PubMed] [Google Scholar]
- 75. Serhan CN, Krishnamoorthy S, Recchiuti A, Chiang N (2011) Novel anti‐inflammatory ‐ pro‐resolving mediators and their receptors. Curr Top Med Chem 11:629–647. [DOI] [PMC free article] [PubMed] [Google Scholar]
- 76. Serhan CN, Savill J (2005) Resolution of inflammation: the beginning programs the end. Nat Immunol 6:1191–1197. [DOI] [PubMed] [Google Scholar]
- 77. Sheng JG, Mrak RE, Griffin WS (1997) Glial‐neuronal interactions in Alzheimer disease: progressive association of IL‐1α+ microglia and S100β+ astrocytes with neurofibrillary tangle stages. J Neuropathol Exp Neurol 56:285–290. [PubMed] [Google Scholar]
- 78. Simic G, Babic Leko M, Wray S, Harrington CR, Delalle I, Jovanov‐Milosevic N et al (2017) Monoaminergic neuropathology in Alzheimer's disease. Prog Neurogibol 151:101–138. [DOI] [PMC free article] [PubMed] [Google Scholar]
- 79. Small SA, Schobel SA, Buxton RB, Witter MP, Barnes CA (2011) A pathophysiological framework of hippocampal dysfunction in ageing and disease. Nat Rev Neurosci 12:585–601. [DOI] [PMC free article] [PubMed] [Google Scholar]
- 80. Tager AM, Luster AD (2003) BLT1 and BLT2: the leukotriene B(4) receptors. Prostaglandins Leukot Essent Fatty Acids 69:123–134. [DOI] [PubMed] [Google Scholar]
- 81. Terrando N, Yang T, Ryu JK, Newton PT, Monaco C, Feldmann M et al (2015) Stimulation of the α7 nicotinic acetylcholine receptor protects against neuroinflammation after tibia fracture and endotoxemia in mice. Mol Med 20:667–675. [DOI] [PMC free article] [PubMed] [Google Scholar]
- 82. Thal DR, Rub U, Orantes M, Braak H (2002) Phases of Aβ‐deposition in the human brain and its relevance for the development of AD. Neurology 58:1791–1800. [DOI] [PubMed] [Google Scholar]
- 83. Vehmas AK, Kawas CH, Stewart WF, Troncoso JC (2003) Immune reactive cells in senile plaques and cognitive decline in Alzheimer's disease. Neurobiol Aging 24:321–331. [DOI] [PubMed] [Google Scholar]
- 84. Wang M, Mostafa El‐Maghraby N, Turcotte S, Rola‐Pleszczynski M, Stankova J (2015) Differential contribution of BLT1 and BLT2 to leukotriene B4‐induced human NK cell cytotoxicity and migration. Mediators Inflamm 2015:389849. [DOI] [PMC free article] [PubMed] [Google Scholar]
- 85. Wang X, Zhu M, Hjorth E, Cortés‐Toro V, Eyjolfsdottir H, Graff C et al (2015) Resolution of inflammation is altered in Alzheimer's disease. Alzheimers Dement 11:40–50. [DOI] [PMC free article] [PubMed] [Google Scholar]
- 86. Wittamer V, Franssen JD, Vulcano M, Mirjolet JF, Le Poul E, Migeotte I et al (2003) Specific recruitment of antigen‐presenting cells by chemerin, a novel processed ligand from human inflammatory fluids. J Exp Med 198:977–985. [DOI] [PMC free article] [PubMed] [Google Scholar]
- 87. Wojtera M, Sobow T, Kloszewska I, Liberski PP, Brown DR, Sikorska B (2012) Expression of immunohistochemical markers on microglia in Creutzfeldt‐Jakob disease and Alzheimer's disease: morphometric study and review of the literature. Folia Neuropathol 50:74–84. [PubMed] [Google Scholar]
- 88. Yang J, Eiserich JP, Cross CE, Morrissey BM, Hammock BD (2012) Metabolomic profiling of regulatory lipid mediators in sputum from adult cystic fibrosis patients. Free Radic Biol Med 53:160–171. [DOI] [PMC free article] [PubMed] [Google Scholar]
- 89. Ye ZN, Zhuang Z, Wu LY, Liu JP, Chen Q, Zhang XS et al (2016) Expression and cell distribution of leukotriene B4 receptor 1 in the rat brain cortex after experimental subarachnoid hemorrhage. Brain Res 1652:127–134. [DOI] [PubMed] [Google Scholar]
- 90. Yokomizo T, Izumi T, Chang K, Takuwa Y, Shimizu T (1997) A G‐protein‐coupled receptor for leukotriene B4 that mediates chemotaxis. Nature 387:620–624. [DOI] [PubMed] [Google Scholar]
- 91. Zhang C, Wang Y, Wang D, Zhang J, Zhang F (2018) NSAID exposure and risk of Alzheimer's disease: an updated meta‐analysis from cohort studies. Front Aging Neurosci 10:83. [DOI] [PMC free article] [PubMed] [Google Scholar]
- 92. Zhu M, Wang X, Hjorth E, Colas RA, Schroeder L, Granholm AC et al (2016) Pro‐resolving lipid mediators improve neuronal survival and increase Aβ42 phagocytosis. Mol Neurobiol 53:2733–2749. [DOI] [PMC free article] [PubMed] [Google Scholar]
Associated Data
This section collects any data citations, data availability statements, or supplementary materials included in this article.
Supplementary Materials
Figure S1. Blocking experiments for non‐specific binding of BLT1, ChemR23 and YKL‐40 antibodies in immunohistochemistry (IHC) (A–C) and Western blot (WB) (D–F). BLT1 (A, C) and ChemR23 (B) antibody specificity was tested by pre‐incubating antibodies with BLT1 and ChemR23 blocking peptides, respectively. The staining observed in neurons and glial cells (left column) for BLT1 in BA46 (arrow heads on neurons) and for ChemR23 in CG (arrow heads on neurons) is absent after incubation with antigen peptide (arrows on unlabelled neurons in middle column). No labelling is seen when omitting the primary antibodies (arrows on unlabelled neurons in right column). Bar = 50 µm. D–F. WB of human hippocampus shows that the signal for BLT1 at 55 kDa (D), ChemR23 at 45 kDa (E), and YKL‐40 at approximately 40 and 49 kDa (F), are blocked after pre‐incubation of the antibodies with antigen peptide. No labelling is seen when omitting the primary antibodies (right column). BLT1 = leukotriene B4 receptor, ChemR23 = chemokine‐like receptor 23, YKL40 = chitinase‐3‐like protein 1.
Figure S2. Visual scoring of immunohistochemical staining was based on a subjective evaluation of staining intensity by two individuals blinded to the case diagnosis. The micrographs show BLT1 staining of different intensities (mild, moderate and strong). Bar = 50 μm. BLT1 = leukotriene B4 receptor.
Figure S3. Uncropped images from Western blots of hippocampus (A, C), basal forebrain (B, C), BA46 (D, E) and cingulate gyrus (F) are shown, corresponding to the results shown in Figures 4B, 7B and 10A. The total protein staining as well as the blots after incubation with primary antibodies for BLT1, YKL40 and ChemR23 are shown. Internal control (IC) for each brain region is included in all Western blots. AD = Alzheimer's disease, BLT1 = leukotriene B4 receptor, BA46 = Brodmann area 46, ChemR23 = chemokine‐like receptor 23, C = control, YKL40 = Chitinase‐3‐like protein 1.
Figure S4. Heatmap illustrating the progression of tau and amyloid plaque pathology with ChemR23 and BLT1 visual scores across the different brain regions. The box colours range between 0 and 3 demonstrating subjective scores for the receptors. Red indicates high staining intensity, while white and blue represent moderate and low staining intensity, respectively. Each column represents the mean value of receptor scores from each case belonging to the same pathology score. Grey boxes indicate unavailable samples. BLT1 = leukotriene B4 receptor, ChemR23 = chemokine‐like receptor 23
Figure S5. Estimated number of microglial cells in different regions of Alzheimer's disease (AD) and control brains. The analysis showed significantly higher numbers of HLA‐DR‐positive cells in grey matter of the Brodmann area (BA) 46, cingulate gyrus (CG), entorhinal cortex (ENT), dentate gyrus (DG), CA1, CA2 and basal forebrain (BF) of AD cases compared to controls, whereas no difference was found for the cerebellum (CB). Horizontal bar indicates median. B. Micrographs showing HLA‐DR‐positive microglia in the white matter (WM) of BA46 and CG in control and AD. Bar = 50 µm. C. Analysis of HLA‐DR‐positive microglia in white matter of BA46 and CG shows significantly higher numbers in AD than in control in the BA46, but not in CG. Horizontal bars indicate median. CA = cornu Ammonis, HLA‐DR = human leukocyte antigen‐ D related.
Figure S6. Principal component analysis (PCA) of the levels of BLT1 and ChemR23 in BA46 (BA), cingulate gyrus (CG), basal forebrain (BF), CA1 (C1), CA2 (C2), dentate gyrus (DG), entorhinal cortex (EN), and cerebellum (CB) based on densitometric analysis of cases diagnosed with Alzheimer's disease (AD) early‐onset AD (eoAD), or non‐demented controls (C). The PCA model showed moderate quality (R2X(cum) = 0.58 and Q2(cum) = 0.252). A. The AD cases were positioned in the same region of component 1 as the variables containing the levels of BLT1 and ChemR23 (B, C), indicating that the levels of these are higher in AD cases. The distribution of the levels of BLT1 and ChemR23 on component 2 showed that the two factors are distinctly separated, indicating that there are other additional factors at play in determining their levels in addition to the presence of AD. The cases in C are represented by symbols indicating their apolipoprotein (Apo) E genotype. Early‐onset AD is indicated by #. BLT1 = leukotriene B4 receptor, BA46 = Brodmann area 46, ChemR23 = chemokine‐like receptor 23.
Figure S7. Cellular localisation of BLT1 and ChemR23 in human brain in relation to autofluorescence. The brain sections were imaged in a confocal microscope through the channel for emission at 510–530 nm (green (FITC)‐excitation at 488 nm) and emission at 570–600 nm (red (Cy3)‐excitation at 561 nm). A. Single labelling for BLT1 or ChemR23, respectively, shows vesicular structures in neuronal cell bodies (arrows). Micrographs taken of the same sections but viewed through the Cy3 channel with increased gain to see the autofluorescence show some autofluorescent structures (arrow heads in middle panels). The merged pictures show that the BLT1 (or ChemR23) antibodies are not labelling these autofluorescent structures. B. Autofluorescence of lipofuscin in the red channel was quenched with True black (TB). The sections were imaged at optimal settings for visualising the labelling with BLT and ChemR23 antibodies (arrows on neurons and unfilled arrows on glia), respectively. C and D. In order to analyse the presence of endogenous autofluorescence sections of the hilus region of human hippocampus from an AD case were incubated with (C) or without (D) TB and imaged at the regular gain settings used for optimal viewing of BLT and ChemR23 staining (upper panels in both C and D) or with higher gain settings (lower panels in both C and D). The sections were stained with DAPI to visualize cellular nuclei. Lipofuscin fluorescence was masked by TB. Lipofuscin granules can be seen in sections that were not incubated with TB (lower panel in D) and in the merged image of the green and red channels the lipofuscin granules appear yellow. BLT1 = leukotriene B4 receptor, ChemR23 = chemokine‐like receptor 23, DAPI = 4′,6‐diamidino‐2‐phenylindole, FITC = fluorescein isothiocyanate.
Data Availability Statement
The data that support the findings of this study are available from the corresponding author upon reasonable request.