

Abstract
Tuberous sclerosis complex (TSC) is a rare hereditary disease, which results from the mutation of either TSC1 or TSC2, and its clinical features include benign tumors and dysfunctions in numerous organs, including the brain. Many individuals with TSC manifest neuropsychiatric symptoms, such as learning impairments, cognitive deficits and anxiety. Current pharmacological treatment for TSC is the use of mTOR inhibitors. However, they are not effective in treating neuropsychiatric symptoms. We previously used curcumin, a diet‐derived mTOR inhibitor, which possesses both anti‐inflammatory and antiproliferative properties, to improve learning and memory deficits in Tsc2 +/− mice. Diffusion tensor imaging (DTI) provides microstructural information in brain tissue and has been used to study the neuropathological changes in TSC. In this study, we confirmed that the impaired recognition memory and increased anxiety‐like behavior in Tsc2 +/− mice can be reversed by curcumin treatment. Second, we found altered fractional anisotropy and mean diffusivity in the anterior cingulate cortex and the hippocampus of the Tsc2 +/− mice, which may indicate altered circuitry. Finally, the mTOR complex 1 hyperactivity was found in the cortex and hippocampus, coinciding with abnormal cortical myelination and increased glial fibrillary acidic protein expression in the hippocampal CA1 of Tsc2 +/− mice, both of which can be rescued with curcumin treatment. Overall, DTI is sensitive to the subtle alterations that cannot be detected by conventional imaging, suggesting that noninvasive DTI may be suitable for longitudinally monitoring the in vivo neuropathology associated with the neuropsychiatric symptoms in TSC, thereby facilitating future clinical trials of pharmacological treatments.
Keywords: anxiety, cognitive dysfunction, curcumin, diffusion tensor imaging, fractional anisotropy, mTOR, tuberous sclerosis complex
Introduction
Tuberous sclerosis complex (TSC) is a genetic disease caused by the mutation in either TSC1 or TSC2 with manifestations of tumor‐like lesions (also known as hamartomas) in multiple organ systems, including the central nervous system (CNS) (26). Conventional magnetic resonance imaging (MRI) in TSC has revealed three types of brain lesions: cortical tubers (90%), subependymal nodules (SENs) (80%) and subependymal giant cell tumors (SGCTs) or subependymal giant cell astrocytomas (SEGAs) (up to 15%) (32, 74). Further histological analyses of these brain hamartomas have shown features of cell enlargement and abnormal cell overgrowth of neurons and astrocytes (43). The vast majority of patients also comorbid one or more neurological and psychiatric symptoms include epilepsy, autistic behavior, learning and cognitive impairment, along with emotional problems such as anxiety and self‐injurious behavior, which are collectively called TSC‐associated neuropsychiatric disorders (TANDs) (74).
TSC1 and TSC2 encode hamartin and tuberin proteins, respectively, which together form a functional heterodimer that inhibits the mTOR pathway via inactivation of Ras homolog enriched in brain protein through activation of GTPase (27). The mTOR pathway has been implicated in playing a major role in regulating the cell growth and metabolism through many important cellular processes including protein and lipid synthesis, autophagy and nutrient uptake (58). In both human and rodents, haploinsufficiency of TSC genes causes hyperactivation of the mTOR complex 1 (mTORC1), resulting in cell overgrowth and dysplasia of both neuronal and glial cells during brain development (32, 46, 97). Animal studies have identified that hyperactive mTORC1, caused by loss of Tsc1 or Tsc2, is highly associated with impaired neuronal connectivity, as it affects processes such axonal development, synapse formation and myelination (25, 52, 72).
Recently, the mTOR kinase has also emerged as a key regulator of innate immune cell function and overactivation of this enzyme has been implicated in neuroinflammation, which underlies several neurodegenerative (59, 65, 75, 78, 103) and neurodevelopmental diseases (31, 50). Studies have shown that there is a tight link between mTOR dysregulation and cognitive function in these diseases. Furthermore, neuroinflammation, particularly astrocyte activation, which contributes to impaired neural functions by inducing neuronal death, has been implicated in these diseases (10, 63). Several lines of evidence show that inhibition of mTOR kinase activity by rapamycin in glial cells results in anti‐inflammatory actions (29, 30, 64). Inflammation has also been reported in both the tissues of TSC patients and brains of TSC mouse models (18, 19, 67, 68, 105), suggesting a close relationship between neuropsychiatric symptoms and neuroinflammation. Therefore, a promising therapeutic approach is to target mTOR pathway to inhibit inflammatory actions during TSC pathogenesis (105).
Based on the dysregulated TSC‐mTOR pathway, mTOR inhibition has been used as a therapeutic strategy for treating TSC (27, 52). A number of preclinical studies using different CNS mouse models of TSC have probed into the use of the mTOR inhibitors (i.e., sirolimus or everolimus) on decreasing the tumor size, controlling the seizures and improving the autistic behavior and learning skills (36, 71, 87, 92). In clinical trials, rapamycin has been proven to reduce the size of astrocytomas and seizure frequency (39, 54). Based on these successful clinical trials, the US Federal Drug Administration approved the use of the Novartis drug Afinitor DISPERZ® (everolimus) on TSC‐associated epilepsy and subependymal giant cell astrocytomas (38). However, despite the positive results in treating cognitive deficits in animals, two clinical trials using everolimus to improve neurocognition in TSC have failed, with the occurrence of up to 60% of adverse events (53, 83). Its pharmacological actions on other neuropsychiatric disorders still remain uncertain and its safety in young children is still unclear. Therefore, the use of other mTOR inhibitors to treat TANDs should be investigated.
Curcumin, a natural polyphenolic compound derived from the plant Curcuma longa, is known to possess neuroprotective effects that may act through its anti‐inflammatory and anti‐oxidant properties (14). Various studies have revealed that curcumin treatment suppresses the production of inflammatory cytokines in cultured cells (1). Moreover, two recent reports have provided evidence that curcumin prevents neuroinflammation by inhibiting reactive astrocytes and microglia activation in inflammation‐induced rodent models (73, 90). In the past decade, the compound has become known as a potent mTOR inhibitor, based on its involvement of tumor suppression in various cancer cell lines via inhibition of the mTOR pathway (1, 13, 47). Because of its dual anti‐inflammatory and antiproliferative effects, our previous study has used curcumin to treat Tsc2+/ − mice and demonstrated the efficacy of this natural mTOR inhibitor on hippocampus‐dependent learning and recognition memory in TSC (56). Unfortunately, despite that the conventional MRI has been used clinically to detect brain lesions in TSC, no neuroimaging biomarker that correlates with the neurobehavioral phenotype is available. Identification of these image‐based endophenotypes associated with neuropsychiatric symptoms would facilitate future clinical trials of mTOR inhibition, such as curcumin treatment in TSC.
Diffusion tensor imaging (DTI) is an MRI sequence that characterizes the structural integrity based on the motion of water molecules (60). In brain tissue, the water molecules move in the extracellular and intracellular space and their motion is impeded by several factors. The extracellular space comprises all kinds of glial cells (e.g., oligodendrocytes and astrocytes) and neurons and their neurites, which may affect the displacement of water molecules. Within the cell, a variety of restriction factors, such as cell membranes, the cytoskeleton and macromolecules can hinder the motion of water molecules (12). It is well‐established that microstructural properties of brain tissue can be reflected by two DTI‐derived parameters: fractional anisotropy (FA) and mean diffusivity (MD) values. FA provides the degree of asymmetry in water diffusion within the tensor model in one direction, while MD is the average of the eigenvalues of the tensor model, regardless of the direction of the motion (3). These two DTI measures have been applied to quantitatively characterize the tissue changes in conditions such as ischemia, demyelination/dysmyelination, edema, neoplasia (3) and also neurocognitive or psychiatric disorders such as Alzheimer’s disease (69), schizophrenia and autism spectrum disorder (96).
FA and MD parameters provide quite different information to the intrinsic properties of the neuropathology. Past studies have shown that FA can reflect the direction of water movement in the spacing along the axons and is affected by the axon density, axon diameter and the myelin thickness (12). Indeed, FA is found to be highly associated with myelination, as decreased anisotropy is observed in demyelination diseases such as multiple sclerosis (7). To date, increasing work has been done to define the relationships between DTI measures and inflammation using traumatic brain injury models (49). In particular, several diffusion MRI studies have demonstrated changes in diffusivity and anisotropy (as reflected by MD and FA values, respectively) correlated strongly with astrocytosis (22, 85, 106). Cytoarchitectural and myeloarchitectural alterations seem likely to modify the tissue environment, which are detectable by DTI, making it a promising tool for detecting subtle differences in the TSC pathological conditions.
Clinically, DTI has a putative role in finding the epileptogenic lesions in TSC patients when performing neurosurgery. Despite that the severity of cognitive functions strongly correlates with the brain lesions and the presence of seizures in TSC clinically, recent reports have also indicated that, in a number of cases, TANDs occur in patients without brain hamartomas and/or epilepsy. (46, 52, 98). Hence, a number of studies have attempted to use DTI to investigate the anatomical alterations in white and gray matter structures that underlie the neurocognitive morbidity in TSC patients (6, 41, 66, 80). The absence of brain malformations such as tubers in the heterozygous mouse models of Tsc1+/ − and Tsc2+/ −, which both show poor learning and memory performance and social behavior, also suggest that other subtle microscopic structural changes may account for neurologic symptoms (36, 87). However, to our knowledge, very little work has been done to study the microstructural alterations using region‐of‐interest (ROI)‐based DTI analysis on gray matter structures in TSC brains of small rodents.
In the current study, we first tested the potency of curcumin treatment on TSC‐associated neuropsychiatric deficits. Next, we focused on the brain structures known to be involved in emotion, learning and memory, which include the anterior cingulate cortex, prefrontal cortex, hippocampus, amygdala and thalamus. To elucidate the potential role of DTI analysis as a means of detecting microstructural changes in TSC, we employed FA and MD measurements to assess the morphological differences among wild‐type littermates (WT), Tsc2+/ − mice (TSC) and Tsc2+/ − mice fed with curcumin (TSC/cur). Finally, we used immunostaining assays of the brain sections to determine the cellular compositional changes that corresponded with the DTI results.
Materials and Methods
Animals
The animal protocols used in this study complied with the guidelines of the Taipei Medical University Institutional Animal Care and Use Committee (IACUC). All experiments were performed in accordance with the US Public Health Service Policy on Humane Care and Use of Laboratory Animals. All animals were housed in an air‐conditioned vivarium with free access to food and water and a 10/14 h light/dark cycle. The Tsc2 +/‐ heterozygous knockout mice (JAX stock #004686; B6;129S4‐Tsc2 < tm1Djk>/J) used in this study were originally purchased from the Jackson Laboratory (Bar Harbor, ME, USA). Previous reports have indicated that this mouse model shows cognitive deficits without the presence of seizures and brain malformations such as cortical tubers, subependymal nodules and subependymal giant cell astrocytomas (36, 76).
Animal grouping and experimental design
The experimental design and time line are illustrated in Figure 1. At 4 weeks of age, after weaning, mice were divided into three experimental groups: (i) WT mice (N = 11) fed with normal diet chow, (ii) TSC mice (N = 11) fed with normal diet chow and (iii) TSC mice (N = 8) fed with curcumin‐containing chow. At 6 weeks of age, the TSC mice started the 0.2% of curcumin diet. Following 6 weeks of treatment, at 12 weeks of age, WT, TSC and TSC/cur mice were subject to behavioral tests, novel object recognition (NOR) and open‐field tests, to determine their cognitive deficits and anxiety‐like behavior. MRI acquisition was performed at 12 to 14 weeks of age. After MRI scanning, mice were sacrificed and brain slices were obtained for further histological and immunostaining analyses.
Figure 1.
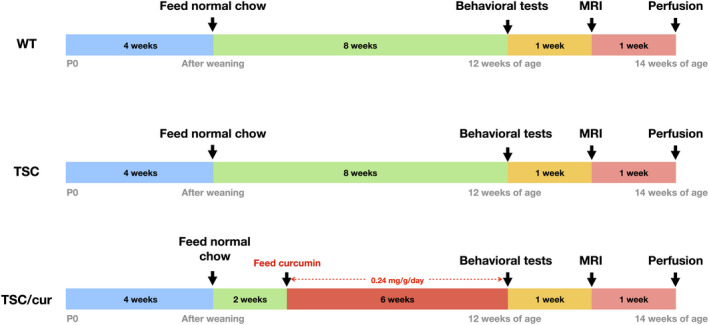
Experimental procedures. At 4 weeks of age, after weaning, mice were divided into three experimental groups: (1) WT mice (N = 11) fed with normal diet chow, (2) TSC mice (N = 11) fed with normal diet chow and (3) TSC mice (N = 8) fed with curcumin‐containing chow. At 6 weeks of age, the TSC mice started a 0.2% of curcumin diet. After treatment for 6 weeks, at 12 weeks of age, the WT, TSC and TSC/cur groups were subject to novel object recognition and open‐field tests to determine their cognitive deficits and anxiety‐like behavior. MRI acquisition was performed at 12–14 weeks of age. After MRI scanning, mice were sacrificed and brain sections were obtained for further histological and immunostaining analyses.
Curcumin treatment
In this study, the curcumin treatment was administered orally. Longvida® solid lipid curcumin particles (SLCP, Verdure Sciences Inc., Noblesville, IN, USA) were obtained from NOW FOODS (Bloomingdale, IL, USA). Each capsule is a 400 mg curcumin extract formulation containing ~ 80 mg patented lipid‐coated SLCP. The curcumin powder was thoroughly blended into pulverized standard rodent chow (Oriental Yeast Co. Ltd, Tokyo, Japan) and 3% high viscosity hydroxypropyl methyl cellulose (Wei Ming Pharmaceutical, Taipei, Taiwan) to give a final concentration of 0.2% of curcumin powder (containing about 0.04% of SLCP). The mixture was mixed with minimum quantity of autoclaved water, molded into pellets and allowed to dry overnight in an oven set at 65°C. The average daily food intake for a mouse is estimated to be 0.12 g/g body weight/day (8). One gram of food chow contained 2 mg of curcumin powder. Therefore, the daily intake of curcumin for a mouse in this study was estimated to be 0.24 mg/g body weight.
Behavioral tests
The NOR task consisted of three sessions: habituation, familiarization (training) and testing session. In the habituation session, animals were allowed to explore the open‐field arena (58 × 58 × 35 cm) freely in the absence of objects for 10 min. The mice were then removed from the arena and placed in holding cages. One day after the habituation session, mice underwent a single familiarization session of 10 min. During this familiarization session, each animal was placed in the same open‐field arena containing two identical objects (A + A). One day after the familiarization session, mice underwent a testing session of 10 min. During the test session, the animal was again placed in the open‐field arena with two objects, one was the familiar object, the other was the novel object (A + B). During both the familiarization and the testing sessions, the time the mice spent exploring each object was recorded. The discrimination index (DI) was calculated as the difference between the time spent exploring the novel object (B) and the familiar object (A) in relation to the total time spent exploring the objects [(B − A)/(B + A)] (5).
The anxiety‐like behavior for each mouse was determined from the motor tracks derived from an open‐field test. Animals were allowed to explore the open‐field arena (58 × 58 × 35 cm) freely for 10 min. In the duration of open‐field for 10 min, a center region with dimensions of 29 × 29 cm (50% of the length and width of the open‐field arena) was selected when analyzing the mouse tracks using the software (9). All behavioral tests and motor tracks were monitored and recorded by digital cameras and assessed by OptiMouse software (16).
MRI acquisition
MR images were acquired using a 7 Tesla scanner with a 30 cm diameter bore (Bruker Biospec 70/30 USR, Ettlingen, Germany) and the linear volume coil was used to transmit the radio frequency pulses. For the radio frequency signal retrieval, a planar surface coil (T7399V3; Bruker Corp., Billerica, MA, USA) was placed over each mouse’s head. During each MRI session, the subject mouse was anesthetized by inhalation of 3% isoflurane (Attane™ Isoflurane, Minrad Inc., NY, USA), in combination with 20% of O2, 75% of N2 and 5% of CO2. The mouse was fastened to an animal holder and a hot pad set to 37°C was placed around the abdomen to maintain the body temperature. A life monitoring system and pressure sensor (SA Instruments Inc., New York, NY, USA) were also put under the abdomen of the mouse to monitor the respiratory status. The respiration rate was steady and maintained at 20 to 40 breaths/minute.
Magnetic field homogeneity was optimized using the fast automated shimming technique by mapping along projections (FASTMAP) with first‐order shims on an isotropic voxel of 7 × 7 × 7 mm3 encompassing the imaging slices. Turbo spin echo (TSE) T2 images were acquired to check the slice positioning [TR = 2500 ms, TE = 33 ms, matrix size = 256 × 256 × 15, field of view (FOV) = 20 × 20 mm2, voxel size = 0.08 × 0.08 × 0.4 mm3, slice thickness = 0.4 mm, 15 horizontal slices]. Diffusion images were acquired using DtiEpi SpinEcho sequence. TR = 3750 ms and TE = 40.28 ms, matrix size = 50 × 50 × 15 pixels, FOV = 20 × 20 mm2, slice thickness = 0.4 mm, 15 horizontal slices, the diffusion time was 20 ms. The diffusion encoding duration was 6 ms. A total of 12 diffusion sampling directions were acquired.
Diffusion tensor imaging (DTI) analysis
Preprocessing steps and DTI analyses were performed by DSI studio software (http://dsi‐studio.labsolver.org) included the motion correction, mask set up and reconstruction. A model‐based DTI reconstruction method, based on details provided in Jiang et al (51), was used to construct the diffusion map. Before analysis, the Allen mouse brain atlas and ROIs (61) were first reconstructed accordingly to the same dimensions as the diffusion images using MATLAB (ver. R2018b, Mathworks, Inc., Natick, MA, USA). The reference atlas was then loaded to co‐register with the diffusion images. Region‐based analysis was performed for areas associated with learning and memory and anxiety, which are the anterior cingulate cortex (ACC), prefrontal cortex (PFC), thalamus (Thal), amygdala (Amyg) and the hippocampus (Hipp), which is segmented into Cornu Amonis 1–3 and dentate gyrus (CA1, CA2, CA3 and DG), to obtain the diffusion indices, FA and MD values.
Brain slice preparations and immunostaining
Mice were subject to transcardial perfusion and then, decapitated. After extracted from the skull, the brains were fixed with 4% of PFA in PBS, pH 7.4 at 4°C for 24–48 h. Fixed brains were then dehydrated with 75% of alcohol prior to paraffin embedding. Sections of 3‐μm thickness were obtained using Sakura IVS‐410 microtome (Sakura Seiki Co., Ltd., Tokyo, Japan). All the paraffin sections were deparaffinized and rehydrated prior to the staining procedures. For immunofluorescence staining, antigen retrieval was performed prior to the staining procedures. Briefly, the brain slices were immersed in sodium citrate buffer (10 mM, with 0.05% Tween 20, pH = 6) at 95°C–100°C for 30 min and followed by deparaffinization protocols as described in the Abcam protocol (Abcam, Cambridge, MA, USA). After cooling, the subsequent immunostaining procedures were carried out. Phospho‐S6 ribosomal protein (pS6 Ser235/236) (Cell Signaling Technology, Inc., Boston, MA, USA), neuronal marker (NeuN) (Merck KGaA, Darmstadt, Germany), glial fibrillary acidic protein (GFAP) (Invitrogen, Carlsbad, CA, USA), S100β (Abcam, Cambridge, MA, USA) and ionizing calcium‐binding adaptor molecule 1 (Iba1) (Wako Co., Ltd., Wakayama, Japan) were used to determine the activation of mTORC1, neurons, astrocytes and microglia, respectively. Myelin basic protein (MBP) (Abcam, Cambridge, MA, USA) antibody was used to determine the myelination.
Immunostaining image analysis
Quantitative analyses of immunostaining results were performed using Fiji/ImageJ software (NIH, Bethesda, MD, USA; https://imagej.net/Fiji). The whole Hipp (with a dimension of 1 mm × 1.5 mm) was selected and pS6‐positive cells were counted using the “Analyze Particles” function in the Fiji software. Four animals were analyzed for each group. To analyze the coherency of myelination or the complexity of myelinated axons, MBP‐stained sections were divided into ACC and the Hipp regions and assessed separately. The analyses were performed using the “OrientationJ measure” plugin for Fiji (89). Within the ACC region, an average measure of coherency from a total of nine random areas, each with the dimension of 200 μm × 200 μm, were calculated for each group. For the Hipp, a total of six areas, each with the dimension of 200 μm × 200 μm, along the stratum lacunosum moleculare (slm) of CA1, where the myelination is prominent, were assessed for the coherency (Supporting Figure S1). Details on “OrientationJ measure” are described in the Supporting Note 1. To calculate the number of GFAP‐positive cells, an average number of astrocytes from six random areas, each with the dimension of 200 μm × 200 μm (including three regions from CA1 and each region from CA2, CA3 and DG), of the Hipp was calculated for each brain. Four animals were analyzed for each group. GFAP immunodensity was further assessed for same sections using the “Measure” function to determine the mean gray value. The mean values for the TSC and TSC/cur groups were then normalized to the level of the WT, which was set at 100%.
Statistical analysis
In assessing the animal behaviors, the discrimination indices and time spent in the middle were compared among the three groups, WT, TSC and TSC/cur using one‐way ANOVA with Tukey’s test as the post hoc analysis to determine the statistical significance of differences. For immunostaining image analyses, both the average number of pS6 + cells and GFAP + cells were assessed using one‐way ANOVA with Tukey’s test as post hoc analysis. To compare DTI measures (both FA and MD) and among the three groups, we first tested normality with the Shapiro–Wilk test and analyzed the homogeneity of variance with Levene’s test of the DTI data from targeted ROIs. FA and MD demonstrated a normal distribution after the Shapiro–Wilk test (P > 0.05), while the Levene’s test showed an equal variance in the targeted ROIs (P > 0.05). Therefore, we applied ANOVA to compare the differences among the three groups. The significance level for the ANOVA was set at P < 0.05 and a post hoc analysis with Fisher’s LSD was conducted, with the P‐value being defined at 0.05. We then performed the multiple comparison correction from the ROIs using the Benjamini‐Hochberg procedure (15) with the false discovery rate (FDR) set at 5% to control the false positive rate (shown in Supporting Tables S1 and S2). A probability value of P < 0.05 was used to determine statistical significance. All data are presented as the mean ± standard error of the mean (SEM). All the statistical analyses mentioned above were performed using Prism version 8 (GraphPad Software, Inc., San Diego, CA, USA). The corresponding effect size and power values were determined using the open source toolbox, G*Power (Version 3.1.9.2, Institut für Experimentelle Psychologie, Dusseldorf, Germany) (37), which are shown in Supporting Tables S3–S5, for behavioral tests, FA values and MD values, respectively.
Results
Behavioral deficits of Tsc2+/‐ mice can be rescued by curcumin treatment
During the NOR task, the TSC group spent an equal amount of time exploring the novel object and familiar objects, whereas the WT spent more time exploring the novel object, as indicated by the mouse tracks (Figure 2A, upper panel). A group heatmap was generated from the average time spent for each group during the task. In the WT group, more time was spent surrounding the object B, which was the novel object during the task. In contrast, TSC mice showed no differences in the preference between the novel and familiar objects. After the curcumin treatment, the mice were able to recognize and spend more time around the novel object, as shown by the yellow‐reddish grids on the heatmap (Figure 2A, lower panel). The DIs were then calculated among the three groups, WT (0.265 ± 0.056), TSC (0.075 ± 0.025) and TSC/cur (0.265 ± 0.047) at 12 weeks of age. The DI of the TSC group was significantly lower than that of the WT (P = 0.0107, one‐way ANOVA test, power = 0.953) and the DI of the TSC/cur group was higher than that of the TSC group (P = 0.0197, one‐way ANOVA test, power = 0.953). These results demonstrated that TSC mice showed defective learning and recognition memory, which were rescued by 6 weeks of curcumin treatment (Figure 2B, upper panel). The distance traveled was calculated for each group during the task to assess the locomotion. During the NOR test, the total distance traveled showed no significant difference for the three groups (Figure 2B, lower panel). We also performed the open‐field test to assess the anxiety level of each group. The representative track of a mouse from each group was shown (Figure 2C, upper panel). A group heatmap was also generated to visualize the average time spent in the center region for each group (Figure 2C, lower panel). The average time spent in the center region for WT, TSC and TSC/cur mice was 32.45 ± 4.81, 17.95 ± 4.48 and 29.04 ± 3.19, respectively. TSC mice showed increased anxiety, as they spent markedly less time in the middle region of the arena than the WT (P = 0.0074, one‐way ANOVA test, power = 0.999) and after treatment the time spent in the middle was significantly reduced, compared with the TSC mice (P = 0.0244, one‐way ANOVA test, power = 0.999) (Figure 2D, upper panel). We also assessed the total distance traveled for the three groups during the open‐field test; and we found there were no significant differences among the three groups, demonstrating the locomotion were relatively the same (Figure 2D, lower panel). Both of these behavioral deficits were shown to be effectively reversed by the treatment with curcumin.
Figure 2.
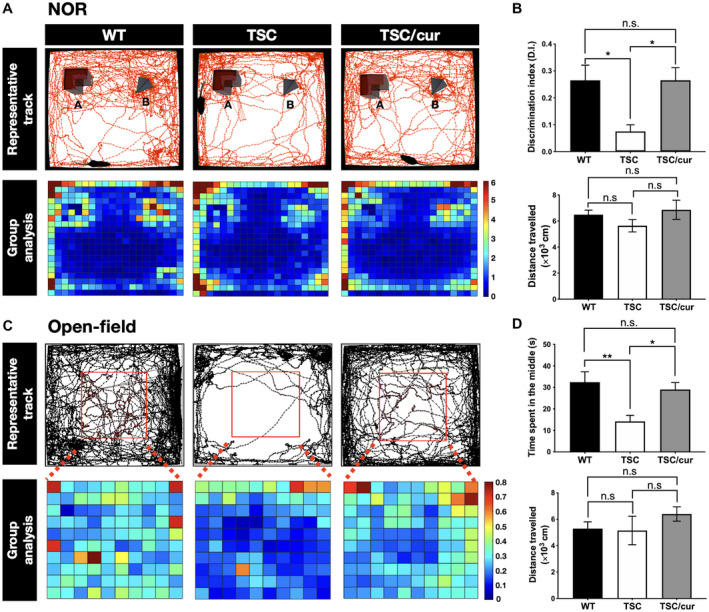
Treatment with the natural diet‐derived mTOR inhibitor, curcumin, can rescue the behavioral deficits of Tsc2+/− mice. A. The novel object recognition (NOR) test was performed on WT, TSC and TSC/cur mice at 12 weeks of age. (A, Upper panel) Mouse movement tracks from a representative animal from each group are denoted by the red lines. (A, Lower panel) A group heatmap representation is generated from the average time spent for each group during the task. The heatmap comprised of several tracks of individual mouse from either group. The scale bar depicts the average time spent in each bin (seconds). (B, Upper panel) The discrimination index (DI) was calculated as the duration spent exploring the novel object divided by the duration spent exploring both the novel and familiar objects. (B, Lower panel) The total distance traveled was calculated during the task to assess the locomotion differences. C. The open‐field test was used to assess the anxiety‐like behavior of the three groups. (C, Upper panel) The red square denotes the center area. Mouse movement tracks from a representative animal are denoted by the black lines. (C, Lower panel) A group heatmap representation is generated from the average time spent for each group during the task. The heatmap comprised of several tracks of individual mouse from either group. The scale bar depicts the average time spent in each bin (seconds). (D, Upper panel) The quantitative results of the open‐field test. (D, Lower panel) The total distance traveled was calculated during the open‐field test to assess the locomotion differences. Data represent the mean ± SEM. *P < 0.05, **P < 0.01, n.s. not significant. One‐way ANOVA, Tukey’s post hoc test.
Aberrant diffusivity was observed in the ACC and the hippocampal CA1 of Tsc2+/− mice
ROI‐based analyses were performed to assess the microstructural changes between the WT, TSC and TSC/cur groups (Figure 3A). Representative figures of the T2‐weighted images, color map of FA, FA map and MD map from each group were shown, indicating that there were no robust changes in T2 images in the three groups, but prominent differences were found in FA and MD values (Figure 3B). In the ACC, the FA value was increased in the TSC group by 8.7% (P = 0.007, one‐way ANOVA test, power = 0.968) compared with that of the WT. After treatment of curcumin, the FA value was decreased by 13.1% (P = 0.001, one‐way ANOVA test, power = 0.968) compared with that of the TSC. When we further looked into the hippocampal segmentations, FA values were increased by 8.2% (P = 0.007, one‐way ANOVA test, power = 0.969) in CA1 for TSC mice, whereas no significant changes were observed in CA2, CA3 and DG. Curcumin treatment decreased the FA values in CA1 by 9.6% (P = 0.002, one‐way ANOVA test, power = 0.969). No significant differences were observed between the WT and TSC/cur mice (Figure 3C). In terms of MD, TSC mice were decreased by 3.5% (p = 0.003, one‐way ANOVA test, power = 0.964) and 5.0% (p = 0.002, one‐way ANOVA test, power = 0.999), in the ACC and field CA1, respectively. The curcumin treatment effectively rescued the decreased MD in the ACC by 3.5% (p = 0.003, one‐way ANOVA test, power = 0.969) and CA1 by 3.6% (p = 0.020, one‐way ANOVA test, power = 0.999) (Figure 3D). In summary, our DTI data indicated that the two consistent regions that were detected by both FA and MD measures are the ACC and field CA1 of the Hipp, which are two of the most susceptible regions to the neurocognitive functions.
Figure 3.
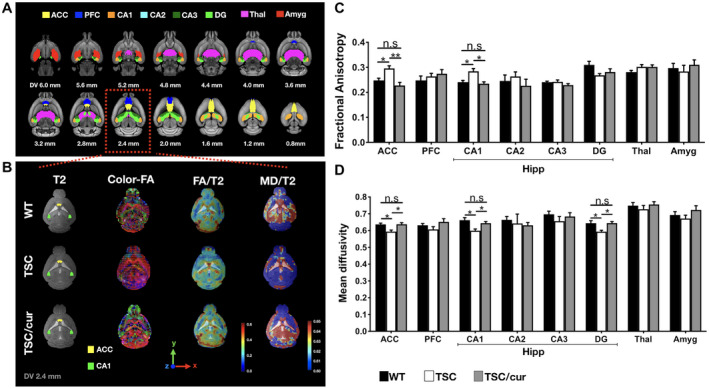
Tsc2+/− mice exhibit aberrant diffusivity in the ACC and CA1 of the hippocampus. A. DTI analysis was performed on the three groups of mice, WT, TSC and TSC/cur. The following regions of interest (ROIs) in three groups were assessed: ACC: anterior cingulate cortex; PFC: prefrontal cortex; CA1‐3: Cornu Amonis 1–3; DG: dentate gyrus; Thal: thalamus; Amyg: amygdala. (B, first column) A representative T2‐weighted image of each group is shown overlaid with the ROIs: the ACC (yellow) and the hippocampal CA1 (green), which showed significant results. (B, second column) A color‐oriented FA map is shown to denote the direction of anisotropy within each voxel, red: x‐axis, green: y‐axis and blue: z‐axis. (B, third column) FA maps were generated and overlaid with the T2 images, where red color denotes the high FA value (0.6) and blue color denotes the low FA value (0.0). (A, fourth column) MD maps were also generated and overlaid with the T2 images, where red color denotes 0.65 and blue color denotes 0.60. C and D. FA and MD values were determined for each group and compared for each brain region. Hippocampal regions were segmented into CA1, CA2, CA3 and DG. Significant increased FA and decreased MD values were observed in the ACC and the CA1 of TSC mice. Treatment with curcumin greatly reduced the FA and increased the MD values, in these regions. No significant differences were found between the WT and TSC/cur groups. Data represent the mean ± SEM. *P < 0.05, **P < 0.01, n.s. not significant, One‐way ANOVA test, Fisher’s LSD post hoc test.
Hyperactivation of mTORC1 in Tsc2+/− mice was limited to certain brain regions
To further dissect the molecular mechanisms underlying TSC pathology and the therapeutic effects of curcumin, we investigated how TSC‐deficient cells were dysregulated in various brain regions. Since TSC is involved in the mTOR pathway, we examined the mTOR activity in the TSC mouse brain. We used pS6 antibody to assess the mTORC1 activity. Immunofluorescence staining with anti‐pS6 on the whole brain of WT, TSC and TSC/cur mice was performed (Figure 4A, upper panel). Of all brain regions analyzed, the Hipp of the TSC group showed most prominent hyperactivation of mTORC1 when compared with the WT (Figure 4A, lower panel). The level of pS6 was tremendously increased in CA1, CA3 and DG (Figure 4A, inset). When we quantitatively analyzed the pS6‐positive (pS6+) cells in the hippocampus for each group, the number of pS6+ cells significantly increased in the TSC mice (p = 0.0087, one‐way ANOVA test); and after curcumin treatment, the number of pS6+ cells markedly decreased (p = 0.0215, one‐way ANOVA test) (Figure 4B).
Figure 4.
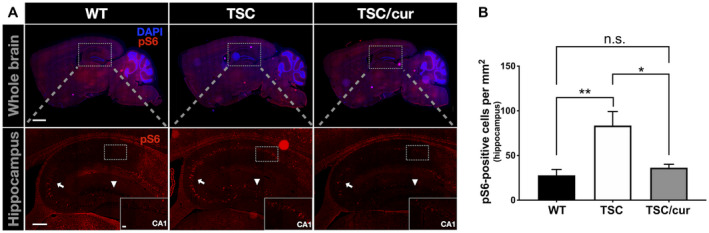
Tsc2+/− mice showed hyperactivation of mTORC1 in the hippocampal regions. A. Immunostaining of phosphorylated‐S6 (pS6) of WT, TSC and TSC/cur brain tissue. A high level of pS6 was most prominent in the CA1 (inset), as well as in CA3 (arrow) and DG (arrowhead). The curcumin treatment was able to inhibit the increased expression of pS6. B. The quantitative results of the number of pS6‐positive cells in the hippocampi of the three groups. TSC mice exhibited a significantly increased number of pS6 containing cells and curcumin significantly decreased the number of pS6‐positive cells. Scale bar for A, upper panel: 1 mm; A, lower panel: 200 μm; inset 20 μm. Data represent the mean ± SEM. *P < 0.05, **P < 0.01, n.s. not significant, One‐way ANOVA, Tukey’s post hoc test.
Myelination complexity is decreased in the ACC of Tsc2+/‐ mice
To further confirm neuropathology in the TSC group, in which both FA and activation of mTOR were altered and since FA is highly associated with myelination, we used the MBP antibody, co‐staining with pS6, to visualize the integrity of myelination (Supporting Figure S2). Overall, there was no robust difference in the pattern of myelination of the corpus callosum and the gray matter structures between the WT and TSC, including the amygdala and thalamus (Supporting Figure S2). However, when we looked closer at the ACC (Figure 5A) and performed coherency analysis on the MBP‐stained sections, the coherency of myelinated axons was shown to be increased in the TSC group (Figure 5B). Increased coherent myelination represents the loss of complexity of neurites in the cortical regions of the TSC brains (Figure 5C). This result corresponded to the increased FA and decreased MD values in the TSC group. With curcumin treatment, which effectively lowered the number of pS6+ cells, the complexity of myelination was rescued, as well as the FA and MD values. Because abnormal DTI parameters were also found in the hippocampal CA1, we further analyzed the myelination in the Hipp. In the Hipp, we analyzed the CA1, CA2, CA3 and DG more closely and found that there was no obvious difference in MBP staining (Supporting Figure S2, inset). When we performed the coherency analysis in the slm region of the CA1 as denoted in Figure 5D, since the slm showed the most prominent staining of MBP, we found that the TSC group showed increased coherency relative to the WT group (Figure 5E). However, the hippocampal CA1 myelination was unaffected after treatment with curcumin, although it showed a trend of decreased coherency (Figure 5F).
Figure 5.
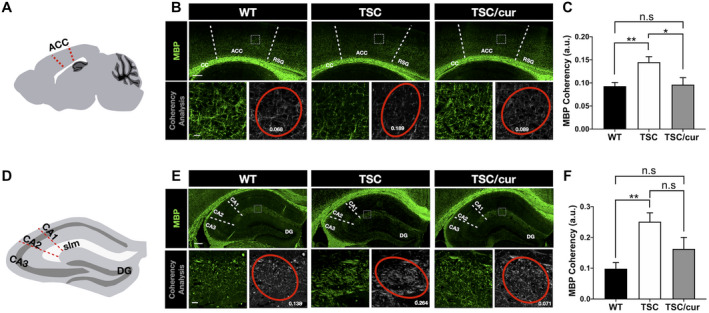
Decreased myelination complexity was evident in the ACC of Tsc2+/− mice. A. An illustration of a sagittal section of mouse brain showing the ACC (red dotted line), of which the myelination had undergone coherency analysis. (B, upper panel) Immunostaining with MBP antibody was used to determine the myelinated axons in the ACC. A representative section (200 μm × 200 μm) was analyzed for its coherency (white square). (B, lower panel) A representative image showing magnification of the section outlined by a white square in the upper panel. The complexity of myelination in the ACC (right) and the coherency measurements (number in white) with coherency ellipse (red) are shown for the three groups (left). C. The quantitative results of increased coherency of myelinated axons in the TSC group, as compared with the WT and TSC/cur (N = 9/group). D. An illustration of a coronal section of the hippocampus showing CA1–3, DG areas and the layer of slm. E, upper panel. Immunostaining with MBP antibody was used to determine the myelinated axons in the hippocampus. E, lower panel. A representative image showing magnification of the section outlined by a white square in the upper panel. The complexity of myelination in the slm layer, where the myelination was the most prominent (right) and the coherency measurements (number in white) with coherency ellipse (red) are shown for the three groups (left). F. The quantitative results of coherency in the three groups. The TSC group showed increased coherency, as compared with the WT but no significant difference when compared with the TSC/cur group (N = 9/animal). Scale bar for B, D: 200 μm; inset 20 μm. Data represent the mean ± SEM. *P < 0.05, **P < 0.01, n.s. not significant, One‐way ANOVA, Tukey’s post hoc test.
Astrocyte activation was observed in the hippocampus of Tsc2+/− mice
To seek out other possible neuropathological features that are responsible for the alterations in FA and MD values in the hippocampal CA1, we analyzed the cellular composition of the TSC brain, using immunofluorescence staining of NeuN, GFAP, S100β, and Iba1to determine the distribution of neurons, astrocytes and microglia, respectively. We found an increased immunoreactivity of GFAP and S100β in the hippocampus of TSC mice compared with the WT (Figure 6), but not NeuN and Iba1 (Supporting Figures S3 and S4). More specifically, the increased immunoreactivity of GFAP was most prominent in the slm of CA1 (Figure 6A, first and third panels), whereas the increased immunoreactivity of S100β was observed in the slm of CA1 and the molecular layer of DG (Figure 6A, second and third panels). Treatment with curcumin decreased the GFAP expression (Figure 6A, first and third panels). We first determined the immunodensity of GFAP and compared the three groups. We found that TSC mice exhibited an increased area of GFAP expression when compared with the WT (p = 0.0127, one‐way ANOVA test) and TSC/cur mice (p = 0.0402, one‐way ANOVA test) (Figure 6B). After further quantitatively analyzing GFAP‐positive cells (GFAP+ cells) in each group, we found that TSC mice exhibited augmented GFAP+ cells, relative to the WT (p = 0.0091, one‐way ANOVA test); and TSC/cur group showed a markedly lower number of GFAP+ cells, relative to the TSC (p = 0.0051, one‐way ANOVA test) (Figure 6C). The quantitative results of immunostaining of S100β also demonstrated increased S100β‐positive cells in the TSC group, relative to the WT (p = 0.0467, one‐way ANOVA test) and treatment of curcumin decreased the S100β‐positive cells, relative to the TSC (p = 0.0134, one‐way ANOVA test) (Figure 6D). These results implied that the decreased MD values in the hippocampal regions may have resulted from the increased number and density of these astrocytes.
Figure 6.
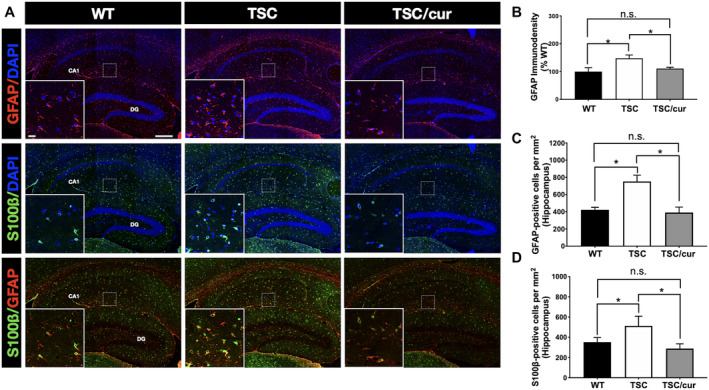
Tsc2+/− mice showed astrogliosis in the hippocampal CA1. A, first panel. Immunostaining of GFAP, a marker for astrocytes, in WT, TSC and TSC/cur mice. The inset shows the representative region and is the magnification of the squared region on CA1, in a dimension of 200 μm × 200 μm. A, second panel. The S100β antibody, also a marker for astrocytes, was used to further confirm the number of astrocytes. A, third panel. The co‐staining of S100β and GFAP showed colocalization. The S100β localized at the soma, where GFAP localized at the processes of the astrocytes. B. GFAP immunodensity was determined in the Hipp, including regions of CA1, CA3 and DG. Each bar represents the average number of astrocytes from six random regions of the hippocampus of each brain, four animals for each group, followed by normalization with the WT. C. Quantitative results of GFAP‐positive cells in the Hipp of the same six random regions. D. Quantitative results of S100β‐positive cells in the Hipp of the same six random regions. Scale bar: 200 μm; inset 20 μm. Data represent the mean ± SEM. *P < 0.05, n.s. not significant, One‐way ANOVA, Tukey’s post hoc test.
Discussion
Behavioral deficits in Tsc2+/− mice may result from aberrant brain circuitry
We showed that Tsc2+/− mice exhibit the learning and memory deficits and anxiety‐like behavior when performing NOR and open‐field tests. The mouse model used in this study does not exhibit seizures (36, 76). Although seizures play an important role in cognitive decline of patients with TSC, other disease mechanisms, such as defects in axon guidance (70) and spine pruning (86), have been suggested to contribute to the behavioral abnormalities in this model. In addition, the heterozygous mouse model of Tsc1 also has shown hippocampal‐dependent learning deficits without seizures (38). Therefore, brain morphological changes are likely to be sufficient for memory deficits. Given that TSC mice performed poorly in the NOR paradigm and studies have shown that the Hipp is very important for object recognition memory (20, 45), we anticipated that there are microstructural alterations in the hippocampal regions. Particularly, within the hippocampal circuitry, CA1 and CA3 fields play an essential role and distinct roles in episodic and spatial memory (33, 62). In our study, we observed an increased FA value in the field CA1 of the Tsc2+/− mice. Several past studies have shown that DTI can detect neuroplasticity following long periods of training in animals (17), as well as short‐term learning‐induced plasticity changes (34). Neuroplasticity can be defined as experience‐induced structural or functional changes in neurons, which includes induction of long‐term potentiation (LTP), neurogenesis and structural alterations of cellular components (21, 57). These structural changes encompass processes such as neurogenesis, synaptogenesis (synaptic plasticity), dendritic branch formation, axonal or synaptic sprouting (axonal plasticity), glial cell formation (especially astrocytes) and myelin formation (21, 57). The aberrant FA value in our study may reflect the neuroplasticity changes in TSC, as neuroplasticity abnormalities have been demonstrated in two previous studies of Tsc2+/− mice, both of which showed that overactive mTOR signaling in the Hipp results in disrupted LTP in the CA1 region (36, 56).
In addition to the Hipp, another important brain region involved in object recognition memory and consolidation of object/place association memory is the ACC (101). Precisely, during the exploration of objects, former object locations and the introduction of novel objects, the ACC showed marked changes in neuronal firing patterns (102). The role of the ACC in long‐term storage of memory can be further established through the coordinated neuronal activity between CA1 and ACC neurons (99). Inactivating either the ACC or Hipp results in impairment of spatial memory formation (93). As we anticipated, our DTI analysis showed a significantly increased FA value in the ACC of the TSC mice. The aberrant circuitry between the ACC and Hipp is believed to be responsible for the behavioral impairments in TSC mice, which may be reflected by the FA values of these brain regions.
Altered FA and MD values reflected abnormal cortical myeloarchitecture of TSC brains
The ACC and CA1 of the Hipp were the two structures that showed significant alterations in FA and MD values between the WT and TSC groups, which were reversed by curcumin treatment. This reversal of FA and MD values was accompanied by the improvements in cognitive functions and anxiety‐like behavior. Several DTI studies on TSC patients have revealed significantly lower FA values in the cortical tubers, peritubers, WM lesions, WM structures in active epileptic patients (4, 35, 84). However, the neuropsychiatric phenotypes do not always correlate with the presence of brain lesions and epilepsy in many cases of TSC. Thus, there has been a tremendous amount of work focusing on detecting the abnormal FA and MD values in the normal‐appearing white matter (NAWM) of TSC patients (6, 66, 80). In particular, the majority of DTI studies have revealed that TSC shows lower FA and higher MD values in the corpus callosum, which may indicate several pathologic conditions such as loss of myelin, decreased axon density and axonal damage (4, 11, 40), all of which is consistent with the findings in animal studies (24, 71, 72). In addition, we performed region‐based DTI analysis on the corpus callosum for the three groups of mice (Supporting Figure S5) and we also found that TSC mice showed a lower FA when compared to WT or TSC/cur, which is consistent with the previous findings. Aside from the NAWM alterations, we herein proposed that there are also ultrastructural changes in the normal‐appearing brain structures in the TSC brains, namely the ACC and Hipp, contributing to the neuropsychiatric phenotypes, which can be corrected by the curcumin treatment.
As opposed to the decreased FA in the WM structures, which may suggest axonal or myelination abnormalities, a reduction in cortical FA has been shown to correlate with the cortical maturation, a process involving a series of events including the growth of dendrites and the formation of cell processes and synapse connections during brain development in both rodents (48) and humans (70, 77). The myelination of WM regions, such as the corpus callosum, which contains relatively coherent bundles of axons, are quite different than the myelination of the cortex. The organization of the cortical myelination and neurite growth in the cortical gray matter region is rather less coherent and multi‐directional, contributing to the decline in FA. Several human studies using DTI to detect structural changes in the cortex of patients with multiple sclerosis (MS), a known demyelinating disease, demonstrated that patients while MS patients showed increased MD and decreased FA in NAWM, they may have an increase in FA in the cortex in normal‐appearing gray matter and FA is strongly correlated with cortical lesions (23, 88).
The interpretation of the relationship between the decrease in FA and increased cortical myelination complexity can be further demonstrated in animal studies. Hammelrath et al reported that the FA values in the mouse brain cortex showed a continuous decline with the age, accompanied by increasing myelin staining intensity (44). This may imply the cortical structural changes during maturation; and as the horizontal layer organizations develop, the direction of water diffusion is interrupted, resulting in reduction of anisotropy in the cortical regions. Moreover, in rodent models of brain injury, injured cortical regions show reduced myelin density and decreased microstructural complexity, while at the same time the cortical organization exhibits increased coherency between myelinated axons (94). Several conditional knockout mouse models of TSC also exhibit salient hypomyelination in the cortex, corpus callosum and the Hipp (24, 71, 100). Similar to previous studies, which have indicated the presence of myelination defects in TSC, our data also provide evidence that the Tsc2+/− mouse model exhibits a reduced myelination complexity in the cortical region, which is reflected by the higher FA values in the mouse model in our DTI analysis.
Altered FA and MD values in the hippocampus corresponded to astroglial increase
Our immunostaining data suggest that haploinsufficiency of TSC genes results in hyperactivation of mTORC1 and an increased number of astrocytes in the hippocampal regions, which also showed increased FA and MD values. After treatment with curcumin, activation of pS6, GFAP and S100β expression was inhibited and this was accompanied by the reversal of FA and MD values. As suggested in previous studies, altered FA and MD values in the Hipp and cortex may be contributed by changes in water diffusion anisotropy and orientation caused by astrocyte processes and/or glial scarring resulting from reactive astrocytes (22, 85). In these two rodent models of traumatic brain injury, in which gliosis has taken place, using 2D Fourier Transform analysis, the authors demonstrated that the increase in GFAP expression, as well as the anisotropy of astrocytes, positively correlates with FA values. Consistent with these findings, we observed an increment in GFAP expression, accompanied by the increased FA and decreased MD values, in the CA1 field of the TSC Hipp. Because of the multi‐directional of neurites in the Hipp, we propose that the increased FA and decreased MD values result from the increased density and organization of astrocytes, which causes the water diffusion to become more anisotropic.
Functional roles of astrocytes in TSC disease pathology have been highlighted in the findings of patients’ brain tissue and several CNS mouse models of TSC. Immunohistochemical analysis of human brain tuber tissue from epileptic patients with TSC showed reactive astrocytes (91). Furthermore, haploinsufficiency of Tsc1 or Tsc2 has been shown to cause increased astrocyte numbers in mouse models (97). A conditional knockout model of TSC (astrocyte‐specific null of Tsc1) exhibited more prominent neurological impairments such as astrocyte over‐proliferation, progressive epilepsy and premature death, all of which can be ameliorated by the treatment with rapamycin (104). These results provide evidence that an increased number of astrocytes affects synaptic transmission by disrupting the astroglial‐neuronal relationship during the pathogenesis in the TSC brains.
Astroglial activation in TSC may indicate neuroinflammation as pro‐inflammatory markers such as cytokines and chemokines have been found in cortical tubers and/or SEN/SEGAs from patients (18, 19, 67). In addition, using genomic analysis, two studies have confirmed the upregulation of inflammation‐related mRNA and proteins in TSC (42, 68). Although seizures may also induce the expression of inflammatory biomarkers in TSC, accumulating evidence has indicated that inflammatory processes precede the onset of epilepsy (82) and a chronic inflammatory state may predispose to the occurrence of spontaneous seizures (2, 86). Several TSC studies have shown that the increased expression of inflammatory markers is found in the absence of epileptic activity (18, 42, 81). For example, the immunohistochemical analysis of brain lesions from TSC human fetuses (from 23‐ to 38‐week gestation), which displayed no seizures or seizure‐like activity, showed increased inflammatory response markers (81). In addition, Zhang et al found that in the neocortex and Hipp of a Tsc1‐GFAP conditional knockout mouse model, mRNA expression of inflammatory markers such as interleukin‐1β (IL‐1β), IFN‐γ, CXCL10 and IL‐6 were significantly increased before the onset of seizure activity (105). Consistent with these studies, we found that the Tsc2+/‐ heterozygous knockout mice, which do not demonstrate seizures, showed increased astroglial immunoreactivity, which may indicate neuroinflammation. Recently, therefore, it has been speculated that brain inflammation may contribute to the pathophysiology of TAND symptoms such as cognitive impairment and/or anxiety (68, 105). It would be interesting to confirm the expression level of these pro‐inflammatory cytokines and chemokines in the Tsc2+/− mouse model, so that the correlation between the FA and/or MD values and inflammation can be clarified in this model.
Curcumin reverses brain microstructural changes in TSC via suppression of neuroinflammation through mTOR pathway
The current pharmacological therapy using the mTOR inhibitor, everolimus, has been shown to alter DTI values in the NAWM of TSC individuals (79, 95). Both studies have suggested that the primary reason for the changes in FA and MD after everolimus treatment is alteration of the radial diffusivity (RD) of the corpus callosum. RD has been found to be related to the organization, thickness and permeability of the myelin sheath (7). Therefore, a possible explanation for the altered DTI metrics after the treatment may be the improvement in myelination, as hypomyelination was rescued by mTOR inhibition in mouse models of TSC (24, 72). These studies demonstrated the longitudinal effects of the mTOR inhibitor on altering the brain’s microstructural properties in TSC, which can be detected by the DTI. In our study, we found that curcumin reversed the abnormal cortical myelination and hippocampal astrogliosis in Tsc2+/− mice and concomitantly inhibited mTORC1 activity. Curcumin has an anti‐inflammatory action by preventing astrocytosis and microgliosis and also has been reported to inhibit mTOR pathway (47, 55, 73). The mTOR kinase has also been implicated in the process of chronic inflammation. Under pathological conditions, reactive astrocytes release cytokines and pro‐inflammatory mediators such as IL‐1β, IL‐6, TNF‐α and neurotoxic compounds such as nitric oxide (NO) and induce the expression of inducible nitric oxide synthase (iNOS) (64). Inhibition of mTOR kinase activity by rapamycin can reduce iNOS mRNA stability in astrocytes (29, 64). Furthermore, both curcumin and rapamycin have been shown to inhibit pro‐inflammatory cytokines via the mTOR pathway in a rat model of rheumatoid arthritis (28). Pretreatment with curcumin effectively protected a lipopolysaccharide‐induced mouse model from inflammation in the cortex and Hipp by reducing the mRNA levels of IL‐1β, TNF‐α and IL‐6 and thereby ameliorating the long‐term memory function (90). However, the link between mTORC1, the pro‐inflammatory cascade and the cognitive dysfunction needs to be investigated further. Nevertheless, in combining all of these results, curcumin is shown to be a strong candidate for therapeutic use in TSC, particularly for patients with neuropsychiatric manifestations. Most importantly, herein we have shown that the molecular and cellular changes induced by the curcumin treatment can be detected by DTI analysis.
Conclusion
Our study provides a noninvasive, region‐based DTI analysis that enables the detection of subtle changes within brain regions associated with neuropsychiatric disorders in TSC. The DTI metrics in this study reflected the ultrastructural changes in important regions that are involved in cognitive function and emotions. This region‐based FA and MD alterations suggest that there is an abnormal myeloarchitecture and astroglial cytoarchitecture of the ACC and hippocampal regions, respectively, occur in the TSC brains, thus, affecting the neural circuity of the ACC and Hipp, resulting in behavioral deficits. These ultrastructural defects can be rescued upon curcumin treatment, which can be detected by DTI, providing an alternative therapeutic translational strategy for TSC.
Conflicts of interest
All authors reported no biomedical financial interests or potential conflicts of interest.
Supporting information
Fig S1
Figure S1. Quantitative coherency analysis using OrientationJ to assess the myelination complexity in the ACC and the hippocampal regions. (A) MBP‐stained sections of WT, TSC and TSC/cur mice were analyzed using OrientationJ (5). Within the ACC region, a total of nine random areas, each with the dimension of 200 μm × 200 μm, were calculated for each group. As for the Hipp, a total of 6 areas, each with dimension 200 μm × 200 μm, along the stratum lacunosum moleculare (slm) of CA1, where the myelination is prominent, was assessed for the coherency. Scale bar: 200 μm. (B) A schematic illustration of quantitative coherency analysis procedural steps. Random areas within the ACC were chosen to be quantitatively analyzed by the OrientationJ Measure according to the equation shown in the figure, where C is equal to 1 when the local structure has one dominant orientation and C is 0 if the image is isotropic.
Fig S2
Figure S2. mTORC1 activation in cortical regions and the hippocampus with no obvious difference in myelination pattern of Tsc2+/‐ mice. Co‐immunostaining of pS6 and myelin basic protein (MBP) of WT, TSC and TSC/cur mice. The result showed hyperactivation of mTORC1 at certain brain regions, instead of whole brain activation, in TSC. Overall treatment of curcumin can lower the expression of pS6. The myelination pattern remained unchanged in white matter structures for the three groups. When the hippocampus was examined in greater magnifications (inset), no obvious difference in myelination patterns was seen. Scale bar: 100 μm.
Fig S3
Figure S3. Tsc2+/‐ mice showed equal number of neuronal cells. Immunostaining of NeuN, a marker for neuronal cells, for the WT, TSC and TSC/cur groups. The expression of NeuN remained the same for each group. The DAPI staining showed robustly the normal‐appearing hippocampus for TSC mice. Scale bar: 500 μm; inset: 100 μm.
Fig S4
Figure S4. Tsc2+/‐ mice showed equal number of microglial cells in the hippocampus. (A) Immunostaining of Iba1, a marker for microglial cells, for WT, TSC and TSC/cur mice. The expression of Iba1 remained the same for each group. (B) The merged figures with DAPI staining showed robustly the normal‐appearing hippocampus for TSC mice. Scale bar: 100 μm.
Fig S5
Figure S5. DTI analysis was performed on the corpus callosum for the three groups, WT, TSC, and TSC/cur. Fractional anisotropy (FA) values were determined for each group. Data represent the mean ± SEM. *P < 0.05, **P < 0.01, n.s. not significant, using One‐way ANOVA test, Fisher’s LSD post‐hoc test.
Supplementary Material
Table S1. Differences in fractional anisotropy (FA) values in wild‐type (WT), Tsc2 +/‐ (TSC), and Tsc2 +/‐ fed with curcumin (TSC/cur).
Table S2. Differences in mean diffusivity (MD) values in wild‐type (WT), Tsc2 +/‐ (TSC), and Tsc2 +/‐ fed with curcumin (TSC/cur).
Table S3. The effect size f and power for the behavioral tests.
Table S4. The effect size f and power for the fractional anisotropy (FA) measurements.
Table S5. The effect size f and power for the mean diffusivity (MD) measurements.
Acknowledgments
This work is financially supported by Ministry of Science and Technology of Taiwan under Contract numbers of MOST 108‐2321‐B‐010‐008‐MY2, 107‐2221‐E‐010‐021‐MY2, 107‐2221‐E‐010‐011, 107‐2314‐B‐303‐004, 107‐2221‐E‐035‐083‐MY2, 107‐2314‐B‐038‐098‐MY3 and 106‐2314‐B‐038‐021. We also appreciate 7T animal MRI Core Lab of the Neurobiology and Cognitive Science Center for technical and facility support and C. H. Hsieh and J. H. Chen of the Instrumentation Center for MRI experiments at National Taiwan University.
Contributor Information
Yi‐Chao Lee, Email: yclee@tmu.edu.tw.
You‐Yin Chen, Email: irradiance@so-net.net.tw.
Data Availability Statement
The data that support the findings of this study are available from the corresponding author upon reasonable request.
References
- 1. Aggarwal BB, Kumar A, Bharti AC (2003) Anticancer potential of curcumin: preclinical and clinical studies. Anticancer Res 23:363–398. [PubMed] [Google Scholar]
- 2. Akassoglou K, Probert L, Kontogeorgos G, Kollias G (1997) Astrocyte‐specific but not neuron‐specific transmembrane TNF triggers inflammation and degeneration in the central nervous system of transgenic mice. J Immunol 158:438–445. [PubMed] [Google Scholar]
- 3. Alexander AL, Lee JE, Lazar M, Field AS (2007) Diffusion tensor imaging of the brain. Neurotherapeutics 4:316–329. [DOI] [PMC free article] [PubMed] [Google Scholar]
- 4. Amarreh I, Dabbs K, Jackson DC, Jones JE, Meyerand ME, Stafstrom CE et al (2013) Cerebral white matter integrity in children with active versus remitted epilepsy 5 years after diagnosis. Epilepsy Res 107:263–271. [DOI] [PMC free article] [PubMed] [Google Scholar]
- 5. Antunes M, Biala G (2012) The novel object recognition memory: neurobiology, test procedure, and its modifications. Cogn Process 13:93–110. [DOI] [PMC free article] [PubMed] [Google Scholar]
- 6. Arulrajah S, Ertan G, Jordan L, Tekes A, Khaykin E, Izbudak I et al (2009) Magnetic resonance imaging and diffusion‐weighted imaging of normal‐appearing white matter in children and young adults with tuberous sclerosis complex. Neuroradiology 51:781–786. [DOI] [PubMed] [Google Scholar]
- 7. Aung WY, Mar S, Benzinger TL (2013) Diffusion tensor MRI as a biomarker in axonal and myelin damage. Imaging Med 5:427–440. [DOI] [PMC free article] [PubMed] [Google Scholar]
- 8. Bachmanov AA, Reed DR, Beauchamp GK, Tordoff MG (2002) Food intake, water intake, and drinking spout side preference of 28 mouse strains. Behav Genet 32:435–443. [DOI] [PMC free article] [PubMed] [Google Scholar]
- 9. Bailey KR, Crawley JN. (2009). Anxiety‐related behaviors in mice. In: Methods of Behavior Analysis in Neuroscience, Buccafusco JJ (ed), pp. 98–123. CRC Press: Boca Raton, FL. [Google Scholar]
- 10. Barreto G, Gonzalez J, Capani F, Morales L (2011) Role of astrocytes in neurodegenerative diseases. In: Neurodegenerative diseases‐processes, prevention, protection and monitoring. Intechopen. [Google Scholar]
- 11. Baumer FM, Peters JM, Clancy S, Prohl AK, Prabhu SP, Scherrer B et al (2017) Corpus callosum white matter diffusivity reflects cumulative neurological comorbidity in tuberous sclerosis complex. Cereb Cortex 28:3665–3672. [DOI] [PMC free article] [PubMed] [Google Scholar]
- 12. Beaulieu C (2014) Chapter 8 ‐ The biological basis of diffusion anisotropy. In: Diffusion MRI 2nd edn. Johansen‐Berg H, Behrens TEJ (eds), pp. 155–183. Academic Press: San Diego, CA. [Google Scholar]
- 13. Beevers CS, Li F, Liu L, Huang S (2006) Curcumin inhibits the mammalian target of rapamycin‐mediated signaling pathways in cancer cells. Int J Cancer 119:757–764. [DOI] [PubMed] [Google Scholar]
- 14. Beevers CS, Zhou HY, Huang SL (2013) Hitting the golden TORget: curcumin's effects on mTOR signaling. Anticancer Agents Med Chem 13:988–994. [DOI] [PMC free article] [PubMed] [Google Scholar]
- 15. Benjamini Y, Hochberg Y (1995) Controlling the false discovery rate: a practical and powerful approach to multiple testing. J Roy Stat Soc Ser B (Methodol) 57:289–300. [Google Scholar]
- 16. Ben‐Shaul Y (2017) OptiMouse: a comprehensive open source program for reliable detection and analysis of mouse body and nose positions. BMC Biol 15:41. [DOI] [PMC free article] [PubMed] [Google Scholar]
- 17. Blumenfeld‐Katzir T, Pasternak O, Dagan M, Assaf Y (2011) Diffusion MRI of structural brain plasticity induced by a learning and memory task. PLoS One 6:e20678‐e. [DOI] [PMC free article] [PubMed] [Google Scholar]
- 18. Boer K, Crino PB, Gorter JA, Nellist M, Jansen FE, Spliet WG et al (2010) Gene expression analysis of tuberous sclerosis complex cortical tubers reveals increased expression of adhesion and inflammatory factors. Brain Pathol 20:704–719. [DOI] [PMC free article] [PubMed] [Google Scholar]
- 19. Boer K, Jansen F, Nellist M, Redeker S, van den Ouweland AM, Spliet WG et al (2008) Inflammatory processes in cortical tubers and subependymal giant cell tumors of tuberous sclerosis complex. Epilepsy Res 78:7–21. [DOI] [PubMed] [Google Scholar]
- 20. Broadbent NJ, Gaskin S, Squire LR, Clark RE (2010) Object recognition memory and the rodent hippocampus. Learn Mem 17:5–11. [DOI] [PMC free article] [PubMed] [Google Scholar]
- 21. Bruel‐Jungerman E, Davis S, Laroche S (2007) Brain plasticity mechanisms and memory: a party of four. Neuroscientist 13:492–505. [DOI] [PubMed] [Google Scholar]
- 22. Budde MD, Janes L, Gold E, Turtzo LC, Frank JA (2011) The contribution of gliosis to diffusion tensor anisotropy and tractography following traumatic brain injury: validation in the rat using Fourier analysis of stained tissue sections. Brain 134(Pt 8):2248–2260. [DOI] [PMC free article] [PubMed] [Google Scholar]
- 23. Calabrese M, Rinaldi F, Seppi D, Favaretto A, Squarcina L, Mattisi I et al (2011) Cortical diffusion‐tensor imaging abnormalities in multiple sclerosis: a 3‐year longitudinal study. Radiology 261:891–898. [DOI] [PubMed] [Google Scholar]
- 24. Carson RP, Kelm ND, West KL, Does MD, Fu C, Weaver G et al (2015) Hypomyelination following deletion of Tsc2 in oligodendrocyte precursors. Ann Clin Transl Neurol 2:1041–1054. [DOI] [PMC free article] [PubMed] [Google Scholar]
- 25. Choi YJ, Di Nardo A, Kramvis I, Meikle L, Kwiatkowski DJ, Sahin M et al (2008) Tuberous sclerosis complex proteins control axon formation. Genes Dev 22:2485–2495. [DOI] [PMC free article] [PubMed] [Google Scholar]
- 26. Crino PB, Nathanson KL, Henske EP (2006) The tuberous sclerosis complex. N Engl J Med 355:1345–1356. [DOI] [PubMed] [Google Scholar]
- 27. Curatolo P, Moavero R (2012) mTOR Inhibitors in Tuberous Sclerosis Complex. Curr Neuropharmacol 10:404–415. [DOI] [PMC free article] [PubMed] [Google Scholar]
- 28. Dai Q, Zhou D, Xu L, Song X (2018) Curcumin alleviates rheumatoid arthritis‐induced inflammation and synovial hyperplasia by targeting mTOR pathway in rats. Drug Des Devel Ther 12:4095–105. [DOI] [PMC free article] [PubMed] [Google Scholar]
- 29. Dello Russo C, Lisi L, Feinstein DL, Navarra P (2013) mTOR kinase, a key player in the regulation of glial functions: relevance for the therapy of multiple sclerosis. Glia 61:301–311. [DOI] [PubMed] [Google Scholar]
- 30. Dello Russo C, Lisi L, Tringali G, Navarra P (2009) Involvement of mTOR kinase in cytokine‐dependent microglial activation and cell proliferation. Biochem Pharmacol 78:1242–1251. [DOI] [PubMed] [Google Scholar]
- 31. Di Marco B, Bonaccorso CM, Aloisi E, D'Antoni S, Catania MV (2016) Neuro‐inflammatory mechanisms in developmental disorders associated with intellectual disability and autism spectrum disorder: a neuro‐ immune perspective. CNS Neurol Disord Drug Targets 15:448–463. [DOI] [PubMed] [Google Scholar]
- 32. DiMario FJ Jr (2004) Brain abnormalities in tuberous sclerosis complex. J Child Neurol 19:650–657. [DOI] [PubMed] [Google Scholar]
- 33. Dimsdale‐Zucker HR, Ritchey M, Ekstrom AD, Yonelinas AP, Ranganath C (2018) CA1 and CA3 differentially support spontaneous retrieval of episodic contexts within human hippocampal subfields. Nat Commun 9:294. [DOI] [PMC free article] [PubMed] [Google Scholar]
- 34. Ding AY, Li Q, Zhou IY, Ma SJ, Tong G, McAlonan GM et al (2013) MR diffusion tensor imaging detects rapid microstructural changes in amygdala and hippocampus following fear conditioning in mice. PLoS One 8:e51704‐e. [DOI] [PMC free article] [PubMed] [Google Scholar]
- 35. Dogan MS, Gumus K, Koc G, Doganay S, Per H, Gorkem SB et al (2016) Brain diffusion tensor imaging in children with tuberous sclerosis. Diagn Interv Imaging 97:171–176. [DOI] [PubMed] [Google Scholar]
- 36. Ehninger D, Han S, Shilyansky C, Zhou Y, Li W, Kwiatkowski DJ et al (2008) Reversal of learning deficits in a Tsc2+/‐ mouse model of tuberous sclerosis. Nat Med 14:843–848. [DOI] [PMC free article] [PubMed] [Google Scholar]
- 37. Faul F, Erdfelder E, Lang AG, Buchner A (2007) G*Power 3: a flexible statistical power analysis program for the social, behavioral, and biomedical sciences. Behav Res Methods 39:175–191. [DOI] [PubMed] [Google Scholar]
- 38. Food and Drug Administration US Novartis. Afinitor (Everolimus). Available at https://www.accessdata.fda.gov/drugsatfda_docs/label/2016/022334s036lbl.pdf (Accessed 23 December 2019). [Google Scholar]
- 39. Franz DN, Belousova E, Sparagana S, Bebin EM, Frost M, Kuperman R et al (2013) Efficacy and safety of everolimus for subependymal giant cell astrocytomas associated with tuberous sclerosis complex (EXIST‐1): a multicentre, randomised, placebo‐controlled phase 3 trial. Lancet 381:125–132. [DOI] [PubMed] [Google Scholar]
- 40. Garaci FG, Floris R, Bozzao A, Manenti G, Simonetti A, Lupattelli T et al (2004) Increased brain apparent diffusion coefficient in tuberous sclerosis. Radiology 232:461–465. [DOI] [PubMed] [Google Scholar]
- 41. Gipson TT, Poretti A, Kelley SA, Carson KA, Johnston MV, Huisman T (2019) Characterization of the basal ganglia using diffusion tensor imaging in children with self‐injurious behavior and tuberous sclerosis complex. J Neuroimaging 29:506–511. [DOI] [PMC free article] [PubMed] [Google Scholar]
- 42. Grabole N, Zhang JD, Aigner S, Ruderisch N, Costa V, Weber FC et al (2016) Genomic analysis of the molecular neuropathology of tuberous sclerosis using a human stem cell model. Genome Med 8:94. [DOI] [PMC free article] [PubMed] [Google Scholar]
- 43. Grajkowska W, Kotulska K, Jurkiewicz E, Matyja E (2010) Brain lesions in tuberous sclerosis complex. review. Folia Neuropathol 48:139–149. [PubMed] [Google Scholar]
- 44. Hammelrath L, Škokić S, Khmelinskii A, Hess A, van der Knaap N, Staring M et al (2016) Morphological maturation of the mouse brain: An in vivo MRI and histology investigation. NeuroImage 125:144–152. [DOI] [PubMed] [Google Scholar]
- 45. Hammond RS, Tull LE, Stackman RW (2004) On the delay‐dependent involvement of the hippocampus in object recognition memory. Neurobiol Learn Mem 82:26–34. [DOI] [PubMed] [Google Scholar]
- 46. Han JM, Sahin M (2011) TSC1/TSC2 signaling in the CNS. FEBS Lett 585:973–980. [DOI] [PMC free article] [PubMed] [Google Scholar]
- 47. Huang S, Shu L, Easton J, Harwood FC, Germain GS, Ichijo H et al (2004) Inhibition of mammalian target of rapamycin activates apoptosis signal‐regulating kinase 1 signaling by suppressing protein phosphatase 5 activity. J Biol Chem 279:36490–36496. [DOI] [PubMed] [Google Scholar]
- 48. Huang H, Yamamoto A, Hossain MA, Younes L, Mori S (2008) Quantitative cortical mapping of fractional anisotropy in developing rat brains. The Journal of Neuroscience 28:1427. [DOI] [PMC free article] [PubMed] [Google Scholar]
- 49. Hutchinson EB, Schwerin SC, Avram AV, Juliano SL, Pierpaoli C (2018) Diffusion MRI and the detection of alterations following traumatic brain injury. J Neurosci Res 96:612–625. [DOI] [PMC free article] [PubMed] [Google Scholar]
- 50. Jiang NM, Cowan M, Moonah SN, Petri WA Jr (2018) The impact of systemic inflammation on neurodevelopment. Trends Mol Med 24:794–804. [DOI] [PMC free article] [PubMed] [Google Scholar]
- 51. Jiang H, van Zijl PC, Kim J, Pearlson GD, Mori S (2006) DtiStudio: resource program for diffusion tensor computation and fiber bundle tracking. Comput Methods Programs Biomed 81:106–116. [DOI] [PubMed] [Google Scholar]
- 52. Julich K, Sahin M (2014) Mechanism‐based treatment in tuberous sclerosis complex. Pediatr Neurol 50:290–296. [DOI] [PMC free article] [PubMed] [Google Scholar]
- 53. Krueger DA, Sadhwani A, Byars AW, de Vries PJ, Franz DN, Whittemore VH et al (2017) Everolimus for treatment of tuberous sclerosis complex‐associated neuropsychiatric disorders. Ann Clin Transl Neurol 4:877–887. [DOI] [PMC free article] [PubMed] [Google Scholar]
- 54. Krueger DA, Wilfong AA, Holland‐Bouley K, Anderson AE, Agricola K, Tudor C et al (2013) Everolimus treatment of refractory epilepsy in tuberous sclerosis complex. Ann Neurol 74:679–687. [DOI] [PubMed] [Google Scholar]
- 55. Kulkarni SK, Dhir A (2010) An overview of curcumin in neurological disorders. Indian J Pharm Sci 72:149–514. [DOI] [PMC free article] [PubMed] [Google Scholar]
- 56. Kuo CJ, Huang CC, Chou SY, Lo YC, Kao TJ, Huang NK et al (2019) Potential therapeutic effect of curcumin, a natural mTOR inhibitor, in tuberous sclerosis complex. Phytomedicine 54:132–139. [DOI] [PubMed] [Google Scholar]
- 57. Lamprecht R, LeDoux J (2004) Structural plasticity and memory. Nat Rev Neurosci 5:45–54. [DOI] [PubMed] [Google Scholar]
- 58. Laplante M, Sabatini DM (2012) mTOR signaling in growth control and disease. Cell 149:274–293. [DOI] [PMC free article] [PubMed] [Google Scholar]
- 59. Latacz A, Russell JA, Oclon E, Zubel‐lojek J, Pierzchala‐Koziec K (2015) mTOR pathway ‐ novel modulator of astrocyte activity. Folia Biol (Krakow) 63:95–105. [DOI] [PubMed] [Google Scholar]
- 60. Le Bihan D, Mangin JF, Poupon C, Clark CA, Pappata S, Molko N et al (2001) Diffusion tensor imaging: concepts and applications. J Magn Reson Imaging 13:534–546. [DOI] [PubMed] [Google Scholar]
- 61. Lein ES, Hawrylycz MJ, Ao N, Ayres M, Bensinger A, Bernard A et al (2007) Genome‐wide atlas of gene expression in the adult mouse brain. Nature 445:168–176. [DOI] [PubMed] [Google Scholar]
- 62. Leutgeb S, Leutgeb JK, Treves A, Moser MB, Moser EI (2004) Distinct ensemble codes in hippocampal areas CA3 and CA1. Science 305:1295–1298. [DOI] [PubMed] [Google Scholar]
- 63. Li K, Li J, Zheng J, Qin S (2019) Reactive astrocytes in neurodegenerative diseases. Aging Dis 10:664–675. [DOI] [PMC free article] [PubMed] [Google Scholar]
- 64. Lisi L, Navarra P, Feinstein DL, Dello Russo C (2011) The mTOR kinase inhibitor rapamycin decreases iNOS mRNA stability in astrocytes. J Neuroinflammation 8:1. [DOI] [PMC free article] [PubMed] [Google Scholar]
- 65. Maiese K (2016) Front‐matter. In: Molecules to Medicine with mTOR, Maiese K (ed), pp. i–iii. Academic Press: Boston, MA. [Google Scholar]
- 66. Makki MI, Chugani DC, Janisse J, Chugani HT (2007) Characteristics of abnormal diffusivity in normal‐appearing white matter investigated with diffusion tensor MR imaging in tuberous sclerosis complex. Am J Neuroradiol 28:1662–1667. [DOI] [PMC free article] [PubMed] [Google Scholar]
- 67. Maldonado M, Baybis M, Newman D, Kolson DL, Chen W, McKhann G 2nd et al (2003) Expression of ICAM‐1, TNF‐alpha, NF kappa B, and MAP kinase in tubers of the tuberous sclerosis complex. Neurobiol Dis 14:279–290. [DOI] [PubMed] [Google Scholar]
- 68. Martin KR, Zhou W, Bowman MJ, Shih J, Au KS, Dittenhafer‐Reed KE et al (2017) The genomic landscape of tuberous sclerosis complex. Nat Commun 8:15816. [DOI] [PMC free article] [PubMed] [Google Scholar]
- 69. Mayo CD, Garcia‐Barrera MA, Mazerolle EL, Ritchie LJ, Fisk JD, Gawryluk JR et al (2018) Relationship between dti metrics and cognitive function in Alzheimer's disease. Front Aging Neurosci 10:436. [DOI] [PMC free article] [PubMed] [Google Scholar]
- 70. McKinstry R, Mathur A, Miller J, Özcan A, Snyder A, Schefft G et al (2003) Radial organization of developing human cerebral cortex revealed by non‐invasive water diffusion anisotropy MRI. Cereb Cortex 12:1237–1243. [DOI] [PubMed] [Google Scholar]
- 71. Meikle L, Pollizzi K, Egnor A, Kramvis I, Lane H, Sahin M et al (2008) Response of a neuronal model of tuberous sclerosis to mammalian target of rapamycin (mTOR) inhibitors: effects on mTORC1 and Akt signaling lead to improved survival and function. J Neurosci 28:5422–5432. [DOI] [PMC free article] [PubMed] [Google Scholar]
- 72. Meikle L, Talos DM, Onda H, Pollizzi K, Rotenberg A, Sahin M et al (2007) A mouse model of tuberous sclerosis: neuronal loss of Tsc1 causes dysplastic and ectopic neurons, reduced myelination, seizure activity, and limited survival. J Neurosci 27:5546–5558. [DOI] [PMC free article] [PubMed] [Google Scholar]
- 73. Nery‐Flores SD, Ramirez‐Herrera MA, Mendoza‐Magana ML, Romero‐Prado MMJ, Ramirez‐Vazquez JJ, Banuelos‐Pineda J et al (2019) Dietary curcumin prevented astrocytosis, microgliosis, and apoptosis caused by acute and chronic exposure to ozone. Molecules 24:2839. [DOI] [PMC free article] [PubMed] [Google Scholar]
- 74. Northrup H, Koenig MK, Pearson DA, Au K‐S (2015) Tuberous Sclerosis Complex, NCBI Bookshelf: Seattle, WA. [Google Scholar]
- 75. Oddo S (2012) The role of mTOR signaling in Alzheimer disease. Front Biosci (Schol Ed) 4:941–952. [DOI] [PMC free article] [PubMed] [Google Scholar]
- 76. Onda H, Lueck A, Marks PW, Warren HB, Kwiatkowski DJ (1999) Tsc2(+/‐) mice develop tumors in multiple sites that express gelsolin and are influenced by genetic background. J Clin Invest 104:687–695. [DOI] [PMC free article] [PubMed] [Google Scholar]
- 77. Ouyang M, Jeon T, Sotiras A, Peng Q, Mishra V, Halovanic C et al (2019) Differential cortical microstructural maturation in the preterm human brain with diffusion kurtosis and tensor imaging. Proc Natl Acad Sci 116:4681. [DOI] [PMC free article] [PubMed] [Google Scholar]
- 78. Palavra F, Ambrósio AF, Reis F (2016) Chapter 19 ‐ mTOR and Neuroinflammation. In: Molecules to Medicine with mTOR, Maiese K (ed), pp. 317–329. Academic Press: Boston. [Google Scholar]
- 79. Peters JM, Prohl A, Kapur K, Nath A, Scherrer B, Clancy S et al (2019) Longitudinal effects of everolimus on white matter diffusion in tuberous sclerosis complex. Pediatr Neurol 90:24–30. [DOI] [PMC free article] [PubMed] [Google Scholar]
- 80. Peters J, Sahin M, Vogel‐Farley V, Jeste S, Nelson C, Gregas M et al (2012) Loss of white matter microstructural integrity is associated with adverse neurological outcome in tuberous sclerosis complex. Acad Radiol 19:17‐25. [DOI] [PMC free article] [PubMed] [Google Scholar]
- 81. Prabowo AS, Anink JJ, Lammens M, Nellist M, van den Ouweland AMW, Adle‐Biassette H et al (2013) Fetal brain lesions in tuberous sclerosis complex: TORC1 activation and inflammation. Brain Pathol 23:45–59. [DOI] [PMC free article] [PubMed] [Google Scholar]
- 82. Rana A, Musto AE (2018) The role of inflammation in the development of epilepsy. J Neuroinflammation 15:144. [DOI] [PMC free article] [PubMed] [Google Scholar]
- 83. Randell E, McNamara R, Davies DM, Owen‐Jones E, Kirby N, Angel L et al (2016) The use of everolimus in the treatment of neurocognitive problems in tuberous sclerosis (TRON): study protocol for a randomised controlled trial. Trials 17:398. [DOI] [PMC free article] [PubMed] [Google Scholar]
- 84. Ruppe V, Dilsiz P, Reiss CS, Carlson C, Devinsky O, Zagzag D et al (2014) Developmental brain abnormalities in tuberous sclerosis complex: a comparative tissue analysis of cortical tubers and perituberal cortex. Epilepsia 55:539–550. [DOI] [PubMed] [Google Scholar]
- 85. Salo RA, Miettinen T, Laitinen T, Grohn O, Sierra A (2017) Diffusion tensor MRI shows progressive changes in the hippocampus and dentate gyrus after status epilepticus in rat ‐ histological validation with Fourier‐based analysis. NeuroImage 152:221–236. [DOI] [PubMed] [Google Scholar]
- 86. Samland H, Huitron‐Resendiz S, Masliah E, Criado J, Henriksen SJ, Campbell IL (2003) Profound increase in sensitivity to glutamatergic‐ but not cholinergic agonist‐induced seizures in transgenic mice with astrocyte production of IL‐6. J Neurosci Res 73:176–187. [DOI] [PubMed] [Google Scholar]
- 87. Sato A, Kasai S, Kobayashi T, Takamatsu Y, Hino O, Ikeda K et al (2012) Rapamycin reverses impaired social interaction in mouse models of tuberous sclerosis complex. Nat Commun 3:1292. [DOI] [PMC free article] [PubMed] [Google Scholar]
- 88. Sbardella E, Tona F, Petsas N, Pantano P (2013) DTI measurements in multiple sclerosis: evaluation of brain damage and clinical implications. Mult Scler Int 2013:671730. [DOI] [PMC free article] [PubMed] [Google Scholar]
- 89. Schneider CA, Rasband WS, Eliceiri KW (2012) NIH Image to ImageJ: 25 years of image analysis. Nat Methods 9:671–675. [DOI] [PMC free article] [PubMed] [Google Scholar]
- 90. Sorrenti V, Contarini G, Sut S, Dall'Acqua S, Confortin F, Pagetta A et al (2018) Curcumin prevents acute neuroinflammation and long‐term memory impairment induced by systemic lipopolysaccharide in mice. Front Pharmacol 9:183. [DOI] [PMC free article] [PubMed] [Google Scholar]
- 91. Sosunov AA, Wu X, Weiner HL, Mikell CB, Goodman RR, Crino PD et al (2008) Tuberous sclerosis: a primary pathology of astrocytes? Epilepsia 49(Suppl 2):53–62. [DOI] [PubMed] [Google Scholar]
- 92. Tang G, Gudsnuk K, Kuo SH, Cotrina ML, Rosoklija G, Sosunov A et al (2014) Loss of mTOR‐dependent macroautophagy causes autistic‐like synaptic pruning deficits. Neuron 83:1131–1143. [DOI] [PMC free article] [PubMed] [Google Scholar]
- 93. Teixeira CM, Pomedli SR, Maei HR, Kee N, Frankland PW (2006) Involvement of the anterior cingulate cortex in the expression of remote spatial memory. J Neurosci 26:7555–7564. [DOI] [PMC free article] [PubMed] [Google Scholar]
- 94. van Tilborg E, van Kammen CM, de Theije CGM, van Meer MPA, Dijkhuizen RM, Nijboer CH (2017) A quantitative method for microstructural analysis of myelinated axons in the injured rodent brain. Sci Rep 7:16492. [DOI] [PMC free article] [PubMed] [Google Scholar]
- 95. Tillema JM, Leach JL, Krueger DA, Franz DN (2012) Everolimus alters white matter diffusion in tuberous sclerosis complex. Neurology 78:526–531. [DOI] [PubMed] [Google Scholar]
- 96. Travers BG, Adluru N, Ennis C, Tromp DPM, Destiche D, Doran S et al (2012) Diffusion tensor imaging in autism spectrum disorder: a review. Autism Res 5:289–313. [DOI] [PMC free article] [PubMed] [Google Scholar]
- 97. Uhlmann EJ, Apicelli AJ, Baldwin RL, Burke SP, Bajenaru ML, Onda H et al (2002) Heterozygosity for the tuberous sclerosis complex (TSC) gene products results in increased astrocyte numbers and decreased p27‐Kip1 expression in TSC2+/− cells. Oncogene 21:4050–4059. [DOI] [PubMed] [Google Scholar]
- 98. de Vries PJ (2010) Targeted treatments for cognitive and neurodevelopmental disorders in tuberous sclerosis complex. Neurotherapeutics 7:275–282. [DOI] [PMC free article] [PubMed] [Google Scholar]
- 99. Wang DV, Ikemoto S (2016) Coordinated Interaction Between Hippocampal Sharp‐Wave Ripples And Anterior Cingulate Unit Activity. J Neurosci 36:10663–10672. [DOI] [PMC free article] [PubMed] [Google Scholar]
- 100. Way SW, McKenna J 3rd, Mietzsch U, Reith RM, Wu HC, Gambello MJ (2009) Loss of Tsc2 in radial glia models the brain pathology of tuberous sclerosis complex in the mouse. Hum Mol Genet 18:1252–1265. [DOI] [PMC free article] [PubMed] [Google Scholar]
- 101. Weible AP, Rowland DC, Monaghan CK, Wolfgang NT, Kentros CG (2012) Neural correlates of long‐term object memory in the mouse anterior cingulate cortex. J Neurosci 32:5598–5608. [DOI] [PMC free article] [PubMed] [Google Scholar]
- 102. Weible AP, Rowland DC, Pang R, Kentros C (2009) Neural correlates of novel object and novel location recognition behavior in the mouse anterior cingulate cortex. J Neurophysiol 102:2055–2068. [DOI] [PubMed] [Google Scholar]
- 103. Weichhart T, Hengstschlager M, Linke M (2015) Regulation of innate immune cell function by mTOR. Nat Rev Immunol 15:599–614. [DOI] [PMC free article] [PubMed] [Google Scholar]
- 104. Zeng LH, Xu L, Gutmann DH, Wong M (2008) Rapamycin prevents epilepsy in a mouse model of tuberous sclerosis complex. Ann Neurol 63:444–453. [DOI] [PMC free article] [PubMed] [Google Scholar]
- 105. Zhang B, Zou J, Rensing NR, Yang M, Wong M (2015) Inflammatory mechanisms contribute to the neurological manifestations of tuberous sclerosis complex. Neurobiol Dis 80:70–79. [DOI] [PMC free article] [PubMed] [Google Scholar]
- 106. Zhuo J, Xu S, Proctor JL, Mullins RJ, Simon JZ, Fiskum G et al (2012) Diffusion kurtosis as an in vivo imaging marker for reactive astrogliosis in traumatic brain injury. NeuroImage 59:467–477. [DOI] [PMC free article] [PubMed] [Google Scholar]
Associated Data
This section collects any data citations, data availability statements, or supplementary materials included in this article.
Supplementary Materials
Fig S1
Figure S1. Quantitative coherency analysis using OrientationJ to assess the myelination complexity in the ACC and the hippocampal regions. (A) MBP‐stained sections of WT, TSC and TSC/cur mice were analyzed using OrientationJ (5). Within the ACC region, a total of nine random areas, each with the dimension of 200 μm × 200 μm, were calculated for each group. As for the Hipp, a total of 6 areas, each with dimension 200 μm × 200 μm, along the stratum lacunosum moleculare (slm) of CA1, where the myelination is prominent, was assessed for the coherency. Scale bar: 200 μm. (B) A schematic illustration of quantitative coherency analysis procedural steps. Random areas within the ACC were chosen to be quantitatively analyzed by the OrientationJ Measure according to the equation shown in the figure, where C is equal to 1 when the local structure has one dominant orientation and C is 0 if the image is isotropic.
Fig S2
Figure S2. mTORC1 activation in cortical regions and the hippocampus with no obvious difference in myelination pattern of Tsc2+/‐ mice. Co‐immunostaining of pS6 and myelin basic protein (MBP) of WT, TSC and TSC/cur mice. The result showed hyperactivation of mTORC1 at certain brain regions, instead of whole brain activation, in TSC. Overall treatment of curcumin can lower the expression of pS6. The myelination pattern remained unchanged in white matter structures for the three groups. When the hippocampus was examined in greater magnifications (inset), no obvious difference in myelination patterns was seen. Scale bar: 100 μm.
Fig S3
Figure S3. Tsc2+/‐ mice showed equal number of neuronal cells. Immunostaining of NeuN, a marker for neuronal cells, for the WT, TSC and TSC/cur groups. The expression of NeuN remained the same for each group. The DAPI staining showed robustly the normal‐appearing hippocampus for TSC mice. Scale bar: 500 μm; inset: 100 μm.
Fig S4
Figure S4. Tsc2+/‐ mice showed equal number of microglial cells in the hippocampus. (A) Immunostaining of Iba1, a marker for microglial cells, for WT, TSC and TSC/cur mice. The expression of Iba1 remained the same for each group. (B) The merged figures with DAPI staining showed robustly the normal‐appearing hippocampus for TSC mice. Scale bar: 100 μm.
Fig S5
Figure S5. DTI analysis was performed on the corpus callosum for the three groups, WT, TSC, and TSC/cur. Fractional anisotropy (FA) values were determined for each group. Data represent the mean ± SEM. *P < 0.05, **P < 0.01, n.s. not significant, using One‐way ANOVA test, Fisher’s LSD post‐hoc test.
Supplementary Material
Table S1. Differences in fractional anisotropy (FA) values in wild‐type (WT), Tsc2 +/‐ (TSC), and Tsc2 +/‐ fed with curcumin (TSC/cur).
Table S2. Differences in mean diffusivity (MD) values in wild‐type (WT), Tsc2 +/‐ (TSC), and Tsc2 +/‐ fed with curcumin (TSC/cur).
Table S3. The effect size f and power for the behavioral tests.
Table S4. The effect size f and power for the fractional anisotropy (FA) measurements.
Table S5. The effect size f and power for the mean diffusivity (MD) measurements.
Data Availability Statement
The data that support the findings of this study are available from the corresponding author upon reasonable request.