Abstract
Experimental autoimmune encephalomyelitis (EAE) is the primary disease model of multiple sclerosis (MS), one of the most diffused neurological diseases characterized by fatigue, muscle weakness, vision loss, anxiety and depression. EAE can be induced through injection of myelin peptides to susceptible mouse or rat strains. In particular, EAE elicited by the autoimmune reaction against myelin oligodendrocyte glycoprotein (MOG) presents the common features of human MS: inflammation, demyelination and axonal loss. Optic neuritis affects visual pathways in both MS and in several EAE models. Neurophysiological evaluation through visual evoked potential (VEP) recording is useful to check visual pathway dysfunctions and to test the efficacy of innovative treatments against optic neuritis. For this purpose, we investigate the extent of VEP abnormalities in the dark agouti (DA) rat immunized with MOG, which develops a relapsing–remitting disease course. Together with the detection of motor signs, we acquired VEPs during both early and late stages of EAE, taking advantage of a non‐invasive recording procedure that allows long follow‐up studies. The validation of VEP outcomes was determined by comparison with ON histopathology, aimed at revealing inflammation, demyelination and nerve fiber loss. Our results indicate that the first VEP latency delay in MOG‐EAE DA rats appeared before motor deficits and were mainly related to an inflammatory state. Subsequent VEP delays, detected during relapsing EAE phases, were associated with a combination of inflammation, demyelination and axonal loss. Moreover, DA rats with atypical EAE clinical course tested at extremely late time points, manifested abnormal VEPs although motor signs were mild. Overall, our data demonstrated that non‐invasive VEPs are a powerful tool to detect visual involvement at different stages of EAE, prompting their validation as biomarkers to test novel treatments against MS optic neuritis.
Keywords: experimental autoimmune encephalomyelitis, non‐invasive visual evoked potentials, optic neuritis
Introduction
Multiple sclerosis (MS) is the prototype inflammatory autoimmune disease of the central nervous system (CNS) and potentially the most common cause of neurological disability in young adults. Visual pathways are commonly involved in MS pathology. In particular, the optic nerve (ON) is susceptible with optic neuritis occurring as the presenting symptom of MS in 19%–25% of patients 40, 42. During the course of the disease, optic neuritis occurs in about 70% of affected MS subjects, resulting in subacute visual problems, periorbital pain, color vision deficits and visual field defects. Vision loss is usually unilateral and it is caused by inflammation and conduction block in acutely demyelinated ONs. Vision defects usually progress for the first 1–2 weeks and then visual recovery usually begins within the first 4 weeks 17. Therefore, the role of preclinical animal models of MS could be crucial to explain the neuropathological processes of the disease and to evaluate the effects of experimental therapies.
The most studied and widespread used model of MS is the rodent model of experimental autoimmune encephalomyelitis (EAE), which resembles several immunopathological and neuropathological aspects of MS: inflammation, demyelination, axonal loss and gliosis 19. EAE can be actively induced by immunization with CNS‐derived tissues, like spinal cord homogenate (SCH) derivates, as well as myelin peptides, such as myelin basic protein (MBP), proteolipid protein (PLP) and myelin oligodendrocyte protein (MOG; 29). In C57BL/6 mice immunized with MOG, the EAE course is monophasic or chronic progressive without remission and relapse phases. Monophasic disease is characterized by multifocal areas of mononuclear inflammatory infiltration (driven by macrophages and CD4+ T‐cells) and demyelination in the peripheral white matter of the spinal cord 7. In the brain, meningitis and perivascular inflammation can be seen at the level of cerebellum and hindbrain white matter. In the dark agouti (DA) rat, syngeneic spinal cord tissue or recombinant rat MOG induce EAE characterized by demyelination and spinal cord lesions with perivascular and subpial inflammation, with a typical relapsing–remitting clinical course. Inflammation is observed in the acute phase, whereas demyelination tends to appear in the dorsal column of the spinal cord only during the second disease relapse 41.
Research analyzing ON lesions in animal models of MS might be of great interest in understanding the pathophysiological mechanisms and developing effective treatments for optic neuritis related to MS. The optic pathway can be accurately evaluated in detail due to the availability of highly sensitive electrophysiological tests, such as visual evoked potential (VEP) recording. VEPs are helpful in clinics to assess the ON functionality and the involvement of cortical structures in MS patients 26, 32. In particular, VEP latency delays can be considered a marker of myelin loss along the visual pathways both in humans 14 and in animal models of demyelination 11, 45, while permanent ON demyelination makes axons more vulnerable to damage and may potentially cause axonal degeneration, leading to VEP amplitude loss 18. VEP alterations had been found in several EAE models, such as rhesus monkey immunized with homologous SCH 15, guinea pig 11, 12 and Lewis rat immunized with homologous SCH 8, 10, Brown Norway 9 and DA rat immunized with MOG 1 and SCH 5.
In the present work, we took advantage of VEP recording for functional monitoring of the optic pathways in the DA rat strain immunized with MOG, which manifests a protracted and relapsing EAE which mimics the relapsing–remitting MS disease course 21, 43. Although motor symptoms have already been elucidated in this EAE model, more efforts should be done to explore the CNS damage, in particular what happens in the ON. We will focus our investigation in this district, with the aim to disentangle the functional impact of inflammation, demyelination and axonal loss through comparison with histological findings. Taking advantage of non‐invasive VEP recording, we managed to monitor function along the visual pathways over several time points with a longitudinal strategy. In particular, we tested VEPs few weeks after the immunization, when no motor symptoms were yet detected, to very late stages of the disease that are poorly known in the literature, in order to add knowledge on EAE‐associated optic neuritis. At first, we focused our attention on the early phases of EAE, from the immunization to the first remission (experiment 1). Subsequently, we switched to the later stages of the disease, evaluating visual function during the relapses that are typical of the MOG‐EAE DA rat model (experiment 2). Finally, we assessed VEPs and ON histology at very late time points in immunized rats that did not develop a typical EAE onset (experiment 3), in order to verify whether ON dysfunction could be present.
The aim of our study is to validate VEPs as reliable biomarkers that can monitor functional deficits related to the progression of ON damage and possibly detect the effects of experimental treatments in preclinical MS models.
Materials and Methods
DA rats
Female DA rats, 6–8 weeks aged, with a body weight of 110–130 g, (Janvier Labs ‐ Saint‐Berthevin, France) were used in these experiments. The rats were housed under controlled temperature on a 12 h light/dark cycle with free access to chow pellets and tap water. All procedures were conducted in accordance with the European Community guidelines (Directive 2010/63/EU) and the Guide for the Care and Use of Laboratory Animals of the U.S. National Institutes of Health (NIH), and were previously approved by the San Raffaele Institutional Animal Care and Use Committee (IACUC).
Experimental protocol
In experiment 1, 9 rats were subjected to baseline VEP recording before immunization. Then, all the rats were immunized with MOG (EAE rats). VEPs from both eyes (n = 18) were acquired 4 times once a week in EAE rats (first acquisition at day 0, then at 7, 14 and 21 dpi). Clinical score was monitored daily from 0 to 21 dpi. After the last VEP session (21 dpi), all the EAE rats were sacrificed, then ONs were collected for histological analysis. In particular, 10 EAE ONs were randomly selected from the 9 immunized rats and compared with 6 ONs dissected from 3 healthy (H) age‐matched rats (Figure 1).
Figure 1.

Study design of experiment 1.
In experiment 2, 15 rats were immunized with MOG (EAE rats), whereas 9 rats were left untouched and considered as healthy controls (H rats). Since 8 EAE rats did not reach a minimum clinical score of 2 between 9 and 18 dpi, they were excluded from this study together with 3 H rats. These animals were analyzed separately in experiment 3. VEPs were performed on both eyes of H (n = 12 from 6 rats) and EAE (n = 14 from 7 rats) rats at 21, 35, 42 and 56 dpi (Figure 2). Clinical score was monitored daily in EAE rats from 0 to 56 dpi. Histological analysis was performed at 56 dpi in 12 EAE vs. 6 randomly selected H ONs, since one EAE rat (MOG 14) was excluded from this study and sacrificed because it developed an atypical behavior at 42 dpi, consisting in running continuously from one corner of its cage to another.
Figure 2.

Study design of experiment 2. †Indicates the rat that was excluded from the experiment because of its atypical behavior manifested at 42 dpi.
The EAE rats (n = 8) analyzed in experiment 3 were excluded from experiment 2, because they did not reach a minimum clinical score of 2 between 9 and 18 dpi. Clinical score was monitored daily from 0 to 70 dpi, then VEPs were performed on both eyes (n = 16) at 70 dpi, together with 6 eyes from 3 age‐matched H rats that were used as controls. Histological analysis was performed at 70 dpi in all 16 EAE ONs and was compared to 6 H ONs dissected from the three H controls (Figure 3).
Figure 3.
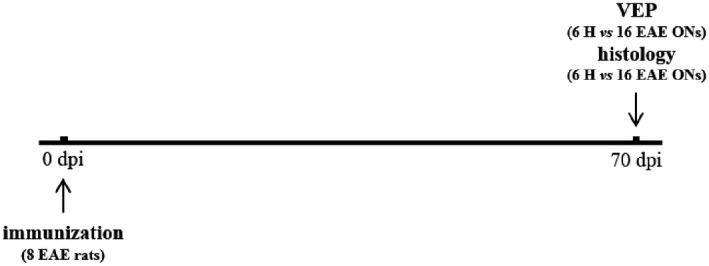
Study design of experiment 3.
EAE induction
Rats were anesthetized by inhalation of anesthesia with sevoflurane (3.5%) in oxygen (30%) and nitrogen (70%), delivered by inhalation through a face mask. Rats then were injected intradermally at the base of the tail with a total volume of 200 µL of inoculum containing 40 µg of rat recombinant MOG, corresponding to the N‐terminal sequence of rat MOG (amino acids 1‐125), in saline emulsified (1:1) with complete Freund's adjuvant (CFA) containing 200 µg of heat‐inactivated Mycobacterium tuberculosis.
Clinical assessment of EAE
Clinical signs of EAE in immunized rats were scored daily. Clinical score ranged from 0 to 5. (0: no signs; 0.5: tail weakness; (1) complete tail paralysis; 1.5: complete tail paralysis and weakness of the hind limbs; (2) complete tail paralysis and one hind limb paralyzed; 2.5: hind limbs do not support the body weight, but without complete paralysis; (3) complete paralysis of the hind limbs; 3.5: complete paralysis of the hind limbs and paresis of front paws; (4) complete paralysis of front and hind limbs; 4.5: moribund and (5) death due to the severity of the clinical symptoms). Notably, this score reflects the amount of spinal cord lesions and does not include visual dysfunctions.
Ag/AgCl cup electrodes mounting
For epidermal VEPs, removable 6 mm Ø Ag/AgCl cup electrodes (SEI EMG s.r.l., Cittadella, Italy) were used. The recording electrode was placed on the scalp (previously shaved) in correspondence of the primary visual cortex (V1), contralaterally to the stimulated eye (4 mm lateral to the midline and 3.5 mm anterior to the interaural line 25). To assure a strong adherence to the skin, cup electrodes were fixed by an electro‐conductive paste (Elefix EEG paste, Nihon Kohden, Japan), which also improved the electrical signal conduction. A needle electrode was inserted in the nose and used as reference.
VEP recording
VEPs were acquired after 5 minutes of dark adaptation in a darkened Faraday cage, under volatile anesthesia with sevoflurane (2.5%) in oxygen (30%) and nitrogen (70%), delivered by inhalation through a face mask, as previously described by our group 4, 31. During each VEP session, body temperature was maintained at 37°C using a heating pad. Before the experimental tests, rats were allowed to reach a steady state with the anesthetic; the adequate level of anesthesia was verified by checking for the presence of tail‐pinching reflex and the absence of the corneal one 2. In addition, heart rate frequency was continuously monitored from two subcutaneous needles in right and left forelimbs. This enabled to control closely the depth of anesthesia, which is crucial to maintain optimum visual responsiveness 13. Pupils were dilated with 1% Tropicamide (Visumidriatic ‐ Visufarma s.p.a., Rome, Italy) and 2% Hydroxypropylmethylcellulose (GEL 4000 ‐ Bruschettini s.r.l., Genoa, Italy) was applied to avoid eye drying. Electrodes were connected via flexible cables to a Micromed amplifier (SystemPlus Evolution, Micromed s.p.a. ‐ Mogliano Veneto, Italy) and a needle electrode was inserted into the hind limb as the ground. Data were acquired at a sampling frequency of 4096 Hz, coded with 16 bits and filtered between 10 and 80 Hz. Flash stimuli, with intensity of 522 mJ and duration 10 µs, were delivered at a frequency of 1 Hz with a Flash10s photo stimulator (Micromed s.p.a. ‐ Mogliano Veneto, Italy) placed 15 cm from the stimulated eye, while the non‐stimulated eye was covered. In experiment 3, we applied the same VEP recording method except for the anesthesia. In particular, rats were anesthetized with an intraperitoneal injection of ketamine (40 mg/kg) and xylazine (5 mg/kg). For each recording session, 4 averages of 10–20 trains each were used for measuring the latency of N1 (expressed in ms) from the complex P1‐N1‐P2 of flash‐VEPs 24, 33. N1 component was detected from V1 cortex, contralaterally to the flash‐stimulated eye.
Histology
Animals were sacrificed with cervical dislocation under deep sevoflurane anesthesia. ONs were carefully removed and fixed in 4% paraformaldehyde at 4°C for 48 h, then embedded in paraffin and cut at the microtome. Three 8 µm transversal sections of ON were collected from retrolaminar region (adjacent to ON head), at the midpoint of ON and at the perichiasmal area. ON sections were stained with luxol fast blue (LFB), SMI312 antibody and Iba1 antibody to detect myelin, axons and activated microglia/macrophages, respectively. Demyelination and axonal loss were determined as a percentage of the whole ON cross‐section:
The number of activated microglia/macrophages was determined by Iba1+ cell count. All histological analyses were performed with ImageJ software. The percentage of demyelination/axonal loss and the number of activated microglia/macrophages were quantified averaging the three ON sections.
Statistical analysis
Statistical analysis was performed with SPSS statistical software (version 23.0).
Clinical scores of immunized rats were analyzed through Friedman test with “time” as “within subjects” main factor, followed by Dunn post‐hoc test.
For VEP and histology, sample normality was checked with Kolmogorov–Smirnov test. If this test did not reveal normality violations, parametric tests were applied (t‐test for two‐sample comparisons; ANOVA for comparisons between three or more samples, followed by LSD post‐hoc test). Before performing t‐tests, Levene test was used to check differences between sample variances. In particular, for homoscedastic samples, Student t‐test was adopted, whereas for heteroscedastic samples, Welch t‐test was used. When normality assumption was violated, non‐parametric tests were performed (Mann–Whitney test for two‐sample comparisons; Kruskal–Wallis test for comparisons between three or more samples, followed by Dunn post‐hoc test).
In experiment 1, N1 latency was compared using one‐way ANOVA for repeated measures with “time” (4 levels: 0, 7, 14 and 21 dpi) as “within subjects” main factor, followed by LSD post‐hoc test. For histological data, demyelination percentages and Iba1 quantifications were compared using Mann–Whitney test, whereas axonal loss percentages were compared with Student t‐test for homoscedastic samples.
In experiment 2, N1 latency was compared using two‐way ANOVA for repeated measures with “time” (4 levels: 21, 35, 42 and 56 dpi) as “within subjects” main factor and “disease” as “between subjects” main factor (2 levels: H, EAE), followed by LSD post‐hoc test. Percentages of present and absent VEPs at each time point were compared between H and EAE with crosstabs and chi‐squared analysis. Histological quantifications of the ON (demyelination, inflammation and axonal loss) were compared using Kruskal–Wallis test followed by Dunn post‐hoc test.
In experiment 3, N1 latency was compared using Mann–Whitney test. For histological data, demyelination percentages were compared using Mann–Whitney test, whereas Iba1 quantifications and axonal loss percentages were compared with Welch t‐test for heteroscedastic samples. Data were considered significant at P < 0.05.
Results
Experiment 1: Non‐invasive visual evoked potentials to assess optic nerve involvement in the DA rat model of experimental autoimmune encephalomyelitis induced by MOG (longitudinal study from 0 to 21 dpi)
Clinical assessment of EAE
Individual clinical profiles highlight the onsets and remissions of EAE rats (Figure 4A). In particular, the onset appeared between 13 and 14 dpi and affected 4 out of 9 rats (MOG 6, 7, 8 and 9; 44%). Total remission was observed in 2 out of 4 diseased rats (MOG 6 and MOG 7; 50%) and occurred between 16 and 20 dpi. EAE symptoms remained chronically in 2 out of 4 affected rats until sacrifice (MOG 8 and 9; 50%). The Kaplan–Meier curve summarizes the percentage of diseased animals from 0 to 21 dpi (Figure 4B). More specifically, the highest percentage of diseased rats was at 14 and 15 dpi (44%), turning to 33% between 16 and 19 dpi and decreasing to 22% at 20 and 21 dpi. Considering the mean clinical score (Figure 4C), Friedman test revealed a significant effect of “time” (χ 2 21 = 75.168, P < 0.0001) in EAE rats and the disease peak was detected at 14 dpi (Dunn post‐hoc test: P = 0.026).
Figure 4.
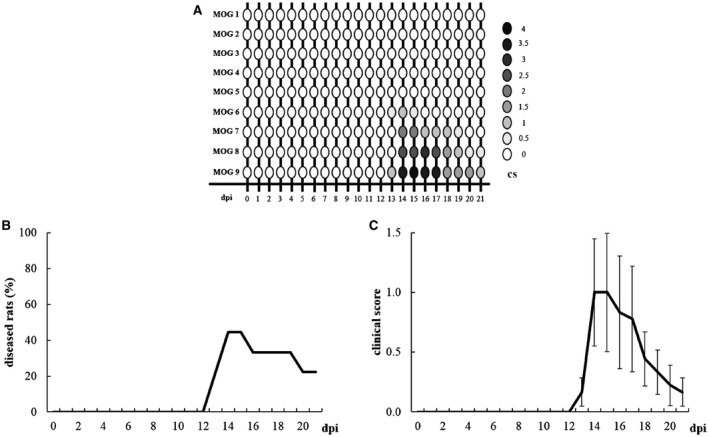
A. Graphic representation of individual clinical profile in EAE rats from 0 to 21 dpi. B. Kaplan–Meier curve representing EAE rats (n = 9) with clinical symptoms. C. Clinical score of EAE rats (n = 9) from 0 to 21 dpi. Data are expressed as mean ± SEM.
VEP latency in EAE rats
During each VEP recording session, we succeeded in obtaining a good signal‐to‐noise ratio, with N1 wave that was clearly distinguishable and measurable in terms of latency (Figure 5A). One‐way ANOVA for repeated measures detected a significant main effect of “time” (F3,51 = 8.286, P = 0.0001) on N1 latencies. Post‐hoc analysis revealed that, compared to baseline, mean N1 latencies of EAE rats were significantly increased at 7 dpi (P = 0.001), 14 dpi (P = 0.002) and 21 dpi (P = 0.001; Figure 5B). Interestingly, the first VEP delay appeared at 7 dpi, before the onset of EAE motor symptoms (red line in Figure 6B).
Figure 5.
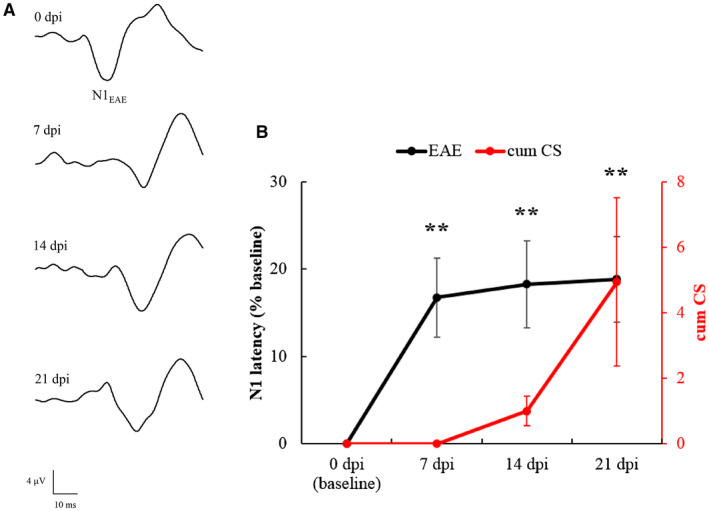
A. Representative VEP traces recorded from an EAE rat at different time points. B. N1 latency of EAE eyes (n = 18, black line) measured at different time points and normalized as % of baseline. Asterisks indicate the significance level of VEP latency in EAE eyes compared to their baseline. (**: P < 0.01). The red line indicates the cumulative clinical score (=progressive sum of the clinical scores of EAE rats at each time point) in EAE rats from 0 to 21 dpi. Data are expressed as mean ± SEM.
Figure 6.
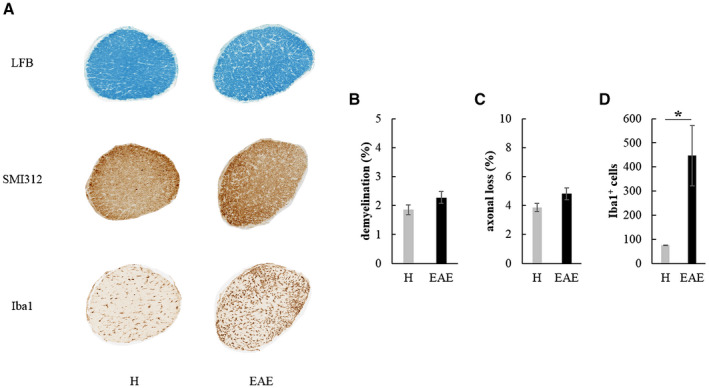
A. Transversal ON and retina sections stained to detect demyelination (LFB), axonal loss (SMI312) and microglia/macrophages infiltration (Iba1) in H and EAE rats at 21 dpi. Quantification of demyelination (B), axonal loss (C) and Iba1+ cells (D) in H (n = 6) and EAE (n = 10) ONs at 21 dpi (*: P < 0.05). Data are expressed as mean ± SEM.
Histological analysis of ONs
At 21 dpi, rats were sacrificed and transversal sections of ONs (Figure 6A) from H and EAE rats were analyzed. EAE ONs showed a non‐significant increase of both demyelination (Mann–Whitney test: U = 19.000, P = 0.232; Figure 6B) and axonal loss (Student t‐test: t14 = 1.666, P = 0.118; Figure 6C) compared to H ONs. Interestingly, a significant increase of Iba1+ cells was found with respect to age‐matched H rats (Mann–Whitney test: U = 0, P = 0.011; Figure 6D).
Experiment 2: Non‐invasive visual evoked potentials to assess optic nerve involvement in the DA rat model of experimental autoimmune encephalomyelitis induced by MOG (longitudinal study from 21 to 56 dpi)
Clinical assessment of EAE
Individual clinical profiles highlight the onsets, remissions and relapses of EAE rats (Figure 7A). In particular, the disease onset appeared between 9 and 13 dpi. Motor signs affected 7 out of 7 rats (100%), although one rat (MOG 14) was excluded from this experiment because it developed an atypical behavior at 42 dpi, consisting in running continuously from one corner of its cage to another. Total remission was observed in 3 out of 6 diseased rats (MOG 10, 11 and 15; 50%), occurring at 54 dpi. Relapses were seen in all the 6 rats (100%). EAE symptoms remained chronically in 3 out of 6 affected rats until sacrifice (MOG 12, 13 and 16; 50%). The Kaplan–Meier curve summarizes the percentage of diseased animals from 0 to 56 dpi (Figure 7B). The highest percentage of diseased rats was at 13 dpi, 28 dpi and between 50 and 53 dpi (100%), whereas the minimal percentage (0%) was observed from 18 to 23 dpi. Considering the mean clinical score (Figure 7C), Friedman test revealed a significant effect of “time” (χ 2 56 = 167.174, P < 0.0001) in EAE rats and the disease peak was detected at 13 dpi (Dunn post‐hoc test: P < 0.0001).
Figure 7.
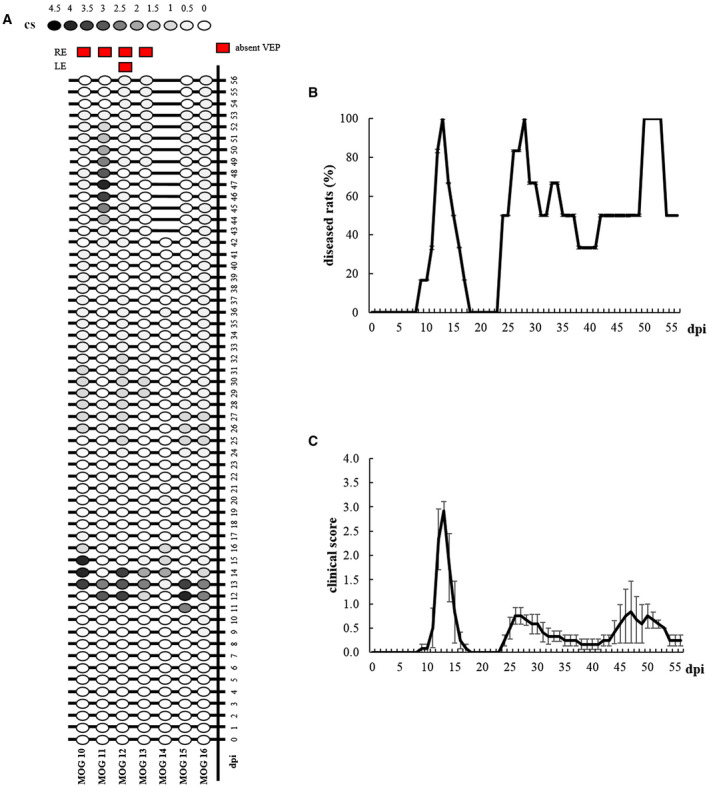
A. Graphic representation of individual clinical profile in EAE rats from 0 to 56 dpi. Red squares indicate eyes with absent VEPs at 56 dpi. B. Kaplan–Meier curve representing EAE rats (n = 6) with clinical symptoms. C. Clinical score of EAE rats (n = 6) from 0 to 56 dpi. Data are expressed as mean ± SEM.
VEP latency in H and EAE rats
During each VEP recording session, we succeeded in obtaining a good signal‐to‐noise ratio, with N1 wave that was clearly distinguishable and measurable in terms of latency both in H and EAE groups (Figure 8A). Two‐way ANOVA for repeated measures detected significant main effects of “disease” (F1,13 = 43.449, P < 0.0001) and “time” (F3,39 = 3.349, P = 0.029) on N1 latencies (Figure 8B). Post‐hoc analysis revealed that, compared to H, mean N1 latencies of EAE rats were significantly increased at 21 dpi (P = 0.039) and 56 dpi (P = 0.002). Moreover, EAE rats showed a significant delay of N1 latency over time (one‐way ANOVA for repeated measures: F3,18 = 3.211, P = 0.048). Post‐hoc analysis highlighted a significant increases of N1 latency between 35 and 56 dpi (P = 0.016), with a trend between 21 and 35 dpi (P = 0.070). On the other hand, N1 latencies in H rats did not significantly change over time (one‐way ANOVA for repeated measures: F3,21 = 0.589, P = 0.629). Absent VEPs (Figure 8C) were excluded from N1 latency analysis and have been examined separately. In particular, VEP responses were absent in 2/12 EAE eyes at 35 and 42 dpi (16.7%) and in 5/12 EAE eyes at 56 dpi (41.7%). Compared to H rats, the percentage of absent VEPs in EAE rats significantly increased at 56 dpi (crosstabs: χ 2 1 = 6.316, P = 0.012; Figure 8D).
Figure 8.
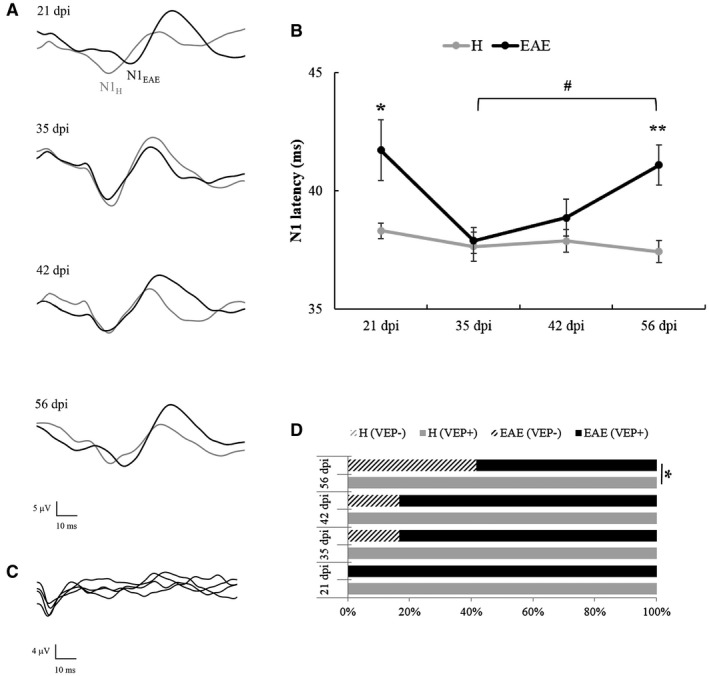
A. Representative VEP traces recorded from a H (grey line) and an EAE (black line) rat at different time points. B. N1 latency measured from H (n = 8) and EAE (n = 7) eyes measured at different time points. Hash indicates the significance level of VEPs measured in EAE eyes at 35 dpi vs. 56 dpi (#: P < 0.05). Asterisks indicate the significance level of VEPs recorded in EAE eyes compared to H eyes at the same time point (*: P < 0.05; **: P < 0.01). Data are expressed as mean ± SEM. C. Representative absent VEPs recorded from an EAE rat. Each sweep represents the average of 10 flash stimuli. D. Percentage of recorded (VEP+) vs. absent VEPs (VEP‐) in H and EAE eyes at 21, 35, 42 and 56 dpi (*: P < 0.05).
Histological analysis of ONs
At 56 dpi, rats were sacrificed and transversal sections of ONs from H, EAE eyes that responded (VEP+) and did not respond (VEP‐) to flash stimuli were analyzed (Figure 9A). Regarding LFB quantification (Figure 9B), Kruskal–Wallis test showed significant differences between H, EAE‐VEP+ and EAE‐VEP‐ ONs (χ 2 2 = 11.877, P = 0.003). Post‐hoc analysis highlighted that, compared to age‐matched H controls, demyelination was significantly increased both in EAE‐VEP+ (P = 0.007) and EAE‐VEP‐ (P = 0.0014) ONs. Concerning SMI312 quantification (Figure 9C), Kruskal–Wallis test showed significant differences between H, EAE‐VEP+ and EAE‐VEP‐ ONs (χ 2 2 = 9.179, P = 0.0102). Post‐hoc analysis revealed that, compared to age‐matched H controls, axonal loss in EAE‐VEP‐ ONs was significantly increased (P = 0.003), with a trend detected between H and EAE‐VEP+ ONs (P = 0.091). For Iba1+ cell count (Figure 9D), Kruskal–Wallis test showed significant differences between H, EAE‐VEP+ and EAE‐VEP‐ ONs (χ 2 2 = 11.516, P = 0.003). Post‐hoc analysis highlighted that, compared to age‐matched H controls, the number of Iba1+ cells was significantly increased both in EAE‐VEP+ (P = 0.004) and EAE‐VEP‐ (P = 0.003) ONs.
Figure 9.
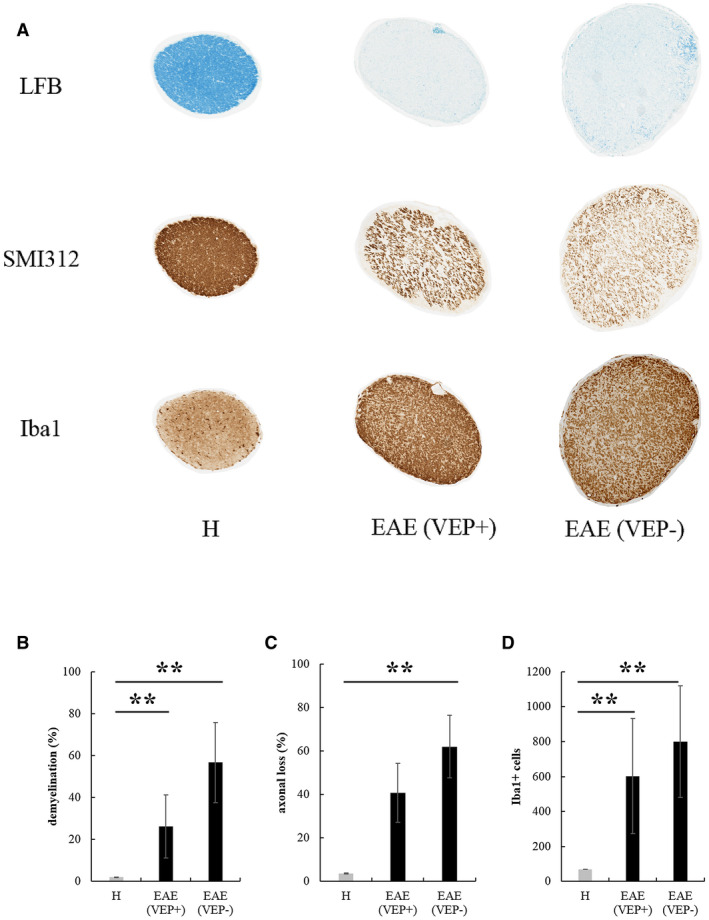
A. Transversal ON sections stained to detect demyelination (LFB), axonal loss (SMI312) and activated microglia/macrophages (Iba1) in H and EAE ONs at 56 dpi (magnification: 10×). Quantification of demyelination (B), axonal loss (C) and Iba1+ cells (D) in ONs from H eyes (n = 6), EAE eyes with recorded VEPs (VEP+, n = 7) and eyes with absent VEPs (VEP‐, n = 5) (**: P < 0.01). Data are expressed as mean ± SEM.
Experiment 3: Non‐invasive visual evoked potentials to assess Optic Nerve involvement in the DA rat model of Experimental Autoimmune Encephalomyelitis induced by MOG (study at 70 dpi, atypical motor symptoms)
Clinical assessment of EAE
Individual clinical profiles highlight the onsets, remissions and relapses of EAE rats (Figure 10A). In particular, the onset appeared at 10 dpi (MOG 26), 11 dpi (MOG 23), 14 dpi (MOG 24 and 25), 16 dpi (MOG 28), 17 dpi (MOG 29) and 36 dpi (MOG 27). Motor impairment affected 7 out of 8 rats (87.5%). Total remission was observed in 5 out of 8 rats (75%) and occurred at 16 dpi (MOG 23 and 24), 17 dpi (MOG 25), 48 dpi (MOG 26) and 55 dpi (MOG 29). EAE symptoms remained chronically in 2 out of 8 rats until sacrifice (MOG 27 and 28; 25%). One rat did not manifest motor disability during the entire period of the study (MOG 22; 12.5%). The Kaplan–Meier curve summarizes the percentage of diseased animals from 0 to 70 dpi (Figure 10B). More specifically, the highest percentage of diseased rats was at 36 dpi (50%), and the lowest (0%) was between 19 and 25 dpi, at 33 dpi and at 59–60 dpi. Considering the mean clinical score (Figure 10C), Friedman test revealed a significant effect of “time” (χ 2 70 = 95.327, P = 0.024) in EAE rats, but Dunn post‐hoc test did not detect a significant disease peak.
Figure 10.
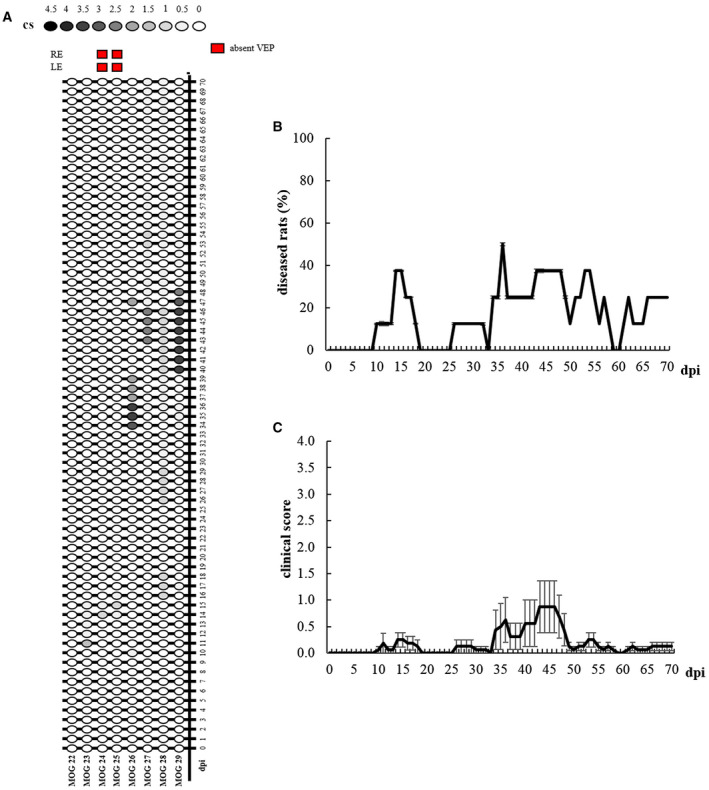
A. Graphic representation of individual clinical profile in EAE rats from 0 to 70 dpi. Red squares indicate eyes with absent VEPs at 70 dpi. B. Kaplan–Meier curve representing EAE rats (n = 8) with clinical symptoms. C. Clinical score of EAE rats (n = 8) from 0 to 70 dpi. Data are expressed as mean ± SEM.
VEP latency in H and EAE rats
During each VEP recording session, we succeeded in obtaining a good signal‐to‐noise ratio, with N1 wave that was clearly distinguishable and measurable in terms of latency both in H and EAE groups (Figure 11A). VEP responses were absent in 4/16 EAE eyes at 70 dpi (25%) and were excluded from N1 latency analysis. A significant increase of N1 latency was found with respect to age‐matched H rats (Mann–Whitney test: U = 13.5, P = 0.035; Figure 11B).
Figure 11.
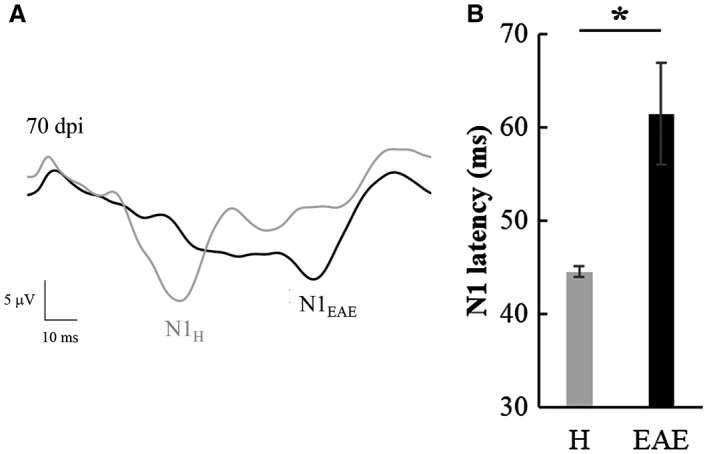
A. Representative VEP traces recorded from a H (grey line) and an EAE (black line) rat at 70 dpi. B. N1 latency of H (n = 6) and EAE (n = 12) eyes with recorded VEP measured at 70 dpi (*: P < 0.05). Data are expressed as mean ± SEM.
Histological analysis of ONs
At 70 dpi, rats were sacrificed and transversal sections of ONs from H and EAE rats were analyzed (Figure 12A). In EAE eyes with recorded VEPs (n = 12), we found a significant increase of demyelination (Mann–Whitney test: U = 0, P = 0.0007; Figure 12B), axonal loss (Welch t‐test: t16 = 29.521, P < 0.0001; Figure 12C) and Iba1+ cells (Welch t‐test: t 16 = 5.431, P = 0.0002; Figure 12D) compared to ONs of age‐matched H rats. EAE eyes with absent VEPs (n = 4) were excluded from statistical analysis of histological quantification because of their low sampling number, but their ONs presented high mean values of demyelination (between 64.8% and 98.8%), axonal loss (between 47.5% and 82.1%) and Iba1+ cells (between 1335 and 2024).
Figure 12.
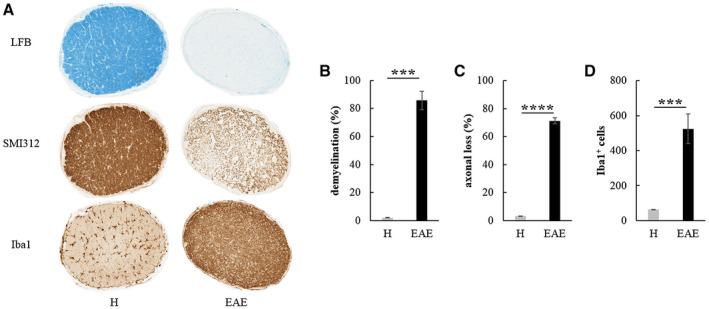
A. Transversal ON sections stained to detect demyelination (LFB), axonal loss (SMI312) and activated microglia/macrophages (Iba1) in H and EAE rats at 70 dpi (magnification: 10×). Quantification of demyelination (B), axonal loss (C) and Iba1+ cells (D) detected in ONs from H (n = 6) and EAE eyes (n = 12) with recorded VEPs at 70 dpi (***: P < 0.001; ****: P < 0.0001). Data are expressed as mean ± SEM.
Discussion
In this work, we describe the VEP hallmarks of the MOG‐EAE DA rat model, using a non‐invasive recording method developed in our laboratory, which avoids surgical procedures 22, 30. It is well demonstrated that VEP latency increase is a reliable marker of ON dysfunction both in demyelinating pathologies such as MS 28 and in its preclinical models 20. Together with the evaluation of visual function, we proceeded with the detection of motor symptoms to verify that the MOG‐EAE DA rat model resembled the typical course of relapsing–remitting MS. At the end of each experiment, we performed ON histology to validate the electrophysiological outcomes.
The induction of EAE in mice and rats through active immunization with MOG is one of the most common approaches to obtain a preclinical model of MS that mimics some features of the human disease, such as motor and behavioral impairments 3, sensory deficits 36 and VEP abnormalities 16. In the latter work, MOG EAE in the Brown Norway rat was associated with absent VEPs to pattern stimulation, suggesting that this method can be very sensitive to the involvement of the visual pathways, but not adequate for pre‐clinical testing of potential remyelinating agents, not allowing to measure delayed responses susceptible of improvement. In our experiments, we took advantage of non‐invasive VEPs to characterize MOG‐EAE optic neuritis in the DA rat. In particular, we used flash stimulation which is less prone to waveform disappearance, but sensitive enough to demonstrate latency delays associated with ON involvement. First, rats underwent a follow‐up study of three weeks after immunization in order to investigate the early phases of MOG‐EAE in the same subjects over time. Then we explored the time points beyond 21 dpi to investigate the functional and morphological changes involving ON at later stages of EAE. Finally, we analyzed the VEP outcome of a group of DA rats immunized with MOG, which developed an atypical clinical course.
In DA rats immunized with MOG, the severity of EAE was variable between our experiments. It is a matter of fact that the EAE model itself is characterized by a high variability in the disease course due to experimental and/or environmental conditions, strain susceptibility, sex, age and the type of adjuvant used for the immunization 6. In addition, the degree of colonization of the gut and the type of commensal flora can determine the susceptibility to EAE 44. Moreover, for VEP recording, we used sevoflurane anesthesia, which could ameliorate the motor disease of MOG‐EAE induced in C57BL/6 mice 27.
During the follow‐up study of three weeks (experiment 1), even if motor deficits were mild, ONs have been pathologically involved, confirming previous works in which optic neuritis is a common feature of MOG‐EAE 35, 38. Interestingly, a significant VEP delay appeared before the clinical onset of EAE (7 dpi), resembling what happens in some patients affected by MS, which could manifest visual impairments before the first motor deficits 23. The significant increase in VEP latency persisted until 21 dpi, when EAE rats manifested a constant remission of clinical symptoms. Histological analysis showed a significant increase of Iba1+ cells in EAE ONs, but no differences in the amount of myelin and neurofilaments with respect to H controls. Taken together, these results suggest that VEP delay could be associated with ON inflammation rather than demyelination or axonal loss during early stages of EAE. In support of this hypothesis, it is known that in DA rats immunized with MOG, the first acute phase of the disease is characterized by inflammation, with the presence of activated T cells and macrophages in neuronal compartments, whereas demyelination starts to appear during the second relapse phase 39. In experiment 1, we could assume that immunized rats were examined during the acute phase of EAE, in which inflammation of ONs played an important role in determining visual dysfunctions. However, we cannot exclude that VEP delay may result from demyelination occurring elsewhere in the visual pathways, ie outside the ONs. It has been reported that loss of myelin components could affect the ON together with the optic tract in C57BL/6 mice immunized with MOG 39. Moreover, EAE optic neuritis at early stages of the disease is associated with alterations in the nodal–paranodal compartment of the ON 37, which could explain VEP dysfunctions that we found in experiment 1. For these reasons, histological data of further brain regions, together with node‐paranode characterization, are needed to clarify ON dysfunction at first phases of EAE, where demyelination and axonal loss are not evident. For this purpose, we assessed the presence of Contactin‐associated protein (Caspr), a paranodal marker, in ON sections from experiment 1, in which Caspr appeared to be less expressed in EAE compared to H control (Figure S1). Overall, we can argue that VEP recording was suitable to monitor the optic neuritis during the acute phase of EAE, confirming itself as an early marker of visual dysfunctions.
After having assessed MOG‐EAE optic neuritis at early stages of the disease, the next step was to go beyond 21 dpi in order to investigate the functional and morphological changes involving the ON at later time points (experiment 2). For this purpose, we decided to perform a longitudinal study of four time points (21, 35, 42 and 56 dpi). Even in this case, EAE was associated with clearly abnormal VEPs, since a significant increase in N1 latency appeared at 21 and 56 dpi. While at 21 dpi, the VEP phenotype could be due to ON inflammation, as suggested by our previous experiment (experiment 1), at 56 dpi we noticed high levels of demyelination and axonal loss, together with an increase of Iba1+ cells. These detrimental factors could explain both the increase of VEP latency, confirmed by ON demyelination, and the absence of VEP response after flash stimuli, referable to ON fiber loss. In particular, absent VEPs were noticed in 16.7% of EAE eyes at 35 and 42 dpi, increasing to 41.7% at 56 dpi, suggesting a progressive degeneration of nerve fibers over time. These findings demonstrated that VEPs were reliable markers of demyelination and axonal loss, since in responsive EAE ONs demyelination, but not axonal loss was significantly higher than H controls, while in EAE ONs unable to elicit a VEP response, axonal loss was present as a key player of functional failure. Interestingly, a recovery of ON function was observed at 35 dpi, with VEP latency from MOG‐EAE rats that was not different from H age‐matched controls. However, we can only speculate that this spontaneous recovery could probably due to a decrease of inflammation, the latter being the most plausible pathological ON feature associated with VEP delay found at the early phases of MOG‐EAE. Coherently, several optic neuritis episodes could manifest both in MS patients 34 and in EAE models, such as the Lewis rat immunized with MOG 30. Histological analysis during the recovery of optic nerve function in relapsing–remitting EAE should better elucidate the neurobiological mechanism associated with the restoring of physiological optic nerve conduction.
In light of the present experiments, we could assert that during the later phases of MOG‐EAE induced in DA rats, ON dysfunction was still detectable by VEPs, and as the disease progressed, demyelination and axonal loss appeared exacerbating visual dysfunctions, together with a pre‐existent inflammatory condition that persisted over time.
In experiment 3, we investigated a group of eight DA rats immunized with MOG, which developed an atypical clinical course. In particular, the onset of motor deficits was very variable, ranging from 10 to 36 dpi, with one rat that did not show any EAE symptom. Moreover, the maximum mean score was low (0.9 ± 0.5), detected at late time points (43–46 dpi). However, we wanted to investigate visual function in these rats at tardive phases of the disease (70 dpi). VEP recording noticed a significant increase in N1 latency of EAE rats compared to H age‐matched controls, with 25% of EAE eyes that did not respond to flash stimuli. Even in this case, histological analysis suggested that this delay could be associated with a combination of inflammation, demyelination and axonal loss in EAE ONs, but the low sampling number of ONs that did not respond to flash stimuli (n = 4) did not allow us to consider them as a separate group in order to elucidate the histopathological features of delayed vs. absent VEPs. However, these results showed that, even if motor deficits in these EAE rats were mild, ON involvement at 10 weeks after immunization was severe and visual function compromised. It is clear from this last experiment that in DA rats, optic neuritis is independent from spinal damage caused by MOG immunization. However, visual function monitoring over time should identify the first cause of EAE optic neuritis and the principal players that led to the pathological phenotype observed at 70 dpi.
In view of all the experiments described, we can suggest that non‐invasive flash‐VEPs can be considered as useful and reliable biomarkers of visual pathway involvement in the MOG‐EAE DA rat model. Interestingly, in the DA rat immunized with MOG, VEP abnormalities anticipated the clinical onset, differing from the induction with homologous spinal cord homogenate (SCH), in which visual dysfunctions appeared before motor signs 5. This last observation should consider the MOG‐EAE DA rat model as the first choice to test novel treatments against MS optic neuritis, because it resembles both the relapsing–remitting clinical course and the early visual deficits often occurring in MS patients. In the light of our findings, anti‐inflammatory drugs against optic neuritis should be tested at early stages of MOG‐EAE, whereas remyelinating and neuroprotective agents should be given during the relapse phase. Moreover, our non‐invasive approach could be useful to perform long‐term preclinical studies, overtaking the issue of epidural electrode detachment. Therefore, the risks and benefits of novel treatments could be better evaluated at preclinical level, consequently ameliorating the clinical MS approach.
Conflict of Interest
None of the authors have any conflicts of interest to declare related to the present paper.
Supporting information
Figure S1. Coronal ON sections from a H and two EAE rats of experiment 1 stained with Caspr antibody (antiCaspr 1:500; Abcam ab34151; magnification: 10×).
Acknowledgments
Study supported by Merck KGaA (Darmstadt ‐ Germany), by Regione Lombardia (POR FESR 2014–2020) within the framework of the NeOn project (ID 239047) and by the Italian Ministry of Education, University and Research through the IVASCOMAR project (CTN01_00177_165430, Cluster Tecnologico Nazionale Scienze della Vita “Alisei”). The authors wish to thank Eng. Marco Cursi for help in figure editing.
Data Availability Statement
The data that support the findings of this study are available from the corresponding author upon reasonable request.
References
- 1. Balatoni B, Storch MK, Swoboda EM, Schönborn V, Koziel A, Lambrou GN et al (2007) FTY720 sustains and restores neuronal function in the DA rat model of MOG‐induced experimental autoimmune encephalomyelitis. Brain Res Bull 74:307–316. [DOI] [PubMed] [Google Scholar]
- 2. Bolay H, Gürsoy‐Ozdemir Y, Unal I, Dalkara T (2000) Altered mechanisms of motor‐evoked potential generation after transient focal cerebral ischemia in the rat: implications for transcranial magnetic stimulation. Brain Res 873:26–33. [DOI] [PubMed] [Google Scholar]
- 3. Buddeberg BS, Kerschensteiner M, Merkler D, Stadelmann C, Schwab ME (2004) Behavioral testing strategies in a localized animal model of multiple sclerosis. J Neuroimmunol 153:158–170. [DOI] [PubMed] [Google Scholar]
- 4. Cambiaghi M, Teneud L, Velikova S, Gonzalez‐Rosa JJ, Cursi M, Comi G, Leocani L (2011) Flash visual evoked potentials in mice can be modulated by transcranial direct current stimulation. Neuroscience 185:161–165. [DOI] [PubMed] [Google Scholar]
- 5. Castoldi V, Marenna S, Santangelo R, d'Isa R, Cursi M, Chaabane L et al (2018) Optic nerve involvement in experimental autoimmune encephalomyelitis to homologous spinal cord homogenate immunization in the dark agouti rat. J Neuroimmunol 325:1–9. [DOI] [PubMed] [Google Scholar]
- 6. Constantinescu CS, Farooqi N, O'Brien K, Gran B (2011) Experimental autoimmune encephalomyelitis (EAE) as a model for multiple sclerosis (MS). Br J Pharmacol 164:1079–1106. [DOI] [PMC free article] [PubMed] [Google Scholar]
- 7. Day MJ (2005) Histopathology of EAE. In: Experimental Models of Multiple Sclerosis, Lavi E, Constantinescu CS (eds), pp. 25–43. Springer, US: Boston, MA. [Google Scholar]
- 8. Deguchi K, Takeuchi H, Miki H, Yamada A, Touge T, Terada S, Nishioka M (1992) Electrophysiological follow‐up of acute and chronic experimental allergic encephalomyelitis in the Lewis rat. Eur Arch Psychiatry Clin Neurosci 242:1–5. [DOI] [PubMed] [Google Scholar]
- 9. Diem R, Hobom M, Maier K, Weissert R, Storch MK, Meyer R, Bähr M (2003) Methylprednisolone increases neuronal apoptosis during autoimmune CNS inflammation by inhibition of an endogenous neuroprotective pathway. J Neurosci 23:6993–7000. [DOI] [PMC free article] [PubMed] [Google Scholar]
- 10. Duckers HJ, van Dokkum RP, Verhaagen J, van Luijtelaar EL, Coenen AM, Lopes da Silva FH, Gispen WH (1998) Neurotrophic ACTH4‐9 analogue therapy normalizes electroencephalographic alterations in chronic experimental allergic encephalomyelitis. Eur J Neurosci 10:3709–3720. [DOI] [PubMed] [Google Scholar]
- 11. Gambi D, Fulgente T, Melchionda D, Onofrj M (1996) Evoked potential (EP) alterations in experimental allergic encephalomyelitis (EAE): early delays and latency reductions without plaques. Ital J Neurol Sci 17:23–33. [DOI] [PubMed] [Google Scholar]
- 12. Gambi D, Onofrj M, Di Trapani G (1987) Experimental allergic encephalomyelitis, a model of demyelination in central nervous system (CNS). Riv Neurol 57:27–32. [PubMed] [Google Scholar]
- 13. Gordon JA, Stryker MP (1996) Experience‐dependent plasticity of binocular responses in the primary visual cortex of the mouse. J Neurosci 16:3274–3286. [DOI] [PMC free article] [PubMed] [Google Scholar]
- 14. Graham SL, Klistorner A (2017) Afferent visual pathways in multiple sclerosis: a review. Clin Exp Ophthalmol 45:62–72. [DOI] [PubMed] [Google Scholar]
- 15. Hayreh SS, Massanari RM, Yamada T, Hayreh SM (1981) Experimental allergic encephalomyelitis. I. Optic nerve and central nervous system manifestations. Invest Ophthalmol Vis Sci 21:256–269. [PubMed] [Google Scholar]
- 16. Hobom M, Storch MK, Weissert R, Maier K, Radhakrishnan A, Kramer B et al (2004) Mechanisms and time course of neuronal degeneration in experimental autoimmune encephalomyelitis. Brain Pathol 14:148–157. [DOI] [PMC free article] [PubMed] [Google Scholar]
- 17. Kale N (2016) Optic neuritis as an early sign of multiple sclerosis. Eye Brain 8:195–202. [DOI] [PMC free article] [PubMed] [Google Scholar]
- 18. Klistorner A, Arvind H, Nguyen T, Garrick R, Paine M, Graham S et al (2008) Axonal loss and myelin in early ON loss in postacute optic neuritis. Ann Neurol 64:325–331. [DOI] [PubMed] [Google Scholar]
- 19. Lassmann H, Bradl M (2017) Multiple sclerosis: experimental models and reality. Acta Neuropathol 133:223–244. [DOI] [PMC free article] [PubMed] [Google Scholar]
- 20. Lidster K, Jackson SJ, Ahmed Z, Munro P, Coffey P, Giovannoni G et al (2013) Neuroprotection in a novel mouse model of multiple sclerosis. PLoS One 8:e79188. [DOI] [PMC free article] [PubMed] [Google Scholar]
- 21. Lorentzen JC, Issazadeh S, Storch M, Mustafa MI, Lassman H, Linington C et al (1995) Protracted, relapsing and demyelinating experimental autoimmune encephalomyelitis in DA rats immunized with syngeneic spinal cord and incomplete Freund's adjuvant. J Neuroimmunol 63:193–205. [DOI] [PubMed] [Google Scholar]
- 22. Marenna S, Castoldi V, d'Isa R, Cursi M, Comi G, Leocani L (2019) Semi‐invasive and non‐invasive recording of visual evoked potentials in mice. Doc Ophthalmol 138:169–179. [DOI] [PubMed] [Google Scholar]
- 23. McDonald WI, Barnes D (1992) The ocular manifestations of multiple sclerosis. 1. Abnormalities of the afferent visual system. J Neurol Neurosurg Psychiatry 55:747–752. [DOI] [PMC free article] [PubMed] [Google Scholar]
- 24. Onofrj M, Harnois C, Bodis‐Wollner I (1985) The hemispheric distribution of the transient rat VEP: a comparison of flash and pattern stimulation. Exp Brain Res 59:427–433. [DOI] [PubMed] [Google Scholar]
- 25. Paxinos G, Watson C (2014) The Rat Brain in Stereotaxic Coordinates, 7th edn. Elsevier, Academic Press: Amsterdam. [Google Scholar]
- 26. Pihl‐Jensen G, Schmidt MF, Frederiksen JL (2017) Multifocal visual evoked potentials in optic neuritis and multiple sclerosis: a review. Clin Neurophysiol 128:1234–1245. [DOI] [PubMed] [Google Scholar]
- 27. Polak PE, Dull RO, Kalinin S, Sharp AJ, Ripper R, Weinberg G et al (2012) Sevoflurane reduces clinical disease in a mouse model of multiple sclerosis. J Neuroinflammation 9:272. [DOI] [PMC free article] [PubMed] [Google Scholar]
- 28. Richey ET, Kooi KA, Tourtellotte WW (1971) Visually evoked responses in multiple sclerosis. J Neurol Neurosurg Psychiatry 34:275–280. [DOI] [PMC free article] [PubMed] [Google Scholar]
- 29. Robinson AP, Harp CT, Noronha A, Miller SD (2014) The experimental autoimmune encephalomyelitis (EAE) model of MS: utility for understanding disease pathophysiology and treatment. Handb Clin Neurol 122:173–189. [DOI] [PMC free article] [PubMed] [Google Scholar]
- 30. Sakuma H, Kohyama K, Park IK, Miyakoshi A, Tanuma N, Matsumoto Y (2004) Clinicopathological study of a myelin oligodendrocyte glycoprotein‐induced demyelinating disease in LEW.1AV1 rats. Brain 127(Pt 10):2201–2213. [DOI] [PubMed] [Google Scholar]
- 31. Santangelo R, Castoldi V, D'Isa R, Marenna S, Huang SC, Cursi M et al (2018) Visual evoked potentials can be reliably recorded using noninvasive epidermal electrodes in the anesthetized rat. Doc Ophthalmol 136:165–175. [DOI] [PubMed] [Google Scholar]
- 32. Sartucci F, Scardigli V, Murri L (1989) Visual evoked potentials and magnetic resonance imaging in the evaluation of pre‐ and retrochiasmatic lesions in multiple sclerosis. Clin Vision Sci 4:229–238. [Google Scholar]
- 33. Sato H, Adachi‐Usami E (2003) Accelerated aging of senescence accelerated mice R‐1 demonstrated by flash visually evoked cortical potentials. Exp Gerontol 38:279–283. [DOI] [PubMed] [Google Scholar]
- 34. Shams PN, Plant GT (2009) Optic neuritis: a review. Int MS J 16:82–89. [PubMed] [Google Scholar]
- 35. Shao H, Huang Z, Sun SL, Kaplan HJ, Sun D (2004) Myelin/oligodendrocyte glycoprotein‐specific T‐cells induce severe optic neuritis in the C57BL/6 mouse. Invest Ophthalmol Vis Sci 45:4060–4065. [DOI] [PubMed] [Google Scholar]
- 36. Sloane E, Ledeboer A, Seibert W, Coats B, van Strien M, Maier SF et al (2009) Anti‐inflammatory cytokine gene therapy decreases sensory and motor dysfunction in experimental Multiple Sclerosis: MOG‐EAE behavioral and anatomical symptom treatment with cytokine gene therapy. Brain Behav Immun 23:92–100. [DOI] [PMC free article] [PubMed] [Google Scholar]
- 37. Sørensen TL, Frederiksen JL, Brønnum‐Hansen H, Petersen HC (1999) Optic neuritis as onset manifestation of multiple sclerosis: a nationwide, long‐term survey. Neurology 53:473–478. [DOI] [PubMed] [Google Scholar]
- 38. Stojic A, Bojcevski J, Williams SK, Diem R, Fairless R (2018) Early nodal and paranodal disruption in autoimmune optic neuritis. J Neuropathol Exp Neurol 77:361–373. [DOI] [PubMed] [Google Scholar]
- 39. Storch MK, Stefferl A, Brehm U, Weissert R, Wallström E, Kerschensteiner M et al (1998) Autoimmunity to myelin oligodendrocyte glycoprotein in rats mimics the spectrum of multiple sclerosis pathology. Brain Pathol 8:681–694. [DOI] [PMC free article] [PubMed] [Google Scholar]
- 40. Sun SW, Liang HF, Schmidt RE, Cross AH, Song SK (2007) Selective vulnerability of cerebral white matter in a murine model of multiple sclerosis detected using diffusion tensor imaging. Neurobiol Dis 28:30–38. [DOI] [PMC free article] [PubMed] [Google Scholar]
- 41. Tanuma N, Shin T, Matsumoto Y (2000) Characterization of acute versus chronic relapsing autoimmune encephalomyelitis in DA rats. J Neuroimmunol 108:171–180. [DOI] [PubMed] [Google Scholar]
- 42. Toosy AT, Mason DF, Miller DH (2014) Optic neuritis. Lancet Neurol 13:83–99. [DOI] [PubMed] [Google Scholar]
- 43. Weissert R, Wallström E, Storch MK, Stefferl A, Lorentzen J, Lassmann H et al (1998) MHC haplotype‐dependent regulation of MOG‐induced EAE in rats. J Clin Invest 102:1265–1273. [DOI] [PMC free article] [PubMed] [Google Scholar]
- 44. Yokote H, Miyake S, Croxford JL, Oki S, Mizusawa H, Yamamura T (2008) NKT cell‐dependent amelioration of a mouse model of multiple sclerosis by altering gut flora. Am J Pathol 173:1714–1723. [DOI] [PMC free article] [PubMed] [Google Scholar]
- 45. You Y, Klistorner A, Thie J, Graham SL (2011) Latency delay of visual evoked potential is a real measurement of demyelination in a rat model of optic neuritis. Invest Ophthalmol Vis Sci 52:6911–6918. [DOI] [PubMed] [Google Scholar]
Associated Data
This section collects any data citations, data availability statements, or supplementary materials included in this article.
Supplementary Materials
Figure S1. Coronal ON sections from a H and two EAE rats of experiment 1 stained with Caspr antibody (antiCaspr 1:500; Abcam ab34151; magnification: 10×).
Data Availability Statement
The data that support the findings of this study are available from the corresponding author upon reasonable request.


