Anemia is the most frequent hematologic disorder worldwide. It was biologically defined many years ago by the World Health Organization (WHO) as a decrease in circulating hemoglobin concentration [Hb] to <120 g/L in women and <130 g/L in men.1 In severe anemia (i.e., anemia causing symptoms or when [Hb] <70-80 g/L), curative treatments (e.g., iron, folates, vitamin B12 supplementation or erythropoiesis stimulating agents [ESA]) or transfusions are typically used. Approximately 85 million red blood cell (RBC) units are transfused per year worldwide.2
In a recent study, Otto et al.3 reported that in approximately half the cases anemia can be explained as a result of hemodilution (increased plasma volume [PV]) rather than by a reduction in red cell mass (RCM), especially in chronic heart and liver diseases. These results, obtained by using total hemoglobin mass measurement with carbon monoxide rebreathing method and PV indirect calculation, suggest that treatment of anemias could be overprescribed for hemodiluted patients.
In order to determine whether anemia-related treatment could be over-prescribed for “anemic” patients in our institution, we retrospectively analyzed RCM and PV from normal, anemic and polycythemic patients using direct measurements of red cell and plasma volumes (Cr51-labeled RBC and I125-labeled albumin). Briefly, 2,858 RCM and PV performed concomitantly in our department between 2010 and 2017 (mostly for suspected myeloproliferative diseases) were retrospectively analyzed in addition to [Hb] and hematocrit (Hct) determination. These measurements were performed in different situations: i) looking for real RCM decrease in case of low [Hb] in presence of possible cause of hemodilution or in absence of other obvious causes of [Hb] decrease; ii) looking for “masked” RCM increase in presence of known myeloproliferative neoplasm in case of low or normal [Hb]; or iii) confirming polycythemia in case of elevated [Hb]. We then selected a group of “anemic” patients with low [Hb] (<120 g/L in women and <130 g/L in men) and classified them according to the severity of the anemia (WHO classification of anemia4): mild anemia (110-119 g/L for women and 110-129 g/L for men, n=27), moderate anemia (80-109 g/L, n=27) and severe anemia (< 80 g/L, n=9). We also selected a control group (n=97) defined as follow: [Hb] 120-160 g/L in women and 130-165 g/L in men, Hct ≤48% in women and ≤49% in men, mean corpuscular volume 80-100 fL, RCM ≤******+25% of normal value, absence of JAK2V617F mutation, no splenomegaly, white blood cell (WBC) count 4-10x109/L and platelet count 150-450x109/L, and a group of “polycythemic” patients with increased [Hb] (>160 g/L in women and >165 g/L in men) (n=1,815). Patients' characteristics are summarized in Table 1 and a flow chart of the study is shown in Online Supplementary Figure S1.
PV categories had previously been defined according to Otto et al.3: plasmatic contraction if PV < -8% of the expected theoretical value, normal if ≥ -8% and ≤ +8%, moderate expansion if > +8% and ≤ +25%, and severe expansion if > +25%. RCM was considered as normal when varying between -25% and +25% of the theoretical value, increased (polycythemia) when RCM > +25% of the theoretical normal RCM, and reduced when RCM < -25% of the theoretical normal RCM according to Pearson et al.5
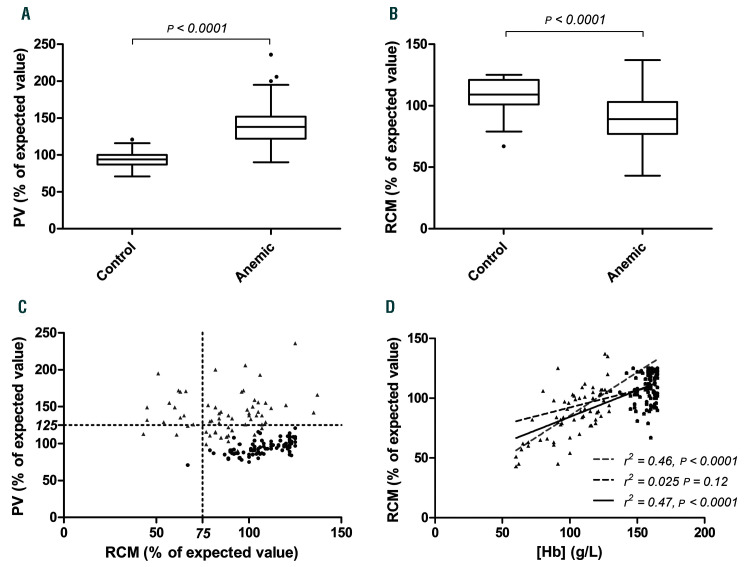
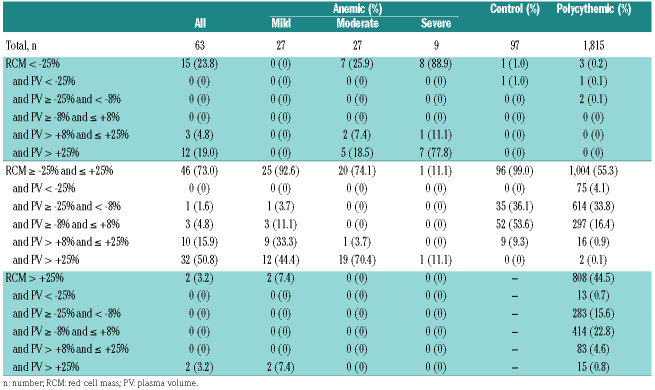
We first focused on anemic and control subjects. Anemic patients had a significantly higher PV than the control group (mean PV +41% vs. -5%; P<0.0001) (Figure 1A), 94% of them had PV > +8% (vs. 9% in the control group) and 73% PV > +25% (vs. 0% in the control group) (Table 2), confirming with direct measurement previous findings from Otto et al.3 about the high frequency of hemodilution in anemic patients. There was also a statistical difference in RCM between the control group and the anemic group (mean RCM -12.7% vs. +8.8% for anemic and control groups, respectively; P<0.0001) (Figure 1B). Only 24% (n=15) of anemic patients had RCM < -25% of the expected theoretical value (Table 2 and Figure 1C), confirming that, in our cohort, a decrease in [Hb] may be due more often to an increase in PV rather than related to a decrease in RCM in clinical practice. Among anemic patients, no patient with mild anemia had RCM < -25%, while patients with moderate anemia presented a 25.9% risk of RCM < -25% and those with severe anemia a risk of 88.9% (Table 2), suggesting that even in severe anemic patients, patients may have hemodilution rather than an important reduction in the RCM. Moreover, 77.8% (n=7) of the severe anemic patients with RCM < -25% also have increased PV > +25%. This suggests that, in the vast majority of cases, severe anemia is related to both reduced RCM and increased PV.
We then focused on the correlations between [Hb], PV and RCM. Studying the whole cohort according to the [Hb] revealed a direct correlation between [Hb] level and PV (P=0.0006). This was also observed when focusing on anemic (P<0.0001) and control patients (P=0.0006) (data not shown). A direct correlation between [Hb] and RCM was found in the whole cohort: the lower the [Hb] level, the lower the RCM (P<0.0001). This correlation between RCM and [Hb] level was found in anemic patients (P<0.0001) but, interestingly, not in control patients (P=0.12) (Figure 1D).
Table 1.
Characteristics of anemic patients, control subjects, and of patients with increased hemoglobin concentration.
Figure 1.
Plasma volume (PV), red cell mass (RCM) and hemoglobin concentration [Hb] in control subjects and anemic patients. Box-and-Whisker plot of (A) PV and (B) RCM (in % of expected theoretical value) in control and anemic patients. (C) Correlations of PV and RCM in control and anemic patients. (D) Correlations of RCM and [Hb] (g/L) in control and anemic patients. Black points and discontinued line represent control patients, gray triangles and discontinued line represent anemic patients, black continuous line represents both anemic and control patients.
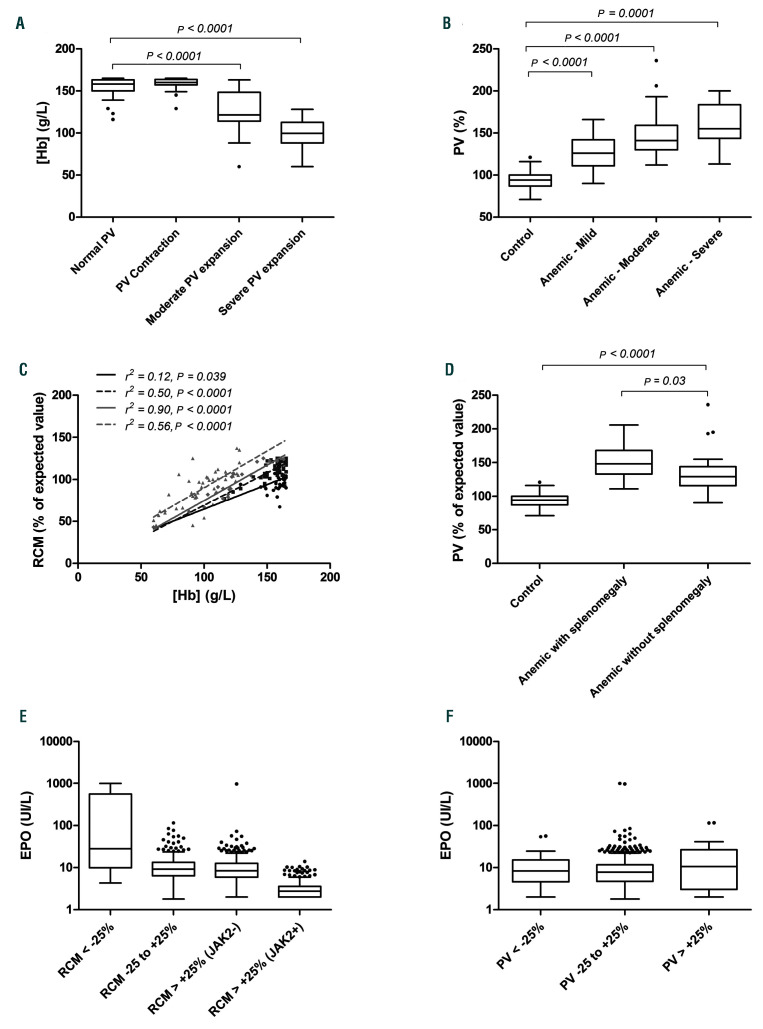
We then analyzed in more detail the levels of [Hb] according to PV measurements. We observed higher mean [Hb] in patients with normal PV (156 g/L) compared to moderately expanded (126 g/L; P<0.0001) or severely expanded (99 g/L; P<0.0001) PV (Figure 2A). Conversely, mean PV was lower for the control group (-5%) than in mild “anemia” (+26%; P<0.0001), moderate “anemia” (+49%; P<0.0001) or severe “anemia” (+60%; P=0.0001) groups (Figure 2B). In contrast to the results of Otto et al.3, in which correlation between [Hb] and total hemoglobin mass (measured with respiratory test) weakened as PV rose, we found a positive correlation between [Hb] and RCM whatever the PV status (normal, moderately or severely expanded), and this did not weaken as PV increased (Figure 2C). In order to define whether these correlations were only found for anemic and normal subjects, we also analyzed the correlation for patients with increased [Hb]. For those patients, correlations between [Hb] and PV or RCM were also significant (P<0.0001 in both cases) (data not shown).
Lastly, since spleen enlargement is considered to be the main cause of an increase in PV in hematologic disorders, we compared anemic patients with or without spleen enlargement and normal subjects. Twenty-nine out of 63 (46%) anemic patients presented splenomegaly and these had a significantly higher PV than anemic patients without spleen enlargement (+49%vs. +34%; P=0.03) (Figure 2D). Surprisingly, comparison between anemic patients without spleen enlargement and control patients also revealed a significantly higher PV in the anemic group (+34% vs. -5%; P<0.0001), suggesting that anemia due to hemodilution is not only associated to spleen enlargement and that there could be other causes of hemodilution in these patients.
We decided to verify whether the causes of anemia (heart disease, renal failure, hypergammaglobulinemia, portal thrombosis, primary myelofibrosis, other myeloproliferative neoplasms) could be associated with differences in PV, RCM or [Hb] in anemic patients. However, we failed to find any difference according to disease; this was probably due to the low number of patients in each group (data not shown).
Here we retrospectively analyzed RCM measurements in a single center cohort of patients with a focus on anemic patients. RCM and PV determinations are rarely performed in these patients. We assume a study bias in this patient cohort as clinicians asking for RCM measurement probably hypothesize that their patients would present a hemodilution rather than a true anemia. Measurement of RCM was performed here using standard recommendations (Cr51-labeled RBC) and direct PV was measured using the dilution method based on I125-labeled albumin. Then, using a different technical approach, and despite the probable bias in patient selection that may have artificially increased the hemodilution rate compared to unselected anemic patients of other clinical centers, we confirmed the results from Otto et al.3 showing the high proportion of anemic patients who, in fact, present a hemodilution rather than a reduction in RCM. However, and for clinical purposes, our study demonstrates that when a patient presents severe anemia (i.e., [Hb] <80 g/L), RCM is decreased in around 90%, thus justifying therapeutic intervention (such as transfusion or ESA) whatever the cause of the anemia. However, therapeutic interventions for patients with mild or moderate anemia have to be discussed since we noticed that over half the patients were hemodiluted and did not have a decrease in RCM. In order to distinguish hemodiluted from “real anemic” patients in the moderate and mild groups of patients, we analyzed erythropoietin (EPO) level measured in the different cohorts. Our data, as previously reported,6 demonstrated that only truly anemic patients presented increased circulating EPO concentrations. However, the overlap in EPO concentrations among the different groups suggested that as a marker this was not sufficiently discriminative (Figure 2E and F).
Figure 2.
Correlations between hemoglobin concentration [Hb], plasma volume (PV), red cell mass (RCM), splenomegaly, and erythropoietin (EPO) concentrations. (A) [Hb] (g/L) according to PV groups of patients. (B) PV (in % of expected theoretical value) in the anemic groups of patients (World Health Organization definition). (C) Correlations of RCM (in % of expected theoretical value) and [Hb] in different PV groups: black points and continuous line represents a group of PV contraction patients, dark gray squares and discontinued line represent a group of normal PV patients, light gray diamonds and continuous line represent a group of moderate PV expansion patients, light gray triangles and discontinued line represent a group of severe PV expansion patients. (D) PV in anemic patients according to spleen enlargement. (E) EPO concentrations according to RCM groups or (F) PV groups (in % of expected theoretical value).
Table 2.
Red cell mass and plasma volume in anemic patients, control subjects, and patients with increased hemoglobin concentration.
RCM and PV measurement are currently performed for polycythemic patients since the correlation between [Hb] or [Hct] and RCM is relatively low in these patients. We previously reported that, even in JAK2V617F mutated myeloproliferative neoplasm patients, the RCM was consistently increased over +25% only for patients presenting Hct >55%.7
Here we demonstrate that [Hb] is a good surrogate marker of decreased RCM for severe anemic patients but not for moderate or mild anemic patients. Therefore, for this last category of patients, measurement of RCM and PV to clearly differentiate RCM decrease and hemodilution could only be useful before therapeutic intervention. Based on these results, a prospective study in anemic patients may confirm these findings and thus help in treatment decisions.
Supplementary Material
Acknowledgments
The authors particularly thank Veronique Lenoble, Veronique Tran and Armelle Yollant for their technical assistance and commitment during this work. They also thank the local tumor biobank of Saint Louis Hospital for providing high quality samples.
Funding Statement
Funding: this work was also supported by a grant from the National Institute of Cancer (INCa, TRANSLA CTIM3).
References
- 1.Nutritional anaemias. Report of a WHO scientific group. World Health Organ Tech Rep Ser. 1968;405:5-37. [PubMed] [Google Scholar]
- 2.Takei T, Amin NA, Schmid G, Dhingra-Kumar N, Rugg D. Progress in global blood safety for HIV. J Acquir Immune Defic Syndr. 2009; 52 Suppl 2:S127-S131. [DOI] [PubMed] [Google Scholar]
- 3.Otto JM, Plumb JOM, Clissold E, et al. Hemoglobin concentration, total hemoglobin mass and plasma volume in patients: implications for anemia. Haematologica. 2017;102(9):1477-1485. [DOI] [PMC free article] [PubMed] [Google Scholar]
- 4.WHO. Haemoglobin concentrations for the diagnosis of anaemia and assessment of severity. WHO. Available from: http://www.who.int/vmnis/indicators/haemoglobin/en/ [Google Scholar]
- 5.Pearson TC, Guthrie DL, Simpson J, et al. Interpretation of measured red cell mass and plasma volume in adults: Expert Panel on Radionuclides of the International Council for Standardization in Haematology. Br J Haematol. 1995;89(4):748-756. [DOI] [PubMed] [Google Scholar]
- 6.Beguin Y, Clemons GK, Pootrakul P, Fillet G. Quantitative assessment of erythropoiesis and functional classification of anemia based on measurements of serum transferrin receptor and erythropoietin. Blood. 1993;81(4):1067-1076. [PubMed] [Google Scholar]
- 7.Maslah N, Soret J, Dosquet C, et al. Masked polycythemia vera: analysis of a single center cohort of 2480 red cell masses. Haematologica. 2020;105(3):e95-e97. [DOI] [PMC free article] [PubMed] [Google Scholar]
Associated Data
This section collects any data citations, data availability statements, or supplementary materials included in this article.


