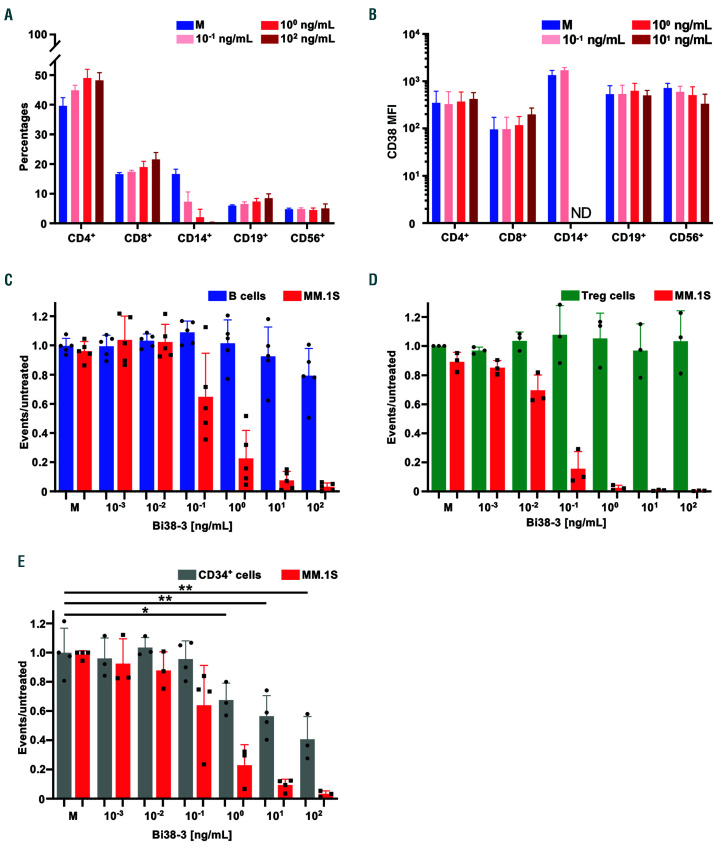
Figure 2.
Sensitivity of blood cells and bone marrow hematopoietic progenitors to Bi38-3. (A) Peripheral blood mononuclear cells (PBMC) from healthy donors (n=3) were cultured with medium (M) or various concentrations of Bi38-3 for 24 h and the percentages of live T, myeloid, B and NK cells were determined by fluorescence-activated cell sorting (FACS) analysis. Histograms show the average percentages of live CD4+ T cells, CD8+ T cells, CD14+ monocytes, CD19+ B cells and CD56+ NK cells in Bi38-3 cultures compared to untreated controls from three independent donors. The error bars indicate the standard deviation (SD). (B) Mean fluorescence intensity (MFI) was measured in MM.1S wild-type (WT) cells and in subsets of cells expressing CD4, CD8, CD14, CD19 and CD56, based on FACS analysis of CD38 expression levels in PBMC cell populations cultured with various concentrations of Bi38-3 as in (A). Histograms show average CD38 MFI of MM.1S cells and PBMC populations and error bars indicate the SD. ND: not determined because there were too few events. (C) Relative Bi38-3-mediated Tcell lysis of B versus MM.1S cells. Purified paired B and T cells from healthy donors (n=5) were co-cultured with increasing concentrations of Bi38-3 for 24 h in the presence of MM.1S cells. (D) Relative Bi38-3-mediated T-cell lysis of regulatory T cells (Treg) versus MM.1S cells. Purified T cells from healthy donors (n=3) were co-cultured with increasing concentrations of Bi38-3 for 24 h in the presence of MM.1S cells. (E) Relative Bi38-3-mediated T-cell lysis of CD34+ bone marrow hematopoietic progenitors versus MM.1S cells. Paired CD34+ hematopoietic progenitors and T cells purified from the bone marrow of healthy donors (taken during hip surgery) (n=4) were co-cultured with increasing concentrations of Bi38-3 for 24 h in the presence of MM.1S cells. In (C-E), the numbers of live CD20+ (B cells), FoxP3+ (Treg cells), CD34+(hematopoietic progenitors) and CD138+ (MM.1S cells) were calculated by FACS using counting beads and expressed as a ratio to untreated controls. Histograms show the ratios of B, Treg, CD34+ hematopoietic progenitor and MM.1S cells for each Bi38-3 concentrations and error bars indicate the SD. The normality of the CD34+ populations was established with a Shapiro-Wilk normality test and P-values were determined by an unpaired Student t test (*P<0.05; **P<0.01; ***P<0.001).

