

Abstract
In the 2016, WHO classification of tumors of the central nervous system, isocitrate dehydrogenase (IDH) mutation is a main classifier for lower grade astrocytomas and IDH‐mutated astrocytomas is now regarded as a single group with longer survival. However, the molecular and clinical heterogeneity among IDH mutant lower grade (WHO Grades II/III) astrocytomas have only rarely been investigated. In this study, we recruited 160 IDH mutant lower grade (WHO Grades II/III) astrocytomas, and examined PDGFRA amplification, CDKN2A deletion and CDK4 amplification by FISH analysis, TERT promoter mutation by Sanger sequencing and ATRX loss and p53 expression by immunohistochemistry. We identified PDGFRA amplification, CDKN2A homozygous deletion and CDK4 amplification in 18.8%, 15.0% and 18.1% of our cohort respectively, and these alterations occurred in a mutually exclusive fashion. PDGFRA amplification was associated with shorter PFS (P = 0.0003) and OS (P < 0.0001). In tumors without PDGFRA amplification, CDKN2A homozygous deletion or CDK4 amplification was associated with a shorter OS (P = 0.035). Tumors were divided into three risk groups based on the presence of molecular alterations: high risk (PDGFRA amplification), intermediate risk (CDKN2A deletion or CDK4 amplification) and low risk (neither CDKN2A deletion and CDK4 amplification nor PDGFRA amplification). These three risk groups were significantly different in overall survival with mean survivals of 40.5, 62.9 and 71.5 months. The high‐risk group also demonstrated a shorter PFS compared to intermediate‐ (P = 0.036) and low‐risk (P < 0.0001) groups. One limitation of this study is the relatively short follow‐up period, a common confounding factor for studies on low‐grade tumors. Our data illustrate that IDH mutant lower grade astrocytomas is not a homogeneous group and should be molecularly stratified for risk.
Keywords: CDKN2A deletion, CDK4 amplification, IDH mutant astrocytomas, PDGFRA amplification
Introduction
The 2016 WHO classification of tumors of the central nervous system has for the first time incorporated molecular features in the classification of diffuse gliomas 18. Astrocytomas are classified as isocitrate dehydrogenase (IDH) mutant or IDH wild type based on IDH genotype and they lack 1p19q codeletion. Approximately 70%–80% of WHO Grades II and III astrocytomas possess IDH mutations and the rest are IDH wild type 28. Diffuse astrocytomas with IDH mutations are regarded as the better prognostic group by the WHO classification based on available literature 1, 3, 21, 38. Determination of the IDH status has become a standard practice in the diagnosis of lower grade astrocytomas.
However, recent studies have shown that just the IDH status alone is inadequate for stratification of risk for gliomas. For instance, IDH wild type lower grade gliomas is not a single group with uniform dismal prognosis as originally thought and the poor prognostic groups among IDH wild type diffuse astrocytomas were found to be those carrying TERT promoter mutations, EGFR amplification and concomitant gain of chromosome 7 and loss of chromosome 10 (+7/−10) 1, 3, 36. However, such molecular and clinical diversity have not been extensively examined in IDH mutant astrocytomas and whether IDH mutant lower grade (WHO Grades II/III) astrocytomas is a group with uniformly longer survival has not been vigorously evaluated.
There have been a few papers in which IDH mutant astrocytomas have been included as one of the cohorts of the studies 2, 4, 5, 24, 28. However, molecular heterogeneity within the group was not demonstrated in majority of the reports. And in Reuss et al cohort, histological grade lost its significance within the IDH mutant astrocytomas 25.
Reis et al was the first group to show that CDKN2A deletion was associated with a shorter overall survival in Grade II and Grade III astrocytomas 24. They demonstrated that CDKN2A loss in IDH/TP53 mutated tumors was strongly associated with worse overall survival. Shirahata et al examined methylation profiles of 211 IDH mutant astrocytic tumors and identified CDKN2A deletion as a molecular biomarker to stratify astrocytic tumors 28. They showed that none of the Grade II astrocytomas had CDKN2A deletion. Grade III astrocytic gliomas harboring CDKN2A deletion had a poorer survival compared to Grade IV glioblastomas without the deletion 28. Aoki et al investigated the genetic alterations in diffuse low‐grade gliomas, and they found that PIK3R1 mutations and altered RB pathway genes (RB1, CDKN2A and CDK4) were independent predictors of poor survival in 109 IDH mutant astrocytomas 2.
Based on these studies, we speculated that not all IDH mutant lower grade (WHO Grades II/III) astrocytomas behave uniformly well and can be stratified for risk using molecular markers. In this study, we recruited a large series of 160 IDH mutant lower grade (WHO Grades II/III) astrocytomas, and studied them for PDGFRA amplification, CDKN2A homozygous deletion and CDK4 amplification by FISH analysis, TERT promoter mutation by Sanger sequencing and ATRX loss and p53 expression by immunohistochemistry. Our data illustrate that IDH mutant lower grade (WHO Grades II/III) astrocytomas is not a homogeneous group, some do not have longer survival and as a group, should be molecularly stratified for risk.
Materials and Methods
Patients and tissue samples
A total of 160 consecutive and unselected IDH mutant lower grade (WHO Grades II/III) astrocytomas were collected between years 2010 and 2018, and they were diagnosed at the Prince of Wales Hospital, Hong Kong, Hua Shan Hospital, Shanghai and the First Affiliated Hospital of Zhengzhou University, Zhengzhou. All patients were aged 16 or above at the time of diagnosis. Histological review for a diagnosis of astrocytomas was performed by two pathologists (HKN and HC). Histological features were unequivocally astrocytic and grading was based on WHO 2016 and Grade III astrocytomas were diagnosed based on mitosis, hypercellularity and nuclear atypia, as per our previous publication 1. The clinicopathological features of the cohort are summarized in Table 1.
Table 1.
Clinical and molecular characteristics.
| All tumors (n = 160) | TERT promoter | ATRX expression | P53 expression | PDGFRA amplification | CDKN2A deletion | CDK4 amplification | |||||||
|---|---|---|---|---|---|---|---|---|---|---|---|---|---|
| wt (n = 131) | mut (n = 26) | Positive (n = 39) | Negative (n = 109) | Negative (n = 78) | Positive (n = 78) | Negative (n = 130) | Positive (n = 30) | Negative (n = 136) | Positive (n = 24) | negative (n = 131) | Positive (n = 29) | ||
| Age (mean/median) | 40.5/40.0 | 40.1/39.0 | 42.8/45.0 | 39.0/38.0 | 40.5/40.0 | 40.5/39.5 | 40.9/41.0 | 39.5/39.0 | 44.8/44.5 | 40.6/40.5 | 39.9/39.0 | 41.2/41.0 | 37.6/39.0 |
| Gender | |||||||||||||
| Male | 86 (53.8%) | 66 (78.6%) | 18 (21.4%) | 24 (30.8%) | 54 (69.2%) | 40 (48.2%) | 43 (51.8%) | 70 (81.4%) | 16 (18.6%) | 73 (84.9%) | 13 (15.1%) | 70 (81.4%) | 16 (18.6%) |
| Female | 74 (46.3%) | 65 (89.0%) | 8 (11.0%) | 15 (21.4%) | 55 (78.6%) | 38 (52.1%) | 35 (47.9%) | 60 (81.1%) | 14 (18.9%) | 63 (85.1%) | 11 (14.9%) | 61 (82.4%) | 13 (17.6%) |
| Histological grade | |||||||||||||
| Diffuse astrocytoma (Grade II) | 106 (66.3%) | 88 (85.4%) | 15 (14.6%) | 27 (26.7%) | 74 (73.3%) | 46 (44.7%) | 57 (55.3%) | 93 (87.7%) | 13 (12.3%) | 93 (87.7%) | 13 (12.3%) | 87 (82.1%) | 19 (17.9%) |
| Anaplastic astrocytoma (Grade III) | 54 (33.8%) | 43 (79.6%) | 11 (20.4%) | 12 (25.5%) | 35 (74.5%) | 32 (60.4%) | 21 (39.6%) | 37 (68.5%) | 17 (31.5%) | 43 (79.6%) | 11 (20.4%) | 44 (81.5%) | 10 (18.5%) |
| Location | |||||||||||||
| Cerebellum | 1 (0.6%) | 1 (100.0%) | 0 (0.0%) | 0 (0.0%) | 1 (100.0%) | 1 (100.0%) | 0 (0.0%) | 1 (100.0%) | 0 (0.0%) | 0 (0.0%) | 1 (100.0%) | 1 (100.0%) | 0 (0.0%) |
| Midline | 17 (10.6%) | 14 (82.4%) | 3 (17.6%) | 3 (20.0%) | 12 (80.0%) | 10 (58.8%) | 7 (41.2%) | 15 (88.2%) | 2 (11.8%) | 13 (76.5%) | 4 (23.5%) | 13 (76.5%) | 4 (23.5%) |
| Hemisphere | 141 (88.1%) | 116 (84.1%) | 22 (15.9%) | 35 (26.7%) | 96 (73.3%) | 66 (48.2%) | 71 (51.8%) | 113 (80.1%) | 28 (19.9%) | 123 (87.2%) | 18 (12.8%) | 116 (82.3%) | 25 (17.7%) |
| Not available | 1 (0.6%) | 0 (0.0%) | 1 (100.0%) | 1 (100.0%) | 0 (0.0%) | 1 (100.0%) | 0 (0.0%) | 1 (100.0%) | 0 (0.0%) | 0 (0.0%) | 1 (100.0%) | 1 (100.0%) | 0 (0.0%) |
| Extent of resection | |||||||||||||
| Total resection | 126 (78.8%) | 103 (83.7%) | 20 (16.3%) | 32 (27.6%) | 84 (72.4%) | 59 (48.4%) | 63 (51.6%) | 101 (80.2%) | 25 (19.8%) | 111 (88.1%) | 15 (11.9%) | 102 (81.0%) | 24 (19.0%) |
| Non‐total resection | 33 (20.6%) | 28 (84.8%) | 5 (15.2%) | 6 (19.4%) | 25 (80.6%) | 18 (54.5%) | 15 (45.5%) | 28 (84.8%) | 5 (15.2%) | 25 (75.8%) | 8 (24.2%) | 28 (84.8%) | 5 (15.2%) |
| Not available | 1 (0.6%) | 0 (0.0%) | 1 (100.0%) | 1 (100.0%) | 0 (0.0%) | 1 (100.0%) | 0 (0.0%) | 1 (100.0%) | 0 (0.0%) | 0 (0.0%) | 1 (100.0%) | 1 (100.0%) | 0 (0.0%) |
| Adjuvant therapy | |||||||||||||
| No adjuvant therapy | 15 (9.4%) | 12 (80.0%) | 3 (20.0%) | 5 (35.7%) | 9 (64.3%) | 10 (66.7%) | 5 (33.3%) | 10 (66.7%) | 5 (33.3%) | 14 (93.3%) | 1 (6.7%) | 11 (73.3%) | 4 (26.7%) |
| Chemotherapy only | 7 (4.4%) | 6 (85.7%) | 1 (14.3%) | 1 (14.3%) | 6 (85.7%) | 3 (42.9%) | 4 (57.1%) | 7 (100.0%) | 0 (0.0%) | 6 (85.7%) | 1 (14.3%) | 7 (100.0%) | 0 (0.0%) |
| Radiotherapy only | 7 (4.4%) | 7 (100.0%) | 0 (0.0%) | 3 (42.9%) | 4 (57.1%) | 2 (28.6%) | 5 (71.4%) | 5 (71.4%) | 2 (28.6%) | 7 (100.0%) | 0 (0.0%) | 6 (85.7%) | 1 (14.3%) |
| Chemo‐radiotherapy | 129 (80.6%) | 105 (83.3%) | 21 (16.7%) | 29 (24.6%) | 89 (75.4%) | 61 (48.8%) | 64 (51.2%) | 107 (82.9%) | 22 (17.1%) | 108 (83.7%) | 21 (16.3%) | 105 (81.4%) | 24 (18.6%) |
| Not available | 2 (1.3%) | 1 (50.0%) | 1 (50.0%) | 1 (50.0%) | 1 (50.0%) | 2 (100.0%) | 0 (0.0%) | 1 (50.0%) | 1 (50.0%) | 1 (50.0%) | 1 (50.0%) | 2 (100.0%) | 0 (0.0%) |
Abbreviations: mut = mutant; n = number of cases; wt = wild type.
Data on patient demographics and therapeutic treatment were obtained from paper and electronic records of the institutions. Survival data were ascertained from records of follow‐up visits in clinics, or by contacting with patients or close relatives by telephone. This study was approved by The Joint Chinese University of Hong Kong—New Territories East Cluster Clinical Research Ethics Committee, Ethics Committees of Huashan Hospital, Shanghai and First Affiliated Hospital of Zhengzhou University, Zhengzhou.
1p19q codeletion
1p19q codeletion was examined by FISH analysis as described 6. A sample was considered 1p or 19q deleted when >25% of counted nuclei exhibited one target signal and two reference signals and ratio of target to reference signals was <0.8 13, 23. In this study, we only included astrocytomas that were 1p19q intact and carried IDH1/2 mutation (described below).
DNA extraction from formalin‐fixed paraffin‐embedded (FFPE) tissues
DNA was extracted from FFPE tissues for mutational analysis. In brief, representative areas with tumor content of at least 80% on FFPE sections were marked. Slides were then dewaxed by xylene and rehydrated in a series of descending grades of alcohol. Tissues within marked areas were scrapped and treated with proteinase K in 10 mM Tris HCl buffer (pH 8.5) at 55°C for 12 h followed by 98°C for 10 minutes. The cell lysate was centrifuged, and supernatant was collected and used in subsequent polymerase chain reaction (PCR) reaction.
IDH1/2 and TERT promoter (TERTp) mutation analyses
Sanger sequencing was conducted to examine hotspot mutations at promoter region (termed C228T and C250T) of TERT, codon 132 of IDH1 and codon 172 of IDH2 as described previously 6, 40. In brief, PCR was performed in a 20 μL contained 0.5 μL cell lysate, 0.5 μM of forward and reverse primers, 1× KAPA2G Robust HotStart ReadyMix (Sigma) or 1× KAPA HiFi HotStart ReadyMix (Sigma). Amplification was conducted under the conditions of 95°C for 3 minutes, followed by 45 cycles of 95°C for 15 s, 60°C/66°C for 15 s and 72°C for 30 s on Veriti® 96‐well Thermal Cycler (Applied Biosystems). PCR products were cleaned by spin column‐based nucleic acid purification kit (iNtRON Biotechnology), and sequenced with BigDye Terminator Cycle Sequencing kit v1.1 (Life Technologies). The products were resolved in 3130xl Genetic Analysis. Primer sequences are listed in Table S1.
Immunohistochemical analysis of ATRX and p53
Immunohistochemistry (IHC) was performed to detect ATRX loss and p53 expression. FFPE sections were de‐waxed in xylene and rehydrated in graded ethanol. Sections were then treated with citrate buffer (pH 6.0) in microwave for antigen retrieval. Immunohistochemical staining was done in BenchMark ULTRA automated tissue staining systems (Ventana Medical Systems). The primary antibodies were anti‐ATRX (Sigma HPA001906, 1:400) and anti‐p53 (Dako DO‐7, 1:100).
ATRX loss was defined by a lack of nuclear staining for ATRX by IHC in >10% of tumor cells 37. Endothelial cells and infiltrating inflammatory cells served as internal positive controls. Cases were classified as failed/non‐informative when internal control cells were not immunopositive (n = 12 cases). In p53 staining, a tumor was considered as positive when >10% of tumor nuclei showed strong nuclear staining or the slides were completely immune negative 31, 32.
Fluorescence in situ hybridization (FISH) analysis
CDKN2A homozygous deletion, CDK4 amplification and PDGFRA amplification were evaluated by FISH as described 40. Vysis LSI CDKN2A SpectrumOrange/CEP 9 SpectrumGreen Probes (Vysis) were employed to investigate CDKN2A deletion. The Zytolight SPEC CDK4/CEN 12 Dual Color Probe (ZytoVision) was applied in CDK4 amplification detection. The target probe for CDK4 was labeled in green and the reference probe was labeled in red. Probes of PDGFRA (CTD‐2054G11 and RP11‐231C18) were generated from bacterial artificial chromosome clones using nick translation with the presence of Spectrum Orange deoxyuridine triphosphate (dUTP). The reference probe for PDGFRA was labeled with Spectrum Green dUTP. In brief, 4‐µm‐thick FFPE sections were de‐waxed by xylene, heated in 1 M sodium thiocyanate for 10 minutes at 80°C and digested with pepsin at 37°C for 20 to 30 minutes. Sections were then rinsed in molecular biology grade water to stop the digestion and dehydrated by heating. Locus‐specific probe was then denatured at 80°C for 10 minutes followed by incubation on slides for 16 h at 37°C. Next day, sections were washed twice in 1.5M Urea/2X saline sodium citrate at 50°C for 10 minutes, and stained with Vectashield mounting medium containing 4′,6‐diamidino‐2‐phenylindole (Vector Laboratories). Fluorescent signals were visualized under a fluorescent microscope (Carl Zeiss). At least 100 non‐overlapping signals were counted and analyzed in each case.
CDKN2A homozygous deletion was considered when >20% of tumor cells showed loss of two signals, in the presence of two reference signals 14. Polyploid cells were not common in this study (<5% of tumor cells), and they were excluded from our scoring. CDK4 and PDGFRA amplification were defined as over 10% of tumor cells showing over 12 target signals or over 40% of tumor cells showing 6 or 12 target signals 22. Representative photos showing tumors positive for CDKN2A homozygous deletion, CDK4 amplification and PDGFRA amplification are shown in Figure S1.
Statistical analysis
Statistical analysis was performing using IBM SPSS software v20 (IBM Corporation, NY, USA). Chi‐squared test or Fisher’s exact test was used to examine the correlation between molecular markers and clinical parameters. Progression‐free survival (PFS) was defined as the time between tumor diagnosis to recurrence or progression as evidenced by radiological imaging. Overall survival (OS) was defined as the time between diagnosis to death or last follow‐up. Survival curves were performed by Kaplan–Meier method. Log‐rank test was done to compare survival distribution between groups. In univariate and multivariate analyses, Cox’s proportional hazards regression model was applied. All hazard ratios were reported with 95% CIs. P‐value of <0.05 (two sided) was considered statistically significant.
Results
Clinical characteristics of IDH mutant lower grade (WHO Grades II/III) astrocytomas
All tumors in this series were morphologically astrocytomas and were 1p19q non‐deleted by FISH and IDH mutant by sequencing. The mean and median ages of our 160 tumors were 40.5 and 40.0 years old, respectively. 106 cases were Grade II diffuse astrocytomas and 54 cases were Grade III anaplastic astrocytomas. Male to female ratio was 1.16:1. 141 tumors were located in the hemispheres. Tumors involving the ventricular system, brain stem, thalamus, spinal cord, sellar region and pineal region were defined as midline tumors. 17 tumors were located in midline and one was located in cerebellum (Table 1). 126 patients received total resection. Adjuvant therapy data were available in 158 cases. 129 patients were given both chemo‐ and radiotherapy. Seven patients had chemotherapy alone or radiotherapy alone. 15 patients did not receive any adjuvant therapy.
Follow‐up data were available in 155 of 160 (96.9%) patients. For overall survival, 113/155 (72.9%) patients were still alive upon the completion of study and 42/155 (27.1%) were passed away. For progression‐free survival, 102/149 (68.5%) patients did not experience a tumor progression at the end of this study. The mean OS was 64.7 months but caution has to be taken in interpretation because majority of the patients were censored. The median OS was not yet reached. The mean OS for Grades II and III were 72.5 and 39.5 months respectively (P < 0.0001).
Univariate Cox proportional hazards analyses were performed, and histological grade was highly associated with PFS (P < 0.001) and OS (P < 0.001). Gender, location, extent of resection, radiotherapy, chemotherapy and chemo‐radiotherapy were not associated with PFS and OS (Table 2).
Table 2.
Univariate Cox proportional hazards regression models of clinical characteristics.
| Variables | PFS | OS | ||
|---|---|---|---|---|
| HR (95% CI) | P‐value | HR (95% CI) | P‐value | |
| Age | 1.036 (1.006‐1.066) | 0.018 | 1.037 (1.007‐1.067) | 0.015 |
| Gender | ||||
| Male | 1 | 1 | ||
| Female | 1.019 (0.573‐1.811) | 0.950 | 1.031 (0.561‐1.894) | 0.923 |
| Histological grade | ||||
| Diffuse astrocytoma (Grade II) | 1 | 1 | ||
| Anaplastic astrocytoma (Grade III) | 4.187 (2.256‐7.771) | <0.0001 | 5.723 (2.985‐10.975) | <0.0001 |
| Location | ||||
| Hemisphere | 1 | 0.192 | 1 | 0.212 |
| Cerebellum | 0.000047*, * | 0.980 | 0.00013*, * | 0.979 |
| Midline | 2.036 (0.945‐4.384) | 0.069 | 2.086 (0.921‐4.725) | 0.078 |
| Extent of resection | ||||
| Total resection | 1 | 1 | ||
| Non‐total resection | 1.048 (0.533‐2.064) | 0.891 | 1.412 (0.722‐2.761) | 0.313 |
| Radiotherapy | ||||
| Yes | 1 | 1 | ||
| No | 1.042 (0.411‐2.644) | 0.931 | 0.944 (0.336‐2.656) | 0.914 |
| Chemotherapy | ||||
| Yes | 1 | 1 | ||
| No | 0.706 (0.279‐1.785) | 0.462 | 0.810 (0.318‐2.064) | 0.659 |
| Chemo‐radiotherapy | ||||
| Yes | 1 | 1 | ||
| No | 0.685 (0.290‐1.613) | 0.386 | 0.653 (0.256‐1.662) | 0.371 |
The hazard ratio did not have significance.
Abbreviation: n = number of cases with data available.
TERTp mutations in IDH mutant lower grade (WHO Grades II/III) astrocytomas
TERTp mutation was examined in 157 cases with sufficient tissue for analysis, and 26 of them (16.6%) carried the mutation. Majority of mutant cases (20/26; 76.9%) had C228T mutation. TERTp mutation was not associated with age, gender, histological grade, tumor location and extent of resection (Table S2). Co‐occurrence of TERTp mutation and PDGFRA amplification was identified in one Grade III tumor as described below. One other tumor exhibited both TERTp mutation and CDKN2A homozygous deletion (below). We did not detect a prognostic significance of TERTp for PFS (P = 0.718; Figure 1A) and OS (P = 0.647; Figure 1B).
Figure 1.
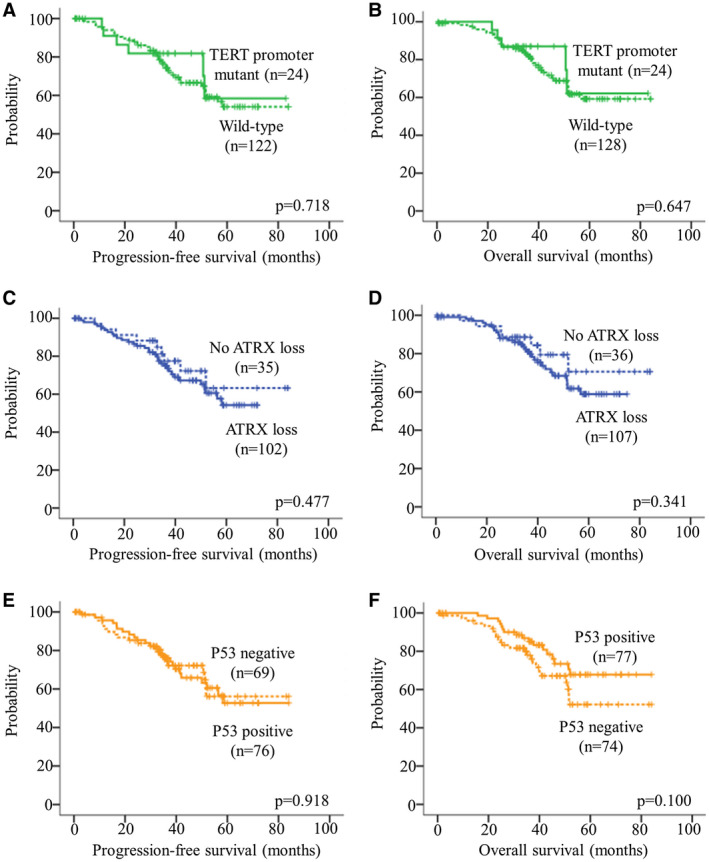
Kaplan–Meier survival curves of TERTp mutation, ATRX loss and p53 accumulation. TERTp mutation had no clinical impact on (A) PFS and (B) OS. ATRX loss was not associated with (C) PFS and (D) OS. P53 accumulation was not associated with (E) PFS and (F) OS. The hash marks represent censored patients.
ATRX loss in IDH mutant lower grade (WHO Grades II/III) astrocytomas
IHC was employed to detect ATRX loss in our cohort. ATRX loss was found in 109/148 (73.6%) of our cohort. Uninformative result was noted in 12 cases caused by the failure of internal control. We did not detect a difference in age, gender, histological grade, tumor location and extent of resection between ATRX‐loss and ATRX‐retent tumors (Table S2). ATRX loss and TERTp mutation were mutually exclusive. ATRX loss was not associated with PFS (P = 0.477; Figure 1C) and OS (P = 0.341; Figure 1D).
P53 expression in IDH mutant lower grade (WHO Grades II/III) astrocytomas
P53 accumulation was detected in 78 of 156 (50.0%) of IDH mutant lower grade astrocytomas. P53 immunopositivity was not associated with age, gender, histological grade, tumor location and extent of resection (Table S2). P53 expression was not associated with PFS (P = 0.918; Figure 1E) and OS (P = 0.100; Figure 1F).
PDGFRA amplification is a poor prognostic marker in IDH mutant lower grade (WHO Grades II/III) astrocytomas
PDGFRA amplification was identified in 18.8% (30/160) of tumors. PDGFRA amplification was significantly associated with histological grade (Tables 1 and S2). More than 30% of anaplastic astrocytomas harbored PDGFRA amplification. In contrast, the alteration was identified in only 12.3% of diffuse astrocytomas. Furthermore, PDGFRA‐amplified patients were older than non‐amplified patients (P = 0.011; Table S2). PDGFRA amplification was not associated with gender, tumor location and extent of resection (Table S2). We identified a 56‐year‐old man diagnosed with anaplastic astrocytoma carrying TERTp mutation and PDGFRA amplification.
Kaplan–Meier survival analysis revealed PDGFRA amplification was associated with shorter PFS (P = 0.0003) and OS (P < 0.0001) (Figure 2A,B). After adjusting for age, histological grade, tumor location and extent of resection in multivariate analysis, PDGFRA amplification remained as an independent factor for PFS [HR 2.567 (95% CI 1.254–5.258); P = 0.010] and OS [HR 2.904 (95% CI 1.372–6.149); P = 0.005].
Figure 2.
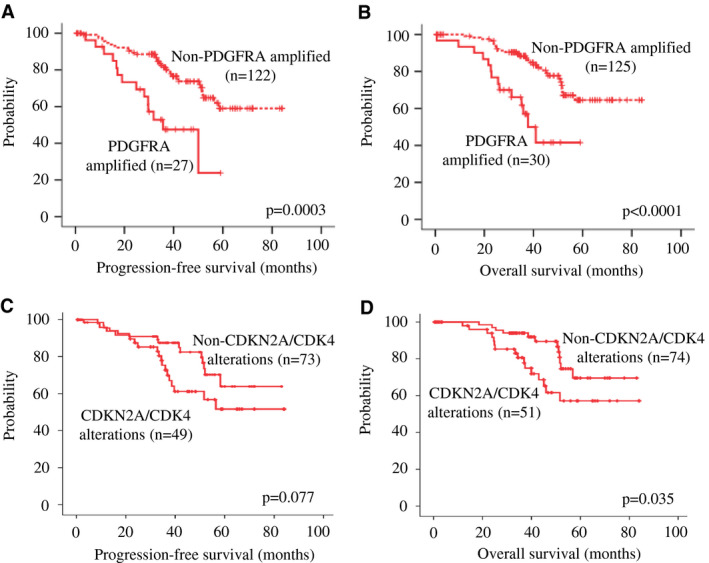
Kaplan–Meier survival curves of PDGFRA amplification, CDKN2A deletion and CDK4 amplification. Alteration in PDGFRA (a member in the RTK‐PI3K‐mTOR pathway) was associated with shorter (A) PFS (P < 0.0001) and (B) OS (P < 0.0001). Alteration in CDKN2A or CDK4 (members in the RB pathway) showed a trend toward a poorer (C) PFS (P = 0.077) and was associated with a shorter (D) OS (P = 0.035).
CDKN2A homozygous deletion and CDK4 amplification were associated with poor outcomes in a subset of IDH mutant lower grade (WHO Grades II/III) astrocytomas
We then studied CDKN2A homozygous deletion and CDK4 amplification. These genes are involved in the RB signaling pathway and they are frequently altered in astrocytomas 30. CDKN2A homozygous deletion was detectable in 24 of 160 (15.0%) of IDH mutant lower grade (WHO Grades II/III) astrocytomas, including 13 diffuse astrocytomas and 11 anaplastic astrocytomas. CDK4 amplification was identified in 18.1% (29/160) of our cohort. 19 cases were diffuse astrocytomas and 10 cases were anaplastic astrocytomas. Changes in CDKN2A or CDK4 were not associated with sex, age, histological grade, tumor location and extent of resection (Table S2). Alterations in PDGFRA, CDKN2A and CDK4 were mutually exclusive. A single case of an anaplastic astrocytoma from a 33‐year‐old female carried both TERTp mutation and CDKN2A homozygous deletion.
As PDGFRA amplification, belonging to the RTK‐PI3K‐mTOR pathway, showed a clinical impact on survival, we questioned if CDKN2A homozygous deletion and CDK4 amplification of the RB pathway is clinically relevant in those case without PDGFRA amplification. The molecular events had been mutually exclusive. We found tumors with CDKN2A homozygous deletion or CDK4 amplification showed a trend toward a poorer PFS (P = 0.077; Figure 2C) and a significantly shorter OS (P = 0.035; Figure 2D). Upon adjusting for age, histological grade, tumor location and extent of resection, multivariate analysis revealed that alteration in CDKN2A or CDK4 remained an independent factor for OS [HR 2.433 (95% CI 1.110–5.334); P = 0.026].
Stratification of IDH mutant lower grade (WHO Grades II/III) astrocytomas into risk groups
We then asked if we could stratify IDH mutant, lower grade (WHO Grades II/III) astrocytomas for risk. Given that PDGFRA of the RTK‐PI3K‐mTOR pathway and CDKN2A or CDK4 of the RB pathways were associated with clinical outcomes in this study and their alterations remained as independent factors for survivals in multivariate analysis, we included these three molecular markers in the risk stratification scheme. We divided IDH mutant, lower grade (WHO Grades II/III) astrocytomas into three risk groups (low, intermediate and high risk) according to changes in PDGFRA, CDKN2A and CDK4 (RTK‐PI3K‐mTOR and RB pathways) status (Figure 3). Tumors with PDGFRA amplification (alteration in the RTK‐PI3K‐mTOR pathway) were assigned into high‐risk group (n = 30). Tumors with CDKN2A homozygous deletion or CDK4 amplification (alteration in the RB pathway) were assigned into intermediate‐risk group (n = 53). Tumors with no alteration in these genes (two pathways) were classified into low‐risk group (n = 77). The high‐risk group accounted for nearly 18.8% (30/160) of the cohort. The intermediate‐ and low‐risk groups represented 33.1% (53/160) and 48.1% (77/160) of our cohort respectively. We found a remarkable association between and risk group and histology (P = 0.001; Table 3). Nearly 60% of tumors in high‐risk group were anaplastic astrocytomas (Grade III). In contrast, low‐risk group comprised mainly diffuse astrocytomas (Grade II; 79.2%). Furthermore, risk groups were significantly associated with age (P = 0.026), and patients of high‐risk group were much older (Table 3). We did not find association between risk groups and other clinical parameters (Table 3). Kaplan–Meier survival analysis indicated that risk groups correlated with PFS (P < 0.001; Figure 4A) and OS (P < 0.0001; Figure 4B). Compared to patients of intermediate‐ and low‐risk groups, patients of high‐risk group had the worst clinical outcomes in term of PFS and OS (Figures 4A,B). Pairwise comparison further indicated that patients of intermediate‐risk group had a significantly shorter OS compared to patients of low‐risk group (P = 0.035). Compared to patients in low‐risk group, patients in intermediate‐risk group tended to have a shorter PFS (P = 0.077). After adjusting covariates including age, histological grade, tumor location and extent of resection in multivariate Cox proportional hazards model, these biomarker‐associated risk groups remained as independent prognosticators for PFS (P = 0.009; Table 4) and OS (P = 0.004; Table 4).
Figure 3.
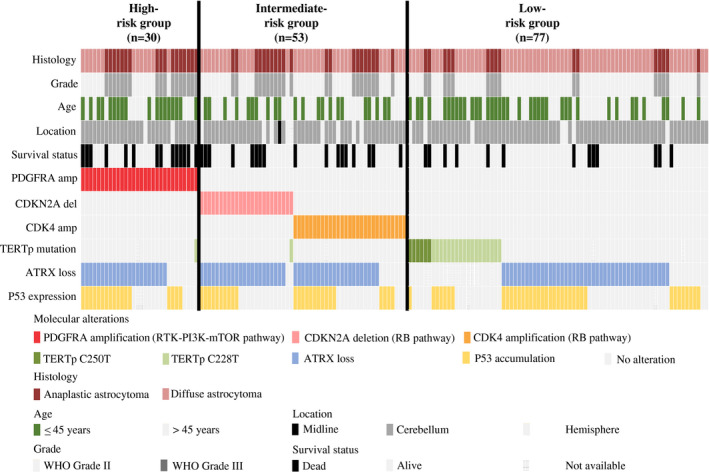
Summary of clinical data and molecular characteristics of low‐, intermediate‐ and high‐risk groups. IDH mutant lower grade (WHO Grades II/III) astrocytomas were divided into three groups according to PDGFRA, CDKN2A and CDK4 alterations. The high‐risk group was assigned to tumors carrying PDGFRA amplification (n = 30). The intermediate‐risk group was assigned to tumors showing CDKN2A homozygous deletion or CDK4 amplification (n = 53). The low‐risk group was assigned to tumors showing no change in PDGFRA, CDKN2A and CDK4 (n = 78).
Table 3.
Clinical parameters of low‐, intermediate‐ and high‐risk groups.
| Low | Intermediate | High | P‐value | |
|---|---|---|---|---|
| (n = 77) | (n = 53) | (n = 30) | ||
| Age (mean/median) | 40.2/40.0 | 38.6/39.0 | 44.8/44.5 | 0.026 |
| Gender | ||||
| Male | 41 (53.2%) | 29 (54.7%) | 16 (53.3%) | 0.985 |
| Female | 36 (46.8%) | 24 (45.3%) | 14 (46.7%) | |
| Histological grade | ||||
| Diffuse astrocytoma (Grade II) | 61 (79.2%) | 32 (60.4%) | 13 (43.3%) | 0.001 |
| Anaplastic astrocytoma (Grade III) | 16 (20.8%) | 21 (39.6%) | 17 (56.7%) | |
| Location | ||||
| Cerebellum | 0 (0.0%) | 1 (1.9%) | 0 (0.0%) | 0.393 |
| Midline | 7 (9.1%) | 8 (15.1%) | 2 (6.7%) | |
| Hemisphere | 70 (90.9%) | 43 (81.1%) | 28 (93.3%) | |
| Not available | 0 (0.0%) | 1 (1.9%) | 0 (0.0%) | |
| Extent of resection | ||||
| Total resection | 62 (80.5%) | 39 (73.6%) | 25 (83.3%) | 0.622 |
| Non‐total resection | 15 (19.5%) | 13 (24.5%) | 5 (16.7%) | |
| Not available | 0 (0.0%) | 1 (1.9%) | 0 (0.0%) | |
| Adjuvant therapy | ||||
| No adjuvant therapy | 5 (6.5%) | 5 (9.4%) | 5 (16.7%) | 0.323 |
| Chemotherapy only | 6 (7.8%) | 1 (1.9%) | 0 (0.0%) | |
| Radiotherapy only | 4 (5.2%) | 2 (3.8%) | 2 (6.7%) | |
| Chemo‐radiotherapy | 62 (80.5%) | 44 (83.0%) | 22 (73.3%) | |
| Not available | 0 (0.0%) | 1 (1.9%) | 1 (3.3%) |
Abbreviation: n = number of cases.
Figure 4.
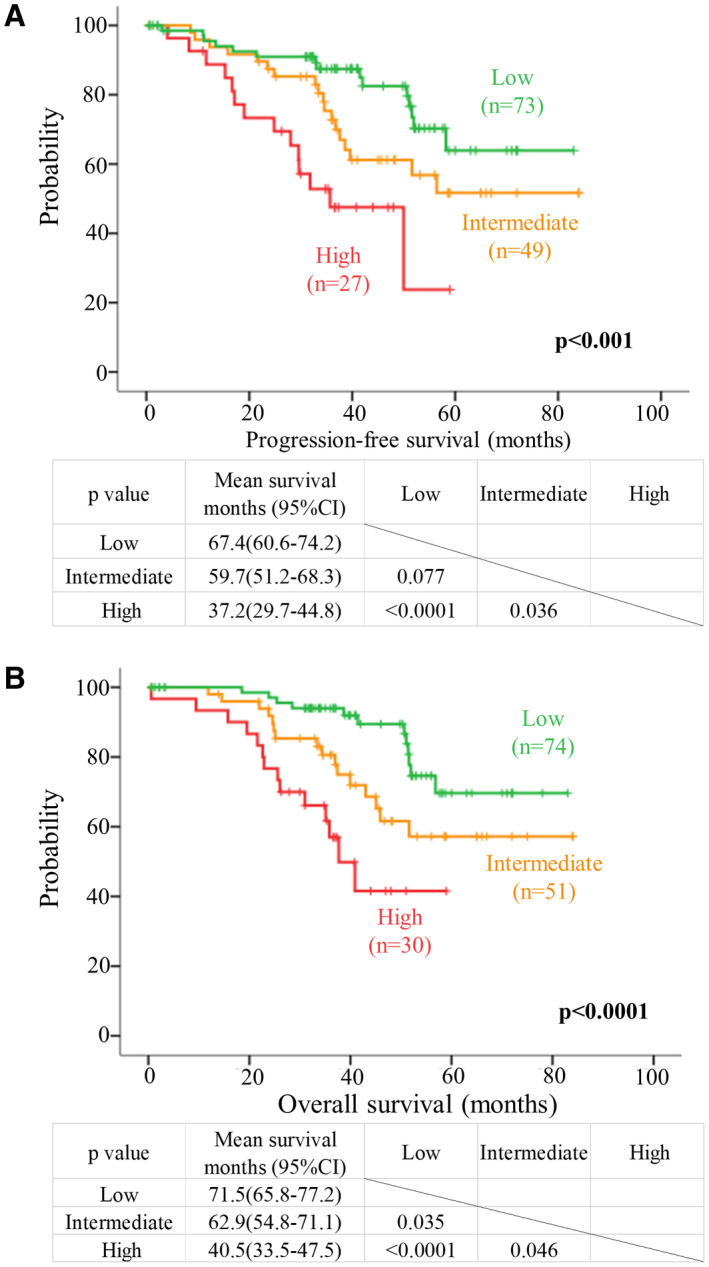
Risk stratification of IDH mutant lower grade astrocytomas based on molecular markers. Kaplan–Meier survival curves of molecular‐based risk group for (A) PFS and (B) OS. Green, orange and red lines represent survival curves for low‐, intermediate‐ and high‐risk groups respectively. Patients with PDGFRA amplification representing a change in the RTK‐PI3K‐mTOR pathway were assigned to high‐risk group. Patients with CDKN2A deletion or CDK4 amplification representing a change in the RB pathway were grouped into intermediate‐risk group. Patients without PDGFRA, CDKN2A and CDK4 aberrations were grouped into low‐risk group. These three risk groups had distinct PFS (P < 0.001) and OS (P < 0.001).
Table 4.
Multivariate Cox proportional hazards regression models of clinico‐pathological features and risk groups.
| Variables | PFS | OS | ||
|---|---|---|---|---|
| HR (95% CI) | P‐value | HR (95% CI) | P‐value | |
| Age | 1.024 (0.994‐1.055) | 0.122 | 1.024 (0.992‐1.057) | 0.146 |
| Histological grade | ||||
| Diffuse astrocytoma (Grade II) | 1 | 1 | ||
| Anaplastic astrocytoma (Grade III) | 3.079 (1.601‐5.918) | 0.0007 | 4.268 (2.145‐8.895) | 0.00005 |
| Location | ||||
| Hemisphere | 1 | 0.135 | 1 | 0.145 |
| Cerebellum | 0.00004*, * | 0.975 | 0.00003*, * | 0.984 |
| Midline | 2.304 (1.018‐5.216) | 0.045 | 2.434 (1.002‐5.911) | 0.049 |
| Extent of resection | ||||
| Total resection | 1 | 1 | ||
| Non‐total resection | 1.009 (0.498‐2.044) | 0.980 | 1.291 (0.646‐2.582) | 0.469 |
| Risk group | ||||
| Low‐risk group | 1 | 0.009 | 1 | 0.004 |
| High‐risk group | 3.642 (1.587‐8.359) | 0.002 | 4.667 (1.890‐11.521) | 0.0008 |
| Intermediate‐risk group | 1.988 (0.972‐4.065) | 0.060 | 2.378 (1.090‐5.189) | 0.030 |
The hazard ratio did not have significance.
Abbreviation: n = number of cases with data available.
Discussion
The updated WHO 2016 classification of tumors of the central nervous system for the first time combined molecular markers and histology to provide an integrated diagnosis 18, 35. IDH mutant lower grade astrocytomas comprise Grade II diffuse astrocytoma, IDH mutant and Grade III anaplastic astrocytoma, IDH mutant. IDH mutant lower grade (WHO Grades II/III) astrocytomas are associated with favorable disease outcome compared to their IDH wild type counterparts 4, 12, 27. IDH mutant lower grade astrocytic tumors are also enriched for p53 mutations 27. IDH mutation impairs histone demethylation and induces major effects on the tumor’s methylome and transcriptome 19, 33. In particular, IDH mutation induces G‐CIMP (gliomas CpG island methylator phenotype), and downregulates genes known to be involved in glioma initiation and outcome, including CDKN2C and GAP43 33.
A number of studies have demonstrated that IDH mutation alone is insufficient to stratify astrocytic tumors. Diplas et al showed that IDH wild type glioblastomas are molecularly heterogeneous and not all of them are associated with poor outcome 9. IDH wild type glioblastomas bearing the wild type TERTp are associated with prolonged overall survival compared to those carrying mutations in the TERTp 9. Our group has also showed that IDH wild type lower grade gliomas are prognostically heterogeneous and they do not have uniformly poor prognosis 1. IDH wild type lower grade gliomas can be stratified into “molecularly” high grade and “molecularly” low grade based on EGFR, H3F3A and TERTp alterations 1. The cIMPACT‐NOW has now recommended that IDH wild type diffuse astrocytic gliomas carrying EGFR amplification, or combined whole chromosome 7 gain and whole chromosome 10 loss (+7/−10), or TERTp mutation have molecular features of a glioblastoma 3. This recommendation highlights the heterogeneity of astrocytic tumors and that IDH mutation alone is not enough to provide accurate information about the natural history of astrocytic tumors. We therefore postulated that IDH mutant lower grade (WHO Grades II/III) astrocytomas can be stratified for risk, similar to the IDH wild type astrocytomas.
In this study, we found TERTp mutation in 16.6% of IDH mutant lower grade (WHO Grades II/III) astrocytomas, and the prevalence was similar in both Grades II and III tumors. These tumors were morphologically clearly not oligodendroglial and they were all 1p19q retained (Figure S2). TERTp mutation was not associated with the clinical parameters and outcomes in this study. Similar frequency of TERTp mutation in IDH mutant, 1p19q intact astrocytomas has been reported 16. In a major series by Eckel‐Passow et al, 13.5% (5/37) of IDH mutant, 1p19q intact astrocytomas showed TERTp mutations, and the mutation was found in both Grades II and III (shown in Figure S4 of the paper) 10. Interestingly, in the TCGA study, among the 65 IDH mutant, 1p19q intact astrocytomas that were examined for TERTp mutation only 2 of them (3.1%) carried the mutation 5. We are uncertain of the reason for discrepancy but it is interesting to note that in our study, Grade II tumors accounted for 2/3 of our cohort, whereas about 2/3 of IDH mutant, 1p19q intact astrocytomas with TERTp data in TCGA study were of Grade III.
In this cohort, we identified ATRX loss in 73.6% IDH mutant lower grade (WHO Grades II/III) astrocytomas. Previous study by Wiestler and his colleagues also demonstrated that astrocytomas with IDH mutation and intact 1p19q have a similar frequency of ATRX loss 37. However, another study conducted by Reuss et al showed that majority of the 1p19q intact, IDH mutant astrocytomas display ATRX loss (95.6%) 26. This discrepancy in prevalence of ATRX loss may be explained by different clinical features between studies. More than 70% of 1p19q intact, IDH mutant astrocytomas in Reuss et al study were of Grade III, whereas only one‐third of astrocytomas in our study were of Grade III (33.8%; P < 0.0001). Moreover, the age of the patients in our study is significantly older compared to that of Reuss et al study (mean age 40.5 vs. 37.7 years old; P = 0.0197).
Loss of ATRX was not associated with clinical parameters and was not a prognostic factor in our cohort. Wiestler et al showed that low‐grade glioma patients with ATRX retention and IDH mutations have shorter time to treatment failure than those patients with loss of ATRX and IDH mutation 37. The difference in findings between our study and Wiestler et al’s may be explained by the inclusion of tumors of different entities in Wiestler et al study. Leeper et al also examined the clinical impact of ATRX expression in WHO Grade II gliomas and found that tumors with ATRX retention, IDH mutations and intact 1p19q have similar overall survival compared to tumors with ATRX loss, IDH mutations and intact 1p19q 17.
In this study, we identified p53 accumulation in half of the IDH mutant lower grade (WHO Grades II/III) astrocytomas. P53 protein expression has no impact on clinical outcome in this series. Leeper et al examined p53 nuclear staining in WHO Grade II gliomas. Of their IDH mutant astrocytomas without 1p19q codeletion, 60% displayed p53 staining 17. The prevalence of p53 staining in our study is comparable to that in Leeper et al study. Analysis of TCGA database revealed the presence of TP53 mutation in 90.2% of IDH mutant lower grade astrocytomas 5. Similar to our findings, TP53 mutation was not associated with PFS and OS in TCGA cohort. The difference in the prevalence of p53 alterations between our study and TCGA database may be explained by the sensitivity of immunohistochemistry. As reported earlier, p53 immunohistochemical detection reached 77.4%–78.8% sensitivity compared to DNA sequencing in detecting TP53 mutation 32. Positive p53 immunohistochemistry correlated well with missense mutations with a sensitivity of 92%; however, only 33% of tumors with truncating mutations would show p53 positivity 11.
A few studies have implicated the use of combination of TERTp, ATRX or p53 with other molecular biomarkers in the classification of gliomas as a whole 5, 10, 17, 39. For instance, IDH, TERTp mutations and 1p19q codeletion can divide lower grade gliomas into five subgroups that are independently associated with prognosis 10. A similar classification system based on IDH and TERTp mutations has been proposed in Grades II and III gliomas 39. A recent study suggested combination of 1p19q codeletion, IDH mutation and ATRX loss can more accurately predict outcome of WHO Grade II gliomas as compared to histology 17. In this study, we showed TERTp mutation, ATRX loss and p53 accumulation have little prognostic value in IDH mutant lower grade astrocytomas.
Overall, a proportion of our cases (19 cases, 11.9%) were ATRX retained and p53 negative. These tumors are morphologically astrocytic and showed fibrillated GFAP positivity and are shown in Figure S2. We appreciate p53 positivity and ATRX retention are important diagnostic criteria for assigning a tumor as astrocytic in the literature. However, in Leeper et al 2015s study, 40% of IDH mutant 1p19q retained astrocytic tumors were p53 negative 17 and in Reis et al study, 24.6% of IDH mutant “histologically classified as astrocytoma” did not show loss of ATRX (Reis et al did not do 1p19q in astrocytomas) 24. Similarly 30% of IDH mutant 1p19q intact astrocytomas in Wiestler et al 2013s study showed no ATRX loss, as per data we could retrieve from the papers. We appreciate another major study by Reuss et al showed majority (95%) of IDH mutant lower grade astrocytomas showed ATRX loss. Whatever the percentages, our findings confirmed previous studies that the clear majority of IDH mutant lower grade astrocytomas showed p53 positivity and ATRX loss.
Platelet‐derived growth factor receptor alpha (PDGFRA) is a member of the receptor tyrosine kinase family and is involved in the RTK‐PI3K‐mTOR pathway 7, 20. This receptor binds to certain isoforms of platelet‐derived growth factor (PDGF) and controls cell proliferation, cell fate specification, migration in the neural stem cell (NSC) compartment and glial development 8, 29. Alterations of PDGFRA, including amplification and overexpression, have been detected in diffuse gliomas and PDGFRA amplification has been identified in 18% of IDH mutant anaplastic astrocytomas 22. Aberrations of PDGFRA together with IDH mutations have been linked to the proneural subtype of glioblastomas 34. PDGFRA amplification is associated with poor PFS and OS in glioblastomas 22. However, the prognostic implication of PDGFRA amplification has not been extensively studied in IDH mutant lower grade (WHO Grades II/III) gliomas. In this study, we showed PDGFRA amplification in 18.8% of our cohort and it is more common in anaplastic astrocytomas. Importantly, PDGFRA amplification is associated with shorter PFS and OS and it is an independent prognostic factor in multivariate analysis. PDGFRA amplification is not prognostically significance in IDH mutant lower grade astrocytomas of TCGA dataset and the difference may be caused by the relatively small number of IDH mutant lower grade astrocytomas in the TCGA dataset.
CDKN2A (cyclin‐dependent kinase inhibitor 2A) is located at chromosome 9p21.3. The gene encodes two distinct proteins, p16 (or p16INK4a) and p14 (or p14ARF), which are generated through alternative exon usage. Although both p16INK4a and p14ARF are tumor suppressors, they are involved in different pathways. The protein p16INK4a induces G1 cell cycle arrest by inhibiting the phosphorylation of the Rb protein by the cyclin‐dependent kinases, CDK4 and CDK6. p14ARF induces a p53‐dependent cell cycle arrest by interacting with MDM2 and stabilizing p53. CDKN2A deletion is often detected in pediatric low‐grade and high‐grade gliomas 15. Reis et al showed that CDKN2A deletion is associated with a shorter overall survival in Grades II and III astrocytomas 24. Shirahata et al identified CDKN2A deletion as a molecular biomarker to stratify IDH mutant astrocytic tumors. Grade III astrocytic tumors harbored CDKN2A deletion had shorter overall survival compared to non‐deleted counterpart and Grade IV glioblastomas without CDKN2A deletion 28. In contrast to Shirahata et al study in which no Grade II astrocytic tumor had CDKN2A deletion, we found 12.3% of Grade II IDH mutant astrocytomas harbored CDKN2A deletion. In addition to CDKN2A deletion, we also examined CDK4 amplification in our cohort because CDK4 as well as CDKN2A is a cell cycle regulator in the RB pathway and CDK4 alteration has been implicated in IDH mutant lower grade gliomas 2. We found CDK4 amplification in more than 10% of our samples, a frequency that is concordant with TCGA dataset. We also found after excluding cases with PDGFRA amplification, IDH mutant lower grade (WHO Grades II/III) astrocytomas harboring CDKN2A homozygous deletion or CDK4 amplification had a significantly shorter OS compared to those without the alteration. CDKN2A or CDK4 alteration remained as an independent prognostic factor in multivariate analysis. Both CDKN2A and CDK4 are members of the RB pathway.
As PDGFRA amplification, CDKN2A homozygous deletion and CDK4 amplification appeared in a mutually exclusive fashion in this study, and PDGFRA belongs to the RTK‐PI3K‐mTOR pathway while the latter two belong to the RB pathway, we hypothesized that these three markers could improve the risk stratification of IDH mutant lower grade astrocytomas. We therefore separated our samples into three groups. Tumors with PDGFRA amplification belonged to high‐risk group, and they had the shortest PFS and OS. Patients with CDKN2A homozygous deletion or CDK4 amplification belonged to intermediate‐risk group and they showed better prognosis compared to those in the high‐risk group. Tumors without PDGFRA amplification, CDK4 amplification and CDKN2A deletion were stratified into low‐risk group and they had the best clinical outcome in term of OS. We showed such stratification is independent of histological grade, tumor location and extent of resection.
A limitation of this study is that a significant fraction of patients’ survival was censored (72.9%) in this study, a common confounding factor in studies on low‐grade cancers, and this has made it difficult to achieve a precise assessment on the effect of molecular alterations on clinical outcomes. Hopefully, future studies with more long‐term follow‐up with give more insight on this question.
Our data illustrated the potential use of molecular markers to provide a more refined stratification for IDH mutant lower grade astrocytomas. Some IDH mutant astrocytomas, in spite of its IDH genotype, do not have a longer survival and pathologists could convey an inaccurate prognostic implication by merely using a diagnosis of IDH mutant astrocytoma without further molecular grading. We recommend the incorporation of PDGFRA, CDKN2A and CDK4 in the molecular stratification of IDH mutant lower grade astrocytomas. Such stratification likely provides a more precise prognostic information to patients and may influence decisions at the bedside. The stratification scheme may also have significance toward future classification of lower grade astrocytomas.
Conflict of Interest
The authors have no conflict of interest.
Supporting information
Figure S1. Representative FISH images of IDH mutant lower grade astrocytomas displaying (A) PDGFRA amplification, (B) CDKN2A homozygous deletion and (C) CDK4 amplification.
Figure S2. H&E stained images and immunostaining of GFAP of 19 IDH mutant astrocytomas without ATRX loss or p53 staining. Cases 111 (36yr/F), 148 (39yr/M) and 169 (36yr/F) are high‐risk tumors without ATRX loss and p53 staining. All carried wild type TERTp. Cases 99 (33yr/F), 170 (37yr/M), 193 (16yr/F), 201 (24yr/M) and 237 (26yr/M) are intermediate‐risk tumors without ATRX loss and p53 staining. Case 99 carried TERTp mutation and the other four cases carried wild type TERTp. Cases 127 (53yr/M), 129 (39yr/M), 137 (46yr/M), 157 (44yr/M), 167 (59yr/F), 184 (45yr/M), 195 (47yr/M), 226 (48yr/M) and 245 (22yr/M) were low‐risk tumors that carried TERTp mutation and showed no alteration in both ATRX and p53. Cases 94 (38yr/F) and 138 (35yr/M) were low‐risk tumors carrying the wild type TERTp. Both of them showed no alteration in ATRX and p53.
Table S1. Primer sequences.
Table S2. Correlation between clinical features and molecular markers.
Acknowledgments
This study was supported by Shenzhen Science Technology and Innovation Commission (reference number JCYJ20170307165432612), Shanghai Municipal Science and Technology Major Project (reference number 2018SHZDZX03), Science and Technology Program of Henan Province (reference number 192102310050) and National Natural Science Foundation of China (reference number 81702471, 81702465 and U1804172).
Authors contributed equally to this work.
Contributor Information
Xian‐zhi Liu, Email: fccliuxz@zzu.edu.cn.
Ying Mao, Email: maoying@fudan.edu.cn.
Kay Ka‐Wai Li, Email: kayli@cuhk.edu.hk.
References
- 1. Aibaidula A, Chan AK, Shi Z, Li Y, Zhang R, Yang R et al (2017) Adult IDH wild‐type lower‐grade gliomas should be further stratified. Neuro Oncol 19:1327–1337. [DOI] [PMC free article] [PubMed] [Google Scholar]
- 2. Aoki K, Nakamura H, Suzuki H, Matsuo K, Kataoka K, Shimamura T et al (2018) Prognostic relevance of genetic alterations in diffuse lower‐grade gliomas. Neuro Oncol 20:66–77. [DOI] [PMC free article] [PubMed] [Google Scholar]
- 3. Brat DJ, Aldape K, Colman H, Holland EC, Louis DN, Jenkins RB et al (2018) cIMPACT‐NOW update 3: recommended diagnostic criteria for “Diffuse astrocytic glioma, IDH‐wildtype, with molecular features of glioblastoma, WHO grade IV”. Acta Neuropathol 136:805–810. [DOI] [PMC free article] [PubMed] [Google Scholar]
- 4. Cancer Genome Atlas Research Network , Brat DJ, Verhaak RG, Aldape KD, Yung WK, Salama SR et al (2015) Comprehensive, integrative genomic analysis of diffuse lower‐grade gliomas. N Engl J Med 372:2481–2498. [DOI] [PMC free article] [PubMed] [Google Scholar]
- 5. Ceccarelli M, Barthel FP, Malta TM, Sabedot TS, Salama SR, Murray BA et al (2016) Molecular profiling reveals biologically discrete subsets and pathways of progression in diffuse glioma Cell 164:550–563. [DOI] [PMC free article] [PubMed] [Google Scholar]
- 6. Chan AK, Yao Y, Zhang Z, Chung NY, Liu JS, Li KK et al (2015) TERT promoter mutations contribute to subset prognostication of lower‐grade gliomas. Mod Pathol 28:177–186. [DOI] [PubMed] [Google Scholar]
- 7. Claesson‐Welsh L (1994) Platelet‐derived growth factor receptor signals. J Biol Chem 269:32023–32026. [PubMed] [Google Scholar]
- 8. Dai C, Celestino JC, Okada Y, Louis DN, Fuller GN, Holland EC (2001) PDGF autocrine stimulation dedifferentiates cultured astrocytes and induces oligodendrogliomas and oligoastrocytomas from neural progenitors and astrocytes in vivo. Genes Dev 15:1913–1925. [DOI] [PMC free article] [PubMed] [Google Scholar]
- 9. Von Deimling A, Berger MS, Paulus W, Huse JT, Weller M, Wesseling P et al (2016) Anaplastic astrocytoma, IDH‐mutant. In: WHO Classification of Tumours of the Central Nervous System, 4th edn. Louis DN, Ohgaki H, Wiestler OD, Cavenee WK (eds), p. 27. IARC Press: Lyon. [Google Scholar]
- 10. Diplas BH, He X, Brosnan‐Cashman JA, Liu H, Chen LH, Wang Z et al (2018) The genomic landscape of TERT promoter wildtype‐IDH wildtype glioblastoma. Nat Commun 9:2087. [DOI] [PMC free article] [PubMed] [Google Scholar]
- 11. Eckel‐Passow JE, Lachance DH, Molinaro AM, Walsh KM, Decker PA, Sicotte H et al (2015) Glioma groups based on 1p/19q, IDH, and TERT promoter mutations in tumors. N Engl J Med 372:2499–2508. [DOI] [PMC free article] [PubMed] [Google Scholar]
- 12. Gillet E, Alentorn A, Doukoure B, Mundwiller E, van Thuijl HF, Reijneveld JC et al (2014) TP53 and p53 statuses and their clinical impact in diffuse low grade gliomas. J Neurooncol 118:131–139. [DOI] [PubMed] [Google Scholar]
- 13. Gorovets D, Kannan K, Shen R, Kastenhuber ER, Islamdoust N, Campos C et al (2012) IDH mutation and neuroglial developmental features define clinically distinct subclasses of lower grade diffuse astrocytic glioma. Clin Cancer Res 18:2490–2501. [DOI] [PubMed] [Google Scholar]
- 14. Horbinski C, Miller CR, Perry A (2011) Gone FISHing: clinical lessons learned in brain tumor molecular diagnostics over the last decade. Brain Pathol 21:57–73. [DOI] [PMC free article] [PubMed] [Google Scholar]
- 15. Horbinski C, Nikiforova MN, Hagenkord JM, Hamilton RL, Pollack IF (2012) Interplay among BRAF, p16, p53, and MIB1 in pediatric low‐grade gliomas. Neuro Oncol 14:777–789. [DOI] [PMC free article] [PubMed] [Google Scholar]
- 16. Lassaletta A, Zapotocky M, Mistry M, Ramaswamy V, Honnorat M, Krishnatry R et al (2017) Therapeutic and prognostic implications of BRAF V600E in pediatric low‐grade gliomas. J Clin Oncol 35:2934–2941. [DOI] [PMC free article] [PubMed] [Google Scholar]
- 17. Lee Y, Koh J, Kim SI, Won JK, Park CK, Choi SH et al (2017) The frequency and prognostic effect of TERT promoter mutation in diffuse gliomas. Acta Neuropathol Commun 5:62. [DOI] [PMC free article] [PubMed] [Google Scholar]
- 18. Leeper HE, Caron AA, Decker PA, Jenkins RB, Lachance DH, Giannini C (2015) IDH mutation, 1p19q codeletion and ATRX loss in WHO grade II gliomas. Oncotarget 6:30295–30305. [DOI] [PMC free article] [PubMed] [Google Scholar]
- 19. Louis DN, Perry A, Reifenberger G, von Deimling A, Figarella‐ Branger D, Cavenee WK et al (2016) The 2016 World Health Organization classification of tumors of the central nervous system: a summary. Acta Neuropathol 131:803–820. [DOI] [PubMed] [Google Scholar]
- 20. Lu C, Ward PS, Kapoor GS, Rohle D, Turcan S, Abdel‐Wahab O et al (2012) IDH mutation impairs histone demethylation and results in a block to cell differentiation. Nature 483:474–478. [DOI] [PMC free article] [PubMed] [Google Scholar]
- 21. Martinho O, Longatto‐Filho A, Lambros MB, Martins A, Pinheiro C, Silva A et al (2009) Expression, mutation and copy number analysis of platelet‐derived growth factor receptor A (PDGFRA) and its ligand PDGFA in gliomas. Br J Cancer 101:973–982. [DOI] [PMC free article] [PubMed] [Google Scholar]
- 22. Metellus P, Coulibaly B, Colin C, de Paula AM, Vasiljevic A, Taieb D et al (2010) Absence of IDH mutation identifies a novel radiologic and molecular subtype of WHO grade II gliomas with dismal prognosis. Acta Neuropathol 120:719–729. [DOI] [PubMed] [Google Scholar]
- 23. Phillips JJ, Aranda D, Ellison DW, Judkins AR, Croul SE, Brat DJ et al (2013) PDGFRA amplification is common in pediatric and adult high‐grade astrocytomas and identifies a poor prognostic group in IDH1 mutant glioblastoma. Brain Pathol 23:565–573. [DOI] [PMC free article] [PubMed] [Google Scholar]
- 24. Pinkham MB, Telford N, Whitfield GA, Colaco RJ, O'Neill F, McBain CA (2015) FISHing tips: what every clinician should know about 1p19q analysis in gliomas using fluorescence in situ hybridisation. Clin Oncol (R Coll Radiol) 27:445–453. [DOI] [PubMed] [Google Scholar]
- 25. Reis GF, Pekmezci M, Hansen HM, Rice T, Marshall RE, Molinaro AM et al (2015) CDKN2A loss is associated with shortened overall survival in lower‐grade (World Health Organization Grades II‐III) astrocytomas. J Neuropathol Exp Neurol 74:442–452. [DOI] [PMC free article] [PubMed] [Google Scholar]
- 26. Reuss DE, Mamatjan Y, Schrimpf D, Capper D, Hovestadt V, Kratz A et al (2015) IDH mutant diffuse and anaplastic astrocytomas have similar age at presentation and little difference in survival: a grading problem for WHO. Acta Neuropathol 129:867–873. [DOI] [PMC free article] [PubMed] [Google Scholar]
- 27. Reuss DE, Sahm F, Schrimpf D, Wiestler B, Capper D, Koelsche C et al (2015) ATRX and IDH1‐R132H immunohistochemistry with subsequent copy number analysis and IDH sequencing as a basis for an “integrated” diagnostic approach for adult astrocytoma, oligodendroglioma and glioblastoma. Acta Neuropathol 129:133–146. [DOI] [PubMed] [Google Scholar]
- 28. Sanson M, Marie Y, Paris S, Idbaih A, Laffaire J, Ducray F et al (2009) Isocitrate dehydrogenase 1 codon 132 mutation is an important prognostic biomarker in gliomas. J Clin Oncol 27:4150–4154. [DOI] [PubMed] [Google Scholar]
- 29. Shirahata M, Ono T, Stichel D, Schrimpf D, Reuss DE, Sahm F et al (2018) Novel, improved grading system(s) for IDH‐mutant astrocytic gliomas. Acta Neuropathol 136:153–166. [DOI] [PubMed] [Google Scholar]
- 30. Smits A, Funa K (1998) Platelet‐derived growth factor (PDGF) in primary brain tumours of neuroglial origin. Histol Histopathol 13:511–520. [DOI] [PubMed] [Google Scholar]
- 31. Suzuki H, Aoki K, Chiba K, Sato Y, Shiozawa Y, Shiraishi Y et al (2015) Mutational landscape and clonal architecture in grade II and III gliomas. Nat Genet 47:458–468. [DOI] [PubMed] [Google Scholar]
- 32. Takami H, Yoshida A, Fukushima S, Arita H, Matsushita Y, Nakamura T et al (2015) Revisiting TP53 mutations and immunohistochemistry‐A comparative study in 157 diffuse gliomas. Brain Pathol 25:256–265. [DOI] [PMC free article] [PubMed] [Google Scholar]
- 33. Tanboon J, Williams EA, Louis DN (2016) The diagnostic use of immunohistochemical surrogates for signature molecular genetic alterations in gliomas. J Neuropathol Exp Neurol 75:4–18. [DOI] [PubMed] [Google Scholar]
- 34. Turcan S, Rohle D, Goenka A, Walsh LA, Fang F, Yilmaz E et al (2012) IDH1 mutation is sufficient to establish the glioma hypermethylator phenotype. Nature 483:479–483. [DOI] [PMC free article] [PubMed] [Google Scholar]
- 35. Verhaak RG, Hoadley KA, Purdom E, Wang V, Qi Y, Wilkerson MD et al (2010) Integrated genomic analysis identifies clinically relevant subtypes of glioblastoma characterized by abnormalities in PDGFRA, IDH1, EGFR and NF1. Cancer Cell 17:98–110. [DOI] [PMC free article] [PubMed] [Google Scholar]
- 36. Weller M, Weber RG, Willscher E, Riehmer V, Hentschel B, Kreuz M et al (2015) Molecular classification of diffuse cerebral WHO grade II/III gliomas using genome‐ and transcriptome‐wide profiling improves stratification of prognostically distinct patient groups. Acta Neuropathol 129:679–693. [DOI] [PubMed] [Google Scholar]
- 37. Wiestler B, Capper D, Holland‐Letz T, Korshunov A, von Deimling A, Pfister S et al (2013) ATRX loss refines the classification of anaplastic gliomas and identifies a subgroup of IDH mutant astrocytic tumors with better prognosis. Acta Neuropathol 126:443–451. [DOI] [PubMed] [Google Scholar]
- 38. Yan H, Parsons DW, Jin G, McLendon R, Rasheed BA, Yuan W et al (2009) (2009) IDH1 and IDH2 mutations in gliomas. N Engl J Med 360:765–773. [DOI] [PMC free article] [PubMed] [Google Scholar]
- 39. Yang RR, Aibaidula A, Wang WW, Chan AK, Shi ZF, Zhang ZY et al (2018) Pediatric low‐grade gliomas can be molecularly stratified for risk. Acta Neuropathol 136:641–655. [DOI] [PubMed] [Google Scholar]
- 40. Yang P, Cai J, Yan W, Zhang W, Wang Y, Chen B et al (2016) Classification based on mutations of TERT promoter and IDH characterizes subtypes in grade II/III gliomas. Neuro Oncol 18:1099–108. [DOI] [PMC free article] [PubMed] [Google Scholar]
Associated Data
This section collects any data citations, data availability statements, or supplementary materials included in this article.
Supplementary Materials
Figure S1. Representative FISH images of IDH mutant lower grade astrocytomas displaying (A) PDGFRA amplification, (B) CDKN2A homozygous deletion and (C) CDK4 amplification.
Figure S2. H&E stained images and immunostaining of GFAP of 19 IDH mutant astrocytomas without ATRX loss or p53 staining. Cases 111 (36yr/F), 148 (39yr/M) and 169 (36yr/F) are high‐risk tumors without ATRX loss and p53 staining. All carried wild type TERTp. Cases 99 (33yr/F), 170 (37yr/M), 193 (16yr/F), 201 (24yr/M) and 237 (26yr/M) are intermediate‐risk tumors without ATRX loss and p53 staining. Case 99 carried TERTp mutation and the other four cases carried wild type TERTp. Cases 127 (53yr/M), 129 (39yr/M), 137 (46yr/M), 157 (44yr/M), 167 (59yr/F), 184 (45yr/M), 195 (47yr/M), 226 (48yr/M) and 245 (22yr/M) were low‐risk tumors that carried TERTp mutation and showed no alteration in both ATRX and p53. Cases 94 (38yr/F) and 138 (35yr/M) were low‐risk tumors carrying the wild type TERTp. Both of them showed no alteration in ATRX and p53.
Table S1. Primer sequences.
Table S2. Correlation between clinical features and molecular markers.