

ABSTRACT
The clinical and molecular implications of DNA methylation alterations remain unclear among the majority of glioblastomas (GBMs) without glioma-CpGs island methylator phenotype (G-CIMP); integrative multi-level molecular profiling may provide useful information. Independent cohorts of non-G-CIMP GBMs or IDH wild type (wt) lower-grade gliomas (LGGs) from local and public databases with DNA methylation and gene expression microarray data were included for discovery and validation of a multimarker signature, combined using a RISK score model. Bioinformatic and in vitro functional analyses were employed for biological validation. Using a strict multistep selection approach, we identified eight CpGs, each of which was significantly correlated with overall survival (OS) of non-G-CIMP GBMs, independent of age, the O-6-methylguanine-DNA methyltransferase (MGMT) methylation status, treatments and other identified CpGs. An epigenetic RISK signature of the 8 CpGs was developed and validated to robustly and independently prognosticate prognosis in different cohorts of not only non-G-GIMP GBMs, but also IDHwt LGGs. It also showed good discriminating value in stratified cohorts by current clinical and molecular factors. Bioinformatic analysis revealed consistent correlation of the epigenetic signature to distinct immune-relevant transcriptional profiles of GBM bulks. Functional experiments showed that S100A2 appeared to be epigenetically regulated by one identified CpG and was associated with GBM cell proliferation, apoptosis, invasion, migration and immunosuppression. The prognostic 8-CpGs RISK score signature may be of promising value for refining current glioma risk classification, and its potential links to distinct immune phenotypes make it a promising biomarker candidate for predicting response to anti-glioma immunotherapy.
KEYWORDS: Glioblastomas, glioma-CpGs island methylator phenotype, DNA methylation, prognostic biomarker, immune phenotype
Introduction
Glioblastomas (GBMs) are the most frequent and devastating glioma subtype, and are heterogeneous groups of diseases with various molecular and clinical features.1,2 The apparent heterogeneity of GBMs is likely to be driven by a plethora of multi-level molecular events which collaboratively determine biological phenotypes, clinical prognoses, and treatment responses.3–5 Integrative multi-platform molecular profiling represents the most powerful approach to the comprehensive molecular characterization of this clinically refractory disease.5
Among all molecular machinery, epigenetics and DNA methylation in particular play key roles in cancer formation and progression mainly via regulating gene expression and chromatin structure.6 Previous studies have outlined the genome-wide landscape of cancer-specific DNA methylation changes, which is characteristic of global hypomethylation at gene-poor DNA repeats and large hypomethylated blocks at gene regions concurrent with mosaicked CpGs island (CGI) hypermethylation.6–8 Recently, The Cancer Genome Atlas (TCGA) Research Network has identified a distinct epigenetic subcluster of glioma-CGI methylator phenotype (G-CIMP) GBMs, which is featured by IDH mutations, highly concordant hypermethylation at a large number of CpGs, and favorable prognosis.9,10 Unfortunately, the impacts of DNA methylation aberrations remain unknown among the majority of GBMs without G-CIMP since no apparent clinical correlations have been observed for non-G-CIMP subclasses.9,10 Moreover, there appeared to be lack of validated prognostic biomarkers that could provide information on the likely outcome of GBMs independent of treatment, after the exclusion of the favorable G-CIMP tumors.
In this study, by analyzing high-throughput DNA methylation and gene expression microarray data from independent cohorts of non-G-CIMP GBMs, we established a novel epigenetic signature of eight CpGs for optimal prognostication of non-G-CIMP patients; the epigenetic signature was closely associated with differential transcriptional statues of immune-relevant phenotypes of GBM cells. In vitro experiments on S100A2, the expression of which appeared to be epigenetically regulated by one of the eight CpGs provided additional biological evidence for the immune-relevant epigenetic signature.
Materials and methods
Non-G-CIMP GBMs from Rennes and Angers University Hospital
One-hundred twenty five primary non-G-CIMP GBMs were collected between 2004 and 2013 from the Neurosurgery Departs of Rennes and Angers University Hospitals, including a published cohort of forty eight samples (RAUH-GSE22891, deposited in the Gene Expression Omnibus [GEO] at https://www.ncbi.nlm.nih.gov/geo/),11 and a new cohort of seventy seven samples (RAUH-new cohort, deposited in The ArrayExpress at http://www.ebi.ac.uk/arrayexpress/under the accession number of E-MTAB-4969).12 Snap-frozen samples were collected at the time of surgery, following written informed consent, in accordance with the French regulations and the Helsinki Declaration. Initial histological diagnoses were confirmed by a central review panel including at least two neuropathologists. Degree of surgical resection as defined by MRI 72 h after surgery. All patients were treated with radiotherapy (RT) plus concurrent and adjuvant temozolomide (TMZ). Only samples with > 80% tumor cells were selected for microarray profiling and molecular detection. DNA methylation profiling by Infinium HumanMethylation 27k or 450k BeadChip and gene expression profiling by Agilent Whole HumanGenome 4 × 44 K or 8 × 60 K Microarray Kit for the two RAUH datasets were reported previously.11,12 G-CIMP phenotype was determined by K-means clustering on the 1503 featured probes reported by Noushmehr et al.9 Additional sample information was reported in Supplementary Methods.
Non-G-CIMP GBMs and IDHwt lower grade gliomas (LGGs) from public databases
The Cancer Genome Atlas (TCGA)
Multi-platform molecular datasets of 303 non-G-CIMP GBMs (TCGA-GBM) were obtained from TCGA data portal4 at https://tcga-data.nci.nih.gov/tcga/; secondary, recurrent or previously treated cases were excluded; only those with known treatments (RT/TMZ or RT alone) were included for study (Figure 1a). For additional validation, DNA methylation and gene expression data of 94 adult IDH-wild type (wt) LGGs (grade II to III; TCGA-LGG)5 were obtained from TCGA (Figure 1a).
Figure 1.
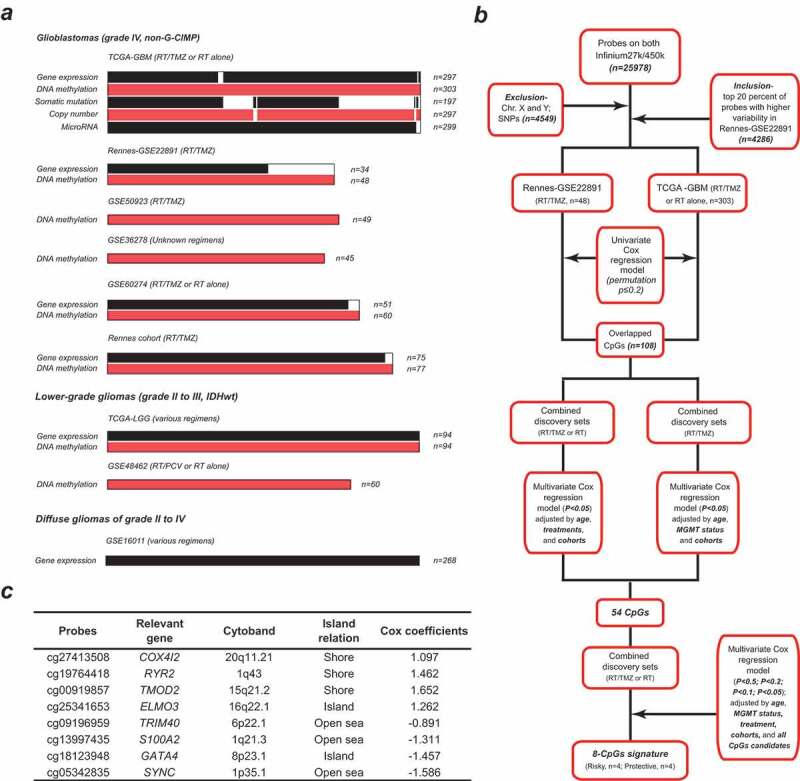
Molecular data information and study workflow of CpGs selection; (a) molecular data type and sample size of included datasets of non-G-CIMP GBMs (grade IV) and IDHwt LGGs (grade II to III); (b) schematic diagram for the multi-step probe selection based on multivariate analysis; (c) the characteristics of the eight CpGs with high clinically informative value; Cox coefficients are calculated from multivariate analysis adjusted by age, treatment, MGMT methylation status, cohort, and all the 8 CpGs within the combined discovery cohorts; each CpGs is subcategorized into Islands, Shores (1 to 2000 bp from Island), Shelves (2001 to 4000 bp from Island) and Open seas (> 4000 bp from Island); G-CIMP = glioma-CpG island methylator phenotype; IDHwt = IDH wild type; GBM = glioblastoma; LGG = lower-grade glioma
Gene Expression Omnibus (GEO)
Four molecular datasets of non-G-CIMP GBMs were obtained from GEO, including GSE50923 (n = 49),13 GSE60274 (n = 60; recurrent cases were excluded),14 and GSE36278 (n = 45; tumors harboring H3F3A mutations and those from TCGA were excluded).10 A cohort of sixty IDH-wt LGGs was also obtained from GEO (GSE48462).15
All included patients were older than 18 years old, and those with missing survival data or with a follow-up data of < 1 month were excluded for survival analysis.
Molecular data sets of non-tumor brains (NTBs) from each database were included as controls. In addition, DNA methylation data of twenty NTBs from GSE6334716 (median age: 59; female/male: 9/11; brain locations: temporal or frontal cortex) were selected as controls for TCGA methylation data. All NTBs were obtained from apparently healthy individuals without pathological evidence of other neurological or psychiatric diseases. Patient and molecular information for all included datasets are shown in Figure 1a and Suppl. Table S1. Additional sample information is reported in Supplementary Methods.
Multi-step probe selection and RISK score construction
Initial probe selection was performed by removal of probes not covered on both 27k and 450k platforms, those targeting X and Y chromosomes, and those relevant to single-nucleotide polymorphisms (SNPs). Each CpG was classified into CGI, Shores (1 to 2,000 bp from island), Shelves (2,001 to 4,000 bp from island) and Open seas (>4,000 bp from island) on the basis of the distance to relevant island regions. To make DNA methylation microarray data comparable, batch effects between each platform and dataset were adjusted by M-value transformation and the empirical Bayes approach (ber R package).17 Missing β values were imputed by impute R package. Discovery-validation approach was used for prognostic model construction. Both RAUH-GSE22891 and TCGA-GBM cohorts were used for discovery phase. Selected probes with higher variability in DNA methylation data (top 20% of standard deviation of β value) across RAUH-GSE22891 tumors were included to correlate with overall survival (OS) by univariate Cox regression analysis and permutation test (Figure 1b). After the removal of inconsistent results from the discovery cohorts, an overlap of 108 CpGs (permutation p < .2) were kept and, respectively, subjected to 1) multivariate Cox model within the combined discovery sets adjusted by age, treatment and cohort, and 2) multivariate Cox model within combined discovery patients with RT/TMZ, adjusted by age, O-6-methylguanine-DNA methyltransferase (MGMT) methylation status and cohort (Figure 1b). Then, a total of 54 CpGs were kept for the next multivariate Cox regression analyses with gradually stricter p-values for significance (p < .5, <0.2, <0.1 and <0.05), which incorporated all significant CpGs as well as age, MGMT methylation status, treatment, and cohort (Figure 1b). Finally a panel of eight CpGs was identified for constructing a RISK score model, which is the sum of β values of each CpG weighted by their multivariate Cox coefficients, adjusted by age, MGMT methylation status, cohorts, and other loci (Figure 1c). The cutoff for low-risk and high-risk tumors were predefined as the median risk score from the discovery cohorts.
Multi-platform molecular data analysis
Differentially expressed microRNAs (DEmiRs) were computed by two-sample standard t test with confidence level of false discovery rate (FDR) assessment = 80% and maximum allowed proportion of false-positive genes = 10%, within BRB-Array Tools (https://brb.nci.nih.gov/BRB-ArrayTools). Somatic mutation data were analyzed by MutSigCV module on GenePattern (https://genepattern.broadinstitute.org/gp) with FDR q-value ≤ 0.05 for significance.18 Segmented copy number data were analyzed by GISTIC2.0 module on GenePattern with default parameters.19 MGMT promoter methylation status was determined using a logistic regression model based on two Illumina array probes, i.e., cg12434587 and cg12981137.20 The gene expression subtypes were predicted by Binary tree classification prediction using the 840 classifiers reported by Verhaak et al.3 Gene set enrichment analysis (GSEA) was run to evaluate functional profiles between grouped samples using the gene sets of the Gene Ontology Biological Processes from Molecular Signature Database (MSigDB),21 with both nominal p-values ≤ 0.05 and false discovery rate (FDR) q-values ≤ 0.25 for significance. Single-sample (ss)GSEA was also performed to calculate a separate enrichment score for each pairing of a sample and gene set, which represents the degree to which the genes in a particular gene set are coordinately up- or down-regulated within a sample.21 The abundance of tumor-infiltrating immune cells was estimated by CIBERSORTx (https://cibersortx.stanford.edu/) based on gene expression microarray data of tumor samples.22
Immunofluorescence staining
Formalin-fixed paraffin-embedded (FFPE) samples of nine primary gliomas were collected from the Department of Neurosurgery, Xijing Hospital (Grade II, n = 3; Grade III, n = 3, Grade IV, n = 3). FFPE tissues were employed for immunofluorescence staining with anti-S100A2 antibody (Abcam, #ab109494). The intensity and percentage of positive cells were evaluated in at least five separate fields at × 400 magnification. The scores were evaluated by two researchers who were blinded to clinical data. Immunoreactivity was scored as follows: 0, no staining; 1, weak staining in < 50% cells; 2, weak staining in ≥ 50% cells; 3, strong staining in < 50%, cells; and 4, strong staining in ≥ 50% cells.23 Disputes were resolved through discussion. All patients provided written informed consent and this study was approved by the Institutional Review Board.
In vitro functional experiments
The human glioma cell lines U87, U251, U373, and T98G were obtained from American Type Culture Collection (ATCC) and were cultured in Dulbecco’s modified
Eagle’s medium supplemented with 10% fetal bovine serum (FBS) at 37°C in 5% CO2. Total RNA, DNA and proteins were extracted as reported previously.12 Gene expression was determined using cDNA SYBR Master Mix by quantitative real-time PCR (qRT-PCR, Takara). The expression values were normalized to the levels of GAPDH. Total DNA was extracted and bisulfate-modified using EZ DNA Methylation-GoldTM Kit (Beijing Tianmo). Pyrosequencing was performed by Pyromark Q96 ID platform and analyzed by PyroMark CpG software (Qiagen). Protein level was detected by western blot. The primary antibodies against S100A2 (Abcam, #ab109494), FGL2 (Proteintech, #11827-1-AP), phosphor-NF-κB p65 (Ser536, Cell Signaling Technology, #3033) and GAPDH (Santa Cruz, #SC-32233) were used according to the manufacturers’ instructions. Stable U251 and U87 cells silenced for S100A2 expression were generated using lentiviral vectors expressing small hairpin RNAs (e.g., shS100A2-I, shS100A2-II, shS100A2-III), with nontargeting sense sequence (shControl) as control (Genechem). Cell viability was measured by CCK-8 assay (Yeasen). Cell cycle was evaluated by flow cytometric analysis (FACS) with propidium iodide (PI) staining (Sigma). Apoptotic cells were detected by FACS with Annexin V-FITC/PI double staining (Beyotime). Cell migration and invasion were tested by Transwell and Matrigel Chamber assays (Corning). Protein levels of FGL2 in cell culture supernatant were determined by an enzyme-linked immunosorbent assay (ELISA) kit (Cusabio, #E09569h). Detail information on in vitro experiments was provided in Supplementary Materials.
Statistical analysis
Differences in clinical and molecular features within each subgroup were tested by unpaired t test, wilcoxon test, Fisher’s exact or Chi-square test. Variances in expression levels were compared by F test. Pearson correlation was used to correlate DNA methylation and gene expression data. Overall survival (OS) was the time interval from the date of diagnosis or treatment to the date of death or last follow-up. Progression-free survival (PFS) was the time interval from the date of diagnosis or treatment to the date of progression defined by the Macdonald criteria or Response Assessment in Neuro-Oncology (RANO) criteria,24,25 or the date of death or last follow-up. Survival data were estimated by the Kaplan–Meier Method, and compared by log-rank test. Univariate and multivariate Cox regression analysis was used to evaluate the prognostic correlation and independence of each variable. All the calculations were done with SPSS statistics (SPSS software Inc.) and R software, with two-side p value ≤0.05 for significance.
Results
Identification of a RISK score signature of eight CpGs for prognostication of non-G-CIMP GBMs
According to the multi-step selection approach (Figure 1b), we identify a panel of 8 CpGs from the two discovery cohorts; each CpGs significantly prognosticate OS of non-G-CIMP GBMs, independent of age, treatment, MGMT methylation status, and other identified CpGs (Figure 1c). DNA methylation data of the 8 CpGs and corresponding gene expression patterns are reported in Suppl. Table S2; one CGI shore locus (cg19764418) is found to be significantly hypermethylated in non-G-CIMP GBMs whilst three CpGs from open seas (cg09196959, cg13997435 and cg05342835) appear to be focally hypomethylated, independent of large hypomethylation blocks (Suppl. Fig. S1). These CpGs are combined by a RISK-score model, which is constructed as follows: RISK score = (1.097 × β value of cg27413508) + (1.462 × β value of cg19764418) + (1.652 × β value of cg00919857) + (1.262 × β value of cg25341653) + (−0.891 × β value of cg09196959) + (−1.311 × β value of cg13997435) + (−1.457 × β value of cg18123948) + (−1.586 × β value of cg05342835).
Using the median RISK score as cutoff (1.4188), patients are divided into low-risk and high-risk groups. In RAUH-GSE22891, high-risk patients are associated with shorter OS than low-risk ones (p < .0001; Figure 2a). Similarly, within TCGA-GBM, high-risk patients have poorer OS than low-risk patients (p < .0001; Figure 1b).
Figure 2.
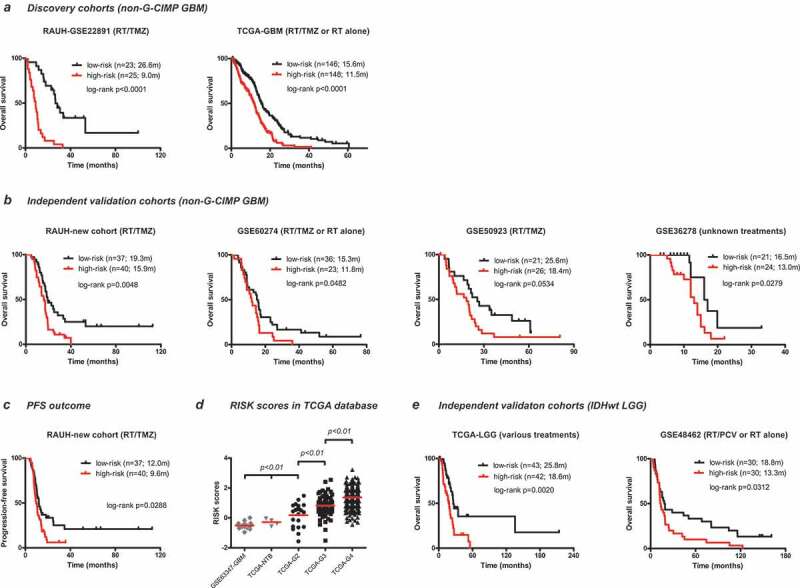
Prognostic performance of the 8-CpGs RISK score signature (a) in two discovery cohorts of non-G-CIMP GBMs, one with RT/TMZ (RAUH-GSE22891), and the other with both RT/TMZ and RT monotherapy (TCGA-GBM); (b) in four independent validation cohorts of non-G-CIMP GBMs, including RAUH-new cohort with RT/TMZ, GSE50923 with RT/TMZ, GSE60274 with both RT/TMZ and RT monotherapy, and GSE36278 with unknown regimens. Prognostic performance of the 8-CpGs RISK score signature in terms of PFS outcome (c) in RAUH-new cohort; (d) RISK scores in non-G-CIMP GBMs (grade IV), IDHwt LGGs (grade II to III), and NTBs; Prognostic performance of the 8-CpGs RISK score signature (e) in two independent validation cohorts of IDHwt LGGs, including GSE48462 with RT/PCV and RT monotherapy and TCGA-LGGs with various regimens; * indicates p value for TCGA G2 vs. TCGA NTB (or GSE63347 NTB) < 0.05; OS = overall survival; PFS = progression-free survival; G-CIMP = glioma-CpG island methylator phenotype; IDHwt = IDH wild type; GBM = glioblastoma; LGG = lower-grade glioma; RT = radiotherapy; TMZ = temozolomide; PCV = procarbazine, lomustine, and vincristine; NTBs = non-tumor brains
Validation of the epigenetic RISK score signature in independent cohorts
We then apply the RISK score signature to independent validation cohorts of non-G-CIMP GBMs with different treatments, two with RT/TMZ, one with RT/TMZ or RT monotherapy, and one with unknown regimens. In those cohorts, the 8-CpGs RISK classifier could stratify patients into two subgroups with apparent different prognoses; low-risk patients are associated with longer OS than high-risk ones in RAUH-new cohort (p = .0048), GSE60274 (p = .0482), GSE50923 (p = .0534), GSE36278 (p = .0279; Figure 2b). The RISK score signature is also validated in RAUH-new cohort in terms of PFS outcome (p = .0288; Figure 2c).
The RISK scores are significantly different across non-G-CIMP (or IDHwt) gliomas of different grades, and specifically increased with tumor grade (Figure 2d). The RISK score signature is further validated in two cohorts of IDHwt LGGs with various regimens; one from TCGA-LGG (p = .0020), and the other from GSE48462 (p = .0312; Figure 2c), with median RISK score from each cohort as cutoff (Figure 2e).
Risk classification of the 8-CpGs signature in clinically or molecularly stratified cohorts
To further evaluate its prognostic ability, we apply the 8-CpGs signature in stratified cohorts by MGMT status (methylated vs. unmethylated), patient age (< vs. ≥ 65 years old) from the combined RAUH cohorts (RAUH-GSE22891 and RAUH-new cohort collectively) and TCGA-GBM. In each cohort, the 8-CpGs signature shows good discriminating value for prognosis among patients with each MGMT status and age subclass (Figure 3a,b).
Figure 3.
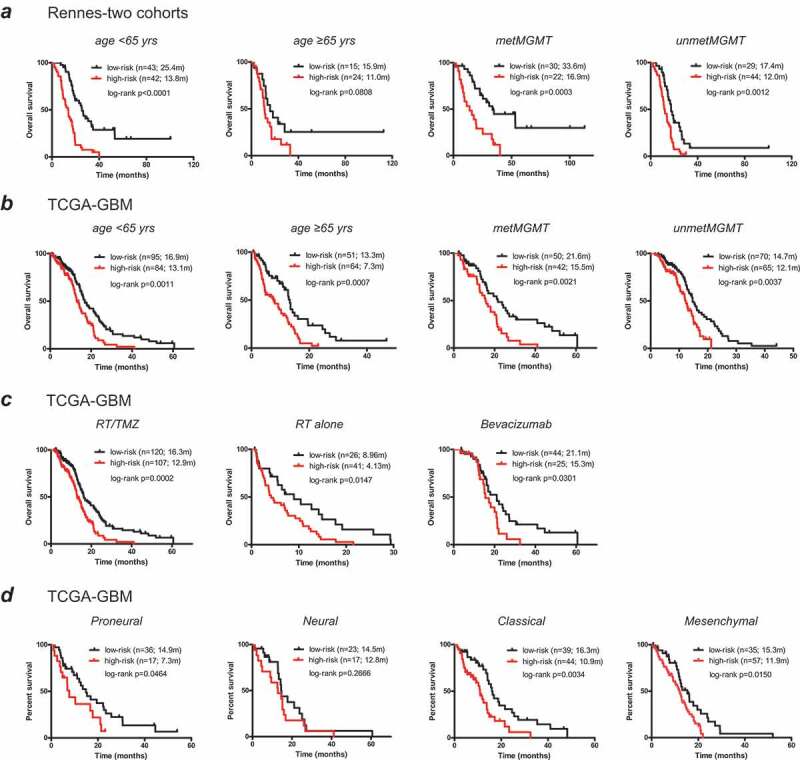
The prognostic performance of the 8-CpGs RISK score signature in molecularly and clinically stratified cohorts; (a, b) risk classification in the subclasses with different age at diagnosis (< or ≥ 65 yrs), and MGMT methylation status (methylated or unmethylated) from (a) the combined RAUH cohorts (RAUH-GSE22891 and RAUH-new cohort collectively), and (b) TCGA-GBM; (c) risk classification in the subclasses with different treatment regimens (RT/TMZ, RT monotherapy, or bevacizumab at any time during the course of their disease) from TCGA-GBM; (d) risk classification in the subclasses with each TCGA gene expression subtype from TCGA-GBM; RT = radiotherapy; TMZ = temozolomide; GBM = glioblastoma
We also test the prognostic performance in stratified cohorts by different treatments and gene expression subtypes within TCGA-GBM. The 8-CpGs signature significantly prognosticates OS of non-G-CIMP patients in each treatment group including RT/TMZ, RT alone, and bevacizumab-contained therapy (either first-line or at progression; Figure 3c). Similarly, the epigenetic RISK classifier also shows consistent discriminating value within each gene expression subtype (Figure 3d).
The 8-CpGs signature is an independent prognosticator for non-G-CIMP GBMs
Within the combined RAUH cohorts, univariate Cox regression analysis shows that age, MGMT methylation status, and the epigenetic signature are significantly correlated with OS of patients (Table 1). The multivariate analysis incorporating all significant variables from univariate model then demonstrates the 8-CpGs RISK score signature as an independent prognostic factor (Table 1). Similar results are yielded by Cox regression analyses from TCGA-GBM, confirming its independent prognostic ability for non-G-CIMP GBMs (Table 1).
Table 1.
Univariate and multivariate Cox regression analyses in G-CIMP GBMs
| Variables | Univariate Cox model |
Multivariate Cox model |
||||
|---|---|---|---|---|---|---|
| HR | 95% CI | P value | HR | 95% CI | P value | |
| RAUH-two cohorts (RT/TMZ, n = 125) | ||||||
| Patient age (increasing years) | 1.022 | 1.001–1.044 | 0.038 | 1.022 | 1.000–1.045 | 0.054 |
| KPS (≥ 70 vs. < 70 vs.) | 0.841 | 0.454–1.559 | 0.582 | |||
| The 8-CpG signature (high vs. low) | 2.911 | 1.916–4.421 | <0.001 | 2.462 | 1.600–3.788 | <0.001 |
| MGMT methylation status (methylated vs. unmethylated) | 0.411 | 0.267–0.634 | <0.001 | 0.436 | 0.278–0.683 | <0.001 |
| Gene expression subtype (proneural vs. non-pronerual) | 0.804 | 0.488–1.327 | 0.394 | |||
| Extent of surgery (total or partial or biopsy) | 0.834 | 0.600–1.158 | 0.277 | |||
| Bevacizumab at recurrence (yes vs. no) | 0.907 | 0.585–1.408 | 0.665 | |||
| TCGA-GBM (RT/TMZ or RT alone, n = 303a) | ||||||
| Patient age (increasing years) | 1.026 | 1.014–1.038 | <0.001 | 1.014 | 1.002–1.027 | 0.022 |
| The 8-CpG signature (high vs. low) | 2.014 | 1.515–2.679 | <0.001 | 2.112 | 1.567–2.847 | <0.001 |
| MGMT methylation status (methylated vs. unmethylated) | 0.630 | 0.473–0.841 | 0.002 | 0.591 | 0.440–0.795 | <0.001 |
| Gene expression subtype (proneural vs. non-pronerual) | 0.880 | 0.621–1.246 | 0.470 | |||
| Treatment (RT/TMZ vs. RT alone) | 0.343 | 0.252–0.466 | <0.001 | 0.419 | 0.299–0.585 | <0.001 |
| Bevacizumab at any time (yes vs. no) | 0.499 | 0.360–0.693 | <0.001 | 0.736 | 0.517–1.047 | 0.088 |
RAUH = Rennes and Angers University Hospitals; TCGA = The Cancer Genome Atlas; G-CIMP = glioma-CpGs island methylator phenotype; GBM = glioblastoma; KPS = Karnofsky performance score; TMZ = temozolomide; RT = radiotherapy;
aTotally 294 TCGA patients are included for Cox regression analyses after the exclusion of nine patients with follow-up data < one month
In bold are significant results
Clinical and molecular correlations of the RISK subclasses using TCGA multi-platform data
Within TCGA-GBM, correlation with known clinical and molecular features shows that the RISK subclasses are not apparently correlated with gender, MGMT methylation status, and the five non-G-CIMP DNA methylation clusters reported by Brennan et al. (Figure 4 and Suppl. Table S3). However, the defined risk subgroups appear to be correlated with 1) the four gene expression subtypes by Verhaak et al.3 with proneural subtype being more enriched in low-risk tumors and high-risk tumors being largely classical and mesenchymal subtypes; and 2) the pan-glioma subtypes by Ceccarelli et al.5 with Lm6-GBM cluster being highly enriched in low-risk tumors (Figure 4 and Suppl. Table S3). Moreover, low-risk patients are slightly younger than high-risk patients (median age: 60 vs. 62 years old, P = .017; Suppl. Table S3). These correlation features are mostly consistent in non-TCGA samples (Suppl. Fig. S2 and Table S3).
Figure 4.
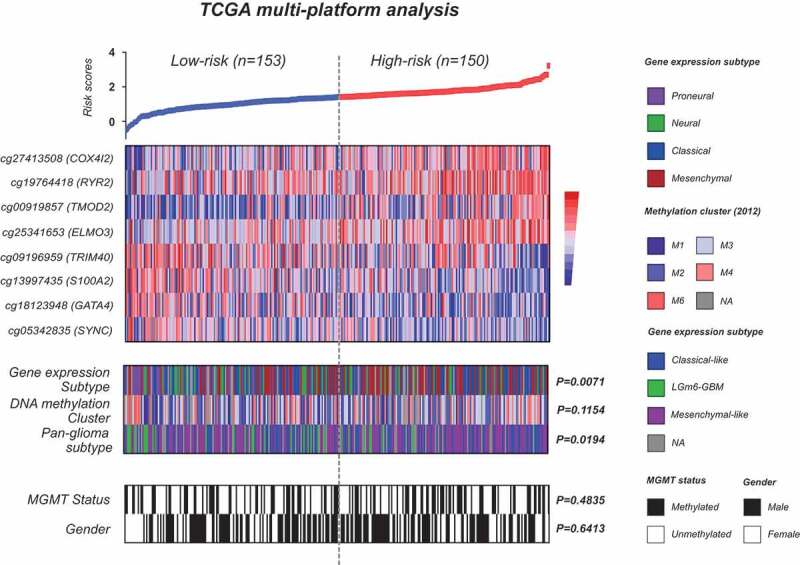
Molecular characterization of the 8-CpGs risk signature using TCGA multi-platform molecular data; heat maps of methylation levels of the eight CpGs; each row represents a CpGs and each column represents a sample which is ordered by its risk score; clinical (e.g., gender) and molecular (e.g., DNA methylation subclasses, gene expression subtypes, and MGMT methylation status) features are indicated in color for each sample; p-value for difference in subgroup distribution is also indicated
For somatic mutations, we identify a total of 99 and 99 significantly mutated genes for each risk subgroup, 57% of which are subgroup-specific (56 for each subgroup; Suppl. Table S4-5). However, there appear to have no recurrent mutations with apparent preferential occurrence for each subgroup (data not shown). For somatic copy number variations (SCNVs), broad-level GISTIC analysis shows that the risk subgroups exhibit quite similar alterations at arm level (Suppl. Fig. S3). However, focal-level analysis reveals a number of distinct regional SCNVs for each risk subgroup; 56% (35 of 63) and 50% (29 of 58) of the focal deleted peaks are specifically observed in the low-risk and high-risk group whilst 27% (9 of 33) and 31% (12 of 39) of the amplified peaks are specific for low-risk and high-risk tumors (Suppl. Fig. S3 and Table S6-7).
The epigenetic subclasses are associated with distinct immune-relevant expression profiles
GSEA on TCGA transcriptome data reveals very distinct expression profiles between the risk subgroups; high-risk tumors appear to be highly enriched with gene sets related to the regulation of immune response and lymphocyte-mediated immunity in particular, as well as NF-κB activity (Figure 5 and Suppl. Table S8) whilst low-risk tumors appear to be enriched with gene sets related to the maintenance of normal brain functions (Suppl. Table S8). GSEA on transcriptome data of non-TCGA samples, including non-G-CIMP GBMs and IDHwt LGGs, yields consistent and significant results (Figure 5 and Suppl. Table S8). ssGSEA confirmed the differential statues of the representative gene sets between the risk subgroups across each dataset (Suppl. Fig. S4). In addition, DEmiRs are calculated from TCGA-GBM; totally we identify 28 DEmiRs between the risk subgroups, of which 6 miRs are relatively upregulated in high-risk tumors, with 5 being reported to have roles in immunity, and 22 miRs are relatively upregulated in low-risk tumors, with 13 being involved in neuroglial cell development and differentiation (Suppl. Fig. S5). However, CIBERSORTx analysis estimates that the 22 types of tumor-infiltrating immune cells are evenly distributed between the risk subgroups both in TCGA and non-TCGA samples (Suppl. Fig. S6). In summary, the above data reveal the potential linkages of the epigenetic subclasses to distinct immune-related transcriptional profiles of tumor bulks in available datasets of not only non-G-CIMP GBMs, but also IDHwt LGGs, which may not be conferred by differential abundance of the tumor-infiltrating immune cells in bulk samples.
Figure 5.
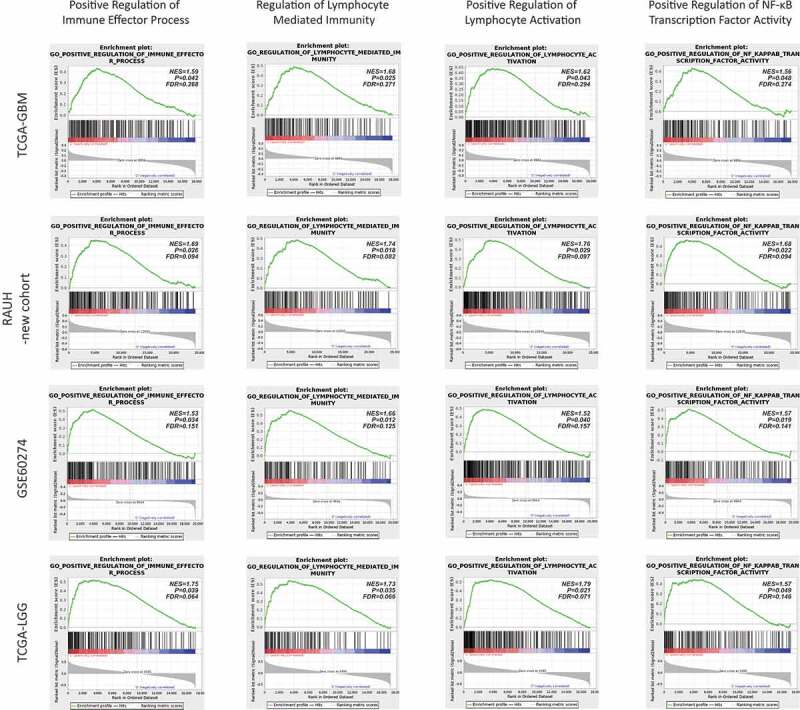
Representative GSEA enrichment plots of the highly enriched gene sets (e.g., immune-relevant and NF-κB activation-relevant gene sets) in high-risk tumors across each dataset; NES = normalized enrichment score; FDR = false discovery rate
S100A2 appears to be epigenetically allowed for up-regulation and contribute to cell proliferation, invasiveness, migration, and immunosuppression in GBM cells
To gain biological insight into the multimarker epigenetic signature, we select one of the 8 CpGs (cg13997435) for further analysis (Figure 1c). This single CpG is located at the non-CGI transcriptional regulatory region of the gene S100A2. The CpG methylation is decreased with tumor grade and is significantly hypomethylated in GBMs (Figure 6a,b). The CpG methylation is also decreased in non-G-CIMP (or IDHwt) gliomas as compared to those G-CIMP (or IDHmut) tumors (Figure 6c). Correspondingly, S100A2 expression is increased with tumor grade and is up-regulated in gliomas of grade III and IV (Figure 6d,e). S100A2 expression is also increased in non-G-CIMP (or IDHwt) gliomas as compared to those G-CIMP (or IDHmut) tumors (figure 6f). Immunofluorescence staining on gliomas of different grades confirms the increased S100A2 protein levels with tumor grade (Figure 6g). Moreover, the CpG methylation is consistently and significantly in negative correlation with S100A2 expression in each database (Figure 6h). These data suggest the possibility of an epigenetic regulatory role of the single CpG methylation on S100A2 expression. In GBM cell lines, the CpG is almost unmethylated whilst S100A2 is expressed in various levels (Figure 6i–k). S100A2 is also associated with high variability in gene expression for tumor-NTB comparison (all P < .001, Figure 6d,e). The data together indicate that the up-regulation of S100A2 may be epigenetically initiated by loss of non-CGI methylation, but ultimately determined by other transcriptional regulatory machineries, dependent on distinct molecular backgrounds of tumor cells.
Figure 6.
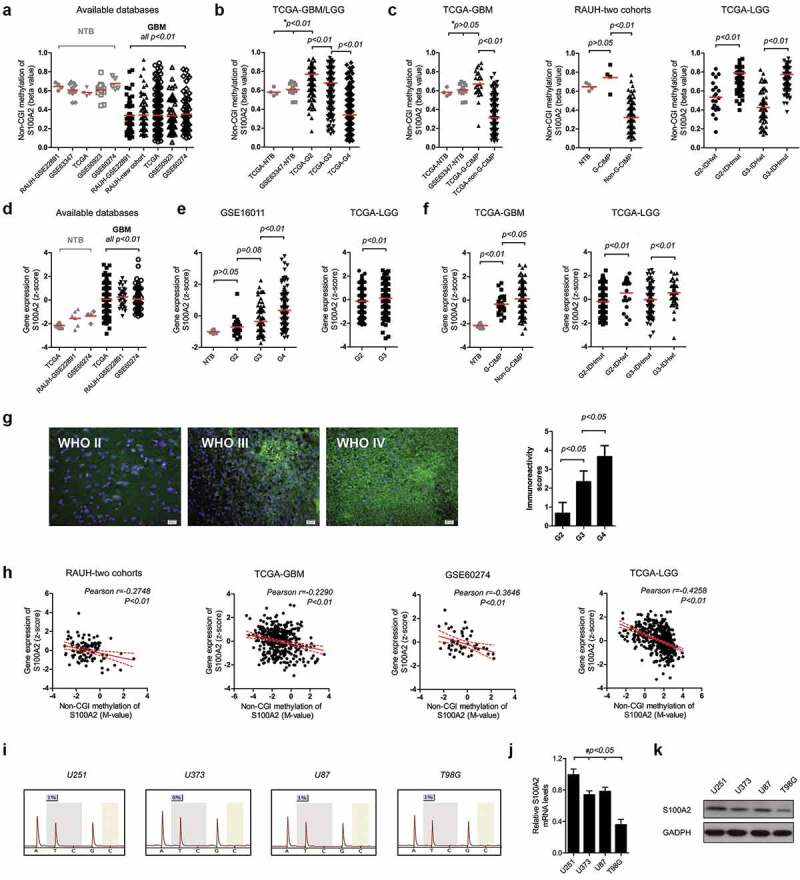
DNA methylation and gene expression of S100A2; the single CpG methylation levels of S100A2 among (a) GBMs (non-G-CIMP and G-CIMP collectively) and NTBs; (b) gliomas of grade II to IV and NTBs; (c) gliomas with G-CIMP (IDHmut) and non-G-CIMP (IDHwt); Gene expression patterns of S100A2 among (d) GBMs (non-G-CIMP and G-CIMP collectively) and NTBs; (e) gliomas of grade II to IV and NTBs; and (f) gliomas with G-CIMP (IDHmut) and non-G-CIMP (IDHwt); (g) Representative S100A2 immunofluorescence staining (left) and the immunoreactivity scores (right) for FFPE samples of gliomas from grade II to IV; (h) Correlation of the single CpG methylation and gene expression of S100A2 in each database; (i) S100A2 single CpG pyrosequencing data in each GBM cell line; (j, k) Real-time PCR and western blots of S100A2 in each GBM cell line; * indicates both the comparison of tumors from TCGA vs. NTB from TCGA and GSE63347 respectively; # indicates each comparison of U251 vs. U373 (or U87 or T98G); NTBs = non-tumor brains; G-CIMP = glioma-CpG island methylator phenotype; IDHmut = IDH mutation; IDHwt = IDH wild type; GBM = glioblastoma; LGG = lower-grade glioma; FFPE = formalin-fixed paraffin-embedded
Knockdown of S100A2 by two different shRNA sequences reduces the proliferation rates of U251 and U87 cells (Figure 7a,i). Cell cycle analysis confirms that S100A2 down-regulation in U251 and U87 cells apparently decreases the proportion of S phase and increased the proportion of G2/M phase (Figure 7b,j). Flow cytometric analysis shows that depletion of S100A2 initiates apoptosis in U251 and U87 cells (Figure 7c,k). Moreover, S100A2 knockdown inhibits the migration and invasion rates of U251 and U87 cells (Figure 7d,e,l,m) Western blot shows that the decreased S100A2 is associated with decreased activity of NF-κB in U251 and U87 cells (figure 7f,n).To investigate the relevance of S100A2 to glioma-mediated immunosuppression, we correlate the mRNA levels of S100A2 with a set of glioma-related immunosuppressive factors (reviewed by Nduom et al.26) using TCGA data (data not shown). We find that only the mRNA levels of S100A2 and FGL2, a key hub of glioma-mediated immunosuppression,27 are significantly in positive correlation (Pearson r = 0.3028, p < .01; Suppl. Fig. S7). In vitro experiments further validate that S100A2 knockdown reduces the expression of FGL2 in U251 and U87 cells (figure 7f-h).n-p The above data suggested that S100A2 may contribute to tumor proliferation, invasiveness, migration, and immunosuppression in GBMs.
Figure 7.
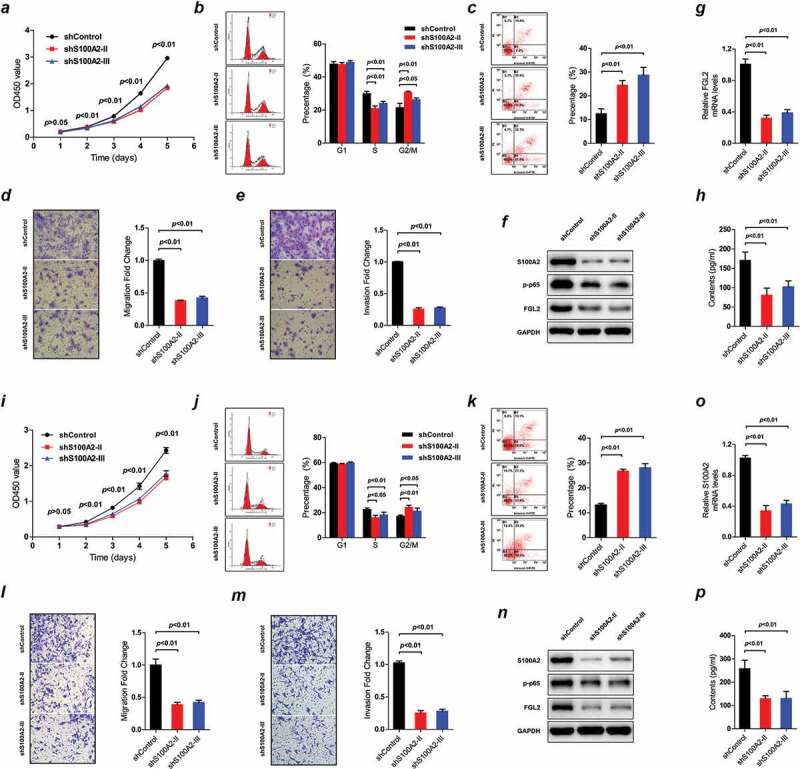
The impacts of S100A2 expression on GBM cell lines, i.e., U251 (a–h) and U87 (i–p); Cell proliferation by CCK-8 assay in U251 (a) and U87 (i); Cell cycle alterations by PI-FACS analysis in U251 (b) and U87 (j); Cell apoptosis by Annexin V-FITC/PI double-staining method in U251 (c) and U87 (k); Cell migration by Transwell Chamber assay in U251 (d) and U87 (l); Cell invasion by Matrigel Chamber assay in U251 (e) and U87 (m); Western blots of the protein levels of S100A2, p-p65 and FGL2 in U251 (f) and U87 (n); Real-time PCR of S100A2 expression in U251 (g) and U87 (o); Protein levels of FGL2 in cell culture supernatants of U251 (h) and U87 (p) by ELISA assay; PI-FACS = propidium iodide-flow cytometric analysis; ELISA = enzyme-linked immunosorbent assay
Discussion
Molecular marks with high clinically informative value are of crucial use in precision oncology.28 DNA methylation has long been the leading candidate for cancer biomarker development as it has many advantages over genetic- or expression-based information such as having reliable DNA samples, altered patterns that have stability, tolerance of non-tumor cell contamination, multi-level biological relevance, and drug-induced reversibility.29 There have been precedents of DNA methylation as more powerful indicator than other molecular information, such as methylation status of MGMT for prediction of TMZ outcome,30 and hypermethylation of the glutathione S-transferase (GSTP1) for detection of prostate cancer.31 Those single-gene (or locus) epigenetic marks have provided critical but limited information. Therefore, the development of powerful prognostic indicator that could take advantage of high-throughput DNA methylation data will be greatly helpful for refining cancer patient management.
Recent whole-genome epigenetic studies have identified a molecularly and clinically distinct subgroup of GBMs with G-CIMP phenotype, characteristic of IDH mutations, concordant DNA methylation at a large number of loci and favorable prognosis. However, the clinical and molecular correlations of DNA methylation variations among the majority (about 90%) of non-G-CIMP subsets remained largely unclear.9,10 In this study, the Illumina 450k array provided a dramatic increase in the genomic coverage of CpGs compared to the 27k array. However, only a limited number of samples were available with Illumina 450k data. To ensure that there were enough samples to employ a discovery-validation approach, we decided to limit CpGs to those that appeared both on the 27k and 450k arrays, at the expense of higher genomic coverage. By employing the high-throughput DNA methylation microarray data and the stricter multistep selection strategy, we identified a total of eight highly informative CpGs, each of which strongly prognosticates survival of non-G-CIMP GBMs, independent of age, treatment, MGMT methylation status, and other identified CpGs. To coordinate these 8 CpGs, a RISK score algorithm was used to produce a multimarker signature. Applying the signature to different validation cohorts of various treatments showed that it was a general and independent prognostic biomarker for non-G-CIMP GBMs, which could provide information on the likely outcome of those tumors regardless of treatment. Given the remarkable molecular and clinical similarity of LGGs with IDHwt to primary non-G-CIMP GBMs by recent studies, which greatly supported the potential inclusion of this LGGs subtype within the broad spectrum of GBM-related clinical investigation and biomarker validation,5 we also expanded the GBM-derived epigenetic signature into two cohorts of IDHwt LGGs, and validated its prognostic nature in the similar molecular background. Together the epigenetic RISK signature may represent a promising prognosticator for diffuse gliomas without G-CIMP phenotype or IDH mutations.
Treatment decision can be highly complicated toward the heterogeneous population of GBM patients, and especially for those unmethylated MGMT tumors and the elderly subpopulation.32,33 The combination of RT and TMZ has been generally standard of care for newly diagnosed GBMs.34 However, aggressive combination treatment conferred very limited benefits for unmethylated MGMT tumors, and was commonly accompanied with high risk of unaffordable cost and drug toxicity.30 The treatment decision could thus be complicated in the subset of unmethylated MGMT tumors. The treatment choice for elderly subpopulation could also be complex due to their distinct physical and psychological conditions such as overall poor physical status, common presence of co-morbidity, decreased tolerance to effective therapy, and expectation shifts from longer survival to better quality of life.32,33,35 The discovery of highly informative biomarkers for refining risk subclassification may represent a straightforward approach for improving individualized management for those GBM subgroups, in addition to the development of novel targeted and effective treatments. In our study, the 8-CpGs RISK signature showed good performance in the subgroups with unmethylated MGMT tumors or with older ages, where it could effectively distinguish patients with low risk or high risk of unfavorable prognosis. Moreover, it could render refined risk classification for GBM subgroups defined by other clinically relevant factors such as treatment and intrinsic gene expression subtype. Therefore, we propose that the incorporation of this multi-marker biomarker testing to current risk classification scheme could provide more precise prediction for individual prognosis, and be helpful for guiding clinical choice toward more specified GBM subpopulation.
Contrary to the notion that the central nervous system (CNS) was immunologically privileged, it is now apparent that the CNS is capable of orchestrating intense immune responses with innate and adaptive immune systems.36 Increasing studies have highlighted the determinant roles of local immune response in glioma phenotype and prognosis.36,37 In this study, we evaluated the transcriptional profiles underlying the epigenetic subclasses and revealed a potential correlation between the epigenetic RISK signature and immune phenotypes of GBM samples. Specifically, epigenetically defined high-risk tumors appeared to have an enhanced immune phenotype with highly enriched expressions of a variety of validated gene sets related to the regulation of immune response and lymphocyte-mediated immunity in particular, which is less likely to be attributed by differential abundance of tumor-infiltrating immune cells in glioma microenvironment. Previous studies have shown that epigenetic alterations could be used by tumor cells to impair their immunogenicity and immune recognition via DNA hypermethylation and epigenetically silencing the expression of key molecules required for efficient tumor-host immune interaction, and to establish intense immune responses via DNA hypomethylation and epigenetically activating immune-relevant genes or other unknown mechanisms.38 Our study suggested that the epigenetic alterations of the 8-CpGs panel may be responsible (at least an indicator) for the enhanced immune phenotypes of GBM bulks.
Immune-based therapy is now under extensive investigation as a promising combinatorial approach to standard treatment for gliomas; however, it exhibited very variable anti-tumor effects.39 It is known that current immunotherapy and immune-checkpoint blockers in particular will be only effective for tumors with a preexisting active immune response.40 Many studies have proposed that transcriptional profiles associated with immune activation could be helpful for distinguishing GBM patients who will benefit from immunotherapy. In this study, the epigenetic RISK signature has been shown to consistently correlate with distinct expression profiles of immune signatures, and in particular the epigenetically defined high-risk tumors exhibited an enhanced immune phenotype, indicating the potential of our epigenetic signature for predicting response to immunotherapy. In addition, epigenetic drugs have been reported to modulate immune phenotypes of cancer cells, indicating a synergistic anti-tumor effect by its combination with immunotherapy.38 In this sense, DNA methylation-based immune parameters could also be helpful for guiding combinatorial epigenetic immunotherapy. Taken all, our epigenetic signature may be a promising biomarker candidate for optimizing individual choice of immune-based therapy; biological and clinical validations, however, are needed to establish definitive conclusion.
In our study, the biological implications of the multimarker signature were preliminarily exemplified by one CpG component and its relevant gene S100A2. S100A2 is a member of S100 family, encoding an EF hand calcium-binding protein that regulates protein phosphorylation, cytoskeletal components, and calcium homeostasis. Aberrant alterations in DNA methylation and gene expression of S100A2 have been widely reported in various cancers,27,41,42 exhibiting a protumorigenic role with DNA hypomethylation-induced gene avtivation in some cancers (e.g., ovarian and pancreatic cancers) whist a tumor suppressor role with promoter hypermethylation-associated silencing of S100A2 in other cancers (e.g., prostate and breast cancers). In this study, S100A2 expression was found to be increased with glioma grade, and negatively correlated with the single CpG methylation at non-CGI region. It is also noted that S100A2 appear to be expressed with high variability in GBM cells or samples with unmethylated CpG, which indicates the permissive but not determinant role of non-CGI DNA hypomethylation in gene re-expression. In vitro experimental data showed that S100A2 knockdown reduced cell proliferation by arresting the cell cycle at the G2/M phase but not at the S phase, promoted cell apoptosis, and inhibited cell invasion and migration in GBM cell lines. All those data supported a potent GBM-promoting role of S100A2. Interestingly, reduced expression of S100A2 was found to be associated with reduced NF-κB activity in GBM cell lines. Increased evidence has shown that NF-κB activation is a major driver for malignant progression of GBMs. Therefore, the pro-tumor role of S100A2 might be due to its regulatory effects on NF-κB activity in GBMs.43 The cellular experiment results were mostly in consistent with GSEA results; high-risk tumors (with higher S100A2 expression; data not shown) in each dataset were mostly enriched with gene sets relevant to the regulation of cell-cell adhesion, cell migration, apoptotic pathway, and NF-κB activity. Considering the immune implications of the epigenetic signature, we also tested the transcriptional correlation of S100A2 on a reported set of glioma-related immunosuppressive factors, and identified a co-expression pattern of S100A2 and FGL2, a multimodality regulator of glioma-mediate immune suppression.27 FGL2 has been reported to have multiple roles in tumor immune suppression via modulating M2 polarization, T cell subpopulation and immune checkpoints.27 Despite not knowing the molecular mechanism of S100A2 on expression of FGL2, it is reasoned that the epigenetic signature may have impacts on GBM cell immunity partially via influencing FGL2 activity. Gene related to other identified CpGs have also been reported to have implications in immunity and cancer including gliomas such as COX4I2,44 ELMO3,45 TRIM40,46,47 and GATA4.48,49 Future studies will be needed to explore the biological relevance of the specific molecular mechanism of S100A2 on FGL2 expression and glioma immunity, and the biological relevance of other identified CpGs and relevant genes.
Finally, increasing studies50–52 have highlighted the contributing roles of cancer-linked DNA hypomethylation of gene regions in cancer formation and progression. In our study, among the 8 highly informative CpGs, we found that the three non-CGI CpGs were hypomethylated and predicted poor prognosis in non-G-CIMP GBMs, indicating protective roles of DNA methylation at those sites, unlike DNA hypermethylation at CGI-associated promoter of tumor suppressor genes as cancer risk factor. The findings together raised new concerns against the current demethylation-based epigenetic therapy as they may have adverse therapeutic effects by exacerbating cancer-linked DNA hypomethylation. Targeted epigenetic drugs that have distinguish effects on cancer-specific DNA hypermethylation and hypomethylation may represent a rational therapeutic approach, which needs further investigation.
In summary, we developed and validated the epigenetic RISK signature of 8 CpGs as a promising prognostic biomarker with potential value for refining the current risk classification of non-G-CIMP GBMs; the epigenetic signature may confer differential immune-relevant phenotypes to GBMs, highlighting its potential role in guiding individualized immunotherapy; the glioma-promoting and immunosuppressive activity of S100A2, expression of which appeared to be epigenetically permissive by DNA hypomethylation of one of the identified CpGs, provided biological evidence of the prognostic RISK signature. Future studies are needed to 1) validate the prognostic value in a prospective manner; 2) test the guiding potential to glioma immunotherapy; and 3) explore the biological and molecular mechanisms underlying the epigenetic signature.
Supplementary Material
Acknowledgments
We gratefully acknowledge all the patients who agreed to participate in this study and to those who have provided their medical care. We gratefully acknowledge Dr. Menei, Dr. Le Reste, Dr. Vauleon, Dr. Quillien, and the Tumor Banks from Angers and Rennes for their constant support in the collection, processing and histological analysis of tumor samples. We also gratefully thank those who are willing to share valuable scientific data (Dr. Rose K Lai and Prof. Jill Barnholtz-Sloan). I (AAY) want to thank my newborn daughter (Jiayan Yin) and my wife (Dr. Yu Dong) for their great support. The results published here are in part based upon data generated by The Cancer Genome Atlas, German Cancer Research Center, the Gene Expression Omnibus, and the research teams mentioned in this study.
Funding Statement
This work was partially funded by grants from National Natural Science Foundation of China (No. 81402049, 81802486), China Postdoctoral Science Foundation (No.2019M653971), Shandong Province Natural Science Foundation (No.ZR2020QH0233), the President Foundation of the 960th Hospital of PLA (No.2018QN04) and by Grants from the Brittany Region (France) et the FEDER (Europe).
Disclosure of Potential Conflicts of Interest
The authors declare no conflict of interest
Ethical approval
All procedures performed in studies involving human were in accordance with the ethical standards of the institutional research committee and with the 1964 Helsinki declaration and its later amendments or comparable ethical standards
Informed consent
Informed consent was obtained for all participants from the Neurosurgery Departments of Rennes and Angers University Hospitals and from the Department of Neurosurgery, Xijing hospital.
Author contributions
Conception and design of the study: AAY, YD, and XZ. Provision of study material or patients: AE, MA, JM and WL. Collection and assembly of data: AAY, AE, YLH, JM, NL, and ZDS. Analysis and interpretation of data: AAY, ZDS, and YD. Manuscript writing: All authors. Final approval of manuscript: All authors.
Supplementary material
Supplemental data for this article can be accessed on the publisher’s website.
References
- 1.Wen PY, Kesari S.. Malignant gliomas in adults. N Engl J Med. 2008;359(5):492–14. doi: 10.1056/NEJMra0708126. [DOI] [PubMed] [Google Scholar]
- 2.Yin AA, Cheng JX, Zhang X, Liu B-L. The treatment of glioblastomas: a systematic update on clinical Phase III trials. Crit Rev Oncol Hematol. 2013;87(3):265–282. doi: 10.1016/j.critrevonc.2013.01.007. [DOI] [PubMed] [Google Scholar]
- 3.Verhaak RG, Hoadley KA, Purdom E, Wang V, Qi Y, Wilkerson MD, Miller CR, Ding L, Golub T, Mesirov JP, et al. Integrated genomic analysis identifies clinically relevant subtypes of glioblastoma characterized by abnormalities in PDGFRA, IDH1, EGFR, and NF1. Cancer Cell. 2010;17:98–110. doi: 10.1016/j.ccr.2009.12.020. [DOI] [PMC free article] [PubMed] [Google Scholar]
- 4.Brennan CW, Verhaak RG, McKenna A, Campos B, Noushmehr H, Salama S, Zheng S, Chakravarty D, Sanborn J, Berman S, et al. The somatic genomic landscape of glioblastoma. Cell. 2013;155:462–477. doi: 10.1016/j.cell.2013.09.034. [DOI] [PMC free article] [PubMed] [Google Scholar]
- 5.Ceccarelli M, Barthel FP, Malta TM, Sabedot TS, Salama SR, Murray BA, Morozova O, Newton Y, Radenbaugh A, Pagnotta SM, et al. Molecular profiling reveals biologically discrete subsets and pathways of progression in diffuse glioma. Cell. 2016;164:550–563. doi: 10.1016/j.cell.2015.12.028. [DOI] [PMC free article] [PubMed] [Google Scholar]
- 6.Esteller M. Epigenetics in cancer. N Engl J Med. 2008;358:1148–1159. doi: 10.1056/NEJMra072067. [DOI] [PubMed] [Google Scholar]
- 7.Rodriguez-Paredes M, Esteller M. Cancer epigenetics reaches mainstream oncology. Nat Med. 2011;17(3):330–339. doi: 10.1038/nm.2305. [DOI] [PubMed] [Google Scholar]
- 8.Timp W, Bravo HC, McDonald OG, Goggins M, Umbricht C, Zeiger M, Feinberg AP, Irizarry RA. Large hypomethylated blocks as a universal defining epigenetic alteration in human solid tumors. Genome Med. 2014;6(8):61. doi: 10.1186/s13073-014-0061-y. [DOI] [PMC free article] [PubMed] [Google Scholar]
- 9.Noushmehr H, Weisenberger DJ, Diefes K, Phillips HS, Pujara K, Berman BP, Pan F, Pelloski CE, Sulman EP, Bhat KP, et al. Identification of a CpG island methylator phenotype that defines a distinct subgroup of glioma. Cancer Cell. 2010;17(5):510–522. doi: 10.1016/j.ccr.2010.03.017. [DOI] [PMC free article] [PubMed] [Google Scholar]
- 10.Sturm D, Witt H, Hovestadt V, Khuong-Quang D-A, Jones DW, Konermann C, Pfaff E, Tönjes M, Sill M, Bender S, et al. Hotspot mutations in H3F3A and IDH1 define distinct epigenetic and biological subgroups of glioblastoma. Cancer Cell. 2012;22:425–437. doi: 10.1016/j.ccr.2012.08.024. [DOI] [PubMed] [Google Scholar]
- 11.Etcheverry A, Aubry M, De Tayrac M, Vauleon E, Boniface R, Guenot F, Saikali S, Hamlat A, Riffaud L, Menei P, et al. DNA methylation in glioblastoma: impact on gene expression and clinical outcome. BMC Genomics. 2010;11:701. doi: 10.1186/1471-2164-11-701. [DOI] [PMC free article] [PubMed] [Google Scholar]
- 12.Yin A, He Y, Etcheverry A, Liu Y-H, Aubry M, Barnholtz-Sloan J, Liu B-L, Mosser J, Lu Z-F, Zhang X, et al. Novel predictive epigenetic signature for temozolomide in non-G-CIMP glioblastomas. Clin Epigenetics. 2019;11(1). doi: 10.1186/s13148-019-0670-9. [DOI] [PMC free article] [PubMed] [Google Scholar]
- 13.Lai RK, Chen Y, Guan X, Nousome D, Sharma C, Canoll P, Bruce J, Sloan AE, Cortes E, Vonsattel J-P, et al. Genome-wide methylation analyses in glioblastoma multiforme. PLoS One. 2014;9(2):e89376. doi: 10.1371/journal.pone.0089376. [DOI] [PMC free article] [PubMed] [Google Scholar]
- 14.Kurscheid S, Bady P, Sciuscio D, Samarzija I, Shay T, Vassallo I, Criekinge WV, Daniel RT, Van Den Bent MJ, Marosi C, et al. Chromosome 7 gain and DNA hypermethylation at the HOXA10 locus are associated with expression of a stem cell related HOX-signature in glioblastoma. Genome Biol. 2015;16(1):16. doi: 10.1186/s13059-015-0583-7. [DOI] [PMC free article] [PubMed] [Google Scholar]
- 15.Van Den Bent MJ, Erdem-Eraslan L, Idbaih A, De Rooi J, Eilers PHC, Spliet WGM, Den Dunnen WFA, Tijssen C, Wesseling P, Sillevis Smitt PAE, et al. MGMT-STP27 methylation status as predictive marker for response to PCV in anaplastic oligodendrogliomas and oligoastrocytomas. A Report from EORTC Study 26951. Clin Cancer Res. 2013;19:5513–5522. doi: 10.1158/1078-0432.CCR-13-1157. [DOI] [PubMed] [Google Scholar]
- 16.Horvath S, Garagnani P, Bacalini MG, Pirazzini C, Salvioli S, Gentilini D, Di Blasio AM, Giuliani C, Tung S, Vinters HV, et al. Accelerated epigenetic aging in down syndrome. Aging Cell. 2015;14(3):491–495. doi: 10.1111/acel.12325. [DOI] [PMC free article] [PubMed] [Google Scholar]
- 17.Johnson WE, Li C, Rabinovic A. Adjusting batch effects in microarray expression data using empirical Bayes methods. Biostatistics. 2007;8(1):118–127. doi: 10.1093/biostatistics/kxj037. [DOI] [PubMed] [Google Scholar]
- 18.Lawrence MS, Stojanov P, Polak P, Kryukov GV, Cibulskis K, Sivachenko A, Carter SL, Stewart C, Mermel CH, Roberts SA, et al. Mutational heterogeneity in cancer and the search for new cancer-associated genes. Nature. 2013;499(7457):214–218. doi: 10.1038/nature12213. [DOI] [PMC free article] [PubMed] [Google Scholar]
- 19.Mermel CH, Schumacher SE, Hill B, Meyerson ML, Beroukhim R, Getz G. GISTIC2.0 facilitates sensitive and confident localization of the targets of focal somatic copy-number alteration in human cancers. Genome Biol. 2011;12(4):R41. doi: 10.1186/gb-2011-12-4-r41. [DOI] [PMC free article] [PubMed] [Google Scholar]
- 20.Bady P, Sciuscio D, Diserens AC, Bloch J, Van Den Bent MJ, Marosi C, Dietrich P-Y, Weller M, Mariani L, Heppner FL, et al. MGMT methylation analysis of glioblastoma on the Infinium methylation BeadChip identifies two distinct CpG regions associated with gene silencing and outcome, yielding a prediction model for comparisons across datasets, tumor grades, and CIMP-status. Acta Neuropathol. 2012;124(4):547–560. doi: 10.1007/s00401-012-1016-2. [DOI] [PMC free article] [PubMed] [Google Scholar]
- 21.Subramanian A, Tamayo P, Mootha VK, Mukherjee S, Ebert BL, Gillette MA, Paulovich A, Pomeroy SL, Golub TR, Lander ES, et al. Gene set enrichment analysis: a knowledge-based approach for interpreting genome-wide expression profiles. Proc Natl Acad Sci U S A. 2005;102(43):15545–15550. doi: 10.1073/pnas.0506580102. [DOI] [PMC free article] [PubMed] [Google Scholar]
- 22.Newman AM, Steen CB, Liu CL, Gentles AJ, Chaudhuri AA, Scherer F, Khodadoust MS, Esfahani MS, Luca BA, Steiner D, et al. Determining cell type abundance and expression from bulk tissues with digital cytometry. Nat Biotechnol. 2019;37(7):773. doi: 10.1038/s41587-019-0114-2. [DOI] [PMC free article] [PubMed] [Google Scholar]
- 23.Zhang LH, Yin AA, Cheng JX, Huang H-Y, Li X-M, Zhang Y-Q, Han N, Zhang X. TRIM24 promotes glioma progression and enhances chemoresistance through activation of the PI3K/Akt signaling pathway. Oncogene. 2015;34(5):600–610. doi: 10.1038/onc.2013.593. [DOI] [PubMed] [Google Scholar]
- 24.Macdonald DR, Cascino TL, Schold SJ, Cairncross JG. Response criteria for phase II studies of supratentorial malignant glioma. J Clin Oncol. 1990;8(7):1277–1280. doi: 10.1200/JCO.1990.8.7.1277. [DOI] [PubMed] [Google Scholar]
- 25.Wen PY, Macdonald DR, Reardon DA, Cloughesy TF, Sorensen AG, Galanis E, DeGroot J, Wick W, Gilbert MR, Lassman AB, et al. Updated response assessment criteria for high-grade gliomas: response assessment in neuro-oncology working group. J Clin Oncol. 2010;28(11):1963–1972. doi: 10.1200/JCO.2009.26.3541. [DOI] [PubMed] [Google Scholar]
- 26.Nduom EK. Weller M and Heimberger AB, Immunosuppressive mechanisms in glioblastoma. Neuro Oncol. 2015;17 Suppl 7:i9–14. doi: 10.1093/neuonc/nov151. [DOI] [PMC free article] [PubMed] [Google Scholar]
- 27.Yan J, Kong LY, Hu J, Gabrusiewicz K, Dibra D, Xia X, Heimberger AB, Li S. FGL2 as a multimodality regulator of tumor-mediated immune suppression and therapeutic target in gliomas. J Natl Cancer Inst. 2015;107. doi: 10.1093/jnci/djv137. [DOI] [PMC free article] [PubMed] [Google Scholar]
- 28.Roychowdhury S, Chinnaiyan AM. Translating cancer genomes and transcriptomes for precision oncology. CA Cancer J Clin. 2016;66:75–88. doi: 10.3322/caac.21329. [DOI] [PMC free article] [PubMed] [Google Scholar]
- 29.Issa JP. DNA methylation as a clinical marker in oncology. J Clin Oncol. 2012;30:2566–2568. doi: 10.1200/JCO.2012.42.1016. [DOI] [PubMed] [Google Scholar]
- 30.Hegi ME, Diserens AC, Gorlia T, Hamou M-F, De Tribolet N, Weller M, Kros JM, Hainfellner JA, Mason W, Mariani L, et al. MGMT gene silencing and benefit from temozolomide in glioblastoma. N Engl J Med. 2005;352:997–1003. doi: 10.1056/NEJMoa043331. [DOI] [PubMed] [Google Scholar]
- 31.Lee WH, Morton RA, Epstein JI, Brooks JD, Campbell PA, Bova GS, Hsieh WS, Isaacs WB, Nelson WG. Cytidine methylation of regulatory sequences near the pi-class glutathione S-transferase gene accompanies human prostatic carcinogenesis. Proc Natl Acad Sci U S A. 1994;91:11733–11737. doi: 10.1073/pnas.91.24.11733. [DOI] [PMC free article] [PubMed] [Google Scholar]
- 32.Yin AA, Zhang LH, Cheng JX, Dong Y, Liu BL, Han N, Zhang X. The predictive but not prognostic value of MGMT promoter methylation status in elderly glioblastoma patients: a meta-analysis. PLoS One. 2014;9:e85102. doi: 10.1371/journal.pone.0085102. [DOI] [PMC free article] [PubMed] [Google Scholar]
- 33.Yin AA, Zhang LH, Cheng JX, Dong Y, Liu BL, Han N, Zhang X. Radiotherapy plus concurrent or sequential temozolomide for glioblastoma in the elderly: a meta-analysis. PLoS One. 2013;8:e74242. doi: 10.1371/journal.pone.0074242. [DOI] [PMC free article] [PubMed] [Google Scholar]
- 34.Stupp R, Mason WP, Van Den Bent MJ, Weller M, Fisher B, Taphoorn MJB, Belanger K, Brandes AA, Marosi C, Bogdahn U, et al. Radiotherapy plus concomitant and adjuvant temozolomide for glioblastoma. N Engl J Med. 2005;352:987–996. doi: 10.1056/NEJMoa043330. [DOI] [PubMed] [Google Scholar]
- 35.Yin AA, Cai S, Dong Y, Zhang L-H, Liu B-L, Cheng J-X, Zhang X. A meta-analysis of temozolomide versus radiotherapy in elderly glioblastoma patients. J Neurooncol. 2014;116:315–324. doi: 10.1007/s11060-013-1294-0. [DOI] [PubMed] [Google Scholar]
- 36.Perng P, Lim M. Immunosuppressive mechanisms of malignant gliomas: parallels at non-CNS sites. Front Oncol. 2015;5:153. doi: 10.3389/fonc.2015.00153. [DOI] [PMC free article] [PubMed] [Google Scholar]
- 37.Cheng W, Ren X, Zhang C, Cai J, Liu Y, Han S, Wu A. Bioinformatic profiling identifies an immune-related risk signature for glioblastoma. Neurology. 2016;86(24):2226–2234. doi: 10.1212/WNL.0000000000002770. [DOI] [PubMed] [Google Scholar]
- 38.Maio M, Covre A, Fratta E, Di Giacomo AM, Taverna P, Natali PG, Coral S, Sigalotti L. Molecular pathways: at the crossroads of cancer epigenetics and immunotherapy. Clin Cancer Res. 2015;21(18):4040–4047. doi: 10.1158/1078-0432.CCR-14-2914. [DOI] [PubMed] [Google Scholar]
- 39.Ampie L, Woolf EC, Dardis C. Immunotherapeutic advancements for glioblastoma. Front Oncol. 2015;5:12. doi: 10.3389/fonc.2015.00012. [DOI] [PMC free article] [PubMed] [Google Scholar]
- 40.Pardoll DM. The blockade of immune checkpoints in cancer immunotherapy. Nat Rev Cancer. 2012;12:252–264. doi: 10.1038/nrc3239. [DOI] [PMC free article] [PubMed] [Google Scholar]
- 41.Dreyer SB, Pinese M, Jamieson NB, Scarlett CJ, Colvin EK, Pajic M, Johns AL, Humphris JL, Wu J, Cowley MJ, et al. Precision oncology in surgery: patient selection for operable pancreatic cancer. Ann Surg. 2020;272(2):366-76. doi: 10.1097/SLA.0000000000003143. [DOI] [PMC free article] [PubMed] [Google Scholar]
- 42.Masuda T, Ishikawa T, Mogushi K, Okazaki S, Ishiguro M, Iida S, Mizushima H, Tanaka H, Uetake H, Sugihara K. Overexpression of the S100A2 protein as a prognostic marker for patients with stage II and III colorectal cancer. Int J Oncol. 2016;48:975–982. doi: 10.3892/ijo.2016.3329. [DOI] [PMC free article] [PubMed] [Google Scholar]
- 43.Cahill KE, Morshed RA, Yamini B. Nuclear factor-kappaB in glioblastoma: insights into regulators and targeted therapy. Neuro Oncol. 2016;18:329–339. doi: 10.1093/neuonc/nov265. [DOI] [PMC free article] [PubMed] [Google Scholar]
- 44.Sun F, Zhuo R, Ma W, Yang D, Su T, Ye L, Xu D, Wang W. From clinic to mechanism: proteomics-based assessment of angiogenesis in adrenal pheochromocytoma. J Cell Physiol. 2019;234(12):22057–22070. doi: 10.1002/jcp.28769. [DOI] [PubMed] [Google Scholar]
- 45.Michaelsen SR, Aslan D, Urup T, Poulsen H, Grønbæk K, Broholm H, Kristensen L. DNA methylation levels of the ELMO gene promoter CpG Islands in human glioblastomas. Int J Mol Sci. 2018;19(3):679. doi: 10.3390/ijms19030679. [DOI] [PMC free article] [PubMed] [Google Scholar]
- 46.Zhao C, Jia M, Song H, Yu Z, Wang W, Li Q, Zhang L, Zhao W, Cao X. The E3 ubiquitin ligase TRIM40 attenuates antiviral immune responses by targeting MDA5 and RIG-I. Cell Rep. 2017;21:1613–1623. doi: 10.1016/j.celrep.2017.10.020. [DOI] [PubMed] [Google Scholar]
- 47.Noguchi K, Okumura F, Takahashi N, Kataoka A, Kamiyama T, Todo S, Hatakeyama S. TRIM40 promotes neddylation of IKKgamma and is downregulated in gastrointestinal cancers. Carcinogenesis. 2011;32(7):995–1004. doi: 10.1093/carcin/bgr068. [DOI] [PubMed] [Google Scholar]
- 48.Vaitkiene P, Skiriute D, Skauminas K, Tamasauskas A. GATA4 and DcR1 methylation in glioblastomas. Diagn Pathol. 2013;8:7. doi: 10.1186/1746-1596-8-7. [DOI] [PMC free article] [PubMed] [Google Scholar]
- 49.Agnihotri S, Wolf A, Munoz DM, Smith CJ, Gajadhar A, Restrepo A, Clarke ID, Fuller GN, Kesari S, Dirks PB, et al. A GATA4-regulated tumor suppressor network represses formation of malignant human astrocytomas. J Exp Med. 2011;208(4):689–702. doi: 10.1084/jem.20102099. [DOI] [PMC free article] [PubMed] [Google Scholar]
- 50.Ehrlich M. DNA hypomethylation in cancer cells. Epigenomics. 2009;1(2):239–259. doi: 10.2217/epi.09.33. [DOI] [PMC free article] [PubMed] [Google Scholar]
- 51.Oster B, Linnet L, Christensen LL, Thorsen K, Ongen H, Dermitzakis ET, Sandoval J, Moran S, Esteller M, Hansen TF, et al. Non-CpG island promoter hypomethylation and miR-149 regulate the expression of SRPX2 in colorectal cancer. Int J Cancer. 2013;132:2303–2315. doi: 10.1002/ijc.27921. [DOI] [PubMed] [Google Scholar]
- 52.Yin A, Etcheverry A, He Y, Aubry M, Barnholtz-Sloan J, Zhang L, Mao X, Chen W, Liu B, Zhang W, et al. Integrative analysis of novel hypomethylation and gene expression signatures in glioblastomas. Oncotarget. 2017;8(52):89607–89619. doi: 10.18632/oncotarget.19171. [DOI] [PMC free article] [PubMed] [Google Scholar]
Associated Data
This section collects any data citations, data availability statements, or supplementary materials included in this article.