Abstract
We propose a system that is capable of detailed analysis of eye region images in terms of the position of the iris, degree of eyelid opening, and the shape, complexity, and texture of the eyelids. The system uses a generative eye region model that parameterizes the fine structure and motion of an eye. The structure parameters represent structural individuality of the eye, including the size and color of the iris, the width, boldness, and complexity of the eyelids, the width of the bulge below the eye, and the width of the illumination reflection on the bulge. The motion parameters represent movement of the eye, including the up-down position of the upper and lower eyelids and the 2D position of the iris. The system first registers the eye model to the input in a particular frame and individualizes it by adjusting the structure parameters. The system then tracks motion of the eye by estimating the motion parameters across the entire image sequence. Combined with image stabilization to compensate for appearance changes due to head motion, the system achieves accurate registration and motion recovery of eyes.
Keywords: Computer vision, facial image analysis, facial expression analysis, generative eye region model, motion tracking, texture modeling, gradient descent
1. Introduction
IN facial image analysis for expression and identity recognition, eyes are particularly important [1], [2], [3], [4]. Gaze tracking plays a significant role in human-computer interaction [5], [6] and the eye region provides useful biometric information for face and intention recognition [7], [8]. The Facial Action Coding System (FACS [9]), the de facto standard for coding facial muscle actions in behavioral science [10], defines many action units (AUs) for eyes [11], [12].
Automated analysis of facial images has found eyes still to be a difficult target [13], [14], [15], [16], [17], [18], [19], [20], [21]. The difficulty comes from the diversities in the appearance of eyes due to both structural individuality and motion of eyes, as shown in Fig. 1. Past studies have failed to represent these diversities adequately. For example, Tian et al. [22] used a pair of parabolic curves and a circle as a generic eye model, but parabolic curves have too few parameters to represent the complexity of eyelid shape and motion. Statistical models have been deployed to represent such individual differences for the whole eye region [23], [24], [25], but not for subregions, such as the eyelids, due in part to limited variation in training samples.
Fig. 1.
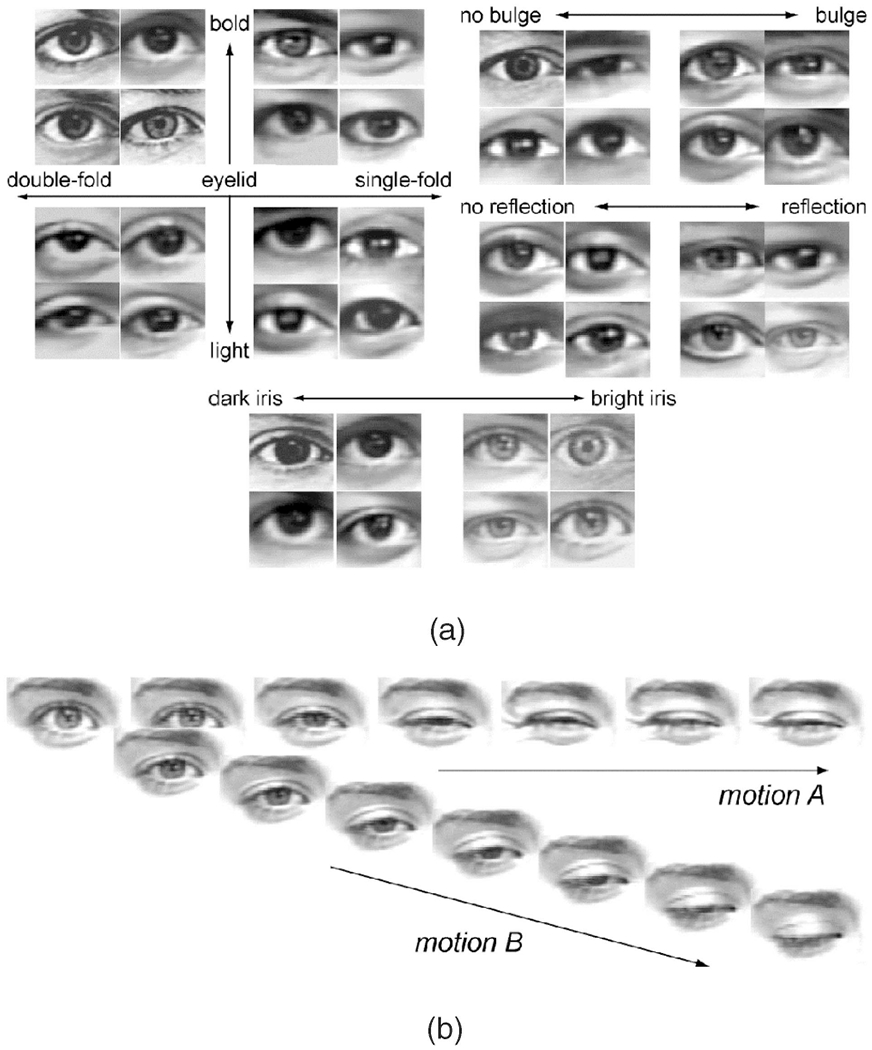
Diversity in the appearance of eye images. (a) Variance from structural individuality. (b) Variance from motion of a particular eye.
In this paper, we propose and evaluate a generative eye region model that can meticulously represent the detailed appearance of the eye region for eye motion tracking. The model parameterizes both the structural individualities and the motions of eyes. Structural individualities include the size and the color of the iris, the width and the boldness of the eyelid, which may have a single or double fold, the width of the bulge below the eye, the furrow below it, and the width of illumination reflection on the bulge. Eye motion includes the up-down positions of upper and lower eyelids and the 2D position of the iris. The input image sequence first is stabilized to compensate for appearance change due to head motion. The system then registers the eye region model to the input eye region and individualizes it by adjusting the structure parameters and accurately tracks the motion of the eye.
2. Eye Region Model
We define a rectangular region around the eye as an eye region for analysis. We exploit a 2D, parameterized, generative model that consists of multiple components corresponding to the anatomy of an eye. These components include the iris, upper and lower eyelids, a white region around the iris (sclera), dark regions near the inner and outer corners of the white region, a bulge below the lower eyelid, a bright region on the bulge, and a furrow below the bulge (the infraorbital furrow). The model for each component is rendered in a separate rectangular layer. When overlaid, these layers represent the eye region as illustrated in Fig. 2. Within each layer, pixels that render a component are assigned color intensities or transparency so that the color in a lower layer appears in the final eye region model if all the upper layers above it have transparent pixels at the same locations. For example, the iris layer (the third layer from the bottom) has a circular region to represent the iris. The eyelid layer (the fourth layer, one above the iris layer) has two curves to represent upper and lower eyelids, in which the region between those curves (palpebral fissure) is transparent while the region above the upper curve and the region below the lower curve are filled with skin color. When the eyelid layer is superimposed over the iris layer, only the portion of the circular region between the eyelid curves appears in the final eye region image while the rest is occluded by the skin pixels in the eyelid layer. When the upper curve in the eyelid layer is lowered, corresponding to eyelid closure, a greater portion of the circular region in the iris layer is occluded.
Fig. 2.
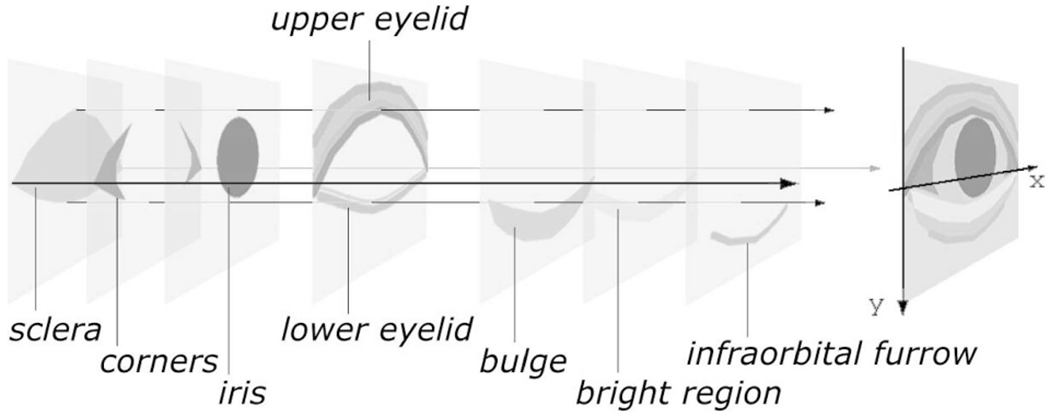
Multilayered 2D eye region model.
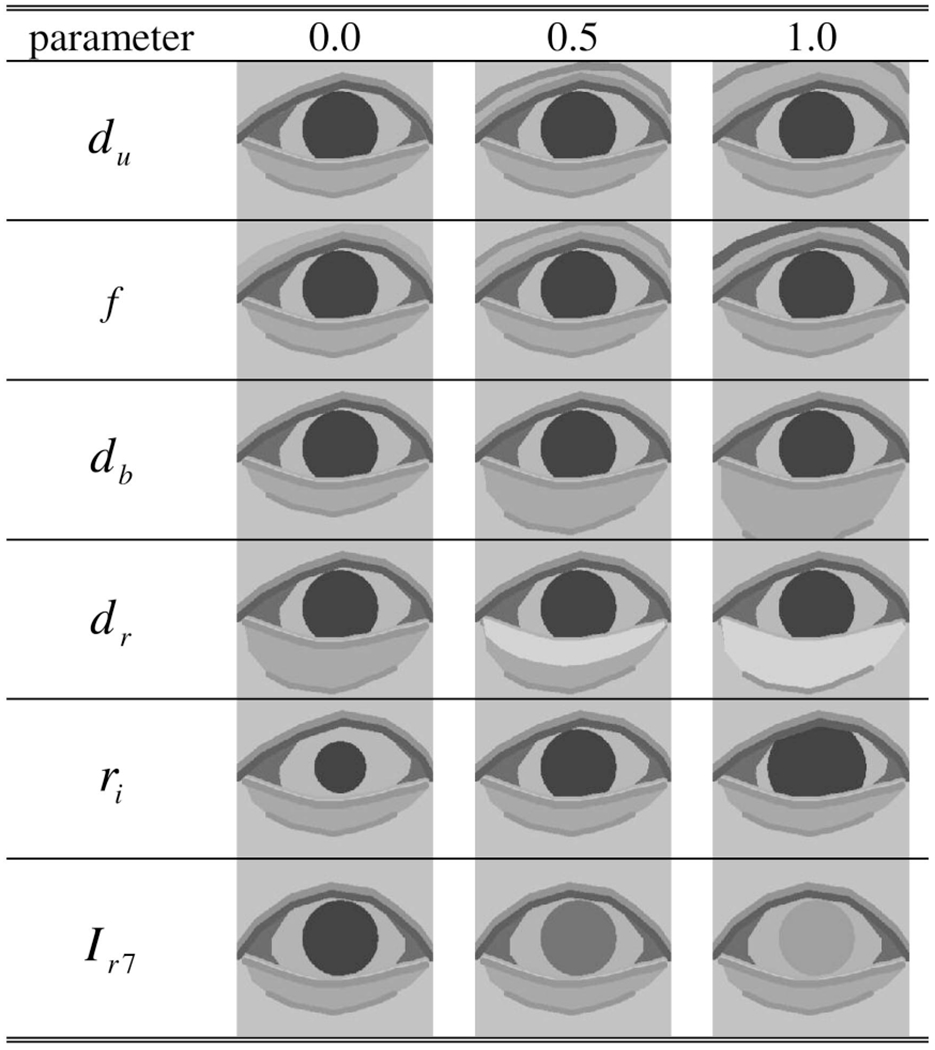
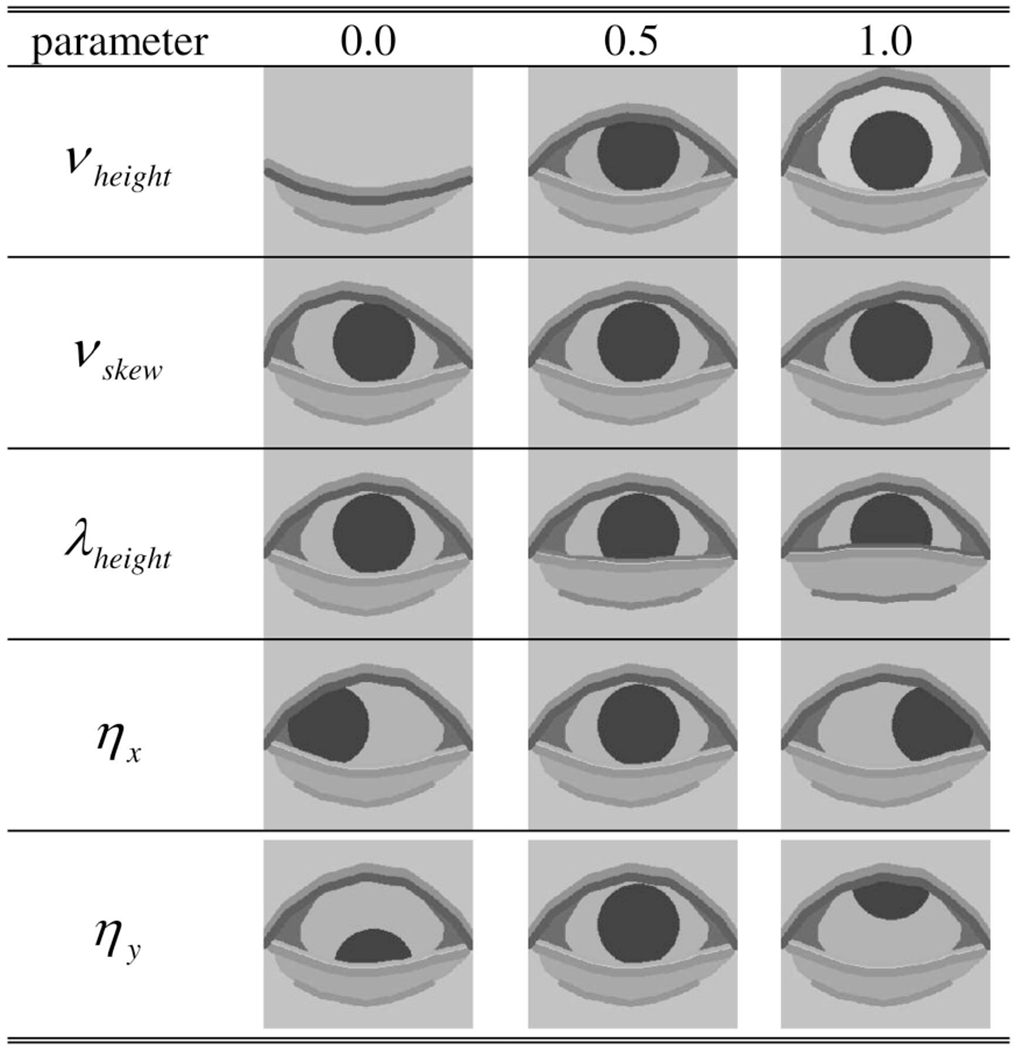
Table 1 shows the eye components represented in the multilayered eye region model along with their control parameters. We call parameters du, f, db, dr, ri, and Iγ7 the structure parameters (denoted by s) that define the static and structural detail of an eye region model, while we call parameters νheight, νskew, λheight, ηx, and ηy the time-dependent motion parameters (denoted by mt, t: time) that define the dynamic detail of the model. The eye region model defined and constructed by the structure parameters s and the motion parameters mt is denoted by T(x; s, mt), where x denotes pixel positions in the model coordinates. Table 2 and Table 3 show examples of the appearance changes due to the different values of s and mt in the eye region model T(x; s, mt).
TABLE 1.
Detailed Description of the Eye Region Model
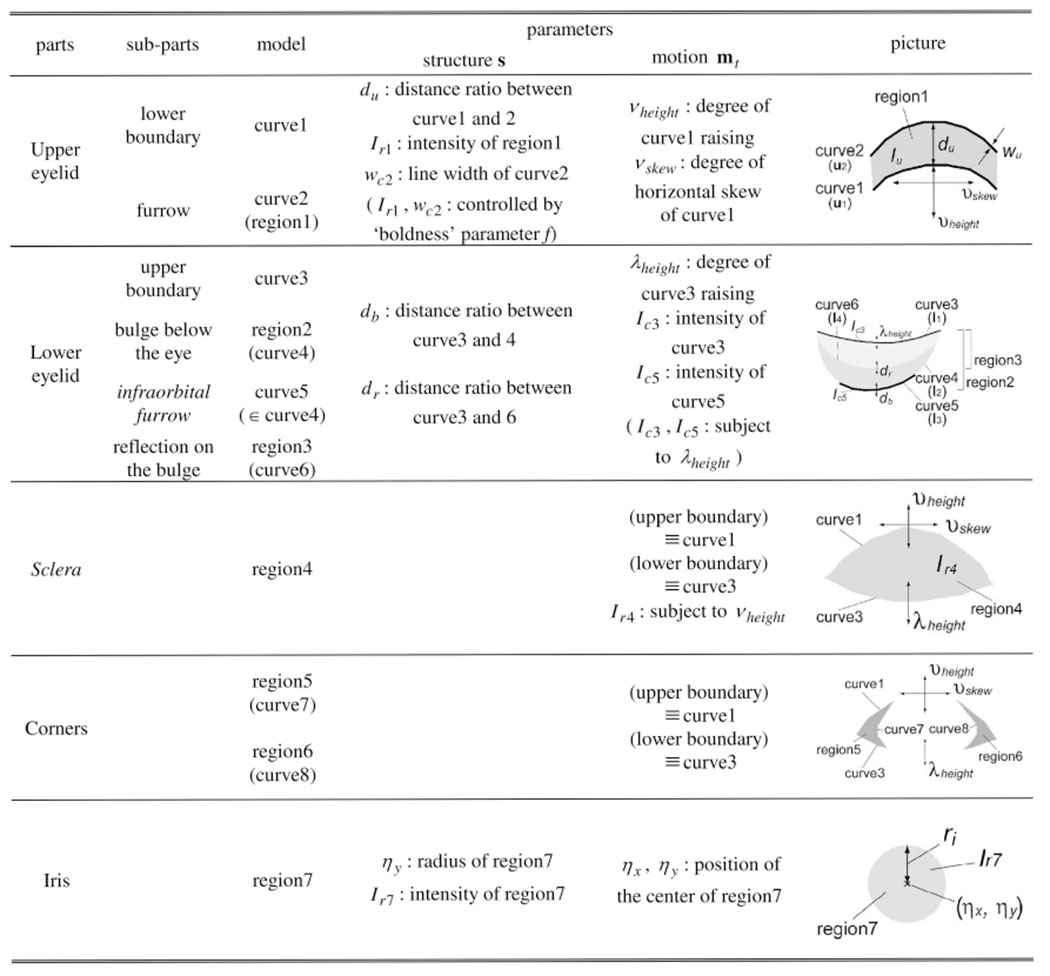
|
TABLE 2.
Appearance Changes Controlled by Structure Parameters
|
TABLE 3.
Appearance Changes Controlled by Motion Parameters
|
2.1. Upper Eyelid
The upper eyelid is a skin region that covers the upper area of the palpebral fissure (the eye aperture). It has two descriptive features: 1) a boundary between the upper eyelid and the palpebral fissure and 2) a furrow running nearly in parallel to the boundary directly above the upper eyelid.
The model represents these features by two polygonal curves (curve1 and curve2) and the region (region1) surrounded by them. Both curve1 and curve2 consist of Nu vertices denoted by u1 and u2, respectively (Table 1).
2.1.1. Structure of Upper Eyelid
To represent the distance between the boundary and the furrow, parameter du [0 1] gives the ratio to the predefined maximum distance between curve1 and curve2. When curve1 and curve2 coincide (du = 0), the upper eyelid appears to be a uniform region, which we refer to as a single eyelid fold. Single eyelid folds are common in East Asians. “Boldness” parameter f [0 1] controls both the intensity Ir1 of region1 and the line width wc2 of curve2, simultaneously by and (β1, β2: constant). The appearance changes controlled by du and f are shown in Table 2.
2.1.2. Motion of Upper Eyelid
When an upper eyelid moves up and down in its motion (e.g., blinking), the boundary between the upper eyelid and the palpebral fissure moves up and down. The model represents this motion by moving the vertices of curve1 (u1). They move between the predefined curve for a completely open eye and that for a closed eye , as shown in Fig. 3. Parameter νheight [0 1] specifies the position of curve1 within this range and, thus, the ith vertex position of curve1 (u1i) is defined by parameter νheight as,
| (1) |
where and are the positions of the ith vertices of and , respectively. The sinusoidal term in (1) moves the vertices rapidly when νheight is small and slowly when νheight is large with respect to the linear change of νheight. This corresponds to the possible rapid movement of the upper eyelid when it lowers in motion such as blinking.
Fig. 3.
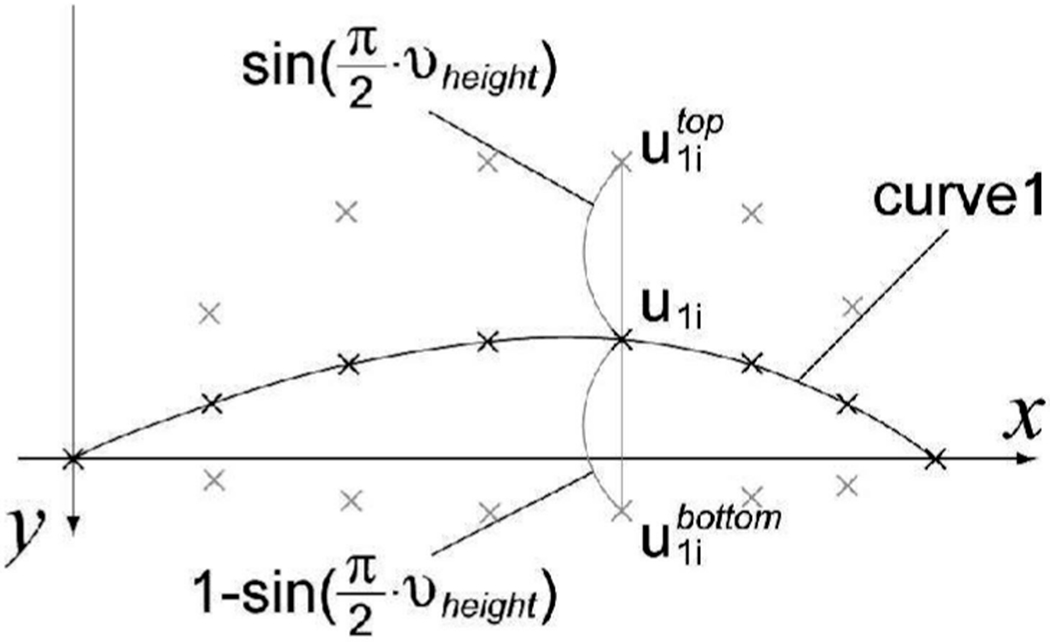
The up-down position of curve1.
The furrow on the upper eyelid also moves together with the boundary. The model represents this motion by moving the vertices of curve2 (u2). The positions of the vertices of curve2 (u2) are defined by using parameters νheight and du such that they move in parallel to curve1 (u1) when νheight is larger than a preset threshold or move slowly keeping the distance between curve1 and curve2 wide otherwise.
If νheight is larger than , then
| (2) |
| (3) |
else
| (4) |
| (5) |
end if
where α1 and α2 are constant.
The boundary also appears skewed horizontally when the eye is not straight to the camera because it is on a spherical eyeball. The model represents it by horizontally skewing curve1 by using parameter νskew [0 1]. As shown in Fig. 4, the vertices of curve1 (u1) defined by (1) are transformed into the skewed positions under orthographic projection, where C denotes the center of the eyeball and θ defines the opening of the eye. The coordinate of C in the xeye − zeye plane is
| (6) |
| (7) |
Fig. 4.
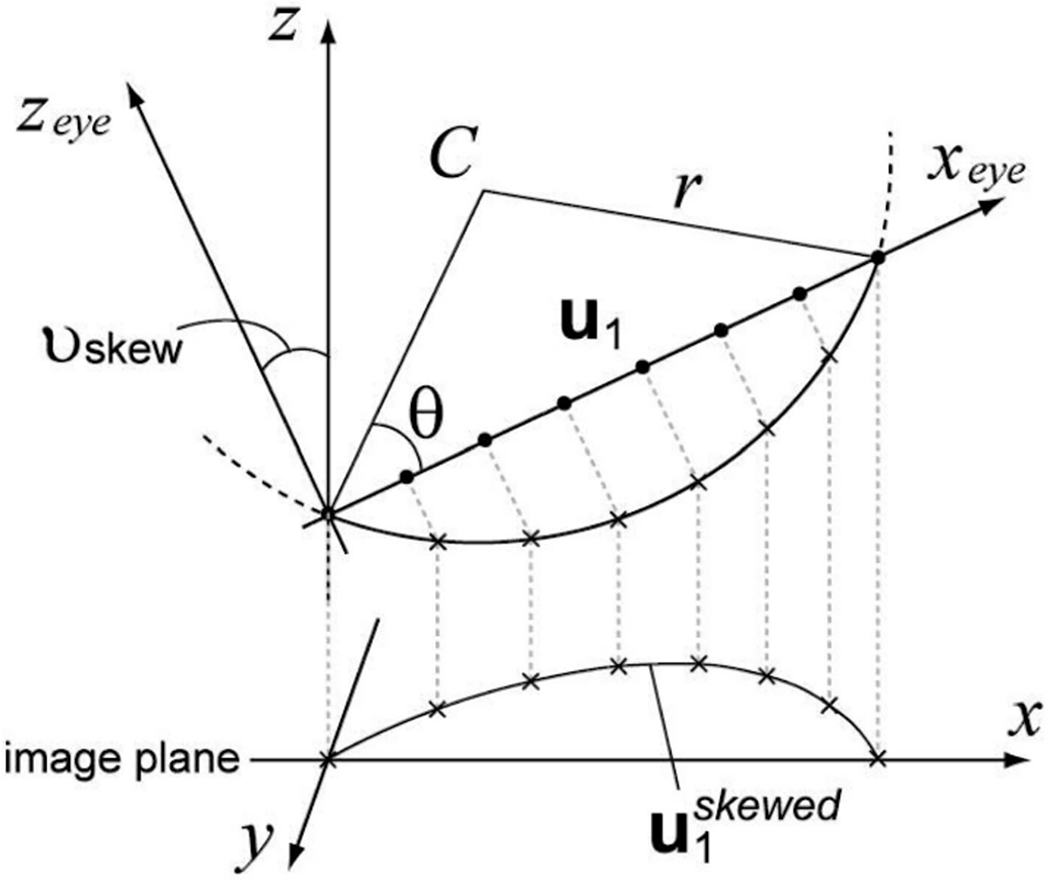
The horizontal skew of curve1.
The coordinates of u1i projected onto the spherical surface, , should satisfy (8), with r being the radius of the sphere:
| (8) |
The x coordinate of horizontally skewed positions of u1i in the x-z plane is obtained as
| (9) |
The first two rows of Table 3 shows examples of the appearance changes due to parameters νheight and νskew.
2.2. Lower Eyelid
A lower eyelid is a skin region that covers the lower area of the palpebral fissure. It has four descriptive features:
a boundary between the lower eyelid and the palpebral fissure,
a bulge below the boundary, which results from the shape of the covered portion of the eye, shortening of the inferior portion of the orbicularis oculi muscle (a sphincter muscle around the eye) on its length, and the effects of gravity and aging,
an infraorbital furrow parallel to and below the lower eyelid, running from near the inner corner of the eye and following the cheek bone laterally [9], and
a brighter region on the bulge, which is mainly caused by the reflection of illumination.
As shown in Table 1, the model represents these features by four polygonal curves (curve3, curve4, curve5, and curve6) and two regions (region2 surrounded by curve3 and curve4 and region3 surrounded by curve3 and curve6). Curve3, curve4, and curve6 consist of Nl vertices and are denoted by l1, l2, and l4, respectively. Curve5 is the middle portion of curve4, consisting of Nf vertices denoted by l3.
2.2.1. Structure of Lower Eyelid
Distance ratio parameter db [0 1] controls the distance between curve3 and curve4. The vertices of curve4 (l2) have the predefined positions for both the thinnest bulge and the thickest bulge , as shown in Fig. 5. The positions of the jth vertex of l2 are defined by using parameter db as
| (10) |
where and are the positions of the jth vertices of and , respectively.
Fig. 5.
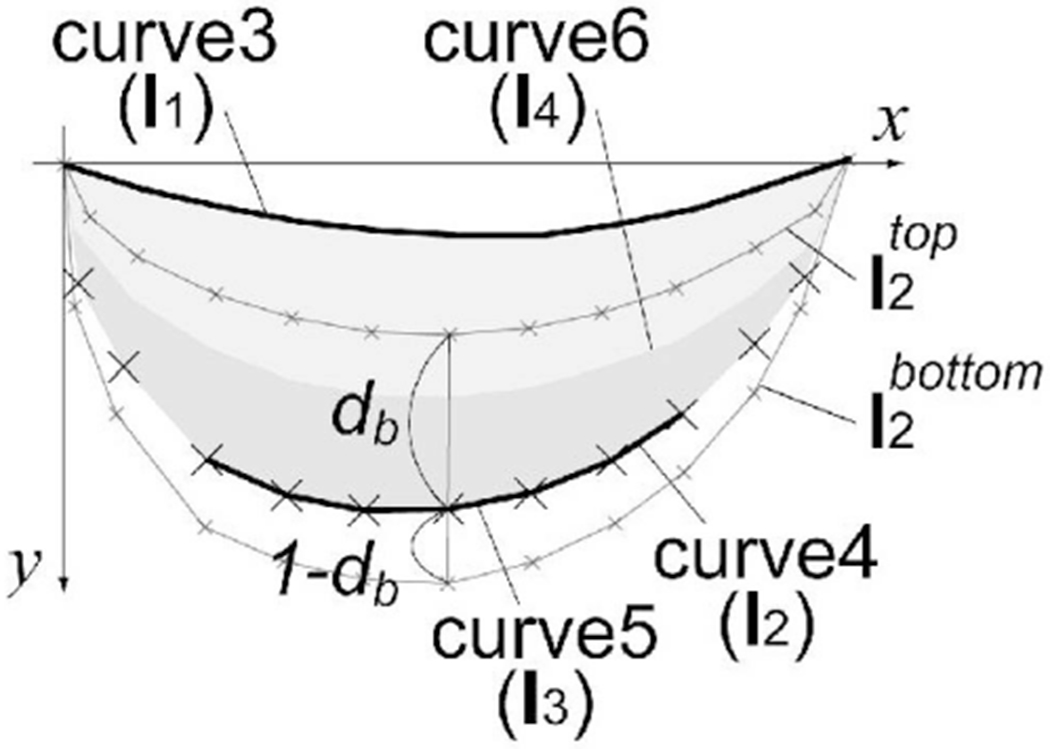
The model for a lower eyelid.
Distance ratio parameter dr [0 1] controls the distance between curve3 and curve6. The position of the jth vertex of l4 is defined by using l1, l2, and parameter dr as
| (11) |
2.2.2. Motion of Lower Eyelid
When the lower eyelid moves up or down (e.g., eyelid tightening), the boundary between the lower eyelid and the palpebral fissure moves, correspondingly changing in area. The bulge, the infraorbital furrow, and the brighter region on the bulge also move together with the boundary.
Our model represents this motion by moving the vertices of curve3, curve5, and curve6. The vertices of curve3 have predefined positions for both the highest and the lowest . Parameter λheight [0 1] gives the position within this range. The position of the jth vertex of l1 is obtained using parameter λheight as
| (12) |
where and are the positions of the jth vertices of and , respectively. Likewise, parameter λheight controls the positions of l2, , and in (10).
| (13) |
| (14) |
where and are the preset dynamic ranges for and .
Parameter λheight also controls both the intensity of curve3 and that of curve5 (Ic3 and Ic5) by and (β3, β4 : constant).
Table 3 shows examples of the appearance changes controlled by parameter λheight.
2.3. Sclera
The sclera is the white portion of the eyeball. We limit it to the region that can be seen in the palpebral fissure, which is surrounded by the upper eyelid and the lower eyelid. Our model represents the sclera by a region (region4) surrounded by curve1 and curve3, which are defined to represent upper and lower eyelids, as shown in Table 1.
When the upper eyelid and/or the lower eyelid move, the sclera changes its shape. Our model controls the change indirectly by parameters νheight, νskew, and λheight. These primarily control the appearance changes of the upper eyelid and the lower eyelid due to the motions. Parameter νheight also controls the intensity of region4 by (β5: constant).
2.4. Corners
Corners are regions at the medial (close to the midline) and lateral regions of the sclera. They are usually darker than other parts of the sclera due to shadow and color of the caruncle (a small, red portion of the corner of the eye that contains sebaceous and sweat glands). As shown in Table 1, our model represents the outer corner by a region surrounded by three polygonal curves (curve1, curve3, and curve7) and the inner corner by curve1, curve3, and curve8. Both curve7 and curve8 consist of Nc vertices, denoted by c1 and c2, respectively. Fig. 6 depicts the details of the outer corner model.
Fig. 6.
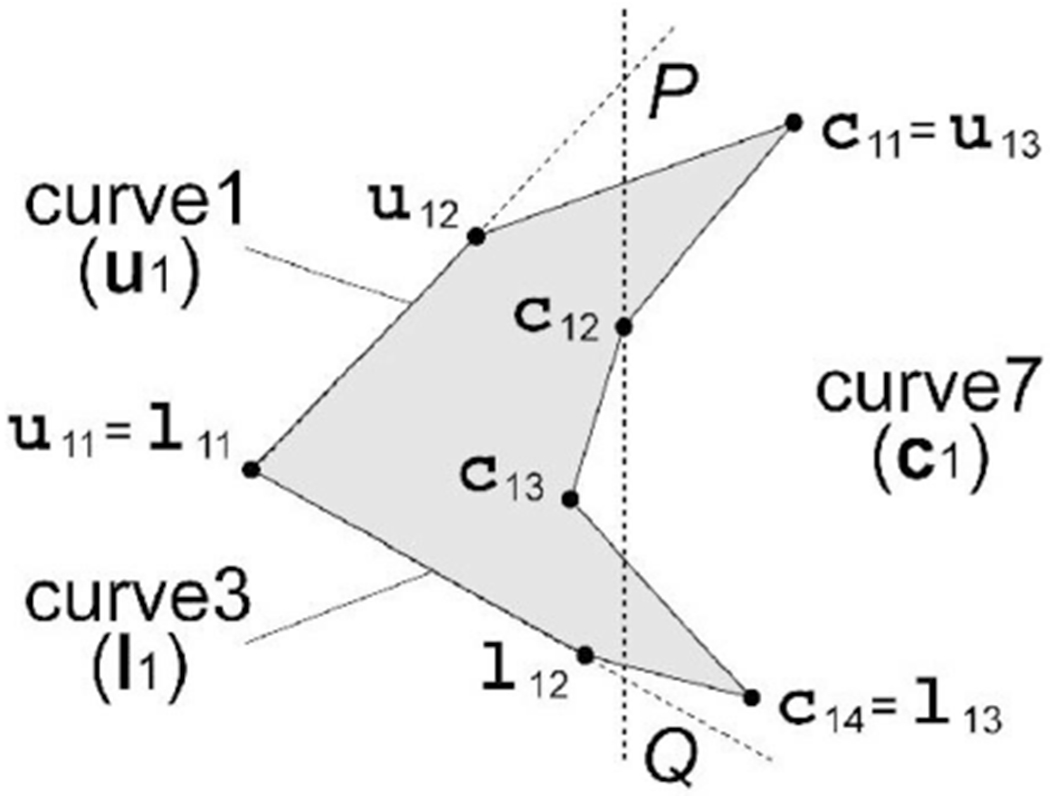
The model for the outer corner.
When the upper eyelid and/or the lower eyelid move, the shape of the eye corners changes. Our model controls the motion of the upper and the lower boundaries by parameters νheight, νskew, and λheight as mentioned. The x coordinates of c12 and c13 are moved from predefined neutral positions based on parameter νskew according to the horizontal proportion and , respectively, and their y coordinates are so determined as to keep the vertical proportions same.
2.5. Iris
The iris is a circular and colored region on the eyeball. The apparent color of the iris is mainly determined by reflection of environmental illumination and the iris’ texture and patterns including the pupil (an aperture in the center of the iris). Our model represents the iris by a circular region, region7, as shown in Table 1. Parameter ri and parameter Iγ7 control the radius and the variable single color of region7, respectively. The color of the iris is represented as the average gray level inside the iris.
The position of the iris center moves when gaze direction moves. Our model represents the motion by moving the vertex of the center coordinate (ix, iy) of region7. It has predefined positions for gaze left , gaze right , gaze up , and gaze down , respectively. Parameters ηx [0 1] and ηy [0 1] give the position within these ranges as
| (15) |
| (16) |
Table 3 includes examples of the appearance changes due to parameters ηx and ηy.
3. Model-Based Eye Image Analysis
Fig. 7 shows a schematic overview of the whole process of a model-based eye region image analysis system. An input image sequence contains facial behaviors of a subject. Facial behaviors usually accompany spontaneous head motions. The appearance changes of facial images thus comprise both rigid 3D head motions and nonrigid facial actions. Decoupling these two components is realized by recovering the 3D head pose across the image sequence and by accordingly warping the faces to a canonical head pose (frontal and upright), which we refer to as the stabilized images. Stabilized images are intended to include appearance changes due to facial expression only. Eye image analysis proceeds on these stabilized images. For a given stabilized image sequence, the system registers the eye region model to the input in the initial frame and individualizes the model by adjusting the structure parameters s (Table 1). Motion of the eye is then tracked by estimating the motion parameters mt across the entire image sequence. If the tracking results at any time t are off the right positions, the model is readjusted, otherwise we finally get the estimated motion together with the structure of the eye.
Fig. 7.
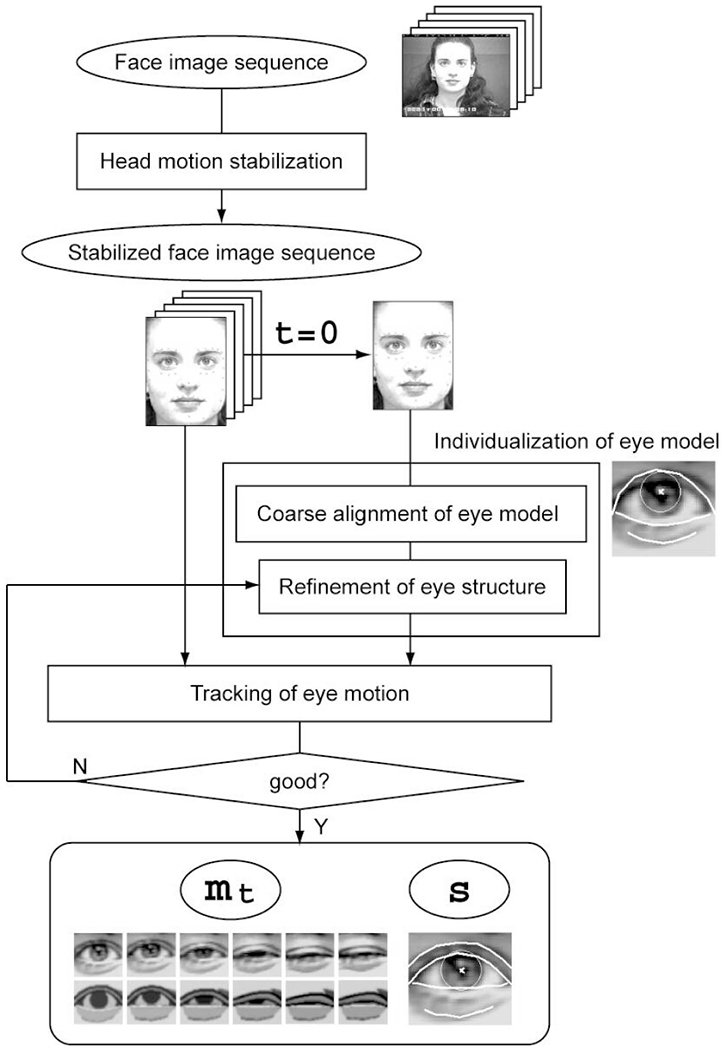
A schematic overview of the model-based eye image analysis system.
3.1. Head Motion Stabilization
We use a head tracker that is based on a 3D cylindrical head model [26]. Manually given the head region with the pose and feature point locations (e.g., eye corners) in an initial frame, the tracker automatically builds the cylindrical model and recovers 3D head poses and feature point locations across the rest of the sequence. The initial frame is selected such that it has the most frontal and upright face in it. The tracker recovers full 3D rigid motions (three rotations and three translations) of the head. The performance evaluation on both synthetic and real images has demonstrated that it can track as large as 40 degrees and 75 degrees of yaw and pitch, respectively, within 3.86 degrees of average error.
As shown in Fig. 8, the stabilized face images cancel out most of the effect of 3D head pose and contain only the remaining nonrigid facial expression.
Fig. 8.
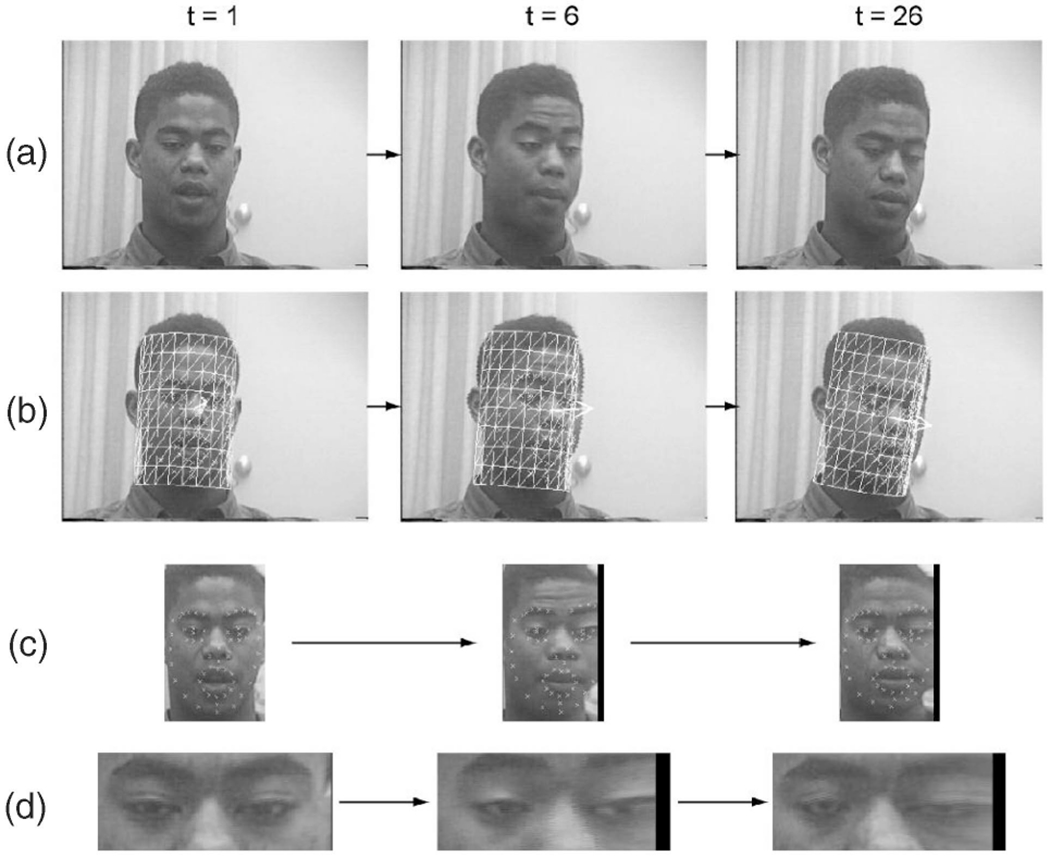
Automatic recovery of 3D head motion and image stabilization [26]. (a) Frames 1, 10, and 26 from original image sequence. (b) Face tracking in corresponding frames. (c) Stabilized face images. (d) Localized face regions.
3.2. Individualization of Eye Region Model
The system first registers the eye region model to a stabilized face in an initial frame t = 0 by scaling and rotating the model so that both ends of curve1 (u1) of the upper eyelid coincide with the eye corner points in the image. The initial frame is such a frame that contains a neutral eye (an open eye with the iris at the center), which may be different from the initial frame used in head tracking. In the current implementation, the individualized structure parameters s are obtained manually by using a graphical user interface and fixed across the entire sequence. Example results of individualization with respect to each factor of the appearance diversities in Fig. 1 are shown in Table 4.
TABLE 4.
Example Results of Structure Individualization
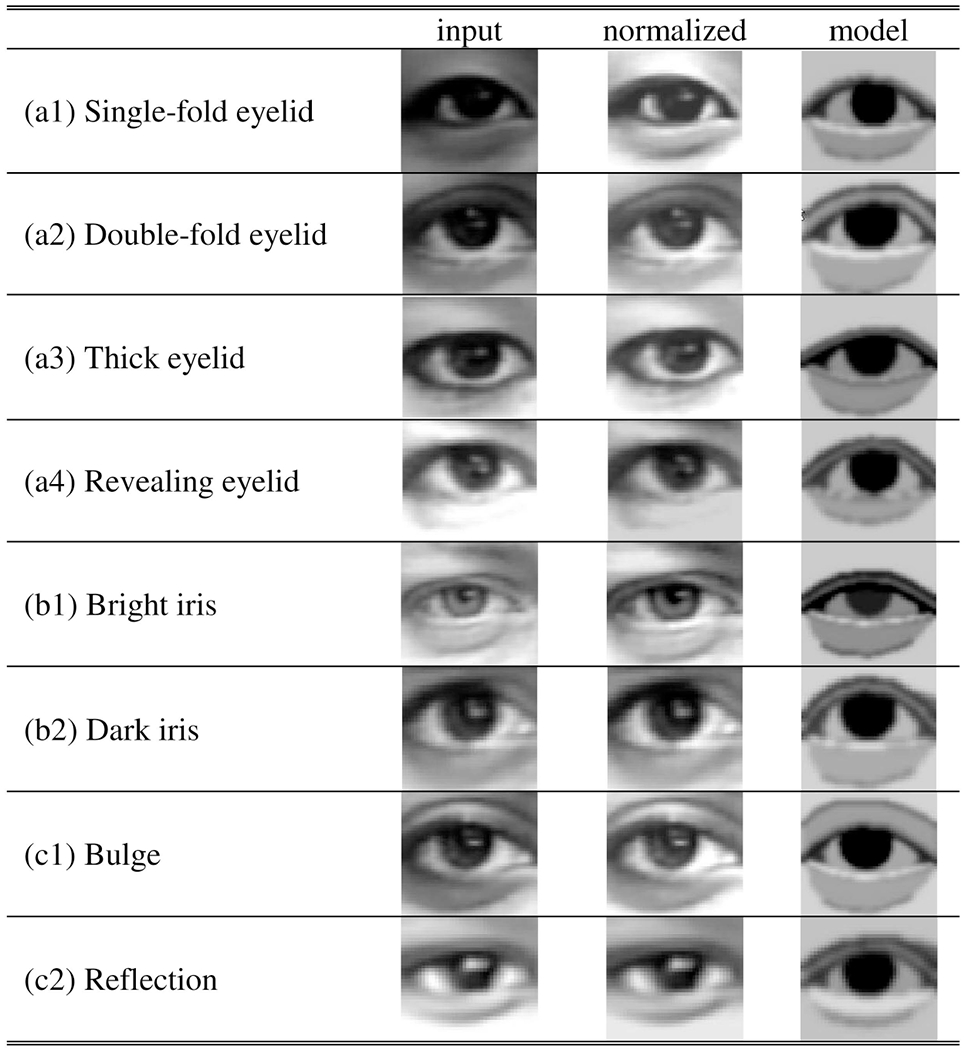
|
3.3. Tracking of Eye Motion
The pixel intensity values of both the input eye region and the eye region model are normalized prior to eye motion tracking so that they have the same average and standard deviation. The motion parameters in the initial frame m0 are manually adjusted when the eye region model is individualized.
With the initial motion parameters m0 and the structure parameters s, the system tracks the motion of the eye across the rest of the sequence starting from t = 0 to obtain mt at all t. The system tracks the motion parameters by an extended version of the Lucas-Kanade gradient descent algorithm [27], which allows the template searched (the eye region model here) to deform while tracking. Starting with the values in the previous frame, the motion parameters mt at the current frame t are estimated by minimizing the following objective function D:
| (17) |
where I is the input eye region image, W is a warp from the coordinate system of the eye region model to that of the eye region image, and pt is a vector of the warp parameters that includes only translation in this implementation. Structure parameters s do not show up in T because they are fixed while tracking.
δmt and δpt are obtained by solving the simultaneous equations obtained from the first-order Taylor expansion of (17) as explained in detail in the Appendix which can be viewed for free at http://computer.org/tpami/archives.htm. mt and pt are updated:
| (18) |
The iteration process at a particular frame t converges when the absolute values of δmt and δpt become less than the preset thresholds or the number of iterations reaches the maximum. The region surrounded by curve1 (u1) and curve3 (l1) of the eyelids is used for the calculation process so that more weight is placed on the structure inside the eye (the palpebral fissure) and other facial components (such as an eyebrow) that may appear in the eye region will not interfere. When parameter νheight is less than a preset threshold, the position of region7 (ηx and ηy) is not updated because the iris is so occluded that its position estimation is unreliable. Also, the warp parameters pt are not updated when νheight is less than a preset threshold because a closed (or an almost closed) eye appears to have only horizontal structure that gives only the vertical position of the eye region reliably.
4. Experiments
We applied the proposed system to 577 image sequences from two independently collected databases: the Cohn-Kanade AU-coded Facial Expression Image Database [28] and the Ekman-Hager Facial Action Exemplars [29]. The subjects in these databases are young adults and include both men and women of varied ethnic background. They wear no glasses or other accessories that could occlude their faces. With few exceptions, head motion ranges from none (Ekman-Hager) to small (Cohn-Kanade) and head pose is frontal. Image sequences were recorded using VHS or S-VHS video and digitized into 640 by 480 gray scale or 16-bit color pixel arrays. Image sequences begin with a neutral or near-neutral expression and end with a target expression (e.g., lower eyelids tightened). In Cohn-Kanade, image sequences are continuous (30 frames per second). In Ekman-Hager, they are discontinuous and include the initial neutral or near-neutral expression and two each of low, medium, and high-intensity facial action sampled from a longer image sequence.
In the experiments reported here, we empirically chose the following parameter values for the eye model: Nu = 8, Nl = 11, Nf = 8, α1 = 30, α2 = 40, β1 = 20, β2 = 10, β3 = 80, β4 = 30, β5 = 70, , , , , , and θ = π/6. The initialization for tracking was done to the first neutral or near-neutral expression frame in each sequence. The system generates the eye region model as a graphic image with a particular resolution. Because the size and positions of the graphics objects (e.g., lines) are specified in integers, the resolution and sharpness of the graphic images must be high enough for the model to represent the fine structures of an eye region. In our initial implementation, resolution was set at 350 by 250 pixels. The system then registered the model to the input eye region by scaling and rotating it as explained in Section 3.2. We examined the results for diverse static eye structures and for the whole range of appearance changes from the neutral to the utmost intensities in dynamic motion.
4.1. Cohn-Kanade AU-Coded Facial Expression Image Database
This database was collected by the Carnegie Mellon and University of Pittsburgh group. A large part of this database has been publicly released. For this experiment, we used 490 image sequences of facial behaviors from 101 subjects, all but one of which were from the publicly released subset of the database. The subjects are adults that range from 18 to50 years old with both genders (66 females and 35 males) and a variety of ethnicities (86 Caucasians, 12 African Americans, 1 East Asian, and two from other groups). Subjects were instructed by an experimenter to perform single AUs and their combinations in an observation room. Their facial behavior was then manually FACS labeled [9]. Image sequences that we used in this experiment began with a neutral face and had out-of-plane motion as large as 19 degrees.
4.2. Ekman-Hager Facial Action Exemplars
This database was provided by Ekman at the Human Interaction Laboratory, University of California San Francisco, whose images were collected by Hager, Methvin, and Irwin. For this experiment, we used 87 image sequences from 18 Caucasian subjects (11 females and 7 males). Some sequences have large lighting changes between frames. For these, we normalized the intensity so as to keep the average intensity constant throughout the image sequence. Each image sequence in this database consists of six to eight frames that were sampled from a longer sequence. Image sequences begin with neutral expression (or a weak facial action) and end with stronger facial actions.
5. Results and Evaluation
We used both qualitative and quantitative approaches to evaluate system performance. Qualitatively, we evaluated the system’s ability to represent the upper eyelids, localize and track the iris, represent the infraorbital furrow, and track widening and closing of the eyelids. Successful performance ensures that the system is robust to ethnic and cosmetic differences in eyelid structure (e.g., single versus double fold) and features that would be necessary for accurate action unit recognition (direction of gaze, infraorbital furrow motion, and eyelid widening and closing). In quantitative evaluation, we investigated system performance with respect to resolution and sharpness of input eye region images, initialization, and complexity of the eye model.
5.1. Examples
Of the total 577 image sequences with 9,530 frames, the eye region model failed to match well in only five image sequences (92 frames total duration) from two subjects. One of the sequences contained relatively large and rapid head motion (approximately 20 degrees within 0.3 seconds) not otherwise present in either database. This motion caused interlacing distortion in the stabilized image that was not parameterized in the model. The other four error cases from a second subject were due to limitations in individualization as discussed below.
5.1.1. Upper Eyelids
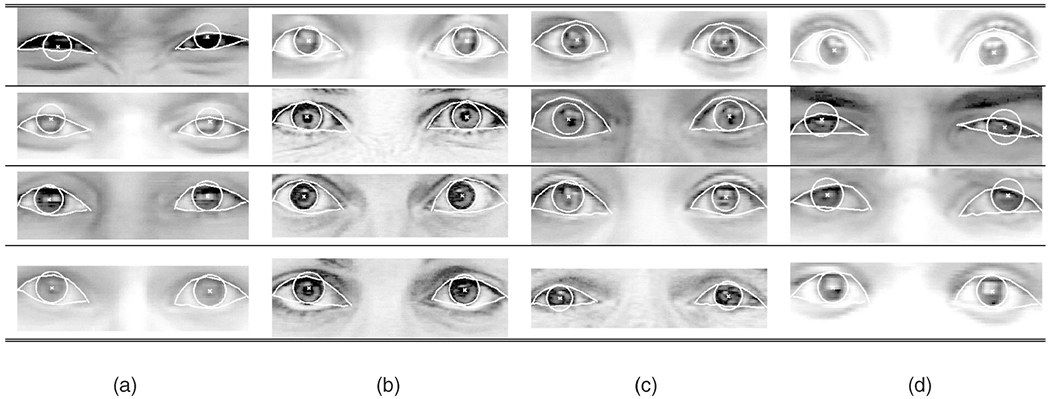
A most likely failure would be that a curve of the upper eyelid model matches with the second (upper) curve of a double-fold eyelid in the input when they have similar appearance. As shown in Table 5b, our system was not compromised by such double-fold eyelids. Note that these eye region images shown in the table are after the image stabilization. The face itself moves in the original image sequence. (This is true with the subsequent tables through Table 10.)
TABLE 5.
Example Results for a Variety of Upper Eyelids
|
(a) Single-fold eyelids. (b) Double-fold eyelids. (c) Thick eyelids. (d) Revealing eyelids.
TABLE 10.
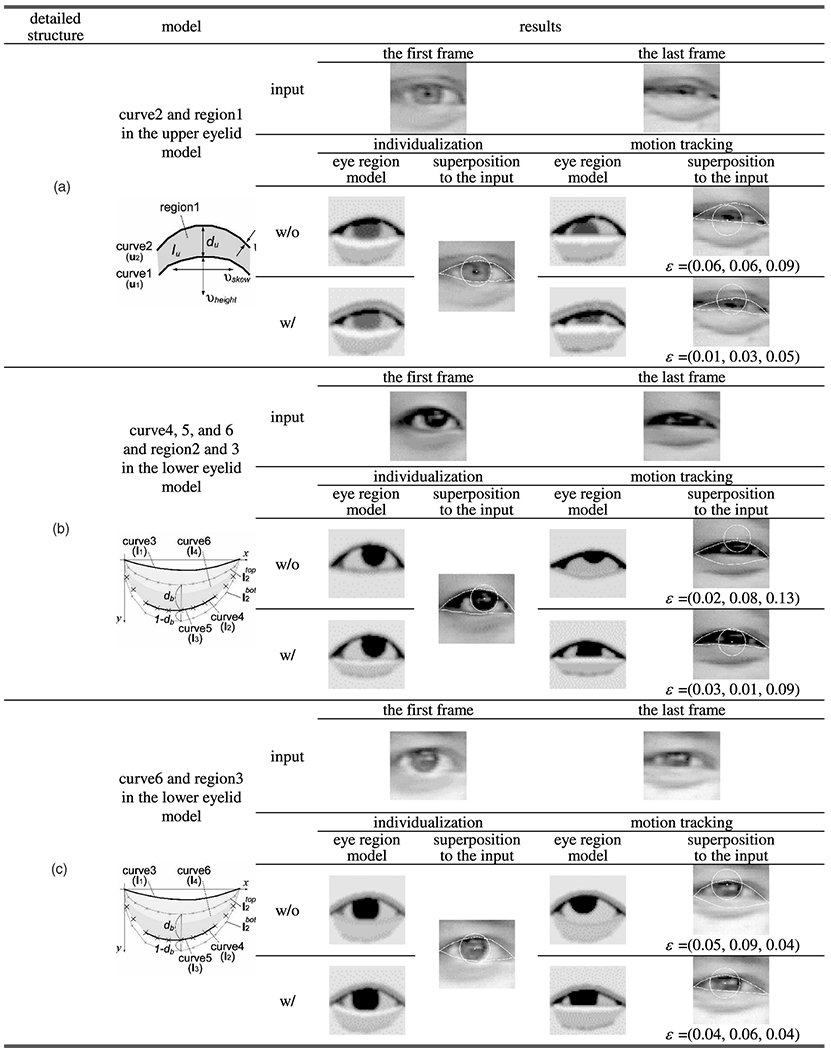
Different Levels of Detail of the Model and Their Effects
|
(a) Double eyelid folds. (b) Bulge, infraorbital furrow, and reflection on the bulge. (c) Reflection on the bulge.
When an upper eyelid appears thick due to cosmetics, eyelashes, or shadow, a model with a single thin line could match mistakenly at many locations within the area of thickness. Such errors did not occur; by considering boldness of the upper eyelids as a variable, our system was able to track the correct positions of upper eyelids, as shown in Table 5c.
Some subjects had double-fold eyelids that appeared single-folded when the face was at rest (i.e., neutral expression). In these cases, the second (hidden) curves were revealed when the eyelids began to widen or narrow, which unfolded the double-fold. The boldness parameter absorbed this “revealing effect” and the system was able to track correctly the upper eyelid contour, as shown in Table 5d.
5.1.2. Irises
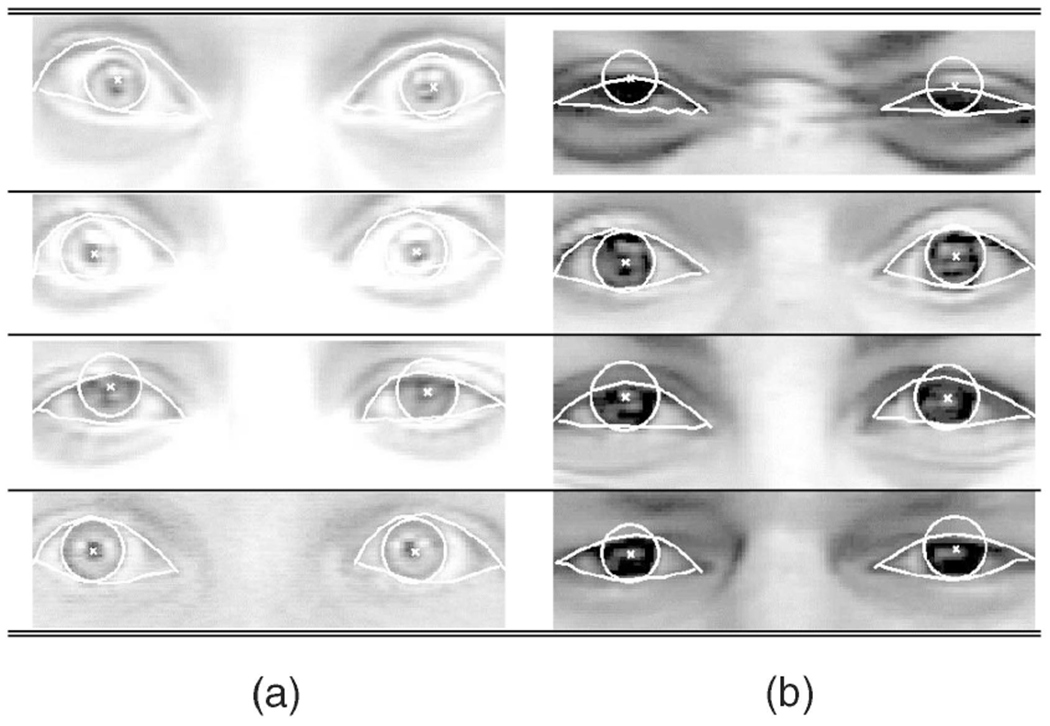
A most likely failure in tracking irises would be for an iris model to match another dark portion in the eye region, such as shadow around the hollow between the inner corner of the eye and the root of the nose. An especially bright iris could contribute to this type of error. This situation could happen if one were to try to find the location of the iris by finding only a circular region with a fixed dark color (e.g., Tian et al. [22]). Because our method uses a whole eye region as a pattern in matching and includes color and size of the irises as variables, the system was able to track the positions of irises accurately over a wide range of brightness, as shown in Table 6a.
TABLE 6.
Example Results for Irises of Different Colors
|
(a) Bright iris. (b) Dark iris.
5.1.3. Bulge with Reflection Below the Eye
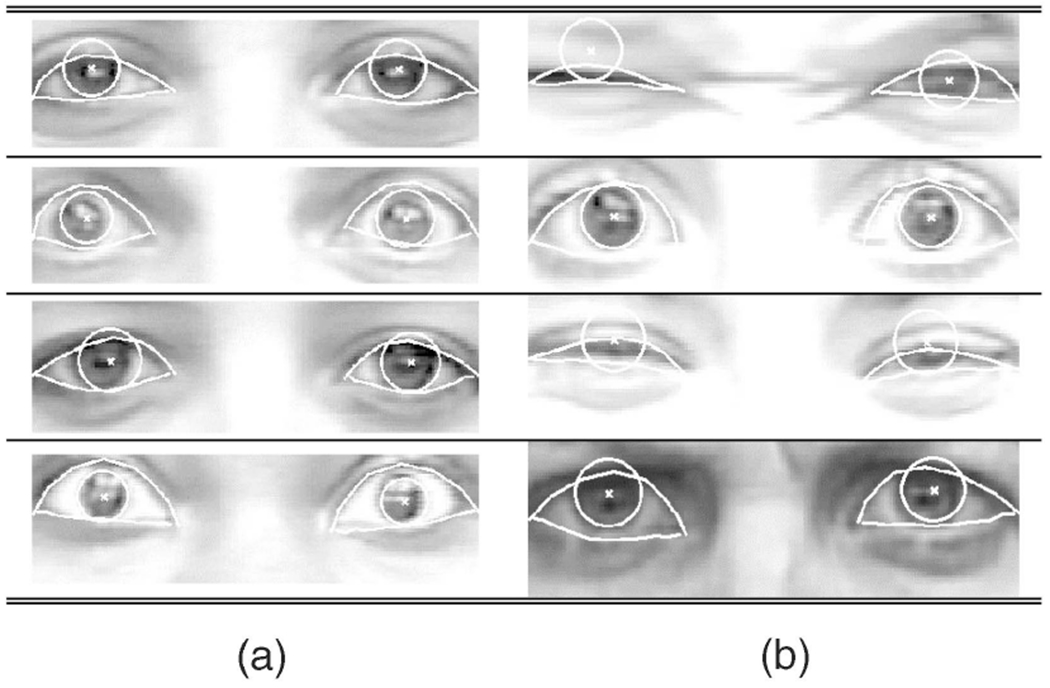
A most likely failure would be that a curve of the lower eyelid model matches with the lower edge of the bulge or the infraorbital furrow. This could occur when the appearance of a bright bulge and the furrow below it are similar to that of the sclera with a lower eyelid curve below it. By considering the bulge, the illumination reflection on the bulge, and the infraorbital furrow in modeling the appearance below the eye, our system tracked lower eyelids accurately, as shown in Table 7.
TABLE 7.
Example Results for Differences in Appearance Below the Eye
|
(a) Bulge. (b) Bulge with reflection.
5.1.4. Motion
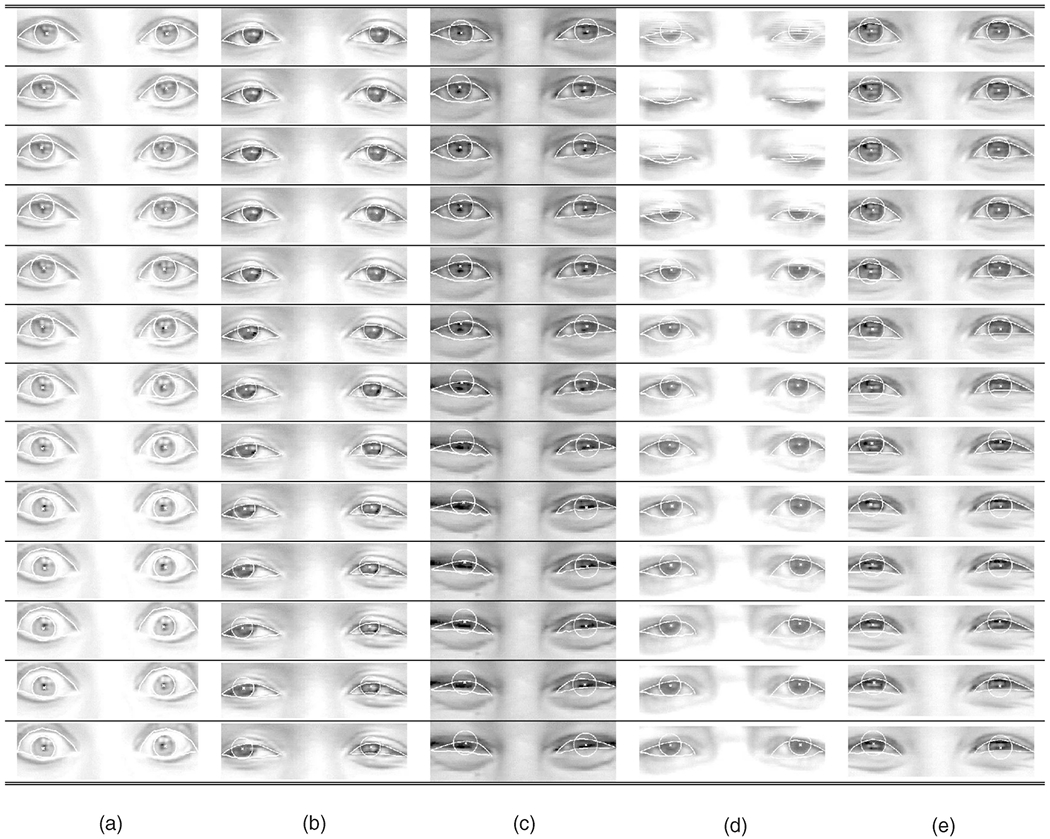
Of 44 AUs defined in FACS [9], six single AUs are defined in the eye region. These include AU 5 (upper lid raiser), AU 6 (cheek raiser and lid compressor), AU 7 (lid tightener, which encompasses AU 44 in the 2002 edition of FACS), AU 43 (eye closure), AU 45 (blink), and AU 46 (wink). Gaze directions are also defined as AU 61 (turn left), AU 62 (Turn right), AU 63 (up), and AU 64 (down). Tables 8a, 8b, 8c, 8d, and 8e are correspondent with AU 5, AU 6+62, AU 6, AU 45 and AU 7, and AU 6+7, respectively, which cover the AUs related to the eye region. The frames shown range from neutral to maximum intensity of the AUs. A most likely failure due to appearance changes by the motion of an eye would be that tracking of the upper eyelid and the lower eyelid fails when the distance between them closes, such as in blinking (AU45). Our system tracked blinking well, as shown in Table 8. Tracking eye motion by matching an eye region increased system robustness relative to individually tracking feature points (such as in [3], [22], [30], [31]) or using a generic eye model. Studies [22], [32] that have used parabolic curves to represent eye shape have been less able to represent skewed eyelid shapes. Our model explicitly parameterizes skewing in the upper eyelid model; accordingly, the system was able to track such skewing upper eyelids in their motions as shown in Tables 8b and 8d.
TABLE 8.
Example Results for Motions
|
(a) Upper eyelid raising. (b) Gaze change and cheek raising. (c) Cheek raising. (d) Blinking and eyelid tightening. (e) Cheek raising and eyelid tightening.
5.1.5. Failure
Iris localization failed in a Caucasian female who had a bright iris with strong specular reflection and a thick and bold outer eye corner. Fig. 9 shows the error. While the eyelids were correctly tracked, the iris model mistakenly located the iris at the dark eye corner. Failure to correctly model the texture inside the iris appeared to be the source of this error. To solve this problem in future work, we anticipate that recurrently incorporating the appearance of the target eye region into the model during tracking would be effective and, more generally, would improve ability to accommodate unexpected appearance variation.
Fig. 9.
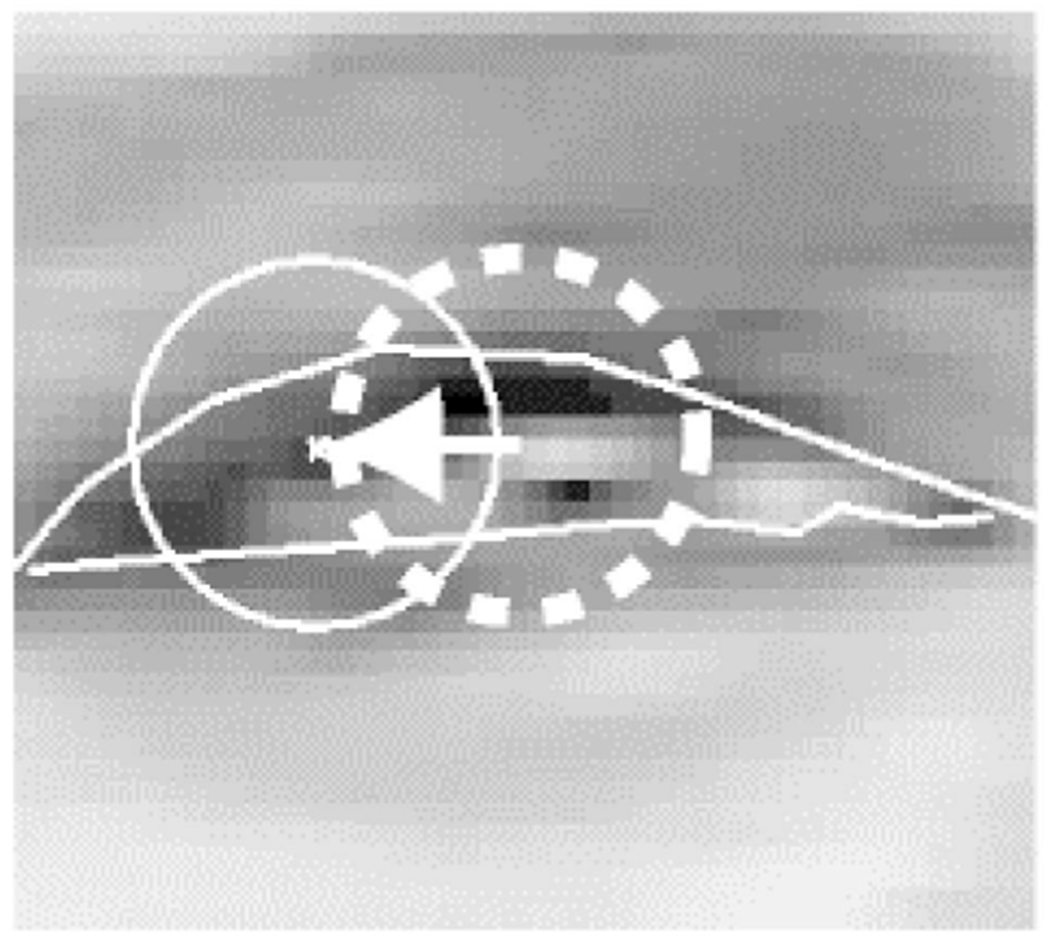
A failure case with a bright and specular iris. The dashed circle indicates the correct position manually labeled and the solid circle system’s output. The eyelids were correctly tracked, whereas the iris mistakenly located at the dark eye corner.
5.2. Quantitative Evaluation
To quantitatively evaluate the system’s accuracy, we compared the positions of the model points for the upper and lower eyelids and the iris center (u1, l1, ηx, and ηy in Table 1, respectively) with ground truth. Ground truth was determined by manually labeling the same number of points around the upper and lower eyelids and the iris center using a computer mouse. These points then were connected using polygonal curves. We then computed the Euclidean distance from each of the model points to the closest line segment between manually labeled points. If model points were located horizontally outside of the eye, the line segment from the closest manually labeled endpoint was used. For the iris center, the Euclidean distance to the manually labeled iris center was computed. The Euclidean distances were normalized by dividing them by the width of the eye region. The vector of tracking errors is denoted as vector ε.
5.2.1. Sensitivity to Input Image Size and Sharpness
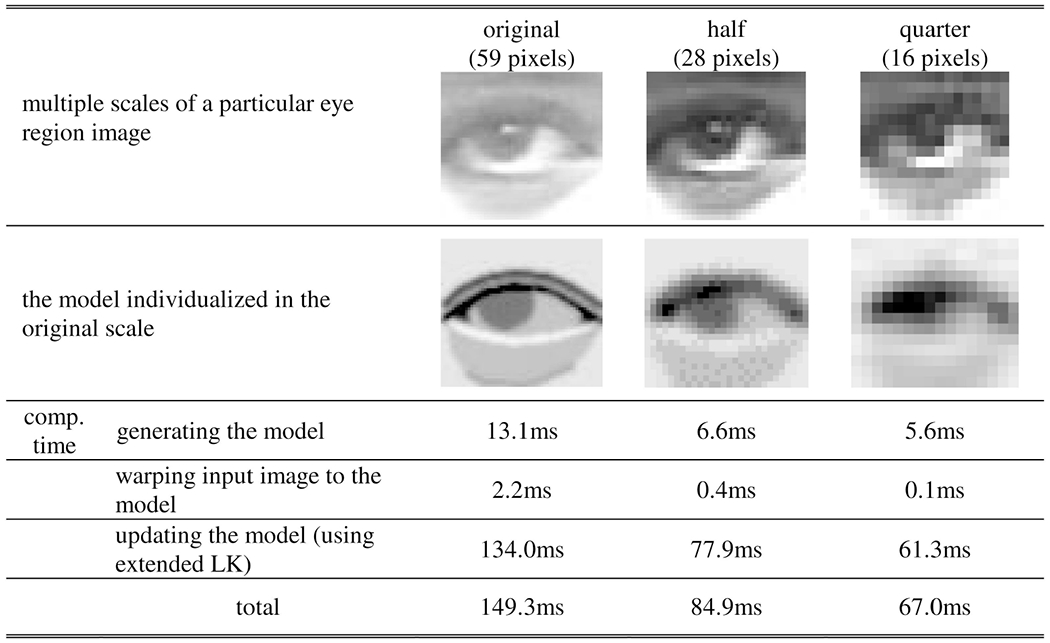
When the size of the input eye region is small relative to the actual size of the eye or the input image is not sufficiently sharp, the fine structure of the eye may not be sufficiently visible. Image sharpness refers to large gain in the high-frequency components of an image. To evaluate system robustness to input image size and sharpness, we compared tracking error with respect to multiple sizes and sharpness of input eye region images. Sharpness of the input images was sampled by applying a high pass filter to the image sequences. We selected for analysis nine sequences based on the response: three sequences that had the strongest response, three the weakest, and three in halfway between these. To vary image size, we resampled the images into make three levels: the original scale, 50 percent scale (0.5 × 0.5), and quarter scale (0.25 × 0.25). Eye motion tracking in the smaller scales used the same structure parameters as those used in the original scale. Table 9 shows an example of multiple scales of a particular eye region image. The table also shows the computation time for updating the model parameters (Pentium M, 1.6GHz, 768MB RAM, Windows XP, the average over 10 time trials). Fig. 10 shows the tracking error plotted against the widths of the image sequences. Tracking error up to about 10 percent of eye region width may have resulted from error in manual labeling. The most likely cause of small error in manual labeling was ambiguity of the boundary around the palpebral fissure (Fig. 11). We found that an eye region width of about 15 pixels was the margin under which tracking became impaired for the upper eyelid, lower eyelid, and the iris position. Above this value, performance was relatively robust with respect to both size and sharpness of the input eye region.
TABLE 9.
Computation Time for Multiple Image Resolution
|
Fig. 10.
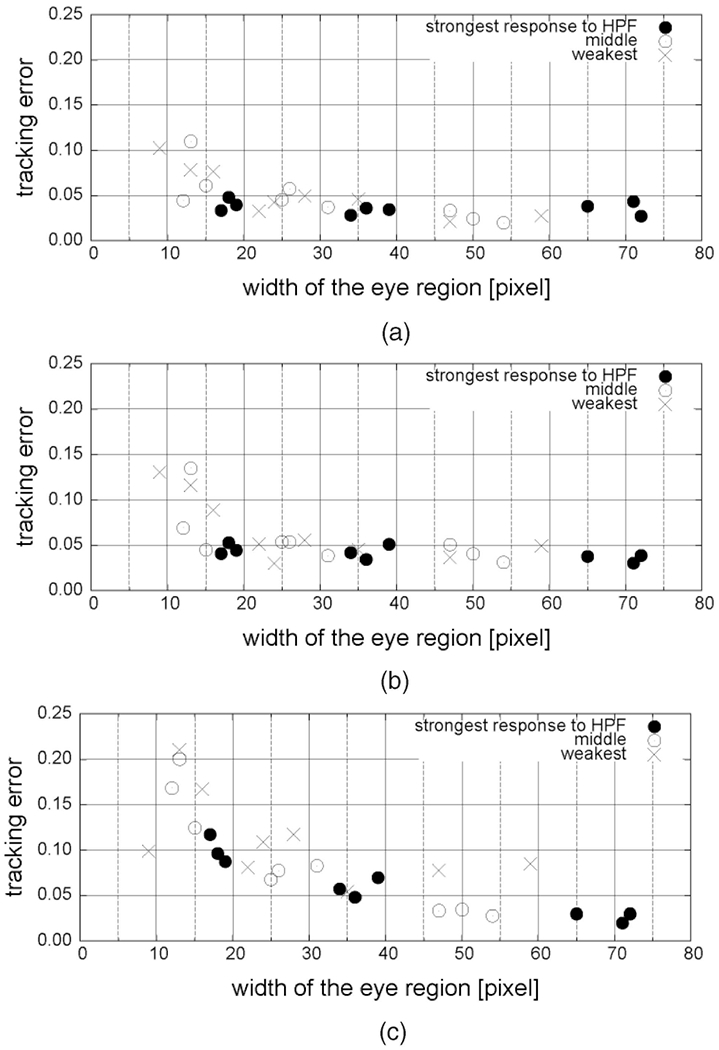
Sensitivity to image resolution. (a) Tracking error for the upper eyelid. (b) Tracking error for the lower eyelid. (c) Tracking error for the iris center.
Fig. 11.
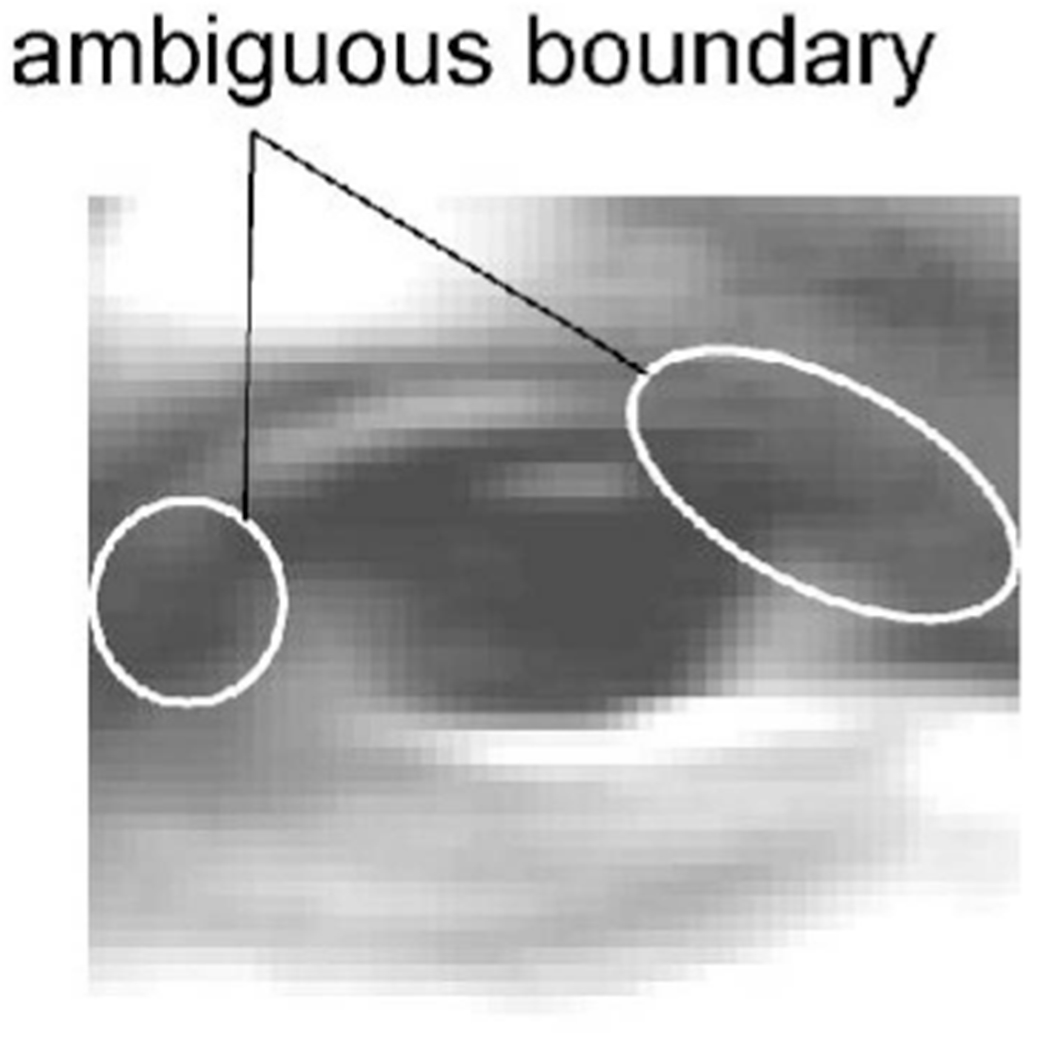
An example of ambiguous boundaries around the palpebral fissure.
5.2.2. Effect of Eye Model Details
The eye region model defines many structural components to represent the diversities of eye structure and motion. To investigate whether all are necessary, we systematically omitted each component and examined the resulting change in tracking error. Table 10 shows the results of this comparison. When the model for double eyelid folds was omitted, tracking of the upper eyelid (Table 10a) was compromised. Omitting components for the appearance below the eye (Table 10b) and only the brightness region on the bulge (Table 10c) had similar effects. To achieve accurate and robust eye motion tracking for diverse eye appearances and motion, all the detailed components of the eye region model proven necessary.
In Table 10a, the tracking error ϵ shows that tracking of the other parts of the eye model was also compromised without the model for double eyelid folds (the error for the upper eyelid curve u1, the lower eyelid curve l1, and the iris center ηx and ηx are shown in parentheses). This indicates that the model components support tracking accuracy as a whole and erroneous individualization of one component affected tracking accuracy of the other parts.
5.2.3. Sensitivity to Model Initialization
The eye region model is manually initialized in the first frame with respect to both the structure parameters s and the motion parameters mt. We observed that the initialization of the structure parameters (individualization of the model) dominantly affected the tracking results. To evaluate sensitivity of the system to initialization, we individually manipulated each structure parameter in turn while leaving the others fixed. Fig. 12b is the eye region model individualized to an example of input eye region images shown in Figs. 12a and 12c shows changes in tracking error when parameter du was varied from 0.0 to 1.0 while leaving other parameters fixed to f = 0.7, db = 0.71, dr = 0.7, ri = 0.5, and Ir7 = 0.7. Figs. 12d, 12e, 12f, 12g, and 12h were similarly obtained. Each of the individualized structure parameters that provided stable tracking also locally minimized the tracking error. Only the parameter dr was sensitive to the initialization in this particular example (the tracking error rapidly increased for the slight change of dr). We also observed that parameters were intercorrelated. Fig. 13 shows a contour plot of tracking error against the changes of an example pair of structure parameters for the same image sequence used in Fig. 12. Nonlinearity is obvious, yet with weak linearity.
Fig. 12.
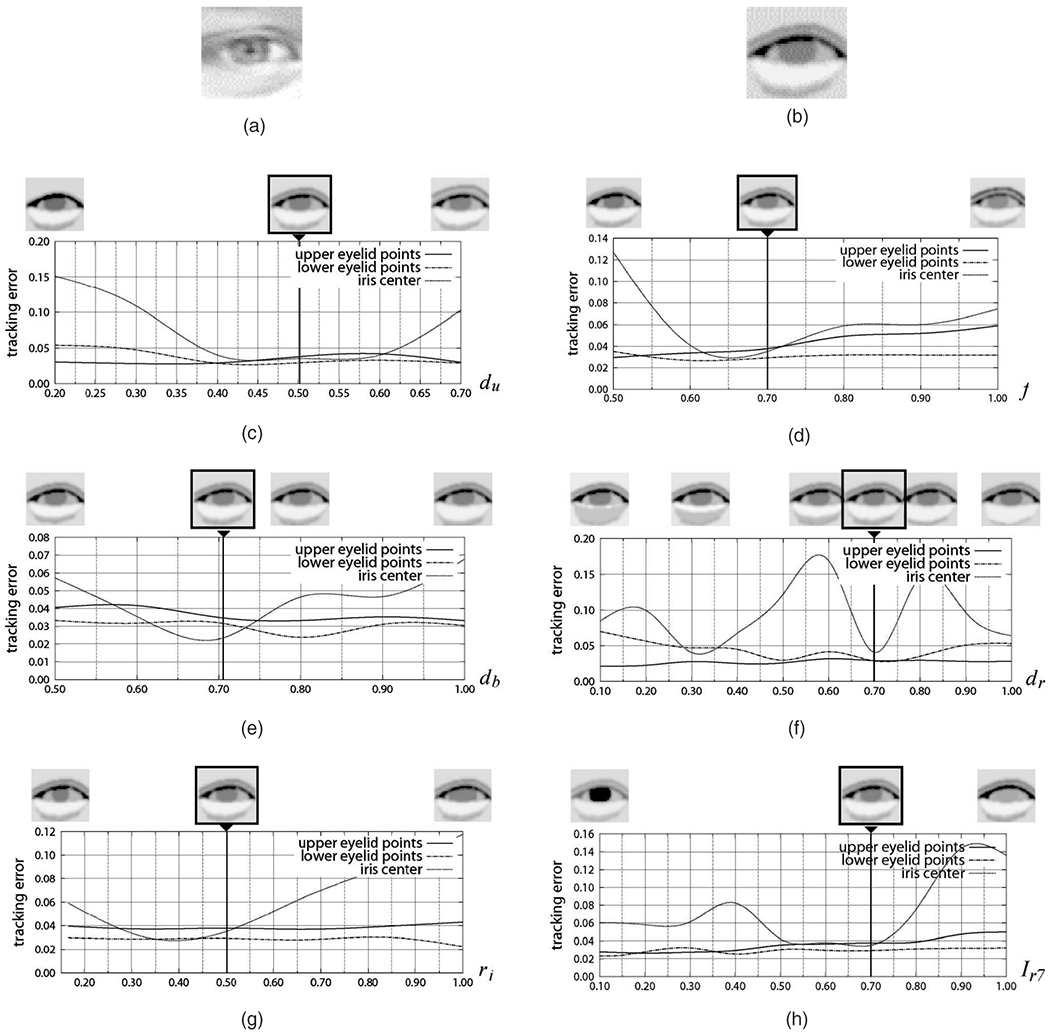
An example of individualization of the model and the sensitivity to the parameter changes. (a) Input eye region image. (b) Individualized eye model s = {du, f, db, dr, ri, Ir7} = {0.5, 0.7, 0.71, 0.7, 0.5, 0.7}. (c) Sensitivity to parameter du. (d) Sensitivity to parameter f. (e) Sensitivity to parameter db. (f) Sensitivity to parameter dr. (g) Sensitivity to parameter ri. (h) Sensitivity to parameter Ir7.
Fig. 13.
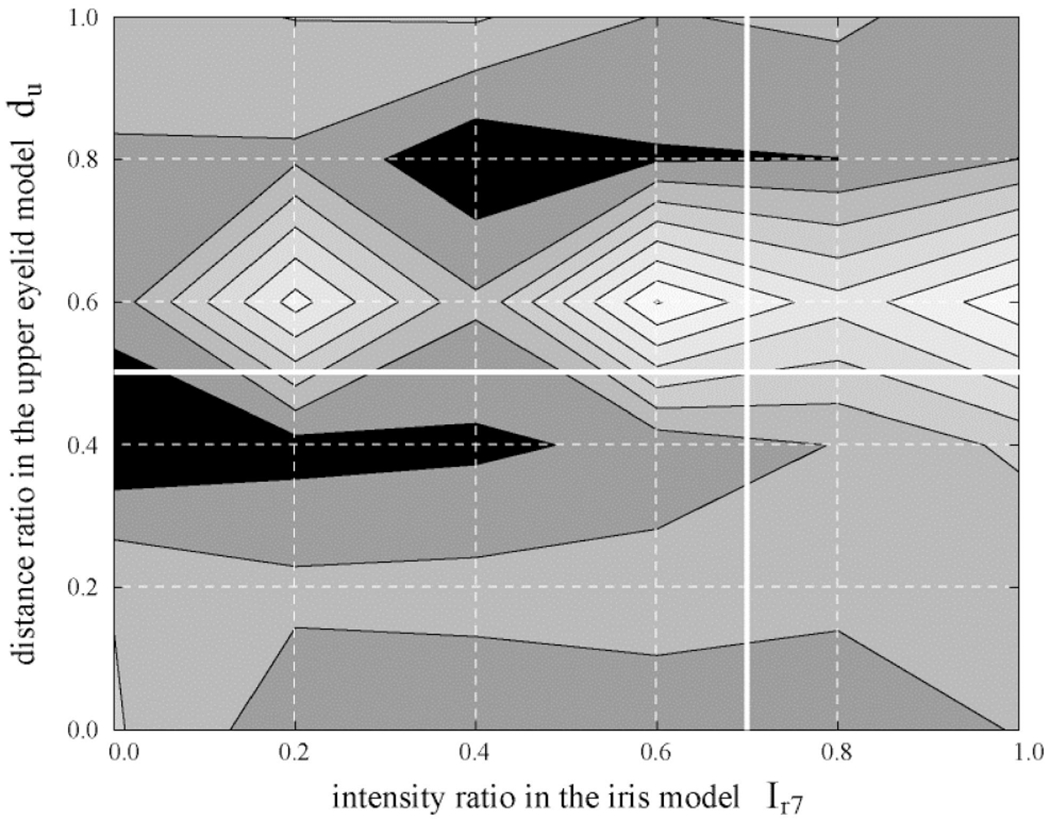
A contour plot of tracking error against an example pair of the structure parameters: the intensity ratio of the iris model Ir7 versus the distance ratio between eyelid folds du. The other parameters were left fixed. The brighter region indicates larger error. White lines are the values individualized in Fig. 12.
6. Conclusion
The appearance of the eyes varies markedly due to both individual differences in structure and the motion of the eyelids and iris. Structural individuality includes the size and color of the iris, the width, boldness, and number of eyelid folds, the width of the bulge below the eye, and the width of the illumination reflection on the bulge. Eye motion includes the up-down action of the upper and lower eyelids and the 2D movement of the iris. This variation together with self-occlusion and change of reflection and shape of furrows and bulges has made robust and precise analysis of the eye region a challenging problem. To meticulously represent detailed appearance variation in both structural individuality and eye motion, we developed a generative eye-region model and evaluated its effectiveness by using it to analyze a large number of face image sequences from two independent databases. The use of the detailed model led to better results than those previously reported. The system achieved precise tracking of the eyes over a variety of eye appearances and motions. Future work includes initialization of the eye region model by automatic registration.
Acknowledgments
The authors would like to thank Jessie Van Swearingen and Karen L. Schmidt for their insights on the anatomy of the eyes and Zara Ambadar, Nicki Ridgeway, Camilla Kydland, Lindsey Morris, and Simon Cohn for technical assistance. This work was supported by grants R01 MH51435 from the US National Institutes of Mental Health. T. Moriyama and J. Xiao were with Carnegie Mellon University, Pittsburgh, Pennsylvania.
Biographies

Tsuyoshi Moriyama received the PhD degree in electrical engineering from Keio University, Japan, in 1999. He is an assistant professor in the Department of Information and Computer Science at Keio University. After being a JSPS research fellow at Institute of Industrial Science at the University of Tokyo, Japan, and a postdoctoral fellow at the Robotics Institute at Carnegie Mellon University, he joined Keio University in 2004. He has worked in many projects involved with multidisciplinary areas, including analysis/synthesis of emotional speech, automated summarization of movies, and automated facial expression analysis on computer vision. In addition to research activities, he has also dedicated himself to musical activities as a tenor, including performances with the Wagner Society Male Choir of Japan 1990-2000 and the Pittsburgh Camerata 2001-2003. He is a member of the IEEE and a member of the IEICE of Japan. He received IEICE Young Investigators Award 1998.

Takeo Kanade received the PhD degree in electrical engineering from Kyoto University, Japan, in 1974. He is a UA Helen Whitaker University Professor of Computer Science and Robotics at Carnegie Mellon University. After holding a junior faculty position in the Department of Information Science, Kyoto University, he joined Carnegie Mellon University in 1980, where he was the director of the Robotics Institute from 1992 to 2001. Dr. Kanade has worked in multiple areas of robotics: computer vision, multimedia, manipulators, autonomous mobile robots, and sensors. He has written more than 250 technical papers and reports in these areas and has more than 15 patents. He has been the principal investigator of more than a dozen major vision and robotics projects at Carnegie Mellon. He has been elected to the National Academy of Engineering and to American Academy of Arts and Sciences. He is a fellow of the IEEE, a fellow of the ACM, a founding fellow of the American Association of Artificial Intelligence (AAAI), and the former and founding editor of the International Journal of Computer Vision. He has received several awards, including the C & C Award, Joseph Engelberger Award, Allen Newell Research Excellence Award, JARA Award, Marr Prize Award, and FIT Funai Accomplishment Award. Dr. Kanade has served on government, industry, and university advisory or consultant committees, including Aeronautics and Space Engineering Board (ASEB) of National Research Council, NASA’s Advanced Technology Advisory Committee, PITAC Panel for Transforming Healthcare Panel, the Advisory Board of Canadian Institute for Advanced Research.

Jing Xiao received the BS degree in electrical engineering from the University of Science and Technology of China in 1996, the MS degree in computer science from the Institute of Automation, Chinese Academy of Science in 1999, and the PhD degree in robotics from the Robotics Institute, Carnegie Mellon University in 2005. His research interests include computer vision, pattern recognition, image processing, human interface, computer animation, and related areas. He has authored or coauthored more than 30 publications in these areas. He is a member of the IEEE.

Jeffrey F. Cohn earned the PhD degree in clinical psychology from the University of Massachusetts in Amherst. He is a professor of psychology and psychiatry at the University of Pittsburgh and an Adjunct Faculty member at the Robotics Institute, Carnegie Mellon University. For the past 20 years, he has conducted investigations in the theory and science of emotion, depression, and nonverbal communication. He has co-led interdisciplinary and interinstitutional efforts to develop advanced methods of automated analysis of facial expression and prosody and applied these tools to research in human emotion and emotion disorders, communication, biomedicine, biometrics, and human-computer interaction. He has published more than 120 papers on these topics. His research has been supported by grants from the US National Institutes of Mental Health, the US National Institute of Child Health and Human Development, the US National Science Foundation, the US Naval Research Laboratory, and the US Defense Advanced Research Projects Agency. He is a member of the IEEE and the IEEE Computer Society.
Footnotes
For more information on this or any other computing topic, please visit our Digital Library at www.computer.org/publications/dlib.
Contributor Information
Tsuyoshi Moriyama, Department of Science and Technology, Keio University, 3-14-1 Hiyoshi, Kouhoku-ku, Yokohama-shi, Kanagawa 223-8522 Japan.
Takeo Kanade, Robotics Institute, Carnegie Mellon University, 5000 Forbes Ave., Pittsburgh, PA 15213-3890.
Jing Xiao, Epson Palo Alto Laboratory, Epson Research and Development, Inc., Palo Alto, CA 94304.
Jeffrey F. Cohn, University of Pittsburgh, 4327 Sennott Square, Pittsburgh, PA 15260.
References
- [1].Kapoor A, Qi Y, and Picard RW, “Fully Automatic Upper Facial Action Recognition,” Proc. IEEE Int’l Workshop Analysis and Modeling of Faces and Gestures, pp. 195–202, Oct. 2003. [Google Scholar]
- [2].Moriyama T, Kanade T, Cohn JF, Xiao J, Ambadar Z, Gao J, and Imamura H, “Automatic Recognition of Eye Blinking in Spontaneously Occurring Behavior,” Proc. IEEE Int’l Conf. Pattern Recognition, pp. 78–81, Aug. 2002. [Google Scholar]
- [3].Tian Y, Kanade T, and Cohn JF, “Recognizing Action Units for Facial Expression Analysis,” IEEE Trans. Pattern Analysis and Machine Intelligence, vol. 23, no. 2, pp. 97–115, Feb. 2001. [DOI] [PMC free article] [PubMed] [Google Scholar]
- [4].Matsumoto Y, Ogasawara T, and Zelinsky A, “Behavior Recognition Based on Head Pose and Gaze Direction Measurement,” Proc. IEEE/RSJ Int’l Conf. Intelligent Robots and Systems, pp. 2127–2132, 2000. [Google Scholar]
- [5].Zhu J and Yang J, “Subpixel Eye Gaze Tracking,” Proc. IEEE Int’l Conf. Automatic Face and Gesture Recognition, pp. 131–136, May 2002. [Google Scholar]
- [6].Wang JG and Sung E, “Study on Eye Gaze Estimation,” IEEE Trans. Systems, Man, and Cybernetics, Part B, vol. 32, no. 3, pp. 332–350, 2002. [DOI] [PubMed] [Google Scholar]
- [7].Fukuda K, “Eye Blinks: New Indices for the Detection of Deception,” Psychophysiology, vol. 40, no. 3, pp. 239–245, 2001. [DOI] [PubMed] [Google Scholar]
- [8].Gross R, Shi J, and Cohn J, “Quo Vadis Face Recognition?” Proc. Third Workshop Empirical Evaluation Methods in Computer Vision, Dec. 2001. [Google Scholar]
- [9].Facial Action Coding System. Ekman P et al. , eds., Research Nexus, Network Research Information, Salt Lake City, Utah, 2002. [Google Scholar]
- [10].Ekman P and Rosenberg E, What the Face Reveals, second ed. New York: Oxford Univ. Press, 1994. [Google Scholar]
- [11].Gokturk SB, Bouguet JY, Tomasi C, and Girod B, “Model-Based Face Tracking for View-Independent Facial Expression Recognition,” Proc. IEEE Face and Gesture Conf., pp. 272–278, 2002. [Google Scholar]
- [12].Pantic M and Rothkrantz LJM, “Automatic Analysis of Facial Expression: The State of the Art,” IEEE Trans. Pattern Analysis and Machine Intelligence, vol. 22, no. 12, pp. 1424–1445, Dec. 2000. [Google Scholar]
- [13].Ravyse I, Sahli H, and Cornells J, “Eye Activity Detection and Recognition Using Morphological Scale-Space Decomposition,” Proc. IEEE Int’l Conf. Pattern Recognition, vol. 1, pp. 5080–5083, 2000. [Google Scholar]
- [14].Choi SH, Park KS, Sung MW, and Kim KH, “Dynamic and Quantitative Evaluation of Eyelid Motion Using Image Analysis,” Medical and Biological Eng. and Computing, vol. 41, no. 2, pp. 146–150, 2003. [DOI] [PubMed] [Google Scholar]
- [15].Herpers R, Michaelis M, Lichtenauer KH, and Sommer G, “Edge and Keypoint Detection in Facial Regions,” Proc. IEEE Face and Gesture Conf., pp. 212–217, 1996. [Google Scholar]
- [16].Chen H, Yu YQ, Shum HY, Zhu SC, and Zheng NN, “Example Based Facial Sketch Generation with Non-Parametric Sampling,” Proc. IEEE Int’l Conf. Computer Vision, vol. 2, pp. 433–438, 2001. [Google Scholar]
- [17].Lee SP, Badler JB, and Badler NI, “Eyes Alive,” Proc. Int’l Conf. Computer Graphics and Interactive Techniques, pp. 637–644, 2002. [Google Scholar]
- [18].Xie X, Sudhakar R, and Zhuang H, “On Improving Eye Feature Extraction Using Deformable Templates,” Pattern Recognition, vol. 27, no. 6, pp. 791–799, June 1994. [Google Scholar]
- [19].Deng J and Lai F, “Region-Based Template Deformable and Masking for Eye-Feature Extraction and Description,” Pattern Recognition, vol. 30, no. 3, pp. 403–419, Mar. 1997. [Google Scholar]
- [20].Chow G and Li X, “Towards a System for Automatic Facial Feature Detection,” Pattern Recognition, vol. 26, no. 12, pp. 1739–1755, Dec. 1993. [Google Scholar]
- [21].Yuille A, Cohen D, and Hallinan P, “Feature Extraction from Faces Using Deformable Templates,” Int’l J. Computer Vision, vol. 8, no. 2, pp. 99–111, Aug. 1992. [Google Scholar]
- [22].Tian Y, Kanade T, and Cohn JF, “Eye-State Detection by Local Regional Information,” Proc. Int’l Conf. Multimodal User Interface, pp. 143–150, Oct. 2000. [Google Scholar]
- [23].Sirovich L and Kirby M, “Low-Dimensional Procedure for the Characterization of Human Faces,” J. Optical Soc. of Am, vol. 4, pp. 519–524, 1987. [DOI] [PubMed] [Google Scholar]
- [24].Turk MA and Pentland AP, “Face Recognition Using Eigenfaces,” Proc. IEEE Conf. Computer Vision and Pattern Recognition, pp. 586–591, 1991. [Google Scholar]
- [25].King I and Xu L, “Localized Principal Component Analysis Learning for Face Feature Extraction,” Proc. Workshop 3D Computer Vision, pp. 124–128, 1997. [Google Scholar]
- [26].Xiao J, Moriyama T, Kanade T, and Cohn JF, “Robust Full-Motion Recovery of Head by Dynamic Templates and Re-Registration Techniques,” Int’l J. Imaging Systems and Technology, vol. 13, pp. 85–94, Sept. 2003. [DOI] [PMC free article] [PubMed] [Google Scholar]
- [27].Lucas BD and Kanade T, “An Iterative Image Registration Technique with an Application to Stereo Vision,” Proc. Int’l Joint Conf. Artificial Intelligence, pp. 674–679, 1981. [Google Scholar]
- [28].Kanade T, Cohn JF, and Tian Y, “Comprehensive Database for Facial Expression Analysis,” Proc. IEEE Face and Gesture Conf., pp. 46–53, 2000. [Google Scholar]
- [29].Ekman P, Hagar J, Methvin CH, and Irwin W “Ekman-Hagar Facial Action Exemplars,” Human Interaction Laboratory, Univ. of California, San Francisco: unpublished data. [Google Scholar]
- [30].Pantic M and Rothkrantz LJM, “Expert System for Automatic Analysis of Facial Expression,” Image and Vision Computing, vol. 18, no. 11, pp. 881–905, Aug. 2000. [Google Scholar]
- [31].Lien JJ, Kanade T, Cohn JF, and Li C, “Detection, Tracking, and Classification of Subtle Changes in Facial Expression,” J. Robotics and Autonomous Systems, vol. 31, pp. 131–146, 2000. [Google Scholar]
- [32].Active Vision. Blake A and Yuille A eds., chapter 2, pp. 21–38, MIT Press, 1992. [Google Scholar]


