

Abstract
Summary
Mice with osteogenesis imperfecta (+/oim), a disorder of bone fragility, were bred to mice with muscle over growth to test whether increasing muscle mass genetically would improve bone quality and strength. The results demonstrate that femora from mice carrying both mutations have greater mechanical integrity than their +/oim littermates.
Introduction
Osteogenesis imperfecta is a heritable connective tissue disorder due primarily to mutations in the type I collagen genes resulting in skeletal deformity and fragility. Currently, there is no cure, and therapeutic strategies encompass the use of antiresorptive pharmaceuticals and surgical bracing, with limited success and significant potential for adverse effects. Bone, a mechanosensing organ, can respond to high mechanical loads by increasing new bone formation and altering bone geometry to withstand increased forces. Skeletal muscle is a major source of physiological loading on bone, and bone strength is proportional to muscle mass.
Methods
To test the hypothesis that congenic increases in muscle mass in the osteogenesis imperfecta murine model mouse (oim) will improve their compromised bone quality and strength, heterozygous (+/oim) mice were bred to mice deficient in myostatin (+/mstn), a negative regulator of muscle growth. The resulting adult offspring were evaluated for hindlimb muscle mass, and bone microarchitecture, physiochemistry, and biomechanical integrity.
Results
+/oim mice deficient in myostatin (+/mstn +/oim) were generated and demonstrated that myostatin deficiency increased body weight, muscle mass, and biomechanical strength in +/mstn +/oim mice as compared to +/oim mice. Additionally, myostatin deficiency altered the physiochemical properties of the +/oim bone but did not alter bone remodeling.
Conclusions
Myostatin deficiency partially improved the reduced femoral bone biomechanical strength of adult +/oim mice by increasing muscle mass with concomitant improvements in bone microarchitecture and physiochemical properties.
Keywords: Biomechanics, Bone, Myostatin, Osteogenesis imperfecta, Raman spectroscopy, Skeletal muscle
Introduction
Osteogenesis imperfecta (OI) is a genetically and clinically heterogeneous heritable connective tissue disorder characterized by anomalies in type I collagen-containing tissues such as bone [1, 2]. The major structural protein comprising the organic component of bone is type I collagen. More than 1000 distinct OI-causing mutations have been identified with 90 % of OI causing mutations in one of the two procollagen genes, COL1A1 and COL1A2 [1, 2]. Individuals with OI exhibit a broad range of clinical outcomes and manifestations including osteopenia with fractures, skeletal deformities, short stature, and skeletal muscle weakness [1–3]. The osteogenesis imperfecta murine model (oim/oim) mice are homozygous for a functional null mutation in the Col1a2 gene of type I collagen [4]. Oim/oim mice have a similar phenotype to human patients with moderately severe OI, including reduced bone biomechanical integrity and bone mineral density as well as altered bone mineral composition and inherent skeletal muscle weakness [4–7]. The heterozygous (+/oim) mice carry a single mutant Col1a2 allele and synthesize both homotrimeric and heterotrimeric type I collagen. +/oim mice model the milder clinical severity of human type I OI individuals. While fractures are less frequent in +/oim mice compared to homozygous oim/oim mice, the +/oim mice still exhibit altered midshaft geometry, decreased biomechanical strength, collagen content, crystallinity, and crack-initiation toughness when compared to wild-type (Wt) littermates, though to a lesser degree than oim/oim [6, 8–10]. Current treatment strategies for OI patients primarily target symptoms, not the underlying cause of the disease, and are limited to pharmacologic use of antiresorptive drugs and surgical interventions to brace the bone. Both approaches have limited success and significant concerns due to frequency of failure and potential side effects of long-term use [2].
The skeleton is a mechanosensing organ, responding and adapting to its mechanical environment [11, 12]. Bone formation occurs in response to high mechanical loads, often changing the geometry to strengthen the skeleton [11–14]. Some of the largest physiological loads bones experience are from muscle, with bone strength proportional to muscle mass [12]. We postulated that although the OI bone material is bio-mechanically weaker, the bone will be able to respond to increased muscle mass, especially during pubertal growth, by altering bone geometry, architecture, material properties, and/or mass to generate an inherently stronger bone.
Myostatin is a negative regulator of muscle growth and a transforming growth factor-beta (TGF-β) family member. In homozygous myostatin mice (mstn/mstn), myostatin is developmentally absent, and the result is significantly greater muscle mass due to muscle hyperplasia and hypertrophy [15, 16]. Heterozygous (+/mstn) mice have an intermediate phenotype as compared to Wt and mstn/mstn, suggesting a dose effect of the myostatin protein [17]. Partial myostatin inhibition as seen in +/mstn mice and in whippet dogs heterozygous for a myostatin mutation results in increased muscle size and function with minimal lesions [17, 18]. In addition to the increased muscle mass, mstn/mstn mice exhibit altered bone geometry [19] and display a concomitant increase in bone strength [14].
We hypothesized that although oim muscle and bone are compromised, a reduction in myostatin protein levels during fetal development and throughout life would increase muscle mass and mechanical load in +/oim mice causing the bone to respond by altering bone geometry, microarchitecture, physiochemical properties, and/or mass to generate an inherently stronger bone and attenuate the bone phenotype of +/oim mice. Our findings demonstrate that partial myostatin deficiency (+/mstn) results in increased muscle mass and moderate improvements in femoral bone quality and strength in +/oim mice by primarily impacting the bone microarchitecture and physiochemical composition rather than cortical bone geometry.
Materials and methods
Animals
To determine the impact of myostatin deficiency in the presence of the +/oim mutation, both mouse models, mstn and oim, were bred and maintained on a congenic C57BL/6J (Jackson Laboratory, Bar Harbor, Maine) background to control for potential modifier gene effects. Mice were housed in an AAALAC accredited facility at the University of Missouri-Columbia and had ad libitum access to water and food (Purina 5008 Formulab Diet; Purina Mills Inc., St Louis, MO). The protocols used for this study were performed under an approved University of Missouri Animal Care and Use Protocol. Dams heterozygous for myostatin deficiency (+/mstn) were bred to sires heterozygous for the oim mutation (+/oim) (Fig. 1A). The offspring were raised to 4 months of age (peak bone mineral density [20]), sacrificed, and their serum, hindlimb muscles, tibiae, and femora harvested for analyses.
Fig. 1.
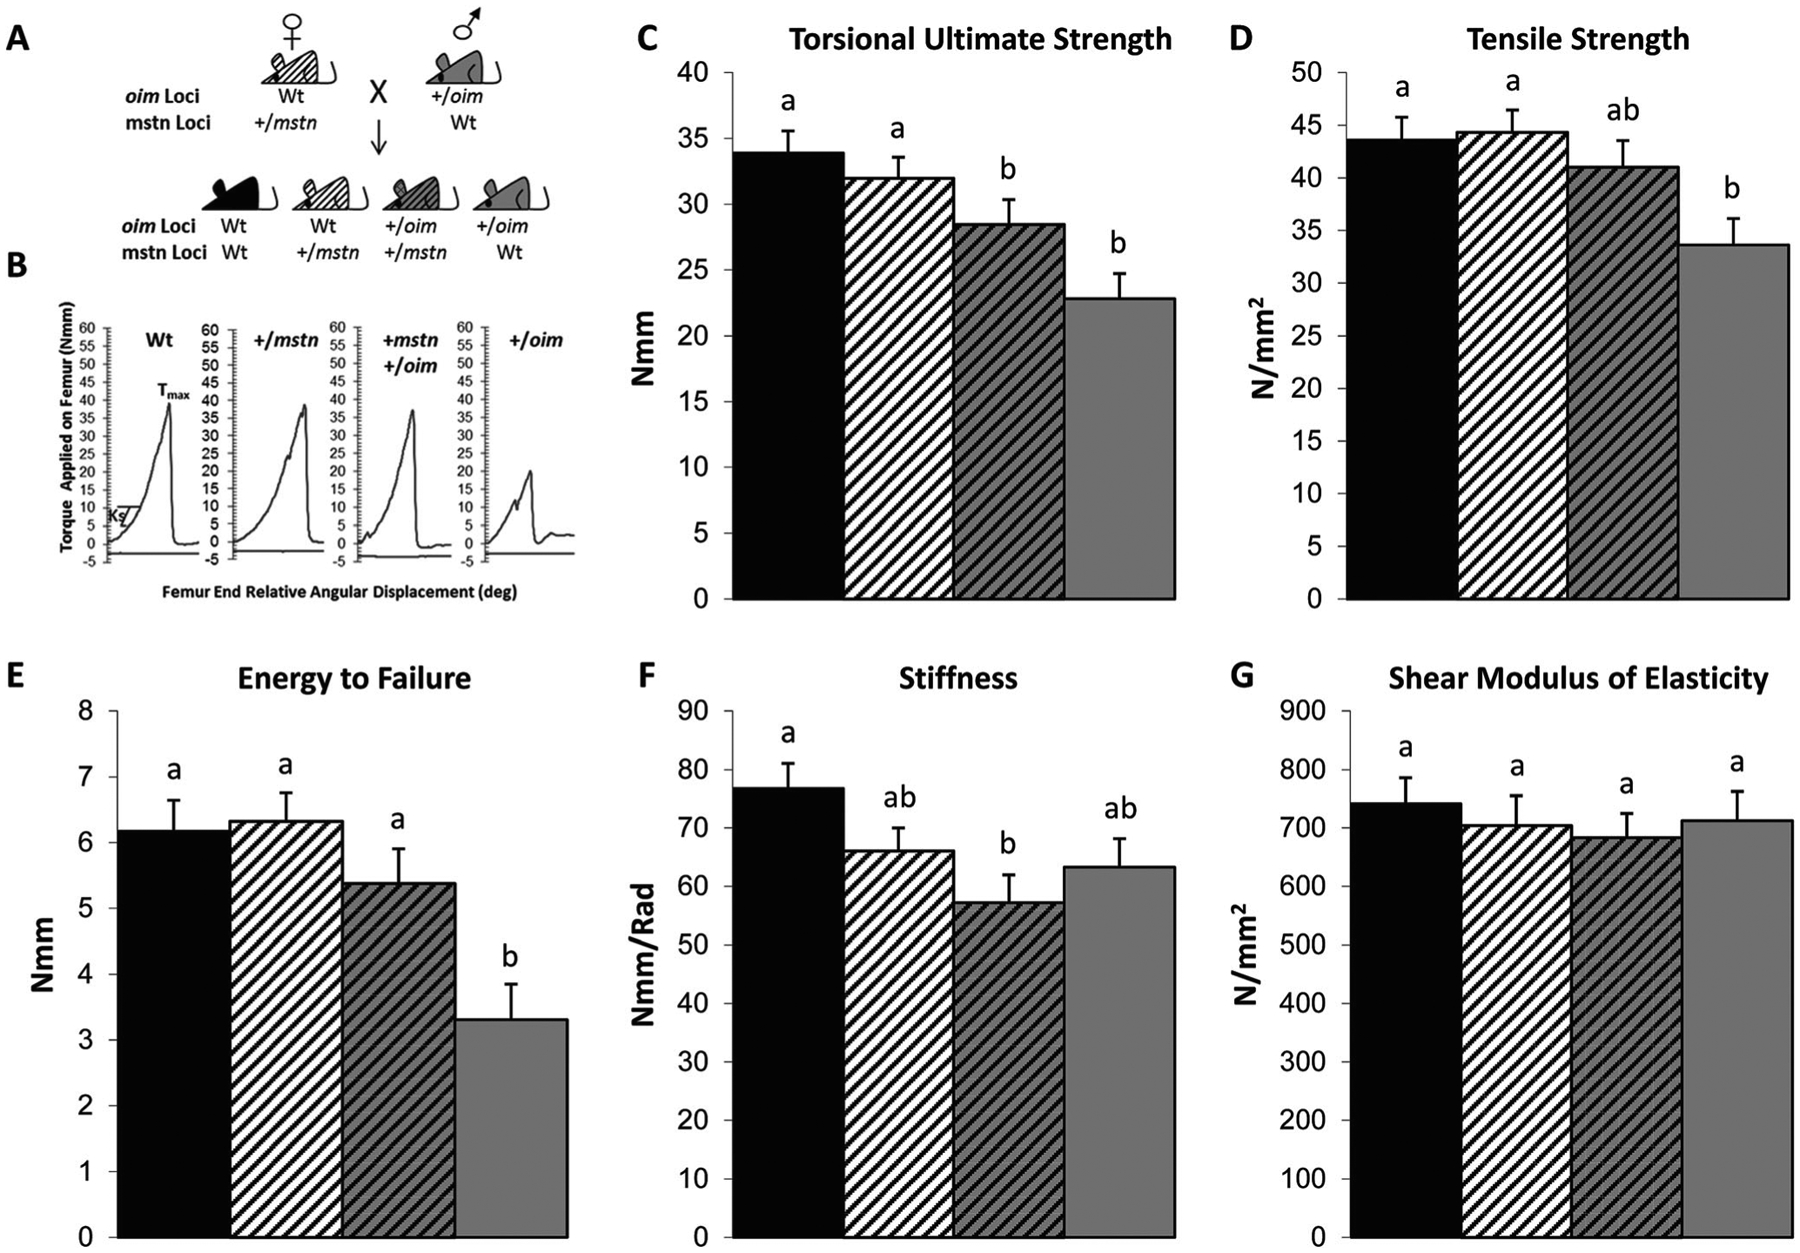
A Schematic of the +/mstn (dam) X +/oim (sire) mice breeding scheme with the resultant genotypes of the offspring indicated. B Representative graphs showing the torque applied on the femur of Wt, +/mstn, +/mstn +/oim, and +/oim offspring per angular displacement. B–G Myostatin deficiency partially rescues the bone phenotype of +/oim mice as seen in 4-month-old +/mstn +/oim femora. C Torsional ultimate strength (Tmax), D tensile strength (Su), E energy to failure (U), F torsional stiffness (Ks), G shear modulus of elastcity. The genotype main effect was evaluated. Values are the LSmeans±SE of the combined genotype values regardless of sex. Values with the same superscript letter are not significantly different. Differences were considered significant at p≤0.05. Wt (solid black), n=21; +/mstn (black and white), n=25–26; +/mstn, +/oim (black and gray), n=18; +/oim (gray), n=18
Tissue harvest
Left hindlimb muscles (soleus, plantaris, gastrocnemius, tibialis anterior, and quadriceps) were removed, cleaned of extraneous tissue, blotted, and weighed. Femora and tibiae were excised, the soft tissue removed, and the bones wrapped in sterile gauze soaked in sterile 1× phosphate-buffered saline (PBS) prior to storage at −20 ° C.
Tibial microarchitecture analyses
Prior to analyses by Raman spectroscopy, the macroarchitecture and microarchitecture of the left tibiae were determined by microcomputed tomography (μCT) with the vivaCT 40 (Scanco Medical AG, Bassersdorf, Switzerland) as previously described [9] using 55-kVp X-ray tube potential, 145-μA current, 10-μm voxel resolution, and 200-ms integration time to assess cortical bone and trabecular bone properties. By hydroxyapatite calibration, the voxel values were converted to a mineral-equivalent value, milligrams per cubic centimeter (mg/cm3). Three-dimensional images of the tibiae were reconstructed along the long axis with series of 10-μm-thick slices, using a global threshold of 253 (μCT gray value). For each tibia, the proximal metaphysic trabecular bone was analyzed 1 mm below the growth plate, while the cortical bone was evaluated at the mid-shaft starting 1 mm above fibula-tibia junction.
Femoral μCT and torsional loading to failure
The geometric parameters of the right femora were determined by μCT analyses (MicroCAT II, Siemens Medical), and the image slices reconstructed using the Amira 5.3.3 software package (Mercury Computer Systems/TGS, Chelmsford, MA) to give a cubic voxel dimension of 0.083 mm3 as previously described [21]. Each femora was then subjected to torsional loading to failure analyses to determine the mechanical properties of the whole bone and the bone material using the TA-HDi testing machine (Stable Micro Systems, Surrey, UK) as previously described [21]. Applied torque T (Nmm) was determined and evaluated as a function of relative angular displacement θ (degrees) (Fig. 1B). Torsional ultimate strength (Tmax, Nmm), strain energy to failure (U, Nmm), and stiffness (torsional stiffness, Nmm/rad) are whole bone parameters reflecting the contributions of both the bone geometry and the bone material properties. The bone material properties, tensile strength (Su, N/mm2), and shear modulus of elasticity (N/mm2) are independent of bone size and shape [21].
Bone mineral and matrix composition
Left tibial cortical bone cross sections were evaluated by Raman spectroscopy using a LabRam HR 800 Raman spectrometer (Horiba JobinYvon, Edison, NJ). Average bone biochemical composition was determined from Raman spectra (700- to 1800-cm−1 range) that were excited by a helium-neon laser (633 nm) with a 20× water immersion objective as previously described [9], allowing acquisition of peaks attributed to the bone minerals and proteins. Each tibia was examined at 4 points from anterior, posterior, medial, and lateral cross section and the data averaged for each sample. Spectral analyses were performed to measure the area of hydroxyapatite phosphate (ν1 PO43−; 960 cm−1), carbonate (type B ν1 CO32−; 1070 cm−1), matrix (CH2; 1450 cm−1), and collagen (amide I; 1640 cm−1) bands [9]. Assessed were as follows: (1) the phosphate/CH2 ratio, which increases with increasing bone mineral content; (2) the phosphate/carbonate, which decreases with increasing bone age; and (3) the PO4/amide I ratio, which represents the bone mineral to collagen ratio [22].
To quantitate bone collagen, the left femora were weighed and the collagen content determined indirectly by quantitation of hydroxyproline content (μg/g bone) as described by Stegemann and Stalder [23].
Serum biomarkers of collagen synthesis and degradation
At the time of sacrifice, blood was collected by exsanguination and the serum separated by centrifugation at 14,000 rpm for 15 min and stored at −80 °C until assayed. Serum levels of N-terminal propeptide of type I procollagen (PINP), a biomarker of collagen synthesis, and C-terminal cross-linked telopeptide of type I collagen (CTX), a biomarker of collagen degradation, were quantitated using the commercially available enzyme immunoassay kits, the Rat/Mouse PINP EIA kit (AC-33F1) and the RatLaps™ EIA kit (AC-06F1) by Immunodiagnostics Systems (Scottsdale, Arizona), respectively. Samples and standards were assayed in duplicate following the manufacturer’s specifications except that the microplate was placed on a shaker at 400 rpm rather than the suggested 500–700 rpm. The samples and standards were measured at A450 and A650 using the BioTek Synergy 2 Multi-Mode Reader and Gen5™ Data Analysis Software v2.00.17 (Winooski, Vermont). A standard curve was generated by plotting the absorbance and concentration values of the standards using a four parameter logistic curve-fit.
Statistical analysis
Statistical analyses were performed using SAS (SAS Institute Inc., Cary, NC). Data were analyzed as a 4×2 factorial arrangement [4 genotypes and 2 sexes]. Specifically, the body, muscle, and relative muscle weights were evaluated by analysis of variance, and the bone geometric and biomechanical parameters, hydroxyproline content, and Raman spectroscopy physiochemical ratios, as well as the serum PINP and CTX data, were evaluated by analysis of covariance with body weight as the covariate. Genotype and sex interactions and the genotype and sex main effects were evaluated. Genotype and sex interactions were significant for only two of the parameters evaluated, the tibial trabecular thickness and separation. Body, muscle and relative muscle weights, and bone geometric and biomechanical parameters, hydroxyproline content, serum biomarkers, and physiochemical ratios all exhibited a main genotype effect, allowing pooling of male and female values. The main genotype effect values for the parameters are presented as the LSmeans±SE. When heterogeneous variations made it necessary, a log transformation was used to stabilize the variation. If the log transformation failed to stabilize the variation, a nonparametric ranked analysis was performed according to Conover et al. [25]. Mean differences were determined using Fisher’s protected least significant difference (LSD) (24). Differences were considered to be significant at p≤0.05.
Results
Body and muscle weights
To assess the effect of the myostatin deficiency on the body and hindlimb muscle weights of +/oim mice, Wt, +/mstn, +/mstn +/oim, and +/oim mice were sacrificed, weighed, and their muscles harvested. Wt, +/mstn, and +/mstn +/oim mice weighed more than +/oim mice, with +/mstn +/oim mice weighing 11 % more than their +/oim littermates. +/mstn and +/mstn +/oim mice had greater muscle weights for all five hindlimb muscles relative to their Wt and +/oim littermates (Table 1). Even when muscle weight was normalized to the body weight, the relative muscle weights of +/mstn mice remained greater than Wt, while the +/oim mice relative muscle weights were not significantly different from Wt mice. The relative muscle weights of +/mstn and +/mstn +/oim were equivalent, and +/mstn +/oim relative muscle weights were also greater than Wt, reaching significance for the plantaris and tibialis anterior muscles.
Table 1.
Body and hindlimb muscle and relative muscle weights of adult 4-month-old offspring of +/mstn X +/oim crosses
| Parameter | Wt n=24–27 | +/mstn n=32–34 | +/mstn +/oim n=35 | +/oim n=27 |
|---|---|---|---|---|
| Body weight (g) | 27.26±0.46a | 28.55±0.42b | 28.74±0.41b | 25.91±0.46c |
| Muscle wet weight (mg) | ||||
| Soleus | 8.51±0.36a | 10.20±0.32b | 9.64±0.30b | 8.24±0.34a |
| Plantaris | 18.01±0.54a | 21.31±0.48b | 21.15±0.45b | 16.72±0.51a |
| Gastrocnemius | 123.4±3.6a | 147.9±3.2b | 140.1±3.0b | 120.1±3.4a |
| Tibialis anterior | 49.27±1.73a | 58.89±1.54b | 59.67±1.43b | 49.97±1.63a |
| Quadriceps | 197.4±6.0a | 232.0±5.3b | 232.0±5.0b | 198.5±5.6a |
| Relative wet muscle weight [wet weight (mg)/body weight (g)] | ||||
| Soleus | 0.032±0.001a | 0.036±0.001b | 0.034±0.001ab | 0.032±0.001a |
| Plantaris | 0.068±0.002a | 0.074±0.002b | 0.074±0.002b | 0.064±0.001a |
| Gastrocnemius | 0.467±0.013a | 0.516±0.012b | 0.487±0.011ab | 0.465±0.013a |
| Tibialis anterior | 0.187±0.007a | 0.207±0.006b | 0.209±0.006b | 0.195±0.007ab |
| Quadriceps | 0.748±0.022a | 0.808±0.020b | 0.803±0.019ab | 0.767±0.021ab |
Data were evaluated by analysis of variance and no genotype and sex interactions were found.
The genotype main effect was evaluated, and the values expressed are the LSmeans±SE of the combined genotype values regardless of sex. Values within a row with the same superscript letter are not significantly different. Differences were considered significant at p≤0.05
Tibial microarchitecture
Wt, +/mstn, +/mstn +/oim, and +/oim mouse tibiae were evaluated by μCT analyses and demonstrated that +/mstn tibiae had increased trabecular bone volume fraction (BV/TV), trabecular number, and connectivity density, along with decreased trabecular density, structure model index (SMI), and cortical density compared to Wt tibiae (Table 2). The deficiency of myostatin in the +/mstn +/oim tibia decreased trabecular and cortical bone densities and increased connectivity density of the +/oim bone. Myostatin deficiency improved the +/oim bone so that trabecular number and connectivity density in the +/mstn +/oim bone were no longer different from Wt (Table 2). Analysis of the trabecular thickness and trabecular separation revealed a sex and genotype interaction, indicating that males and females responded differently to myostatin deficiency. Myostatin deficiency increased trabecular thickness in male +/mstn and +/mstn +/oim tibiae relative to Wt and +/oim but did not impact female tibial trabecular thickness (Table 2). Trabecular separation was decreased by 8 % in female +/mstn +/oim tibiae compared to female +/oim tibiae, and by 5 % in male +/mstn +/oim tibiae compared to male +/oim, although it did not reach significance in males (Table 2).
Table 2.
Tibial microarchitecture of 4-month-old male offspring from +/mstn x +/oim crosses
| Parameter | Wt n=15 | +/mstn n=12 | +/mstn +/oim n=12 | +/oim n=12 |
|---|---|---|---|---|
| Trabecular bone | ||||
| BV/TV | 0.166±0.009a | 0.224±0.010b | 0.182±0.010a | 0.154±0.010a |
| Number (1/mm) | 4.41±0.14a | 4.94±0.15b | 4.30±0.15ac | 3.96±0.15c |
| Density (mg HA/CCM) | 833.6±7.1a | 790.7±7.9b | 804.3±7.8b | 857.8±7.8c |
| Connectivity density | 97.4±7.6a | 131.1±8.5b | 99.2±8.4a | 74.6±8.4c |
| SMI | 1.84±0.08a | 1.52±0.09b | 1.91±0.09a | 2.04±0.09a |
| Thickness (mm)* | ||||
| Male (n=6–8) | 0.055±0.002a | 0.064±0.001b | 0.063±0.002b | 0.057±0.003a |
| Female (n=6–7) | 0.052±0.001a | 0.052±0.001a | 0.055±0.002a | 0.056±0.002a |
| Separation (1/mm)* | ||||
| Male (n=6–8) | 0.164±0.003a | 0.150±0.011a | 0.166±0.006a | 0.175±0.007a |
| Female (n=6–7) | 0.307±0.012a | 0.285±0.023a | 0.366±0.032b | 0.394±0.017b |
| Cortical bone | ||||
| Thickness (mm) | 0.227±0.003a | 0.224±0.004ab | 0.216±0.004b | 0.216±0.003b |
| Density (mg HA/CCM) | 1129.5±8.8a | 1088.8±9.7b | 1115.0±9.6ab | 1149.3±9.3a |
Data were evaluated by analysis of covariance with body weight as the covariate
When genotype and sex interactions were significant, male and female values are expressed as means±SE. If the genotype and sex interaction were not significant, the genotype main effect was evaluated, and the values expressed are the LSmeans±SE of the combined genotype values regardless of sex. Values within a row with the same superscript letter are not significantly different. Differences were considered significant at p≤0.05
Femoral geometry
The femoral geometry of male and female Wt, +/mstn, +/mstn +/oim, and +/oim mice was also assessed by μCT analyses prior to torsional loading to failure. Femoral length and cortical bone width were equivalent across all genotypes. Cortical bone measurements at the midshaft slice were used to calculate polar moment of inertia, a geometric parameter which predicts an object’s ability to resist torsion; the greater the polar moment of inertia, the greater the predicted resistance to torque. Wt and +/mstn femora had equivalent polar moment of inertia and marrow cavity diameters, which were greater than the polar moment of inertia and marrow cavity diameters of the +/mstn +/oim and +/oim femora. Femora from +/mstn +/oim and +/oim mice did not exhibit differences in femoral geometry for all the parameters tested (Table 3).
Table 3.
Femoral geometry of adult 4-month-old offspring of +/mstn X +/oim crosses
| Geometric parameter | Wt n=21 | +/mstn n=26 | +/mstn +/oim n=20 | +/oim n=18 |
|---|---|---|---|---|
| Femur length (mm) | 16.18±0.08a | 15.96±0.08a | 16.11±0.09a | 16.05±0.09a |
| Marrow cavity diameter (mm) | 0.91±0.02a | 0.87±0.02a | 0.81±0.02b | 0.77±0.03b |
| Cortical bone width (mm) | 0.41±0.01a | 0.41±0.01a | 0.43±0.01a | 0.44±0.01a |
| Polar moment of inertia (mm4) | 0.76±0.03a | 0.69±0.03ac | 0.63±0.04b | 0.65±0.04bc |
Data were evaluated by analysis of covariance with body weight as the covariate. No genotype and sex interactions were found.
The genotype main effect was evaluated, and the values expressed are the LSmeans±SE of the combined genotype values regardless of sex. Values within a row with the same superscript letter are not significantly different. Differences were considered significant at p≤0.05
Femoral biomechanics
To evaluate bone biomechanical integrity, femora from Wt, +/mstn, +/mstn +/oim, and +/oim mice were analyzed by torsional loading to failure [21]. The torsional ultimate strength (Tmax), a whole bone property measuring the maximum force required to break the bone, of +/mstn +/oim femora displayed a 25 % improvement relative to +/oim femora although the improvement did not reach significance (Fig. 1C). The decreased levels of myostatin in the +/mstn +/oim mouse improved the tensile strength, a measure of the bone material, by 22 %, and although the difference did not reach significance, the improvement increased +/mstn +/oim tensile strength to that of Wt femora (Fig. 1D). The whole bone parameter, energy to failure had increased 63 % in the +/mstn +/oim compared to +/oim mouse femora and was now equivalent to both Wt and+/mstn femora (Fig. 1E), further suggesting that myostatin deficiency in the +/mstn +/oim enabled the bone to absorb more energy before fracturing. The femoral stiffness of +/mstn +/oim and +/oim mice was equivalent (Fig. 1F), and the shear modulus of elasticity of the femora, the measure of the stiffness of the bone material, was equivalent among femora from all genotypes examined (Fig. 1G).
Mineral-matrix interactions and collagen content
Bone is composed of an organic component, primarily type I collagen, and a mineral component, hydroxyapatite crystals. The ability of bone to resist fracture depends on bone mass and geometry as well as the intrinsic physiochemical properties and microarchitecture of the bone material. To investigate the composition and quality of the bone material, we examined the mineral and matrix composition using Raman spectroscopy (Fig. 2). Genotype differences were not observed in PO4/CO3 (phosphate to carbonate) ratios among Wt, +/mstn, +/mstn +/oim, and +/oim tibiae (Fig. 2A). Tibiae from +/mstn +/oim and +/oim had equivalent PO4/CH2 (mineral to protein) ratios, which were both increased by 12 % compared to Wt and +/mstn tibiae (Fig. 2B). The PO4/amide I (mineral to collagen) ratio of +/oim tibiae was greater than the PO4/amide I ratio of Wt tibiae (Fig. 2C). The presence of the myostatin mutation in the +/mstn +/oim reduced the PO4/amide I ratio compared to +/oim tibiae, making the PO4/amide I ratio of +/mstn +/oim tibiae equivalent to tibiae of Wt littermates (Fig. 2C).
Fig. 2.
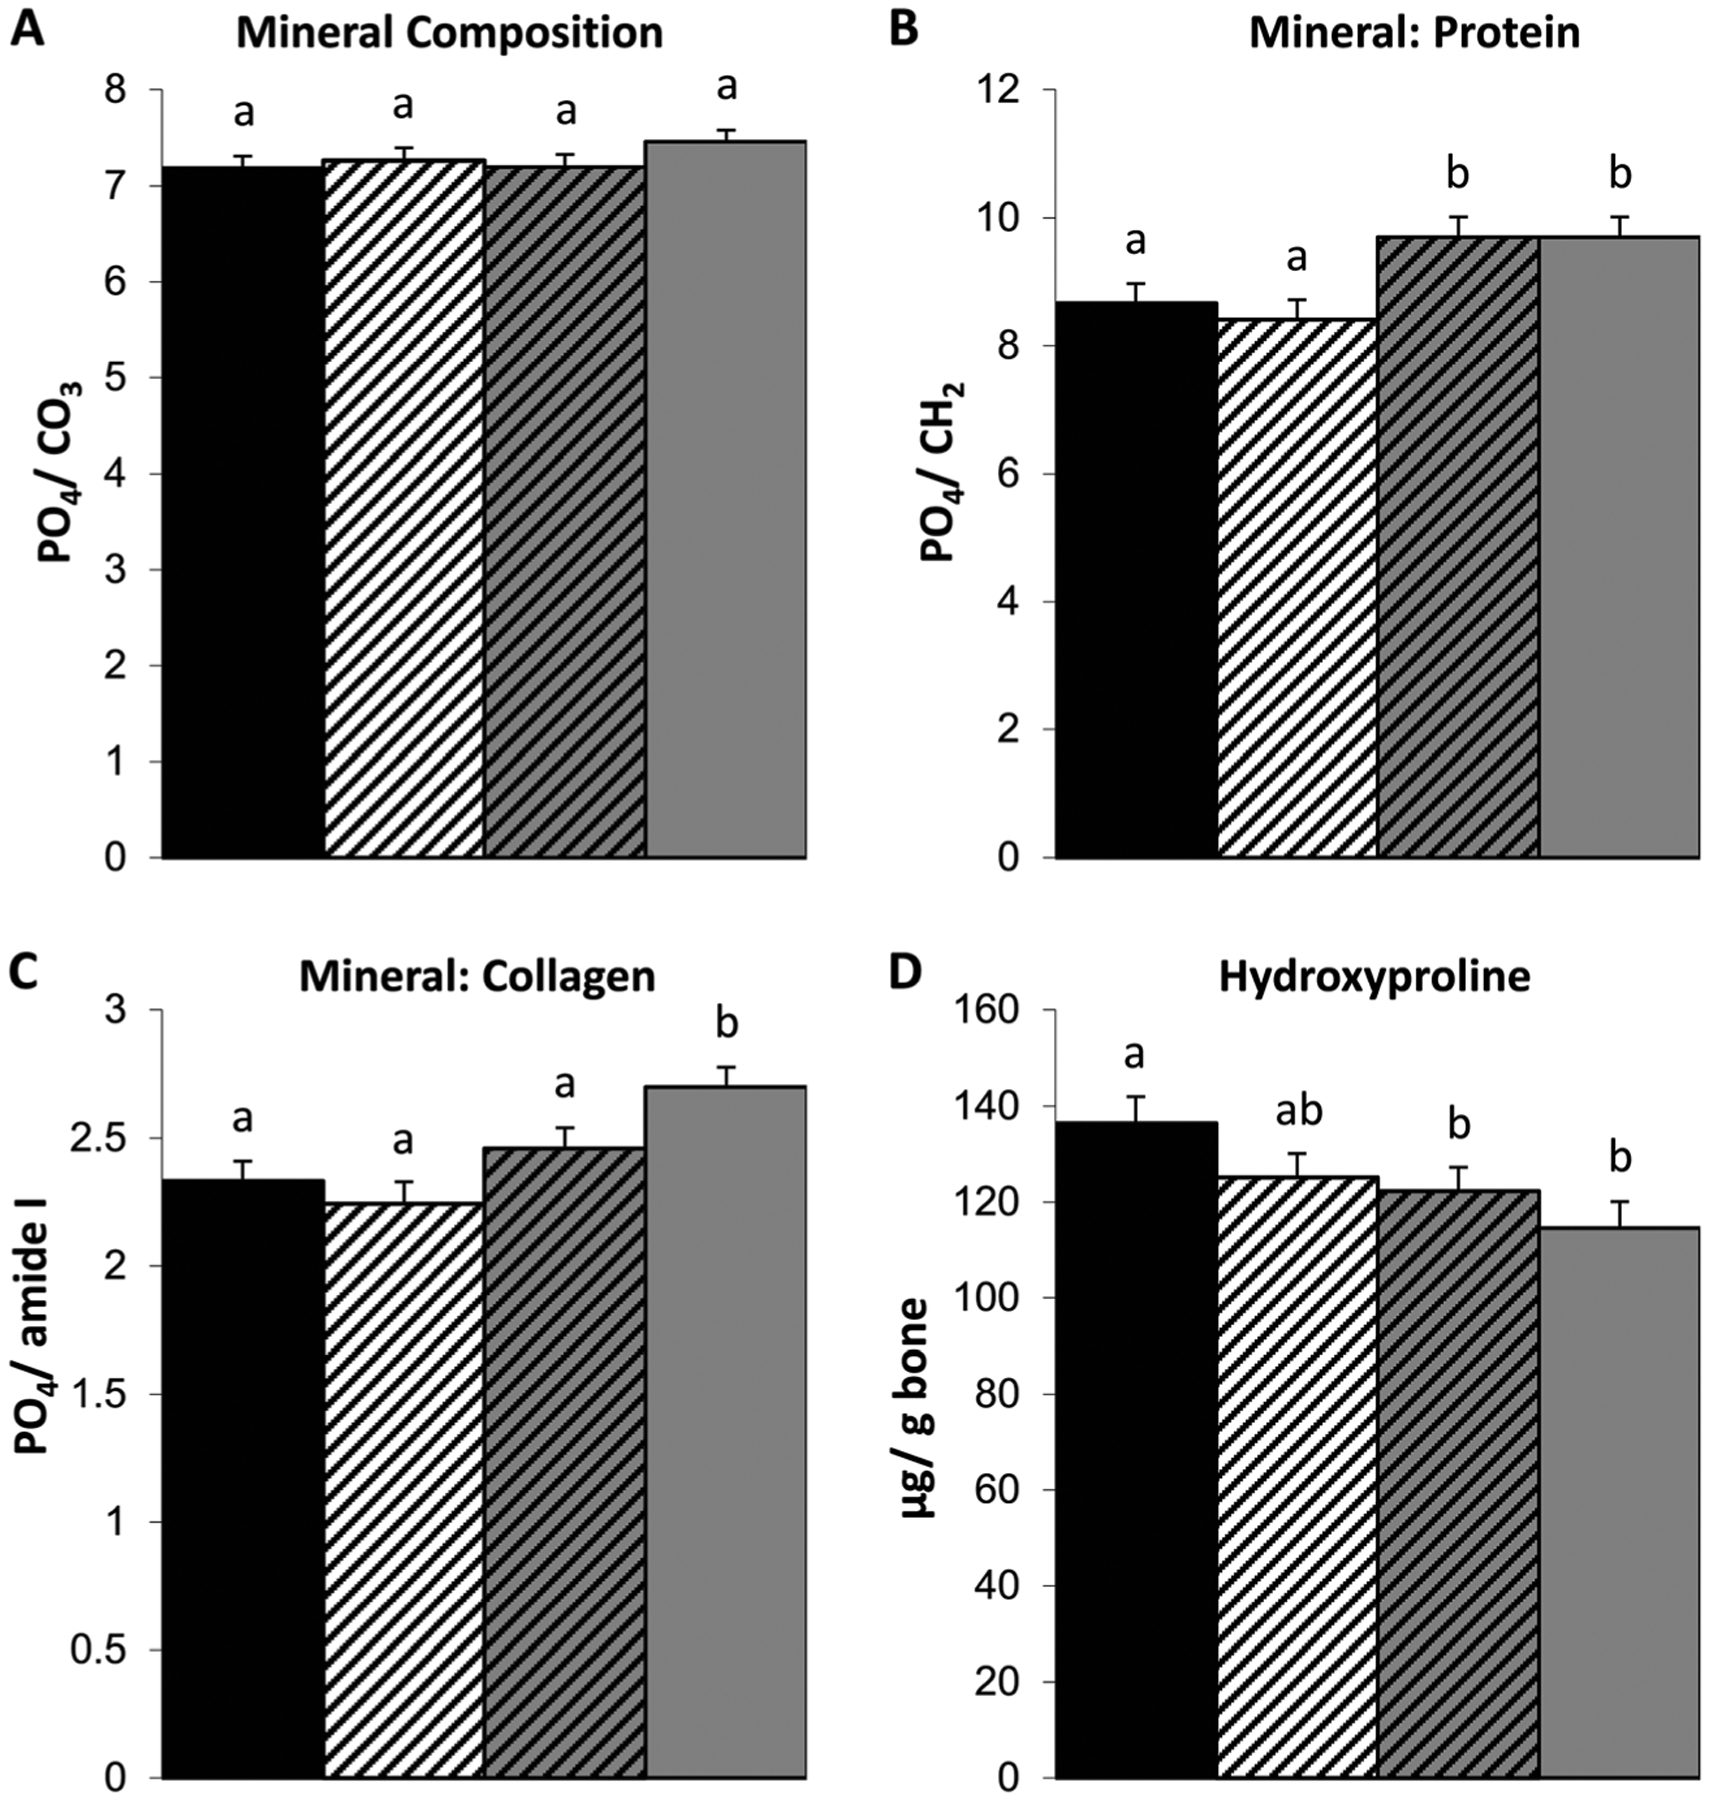
Myostatin deficiency in 4-month-old +/mstn +/oim tibiae increases the PO4/amide I (mineral to collagen) ratio as compared to +/oim tibiae. Cortical bone A PO4/CO3 ratio (indication of carbonate substitution of phosphate in the crystal lattice), B PO4/CH2 ratio (relative amount of mineral phosphate to matrix protein), C PO4/amide I ratio (relative amount of mineral to collagen), and D femoral hydroxyproline content (μg/g bone). The genotype main effect was evaluated. Values are the LSmeans±SE of the combined genotype values regardless of sex. Values with the same superscript letter are not significantly different. Differences were considered significant at p≤0.05. Wt (solid black), n=13–14; +/mstn (black and white), n=11–17; +/mstn, +/oim (black and gray), n=12–17; +/oim (gray), n=13–14
To evaluate if the increased PO4/CH2 and PO4/amide I ratios in +/oim bone reflects decreases in the organic component, collagen, or increases in mineral component, hydroxyapatite, we examined collagen content indirectly by quantification of the hydroxyproline content (Fig. 2D). Wt and +/mstn femora had equivalent hydroxyproline levels. Femora from both +/mstn +/oim and +/oim contained 10 and 16 % less hydroxyproline per bone weight than Wt femora, respectively, suggesting that myostatin deficiency did not significantly alter femoral collagen content of the femora (Fig. 2D).
Biochemical markers of bone remodeling
To begin to discern if differences in Wt, +/mstn, +/mstn +/oim, and +/oim bone material and physiochemical properties were associated with changes in bone remodeling, serum biochemical markers of bone turnover were evaluated [24]. Serum PINP (a marker of bone formation) concentrations were similar in mice from all genotypes examined, suggesting that myostatin deficiency did not significantly impact bone formation (Fig. 3A). Serum CTX (a marker of bone resorption) concentrations indicated that +/mstn +/oim and +/oim mice had similar levels of serum CTX, which were approximately 6-fold greater than serum CTX levels in Wt and +/mstn mice (Fig. 3B). While myostatin deficiency increased CTX levels in the +/mstn mice compared to Wt (Fig. 3B), the elevated serum CTX levels in +/mstn +/oim suggest that myostatin deficiency was not able to attenuate the elevated osteoclast activity present in the +/oim mouse.
Fig. 3.
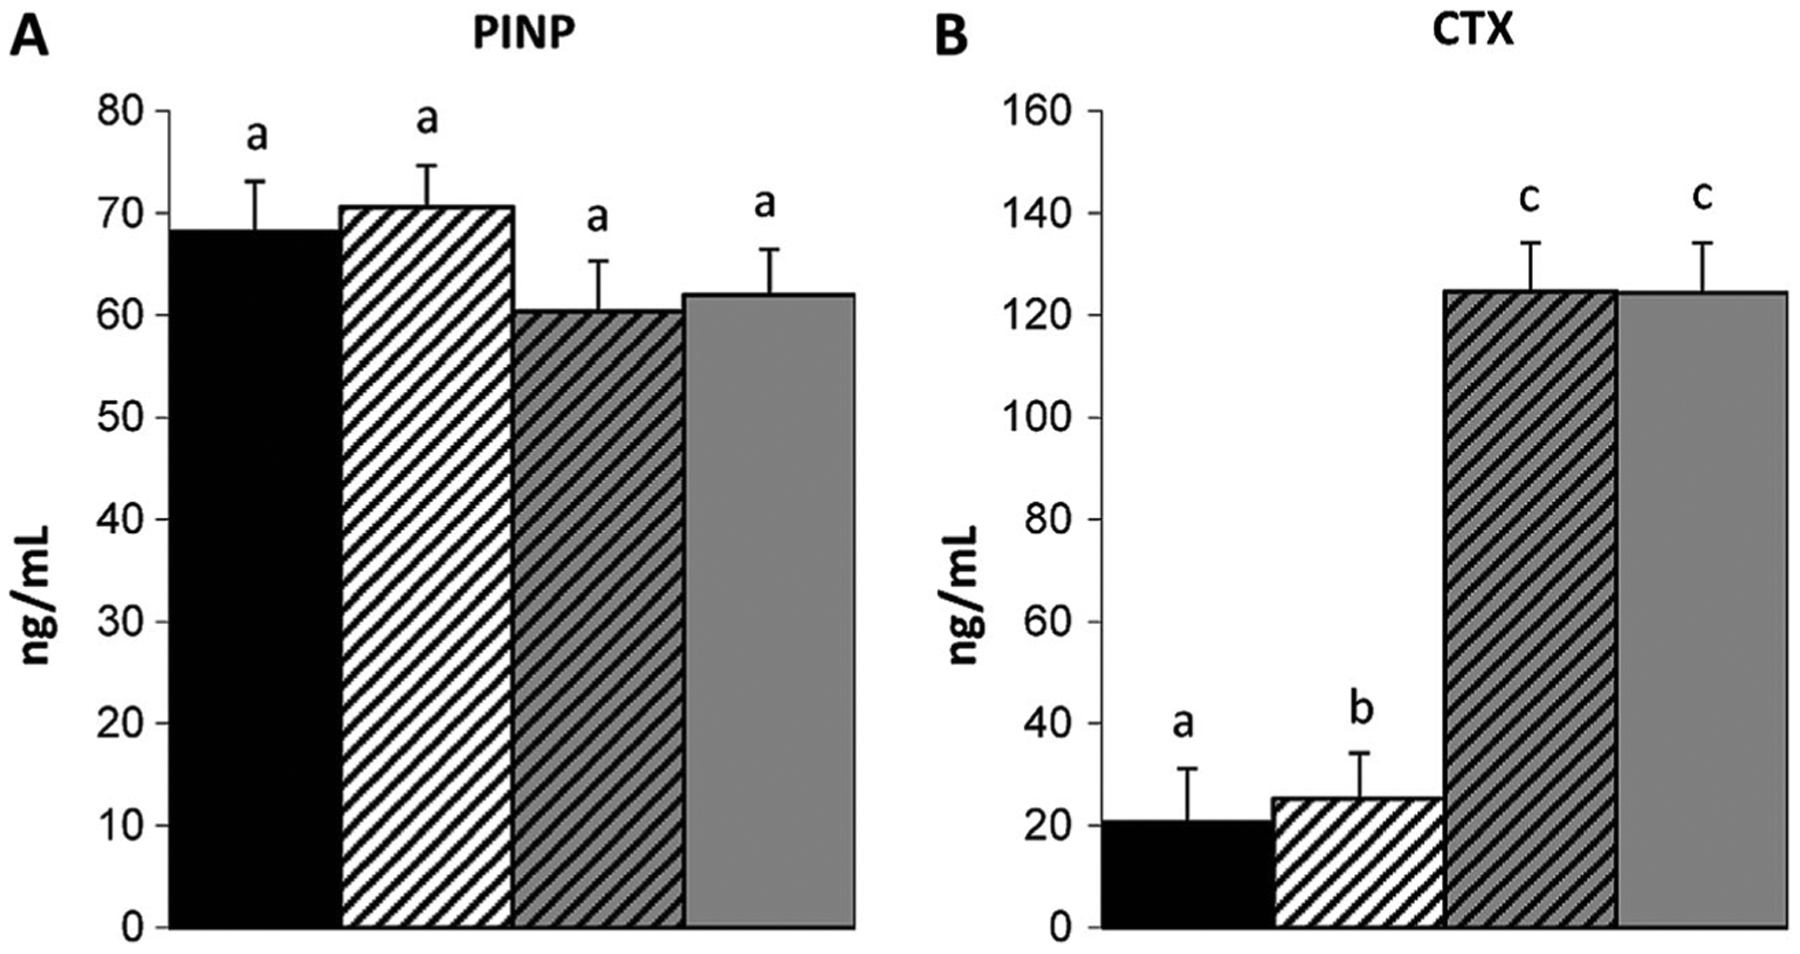
Evaluation of serum bone turnover markers, N-terminal propeptide of type I procollagen [PINP (A)] and C-terminal cross-linked telopeptide of type I collagen [CTX (B)] demonstrated an increase in serum CTX associated with +/oim and +/mstn +/oim mice. The genotype main effect was evaluated. Values are the LSmeans±SE of the combined genotype values regardless of sex. Values with the same superscript letter are not significantly different. Differences were considered significant at p≤0.05. Wt (solid black), n=13; +/mstn (black and white), n=16–19; +/mstn, +/oim (black and gray), n=17–18; +/oim (gray), n=15–16
Discussion
Our findings demonstrated that myostatin deficiency throughout development and maturation in the +/oim mouse resulted in increased body and muscle weights, with a concomitant enhancement of bone physiochemical properties and strength in the +/oim mouse. Myostatin deficiency was anticipated to increase +/oim body weight and muscle mass of each of the hindlimb muscles tested, as was previously seen in myostatin deficient and knockout mice [16, 17, 25]. We demonstrate that the increased hindlimb muscle mass persists in the presence of the oim mutation. The increase in muscle mass corresponded to increases in trabecular microarchitecture, femoral strength, and modest alterations in the bone physiochemical properties. Yet, the increase in muscle mass in +/mstn +/oim mice did not translate into significant changes in midshaft bone geometry. This was consistent with observations that mstn/mstn mice exhibit long bone changes that are primarily localized to the sites of muscle insertion, and the impact of heterozygosity (+/mstn) at the mstn locus on bone appears more subtle [19, 26].
To determine if the observed improvements in the bone of +/mstn +/oim mice were due to their increased body size relative to the +/oim littermates, we analyzed our data using an analysis of covariance, with body weight as the covariate. Our analyses indicated that the improvements in tibial microarchitecture, geometry, and biomechanical strength seen in +/mstn +/oim mice could not be accounted for simply by the increase in body weight of +/mstn +/oim mice relative to +/oim mice. Our analysis also indicated that body mass differences did not account for the main sex effect which was evident for nearly all the parameters evaluated (data not shown).
Tibiae from +/mstn +/oim mice showed modest changes in microarchitecture compared to +/oim mouse tibiae, including increases in trabecular number and connectivity densities. The decreases in +/mstn +/oim bone densities suggest that myostatin deficiency either decreased mineral acquisition or increased collagen deposition in the +/oim mouse bone, with the decreased density hypothesized to reduce brittleness. We did not see an increase in the cortical bone width in +/mstn femora, as had been previously reported in mstn/mstn mice [27], which may reflect a dose effect of partial (heterozygous) myostatin deficiency versus complete (homozygous) absence of myostatin. The hydroxyproline content of the +/mstn +/oim bone was 7 % greater than the +/oim bone; although this increase did not reach significance, it may contribute partially to the +/mstn +/oim bone having decreased PO4/amide I ratios and increased tensile strength relative to +/oim bone.
Increased +/mstn +/oim femoral energy to failure demonstrated that myostatin deficiency was able to enhance +/oim femoral biomechanical integrity such that the +/mstn +/oim femora were no longer significantly weaker than Wt femora, thus demonstrating that myostatin deficiency partially rescued the +/oim bone phenotype. The femoral torsional ultimate strength, Tmax, was also increased in +/mstn +/oim mice compared to their +/oim littermates, though this trend (p=0.098) did not reach significance. These data demonstrated that the femora of +/oim mice exhibit improvements in bone biomechanical integrity when the mice were deficient in myostatin throughout their lifetime.
Evaluation of serum markers of bone turnover indicated that bone resorption was increased in mice with the +/oim mutation without significant impact on bone formation and that this difference remains despite the presence of the +/mstn mutation. The increase in serum CTX associated with +/oim and +/mstn +/oim is consistent with studies demonstrating that oim/oim mice have increased osteoclast numbers and resorptive activity [28], as well as with the findings in other mouse models of OI, Brtl [29] and Col1a1Jrt/+ [30]. In vitro studies suggested that oim/oim mice have impaired osteogenesis and failure to reach the terminal stage of maturation [31]. Mesenchymal stem cells from the Brtl OI mouse model (glycine to cysteine substitution in the Col1a1 gene) also exhibited reduced osteogenic potential, which was attributed in part to autophagy activation [32]. The serum PINP findings suggest that myostatin deficiency did not appear to alter bone formation. The impact of myostatin deficiency on osteoblast maturation and differentiation remains to be further elucidated.
The impact of myostatin deficiency on the bone biomechanical and physiochemical properties suggests that myostatin levels may also alter the bone matrix and potentially its architectural organization rather than simply altering bone shape. In a previous study, we demonstrated by Raman spectroscopy that there were no sex-related differences in PO4/CO3, PO4/CH2, and PO4/amide I ratios between Wt, +/oim, and oim/oim tibias, but that there were significant genotype-related differences [9]. Oim/oim bone was found to have significantly higher PO4/CO3 and PO4/CH2 ratio relative to Wt bone, with +/oim bone having intermediate values [9]. Tibiae from +/mstn +/oim and +/oim maintained PO4/CH2 ratios greater than those from Wt (Fig. 2B) suggesting that the skeletal mineral to protein ratio is more strongly impacted by the collagen status than myostatin levels. The PO4/CO3 ratio changes as the bone tissue ages, with the PO4/CO3 ratio decreasing with increasing age. Previous studies suggested that the oim/oim tibial mineralized matrix had not matured to the same extent as their age-matched Wt littermates [9]. The increased PO4/CH2, mineral to matrix ratios, in oim mice has been attributed to reduced collagen content and hypermineralization. Hypermineralization in the oim mouse and in other mouse models of OI has previously been reported [6, 21, 33, 34] and correlated to increased brittleness [9, 32, 33]. Tibiae from +/mstn +/oim mice showed a decrease in cortical and trabecular bone densities (Table 2) compared to +/oim, which was consistent with myostatin deficiency resulting in decreased PO4/amide I ratios.
While it is well established that bone and muscle are functionally dependent upon the shared forces of the mechanostat unit, our growing knowledge of the musculoskeletal system has led us to the understanding that both bone and muscle can interact through secreted factors as well. A growing amount of data suggests that muscle and bone can signal in a paracrine and endocrine fashion through secreted factors such as myokines and osteokines (for review [35]). Myostatin is a growth factor produced primarily by muscle, secreted into the circulation, and is a candidate for bone-muscle crosstalk as it has been shown to decrease osteogenic differentiation of bone marrow-derived mesenchymal stem cells [36]. Myostatin has also been shown to be localized to sites of musculoskeletal injury [37], and the loss or inhibition of myostatin is known to have an osteogenic effect [36] and improve fracture healing [38] in mouse models. While it is likely that the deficiency of myostatin in an OI mouse model may be working to improve the bone by increasing muscle size and the mechanical stimuli the bone is exposed to, it is also reasonable to speculate that the decrease of myostatin may also have a direct osteogenic effect. Although serum PINP and CTX markers of bone remodeling were not altered by myostatin deficiency in the OI mouse, additional histomorphometric analyses to examine osteoblast number and activity, as well as expression studies to evaluate potential myostatin target genes and intracellular signaling pathways, are necessary to begin to elucidate the mechanism by which myostatin impacts OI bone.
From these results, one might postulate that complete absence of myostatin (mstn/mstn) in homozygous oim/oim mice would exhibit a dramatic positive response in muscle and bone. Myostatin is a member of the TGF-β superfamily of growth regulators, and TGF-β is a known positive regulator of collagen and has been implicated in fibrosis [39–41]. Myostatin has been shown to directly affect skeletal muscle fibrosis by inducing muscle fibroblast proliferation [42]. Consistent with these observations is that myostatin deficient mice have less collagen in their muscles and fail to accumulate increased connective tissue in muscles as they age [43]. In addition, mstn/mstn mice exhibit compromised muscle function [17] and are reported to have brittle tendons with reduced collagen content [44]. Given the association of myostatin in collagen expression, we targeted partial deficiency of myostatin, as complete absence of myostatin in the presence of the already compromised muscle function [7] and collagen of oim/oim tendon [45] would likely have been detrimental. Tendons are the conduit through which muscle loading transduces the mechanosignal to the bone. Myostatin deficiency may not only indirectly impact bone by altering muscle loading, but the mechanosignaling between the muscle and bone via the tendon may be altered as well. Alterations in tendon material properties could alter the mechanosignal transduction of the load to the bone and should be investigated further.
Increasing our understanding of the role of myostatin in regulatory mechanisms of collagen expression, mineralization, and bone strength will provide unique insight and promote potential new therapeutic approaches to enhancing and protecting bone health. Our results suggest that intervention of the myostatin signaling pathway by potential pharmacological agents holds promise as a therapeutic strategy for individuals with osteogenesis imperfecta by not only enhancing muscle function, but also bone strength. The use of myostatin inhibitors or receptor decoy molecules in normal mice and mice with acquired bone loss has resulted in increased muscle mass, increased serum bone formation markers, bone mineral density, and bone mass [46, 47]. These studies together with our findings demonstrate the need to further elucidate the mechanisms of action of myostatin signaling on bone and suggest that pharmacological inhibition of myostatin signaling may offer new therapeutic strategies to enhance muscle and bone strength in individuals with osteogenesis imperfecta.
Acknowledgments
We would like to thank the Biomolecular Imaging Center at the Harry S. Truman Memorial Veterans Hospital and the University of Missouri Comparative Orthopedics Laboratory for their contributions to this project as well as Dr. Mark Ellersieck for his invaluable assistance with statistical analyses. We would also like to thank the following funding sources: National Institutes of Health Grants AR055907 (SMC, BAG, AKO, CER, CLP) and T32RR007004 (BAG), National Space and Biomedical Research Institute Postdoctoral Fellowship NCC 9-58 (SMC), Leda J. Sears Trust Foundation Grant (SMC, BAG, CER, CLP), Phi Zeta Grant (BAG), University of Missouri Life Sciences Fellowship (AKO), University of Missouri Research Board Grant (MB, CLP), and University of Missouri Interdisciplinary Intercampus Research Program (CLP,YW, AKO). The funding sources were not involved in the designing, execution, analysis, reporting, or submission of this work for publication.
Footnotes
Conflicts of interest Arin Kettle Oestreich, Stephanie Michelle Carleton, Xiaomei Yao, Bettina A. Gentry, Chad Edward Raw, Marybeth Brown, Ferris Michael Pfeiffer, Yong Wang, and Charlotte Longacre Phillips declare that they have no conflict of interest.
References
- 1.Van Dijk FS, Sillence DO (2014) Osteogenesis imperfecta: clinical diagnosis, nomenclature and severity assessment. Am J Med Genet A 164:1470–1481 [DOI] [PMC free article] [PubMed] [Google Scholar]
- 2.Cundy T (2012) Recent advances in osteogenesis imperfecta. Calcif Tissue Int 90:439–449 [DOI] [PubMed] [Google Scholar]
- 3.Veilleux LN, Lemay M, Pouliot-Laforte A, Cheung MS, Glorieux FH, Rauch F (2014) Muscle anatomy and dynamic muscle function in osteogenesis imperfecta type I. J Clin Endocrinol Metab 99: E356–E362 [DOI] [PubMed] [Google Scholar]
- 4.Chipman SD, Sweet HO, McBride DJ Jr, Davisson MT, Marks SC Jr, Shuldiner AR, Wenstrup RJ, Rowe DW, Shapiro JR (1993) Defective pro alpha 2(I) collagen synthesis in a recessive mutation in mice: a model of human osteogenesis imperfecta. Proc Natl Acad Sci U S A 90:1701–1705 [DOI] [PMC free article] [PubMed] [Google Scholar]
- 5.McBride DJ Jr, Shapiro JR, Dunn MG (1998) Bone geometry and strength measurements in aging mice with the oim mutation. Calcif Tissue Int 62:172–176 [DOI] [PubMed] [Google Scholar]
- 6.Camacho NP, Hou L, Toledano TR, Ilg WA, Brayton CF, Raggio CL, Root L, Boskey AL (1999) The material basis for reduced mechanical properties in oim mice bones. J Bone Miner Res 14: 264–272 [DOI] [PubMed] [Google Scholar]
- 7.Gentry BA, Ferreira JA, McCambridge AJ, Brown M, Phillips CL (2010) Skeletal muscle weakness in osteogenesis imperfecta mice. Matrix Biol 29:638–644 [DOI] [PMC free article] [PubMed] [Google Scholar]
- 8.Saban J, Zussman MA, Havey R, Patwardhan AG, Schneider GB, King D (1996) Heterozygous oim mice exhibit a mild form of osteogenesis imperfecta. Bone 19:575–579 [DOI] [PubMed] [Google Scholar]
- 9.Yao X, Carleton SM, Kettle AD, Melander J, Phillips CL, Wang Y (2013) Gender-dependence of bone structure and properties in adult osteogenesis imperfecta murine model. Ann Biomed Eng 41:1139–1149 [DOI] [PMC free article] [PubMed] [Google Scholar]
- 10.Carriero A, Zimmermann EA, Paluszny A, Tang SY, Bale H, Busse B, Alliston T, Kazakia G, Ritchie RO, Shefelbine SJ (2014) How tough is brittle bone? investigating osteogenesis imperfecta in mouse bone. J Bone Miner Res 29:1392–1401 [DOI] [PMC free article] [PubMed] [Google Scholar]
- 11.Warden SJ, Hurst JA, Sanders MS, Turner CH, Burr DB, Li J (2005) Bone adaptation to a mechanical loading program significantly increases skeletal fatigue resistance. J Bone Miner Res 20: 809–816 [DOI] [PubMed] [Google Scholar]
- 12.Turner CH (2006) Bone strength: current concepts. Ann N Y Acad Sci 1068:429–446 [DOI] [PubMed] [Google Scholar]
- 13.Kodama Y, Umemura Y, Nagasawa S, Beamer WG, Donahue LR, Rosen CR, Baylink DJ, Farley JR (2000) Exercise and mechanical loading increase periosteal bone formation and whole bone strength in C57BL/6J mice but not in C3H/Hej mice. Calcif Tissue Int 66: 298–306 [DOI] [PubMed] [Google Scholar]
- 14.Hamrick MW, Samaddar T, Pennington C, McCormick J (2006) Increased muscle mass with myostatin deficiency improves gains in bone strength with exercise. J Bone Miner Res 21:477–483 [DOI] [PubMed] [Google Scholar]
- 15.Kollias HD, McDermott JC (2008) Transforming growth factor-beta and myostatin signaling in skeletal muscle. J Appl Physiol 104:579–587 [DOI] [PubMed] [Google Scholar]
- 16.McPherron AC, Lawler AM, Lee SJ (1997) Regulation of skeletal muscle mass in mice by a new TGF-beta superfamily member. Nature 387:83–90 [DOI] [PubMed] [Google Scholar]
- 17.Gentry BA, Ferreira JA, Phillips CL, Brown M (2011) Hindlimb skeletal muscle function in myostatin-deficient mice. Muscle Nerve 43:49–57 [DOI] [PMC free article] [PubMed] [Google Scholar]
- 18.Mosher DS, Quignon P, Bustamante CD, Sutter NB, Mellersh CS, Parker HG, Ostrander EA (2007) A mutation in the myostatin gene increases muscle mass and enhances racing performance in heterozygote dogs. PLoS Genet 3:e79. [DOI] [PMC free article] [PubMed] [Google Scholar]
- 19.Elkasrawy MN, Hamrick MW (2010) Myostatin (GDF-8) as a key factor linking muscle mass and bone structure. J Musculoskelet Neuronal Interact 10:56–63 [PMC free article] [PubMed] [Google Scholar]
- 20.Beamer WG, Shultz KL, Donahue LR, Churchill GA, Sen S, Wergedal JR, Baylink DJ, Rosen CJ (2001) Quantitative trait loci for femoral and lumbar vertebral bone mineral density in C57BL/6J and C3H/HeJ inbred strains of mice. J Bone Miner Res 16:1195–1206 [DOI] [PubMed] [Google Scholar]
- 21.Carleton SM, McBride DJ, Carson WL, Huntington CE, Twenter KL, Rolwes KM, Winkelmann CT, Morris JS, Taylor JF, Phillips CL (2008) Role of genetic background in determining phenotypic severity throughout postnatal development and at peak bone mass in Col1a2 deficient mice (oim). Bone 42:681–694 [DOI] [PMC free article] [PubMed] [Google Scholar]
- 22.Mandair GS, Morris MD (2015) Contributions of Raman spectroscopy to the understanding of bone strength. BoneKEy Rep 4 [DOI] [PMC free article] [PubMed] [Google Scholar]
- 23.Stegemann H, Stalder K (1967) Determination of hydroxyproline. Clin Chim Acta 18:267–273 [DOI] [PubMed] [Google Scholar]
- 24.Naylor K, Eastell R (2012) Bone turnover markers: use in osteoporosis. Nat Rev Rheumatol 8:379–389 [DOI] [PubMed] [Google Scholar]
- 25.Lee SJ (2007) Quadrupling muscle mass in mice by targeting TGF-beta signaling pathways. PLoS One 2:e789. [DOI] [PMC free article] [PubMed] [Google Scholar]
- 26.Hamrick MW, McPherron AC, Lovejoy CO (2002) Bone mineral content and density in the humerus of adult myostatin-deficient mice. Calcif Tissue Int 71:63–68 [DOI] [PubMed] [Google Scholar]
- 27.Hamrick MW (2003) Increased bone mineral density in the femora of GDF8 knockout mice. Anat Rec A: Discov Mol Cell Evol Biol 272:388–391 [DOI] [PubMed] [Google Scholar]
- 28.Zhang H, Doty SB, Hughes C, Dempster D, Camacho NP (2007) Increased resorptive activity and accompanying morphological alterations in osteoclasts derived from the oim/oim mouse model of osteogenesis imperfecta. J Cell Biochem 102:1011–1020 [DOI] [PMC free article] [PubMed] [Google Scholar]
- 29.Uveges TE, Collin-Osdoby P, Cabral WA, Ledgard F, Goldberg L, Bergwitz C, Forlino A, Osdoby P, Gronowicz GA, Marini JC (2008) Cellular mechanism of decreased bone in Brtl mouse model of OI: imbalance of decreased osteoblast function and increased osteoclasts and their precursors. J Bone Miner Res 23:1983–1994 [DOI] [PMC free article] [PubMed] [Google Scholar]
- 30.Chen F, Guo R, Itoh S et al. (2014) First mouse model for combined osteogenesis imperfecta and Ehlers-Danlos syndrome. J Bone Miner Res 29:1412–1423 [DOI] [PubMed] [Google Scholar]
- 31.Li H, Jiang X, Delaney J, Franceschetti T, Bilic-Curcic I, Kalinovsky J, Lorenzo JA, Grcevic D, Rowe DW, Kalajzic I (2010) Immature osteoblast lineage cells increase osteoclastogenesis in osteogenesis imperfecta murine. Am J Pathol 176:2405–2413 [DOI] [PMC free article] [PubMed] [Google Scholar]
- 32.Gioia R, Panaroni C, Besio R et al. (2012) Impaired osteoblastogenesis in a murine model of dominant osteogenesis imperfecta: a new target for osteogenesis imperfecta pharmacological therapy. Stem Cells 30:1465–1476 [DOI] [PMC free article] [PubMed] [Google Scholar]
- 33.Coleman RM, Aguilera L, Quinones L, Lukashova L, Poirier C, Boskey A (2012) Comparison of bone tissue properties in mouse models with collagenous and non-collagenous genetic mutations using FTIRI. Bone 51:920–928 [DOI] [PMC free article] [PubMed] [Google Scholar]
- 34.Camacho NP, Landis WJ, Boskey AL (1996) Mineral changes in a mouse model of osteogenesis imperfecta detected by Fourier transform infrared microscopy. Connect Tissue Res 35:259–265 [DOI] [PubMed] [Google Scholar]
- 35.Brotto M, Johnson ML (2014) Endocrine crosstalk between muscle and bone. Curr Osteop Rep 12:135–141 [DOI] [PMC free article] [PubMed] [Google Scholar]
- 36.Hamrick MW, Shi X, Zhang W, Pennington C, Thakore H, Haque M, Kang B, Isales CM, Fulzele S, Wenger KH (2007) Loss of myostatin (GDF8) function increases osteogenic differentiation of bone marrow-derived mesenchymal stem cells but the osteogenic effect is ablated with unloading. Bone 40:1544–1553 [DOI] [PMC free article] [PubMed] [Google Scholar]
- 37.Elkasrawy M, Immel D, Wen X, Liu X, Liang LF, Hamrick MW (2012) Immunolocalization of myostatin (GDF-8) following musculoskeletal injury and the effects of exogenous myostatin on muscle and bone healing. J Histochem Cytochem : Off J Histochem Soc 60:22–30 [DOI] [PMC free article] [PubMed] [Google Scholar]
- 38.Hamrick MW, Arounleut P, Kellum E, Cain M, Immel D, Liang LF (2010) Recombinant myostatin (GDF-8) propeptide enhances the repair and regeneration of both muscle and bone in a model of deep penetrant musculoskeletal injury. J Trauma 69:579–583 [DOI] [PMC free article] [PubMed] [Google Scholar]
- 39.Verrecchia F, Mauviel A (2004) TGF-beta and TNF-alpha: antagonistic cytokines controlling type I collagen gene expression. Cell Signal 16:873–880 [DOI] [PubMed] [Google Scholar]
- 40.Ghosh AK (2002) Factors involved in the regulation of type I collagen gene expression: implication in fibrosis. Exp Biol Med (Maywood) 227:301–314 [DOI] [PubMed] [Google Scholar]
- 41.Hosaka YZ, Ishibashi M, Wakamatsu J, Uehara M, Nishimura T (2012) Myostatin regulates proliferation and extracellular matrix mRNA expression in NIH3T3 fibroblasts. Biomed Res 33:355–361 [DOI] [PubMed] [Google Scholar]
- 42.Li ZB, Kollias HD, Wagner KR (2008) Myostatin directly regulates skeletal muscle fibrosis. J Biol Chem 283:19371–19378 [DOI] [PMC free article] [PubMed] [Google Scholar]
- 43.Elashry MI, Collins-Hooper H, Vaiyapuri S, Patel K (2012) Characterisation of connective tissue from the hypertrophic skeletal muscle of myostatin null mice. J Anat 220:603–611 [DOI] [PMC free article] [PubMed] [Google Scholar]
- 44.Mendias CL, Bakhurin KI, Faulkner JA (2008) Tendons of myostatin-deficient mice are small, brittle, and hypocellular. Proc Natl Acad Sci U S A 105:388–393 [DOI] [PMC free article] [PubMed] [Google Scholar]
- 45.McBride DJ Jr, Choe V, Shapiro JR, Brodsky B (1997) Altered collagen structure in mouse tail tendon lacking the alpha 2(I) chain. J Mol Biol 270:275–284 [DOI] [PubMed] [Google Scholar]
- 46.Chiu CS, Peekhaus N, Weber H, et al. (2013) Increased muscle force production and bone mineral density in ActRIIB-Fc-treated mature rodents. J Gerontol A Biol Sci Med Sci [DOI] [PubMed] [Google Scholar]
- 47.Bialek P, Parkington J, Li X et al. (2014) A myostatin and activin decoy receptor enhances bone formation in mice. Bone 60:162–171 [DOI] [PubMed] [Google Scholar]