Abstract
Calcium homeostasis modulators (CALHMs) are voltage-gated, Ca2+-inhibited nonselective ion channels that act as major ATP release channels, and have important roles in gustatory signalling and neuronal toxicity1–3. Dysfunction of CALHMs has previously been linked to neurological disorders1. Here we present cryo-electron microscopy structures of the human CALHM2 channel in the Ca2+-free active or open state and in the ruthenium red (RUR)-bound inhibited state, at resolutions up to 2.7 Å. Our work shows that purified CALHM2 channels form both gap junctions and undecameric hemichannels. The protomer shows a mirrored arrangement of the transmembrane domains (helices S1–S4), relative to other channels with a similar topology such as connexins, innexins and volume-regulated anion channels4–8. Upon binding to RUR, we observed a contracted pore with notable conformational changes of the pore-lining helix S1, which swings nearly 60° towards the pore axis from a vertical to a lifted position. We propose a two-section gating mechanism in which the S1 helix coarsely adjusts, and the N-terminal helix fine-tunes, the pore size. We identified a RUR-binding site near helix S1 that may stabilize this helix in the lifted conformation, giving rise to channel inhibition. Our work elaborates on the principles of CALHM2 channel architecture and symmetry, and the mechanism that underlies channel inhibition.
ATP release channels have a fundamental role in many neurological functions—including the modulation of excitatory synaptic strength, long-term synaptic potentiation and neuronal excitability—by mediating the purinergic signalling pathway in the central nervous system9,10. CALHMs act as one of the major ATP release channels, together with maxi-anion channels, volume-regulated anion channels (VRACs), connexins and pannexins11. CALHMs are abundantly expressed in taste bud cells and have an important role in sensing sweet, bitter and umami flavours3. They are activated by a reduction in extracellular calcium and membrane depolarization, which triggers a signalling cascade in the neural gustatory pathways12. CALHMs also have an important role in cortical neuron excitability13. Dysregulation of CALHM1, as well as its P86L polymorphism, have previously been linked to neurological disorders such as Alzheimer’s disease and ischaemic brain damage1.
CALHMs are predicted to have four transmembrane helices, similar to connexins, innexins, pannexins and VRACs. However, the architecture, symmetry and domain arrangement of CALHMs remain unknown. Connexins and VRACs are hexamers4–7 and innexins are octamers8; the current concept is that CALHM1 and CALHM3 form hexamers and that they do not form gap junctions, owing to N-glycosylation in the extracellular loop11,14.
In addition to Ca2+, CALHMs can be modulated by a variety of small molecules that includes RUR, Gd3+, and 2-aminoethoxydiphenyl borate (2-APB)2,12,14–17. RUR is a hexavalent polysaccharide stain18 that non-specifically inhibits many ion channels19–21 through an unknown molecular mechanism.
Structural determination
Our whole-cell electrophysiology data showed that human CALHM2 produces a robust current in the absence of Ca2+. The current showed no obvious voltage dependence but was inhibited by Ca2+ or RUR in a voltage-dependent manner (Extended Data Fig. 1a, c–f). To elucidate the assembly of CALHM2 and to understand the molecular mechanism that underlies channel gating, we studied the human CALHM2 channel in the presence of EDTA or the antagonist RUR using cryo-electron microscopy (cryo-EM).
The initial cryo-EM experiments using GFP-tagged constructs yielded solely hemichannel particles. The 2D classes show a fuzzy tail, which is probably the GFP tag, and the 3D reconstructions were of low resolution (Extended Data Fig. 2a, c, d). The GFP cleaved construct not only improved the cryo-EM map but also showed both hemichannel and gap-junction particles at a ratio of approximately 1:1 at grid concentration (about 18 μM), representing the approximate dissociation constant (Kd) of the docking of hemichannels (Extended Data Figs. 2b, 3). Unlike the CALHM1 channel14, CALHM2 did not show N-glycosylation (Extended Data Fig. 2e, f), which probably explains the existence of a gap junction. Only hemichannels, and not gap junctions, were observed in the presence of RUR (Extended Data Fig. 4). These observations indicate that both the C-terminal GFP tag and the binding of RUR may affect the conformation of the docking site.
We determined the structures of CALHM2 in the presence of EDTA as hemichannels and gap junctions (EDTA–CALHM2hemi and EDTA–CALHM2gap, respectively) and in the presence of RUR (RUR–CALHM2), at resolutions of 3.3, 3.5 and 2.7 Å, respectively (Extended Data Figs. 3–6, Supplementary Table 1). Our structures unambiguously showed that CALHM2 is an undecamer (Fig. 1a–g). Moreover, we observed 11 strong cylinder-shaped densities in the RUR–CALHM2 structure, which represent RUR molecules (Fig. 1c, e, Extended Data Fig. 4).
Fig. 1 |. The overall architecture of CALHM2 [Author: OK? OK].
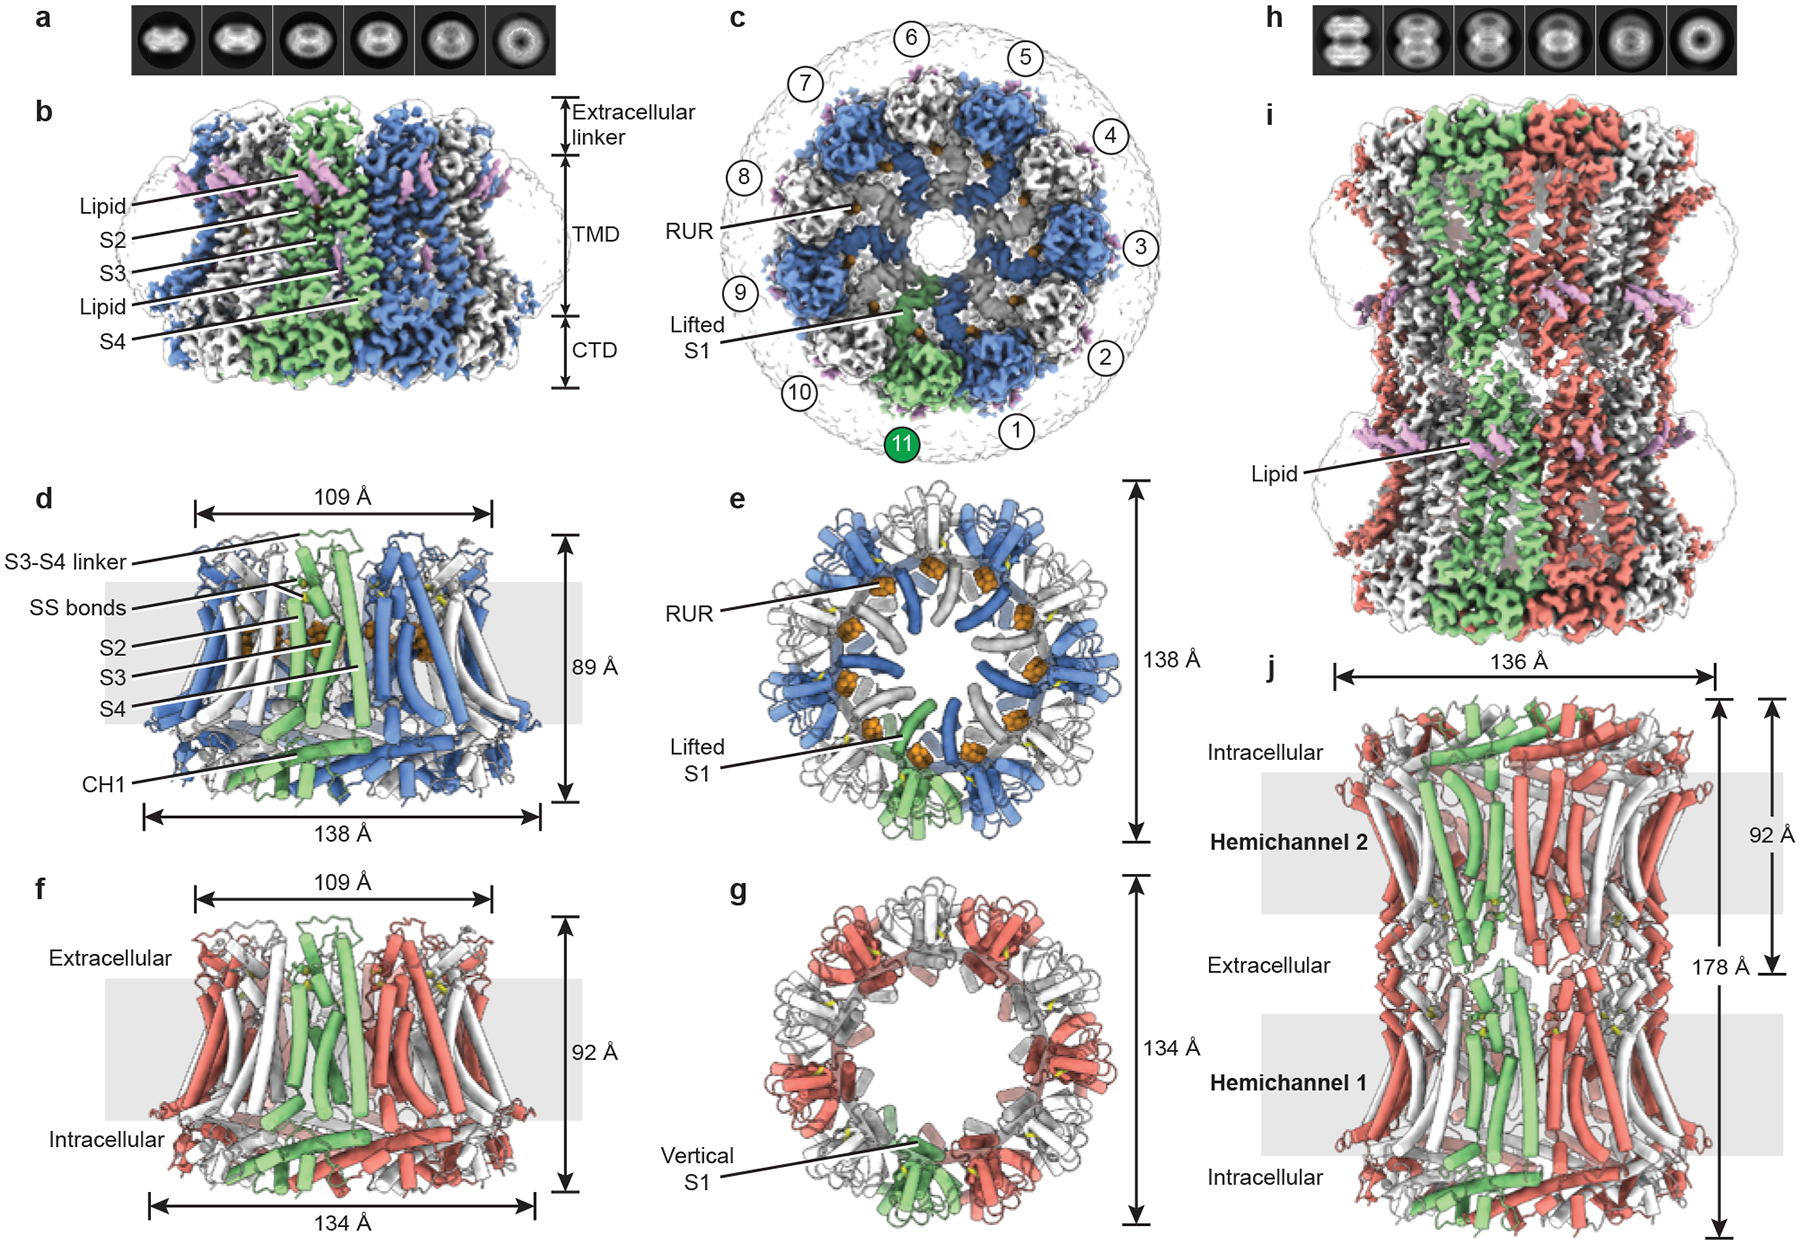
Odd-numbered subunits are in blue (for RUR–CALHM2) or red (for EDTA–CALHM2hemi), and even-numbered subunits are in white. The 11th subunit is in green, lipid-like densities are in purple and RUR densities are in orange. a, Selected 2D class averages of RUR–CALHM2. b, c, The 3D reconstruction of RUR–CALHM2, viewed parallel to the membrane (b) and from extracellular side of the membrane (c). SS bonds, disulfide bonds. d–g, The structures of RUR–CALHM2 (d, e) and EDTA–CALHM2hemi (f, g). h, Selected 2D class averages of EDTA–CALHM2gap. i, j, The 3D reconstruction (i) and atomic model (j) of EDTA–CALHM2gap. Unsharpened reconstructions are shown as transparent envelopes.
The S1 helix and the N-terminal helix (NTH) were poorly defined relative to the rest of the channel, indicating high flexibility. To assess the conformational heterogeneity of these helices, we applied an approach that combined symmetry expansion and signal subtraction, in which all the subunits were subtracted and classified22 (Extended Data Figs. 3, 4). In RUR–CALHM2, two distinct conformations of helix S1 appeared, with 70% in the lifted conformation and 13% in the vertical conformation; the rest were not well-defined. RUR densities were observed only in the class with lifted helix S1. By contrast, EDTA–CALHM2hemi contained approximately half of the helix S1 in a vertical conformation, and the rest was invisible. There are non-resolvable densities in the pore vestibule that may represent the intermediate states of helix S1 between the lifted and vertical conformations. We use these two extreme conformations—RUR–CALHM2 with all the helix S1 in the lifted conformation and EDTA–CALHM2 with all S1 in the vertical conformation—to discuss the gating mechanism and the action of the antagonist RUR (Fig. 1c, e, g). Owing to intrinsic positional uncertainty, we fitted only the protein backbone into the densities of the S1 helix and NTH, and the exact position of residues in this region (residues 13–40) should be interpreted with caution. Nevertheless, we provide electrophysiology data that validate the placement of helix S1 (discussed in ‘subunit structure and RUR-binding site’). A part of the extracellular loops is also poorly defined (residues 138–152).
Overall architecture
The CALHM2 structure assembles as an undecamer with each protomer consisting of a large N-terminal transmembrane domain (TMD) (which comprises helices S1, S2, S3 and S4, and NTH), an intracellular C-terminal domain (CTD) and a small extracellular linker region (Fig. 1b–g). The hemichannels show an overall truncated cone shape that consists of helices S2, S3 and S4 as a side wall, the CTD as a base and the extracellular linker region as a rim, with the intracellular side wider than the extracellular. The first long helix in the CTD (CH1) intercrosses neighbouring subunits, and thus weaves CALHM2 into a sturdy undecamer with a diameter that is 1.6- and 1.2-fold larger than those of connexins and innexins, respectively (Extended Data Fig. 7).
When viewed from the extracellular side, the EDTA–CALHM2hemi structure contains an unusually large pore that is lined by helix S1, which is poised parallel to the pore axis; we thus term this conformation ‘vertical S1’ (Fig. 1g). By comparison, RUR–CALHM2 shows a vertical compression and a horizontal expansion (Fig. 1d–g). Most notably, the pore in RUR–CALHM2 is markedly smaller: helix S1 swings towards the pore axis in what we term the ‘lifted S1’ conformation (Fig. 1c, e). A RUR density was observed underneath helix S1, and probably supports this helix in the lifted conformation—thus stabilizing the channel in an inhibited state. This agrees with previous functional studies that have shown that RUR inhibits CALHMs2,12,14–17 (Extended Data Fig. 1a, c). Notably, the intracellular halves of helices S3 and S4 are relatively far apart, which creates a gap in which a lipid-like density is observed (Fig. 1b). Such a loose contact between the S3 and S4 helices might facilitate the conformational change of S3 during channel gating because the pore-lining S1 is attached to S3.
Similar to connexins and innexins, EDTA–CALHM2gap is docked by two hemichannels in a head-to-head manner, forming a thick cylinder with a large diameter (Fig. 1h–j). The docking region of EDTA–CALHM2gap is considerably shorter than the gap junctions of connexin and innexin, owing to a smaller extracellular linker region (Extended Data Fig. 7a, c, d). Two disulfide bonds connect the S3–S4 linker and S1–S2 linker, which may have an important role in stabilizing the docking of two hemichannels23 (Fig. 1d). Disulfide bonds are present in similar positions in connexins and innexins4,7,8,23. Finally, we observed two strong lipid-like densities close to the extracellular linker region, which probably contribute to maintaining the integrity of the docking site (Fig. 1b, i).
Subunit structure and RUR-binding site
The protomer of CALHM2 is L-shaped: two long and straight helices—helix S4 in the TMD and CH1 in the CTD—run nearly perpendicular to each other (Fig. 2a–c). Both the S2 and S3 helices are multi-segment helices. The S2a and S3b segments form a plane together with helix S4, which runs parallel to the pore axis; the S2b and S3a segments reside on the top of the CTD, mediating the only contact between the TMD and the CTD (Fig. 2d). A comparison of the CALHM2 protomer with those of connexins, innexins and VRACs showed notable differences in size, shape and domain organization (Extended Data Fig. 7c, d).
Fig. 2 |. A single subunit of CALHM2, and RUR-binding site.
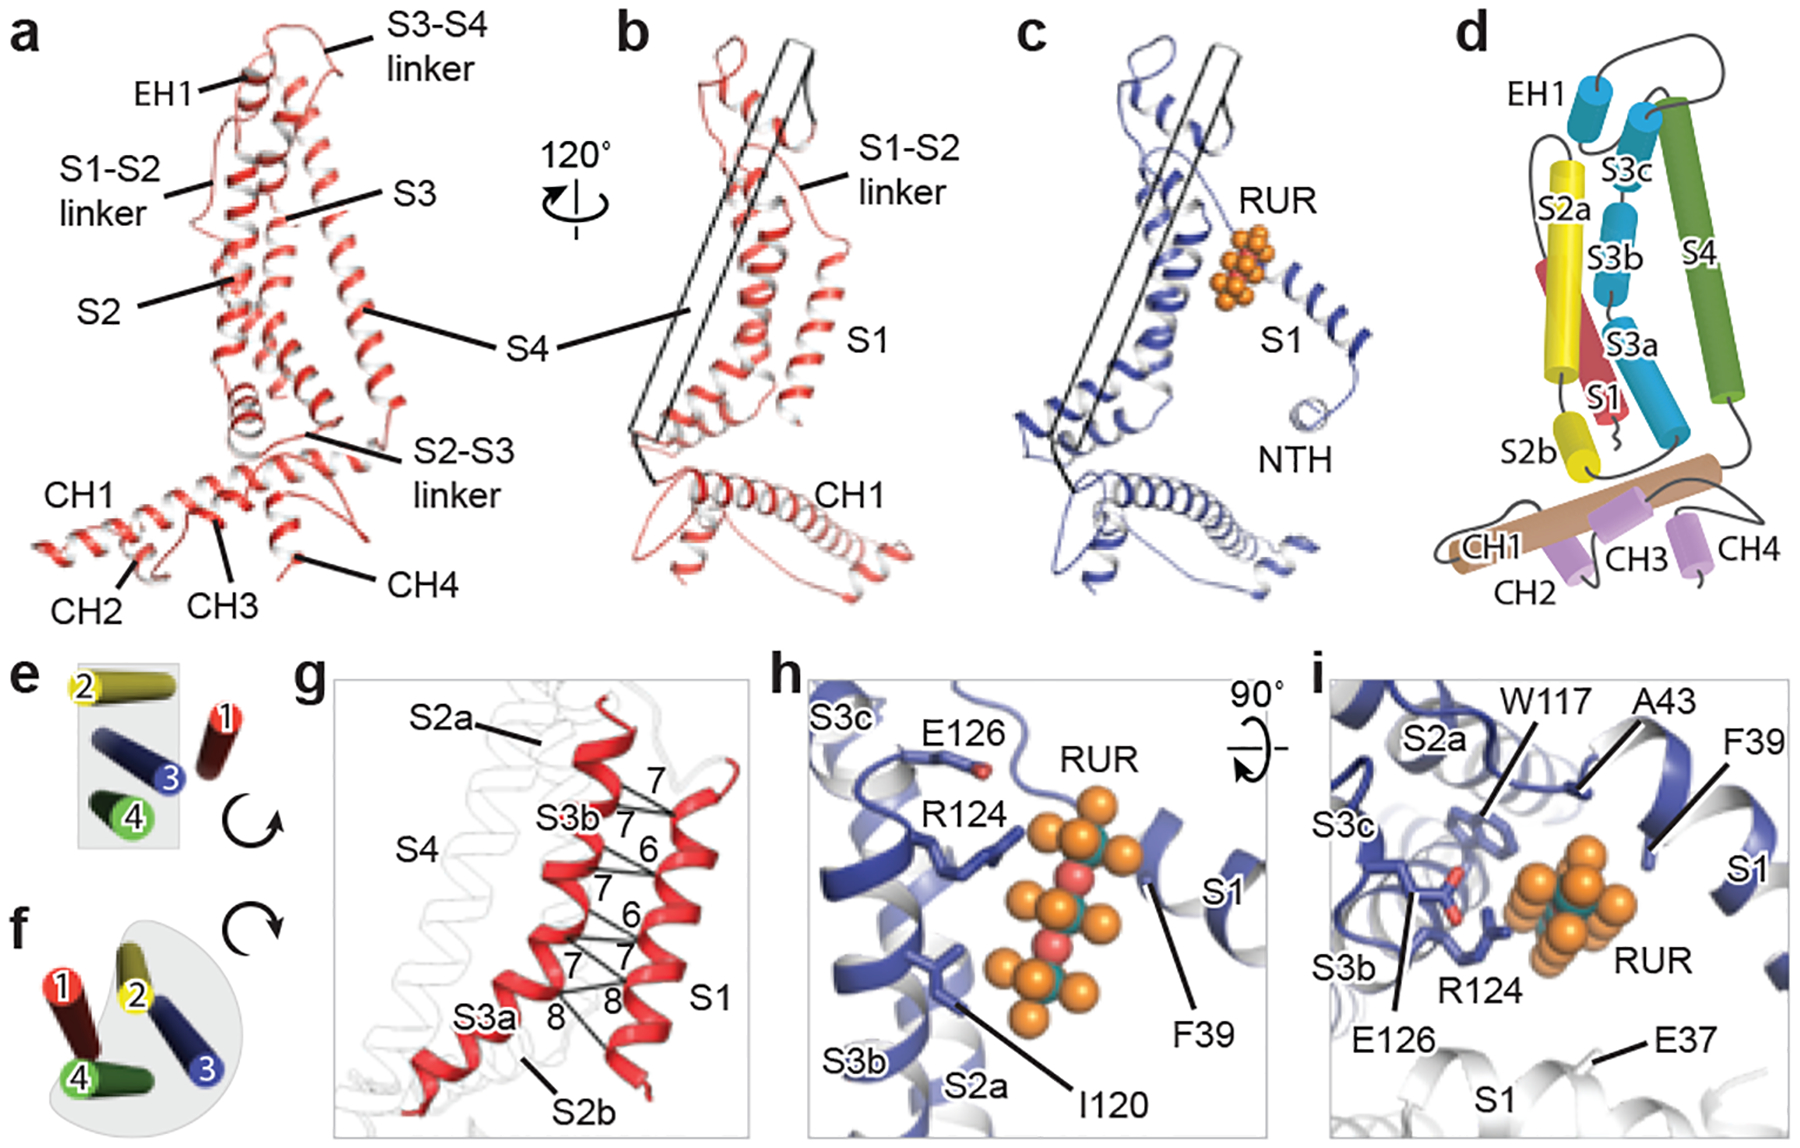
a–c, Cartoon representation of EDTA–CALHM2hemi (a, b) and RUR–CALHM2 (c). The S4 helix in b and c is shown as a transparent tube for clarity. d, Domain organization of EDTA–CALHM2hemi. e, f, TMD organization of EDTA–CALHM2hemi (e) and connexin 43 (f) viewed from the extracellular side. g, The loose contacts between the S1 and S3 helices in EDTA–CALHM2hemi. Distances (in Å) between Cα of adjacent residues in helices S1 and S3 are labelled. h, i, RUR-binding site.
The most notable distinction between CALHM2 and other channels with a similar topology (such as connexins, innexins and VRACs) is at the TMD. Viewed from the extracellular side, the S1, S2, S3 and S4 helices are arranged anticlockwise in EDTA–CALHM2hemi, with S2, S3 and S4 approximately in a plane; by contrast, the arrangements in connexins, innexins and VRACs are all clockwise, with helices S2, S3 and S4 forming a compact helix bundle (Fig. 2e, f). As a consequence, the S1 helix in EDTA–CALHM2hemi is loosely attached only to the S3 (Fig. 2e, g), but in connexins, innexins and VRACs, it is clamped in the helix bundle and forms extensive interactions with S2 and S4 (Fig. 2f). We suggest that such a loose contact of helix S1 to the rest of the TMD in CALHM2 gives this helix a high flexibility to swing up and down. In RUR–CALHM2, helix S1 was detached from S3, and a RUR molecule occupied the vertical S1 position (Fig. 2c, h, i). Because RUR is positively charged, to validate the RUR-binding site and the placement of the lifted S1, we studied a charge-reversing mutant of E37 (a key residue on helix S1 that interacts with RUR). Although CALHM2(E37R) displays Ca2+-dependent gating similar to that of wild-type CALHM2, the inhibition of this mutant by RUR is nearly abolished (Extended Data Fig. 1b, c). Underneath the lifted S1, we also observed part of the NTH, which is involved in voltage-sensing in CALHM1, connexin, pannexin and innexin7,24–28 (Fig. 2c).
The CTD in CALHM2 is the only component on the intracellular side and has an extended shape due to the long CH1, plus the three short α-helices (CH2, CH3 and CH4) (Fig. 2a–d). By comparison, the intracellular regions of innexins and VRACs are formed by both the CTD and the S2–S3 linker (Extended Data Fig. 7c, d). The extracellular side of CALHM2 consists mainly of a flat S3–S4 linker that is involved in the docking of two hemichannels (Fig. 2a). The S1–S2 linker, on the other hand, is very short and not directly involved in the docking region. The longer S1–S2 linker in connexin and innexin protrudes into the extracellular space, forms an intact structure with the S3–S4 linker and participates directly in the docking (Extended Data Fig. 7c, d).
Channel assembly
The CALHM2 hemichannel exhibits a compact exterior through extensive subunit–subunit interactions with three major interfaces, one at the TMD between adjacent subunits (Fig. 3a–c), and the other two at the CTD (Fig. 3d–f). The extracellular linker region of CALHM2 lacks interactions, which presumably provides flexibility for the docking of two hemichannels into a gap junction (Fig. 3a).
Fig. 3 |. Inter- and intrasubunit interactions.
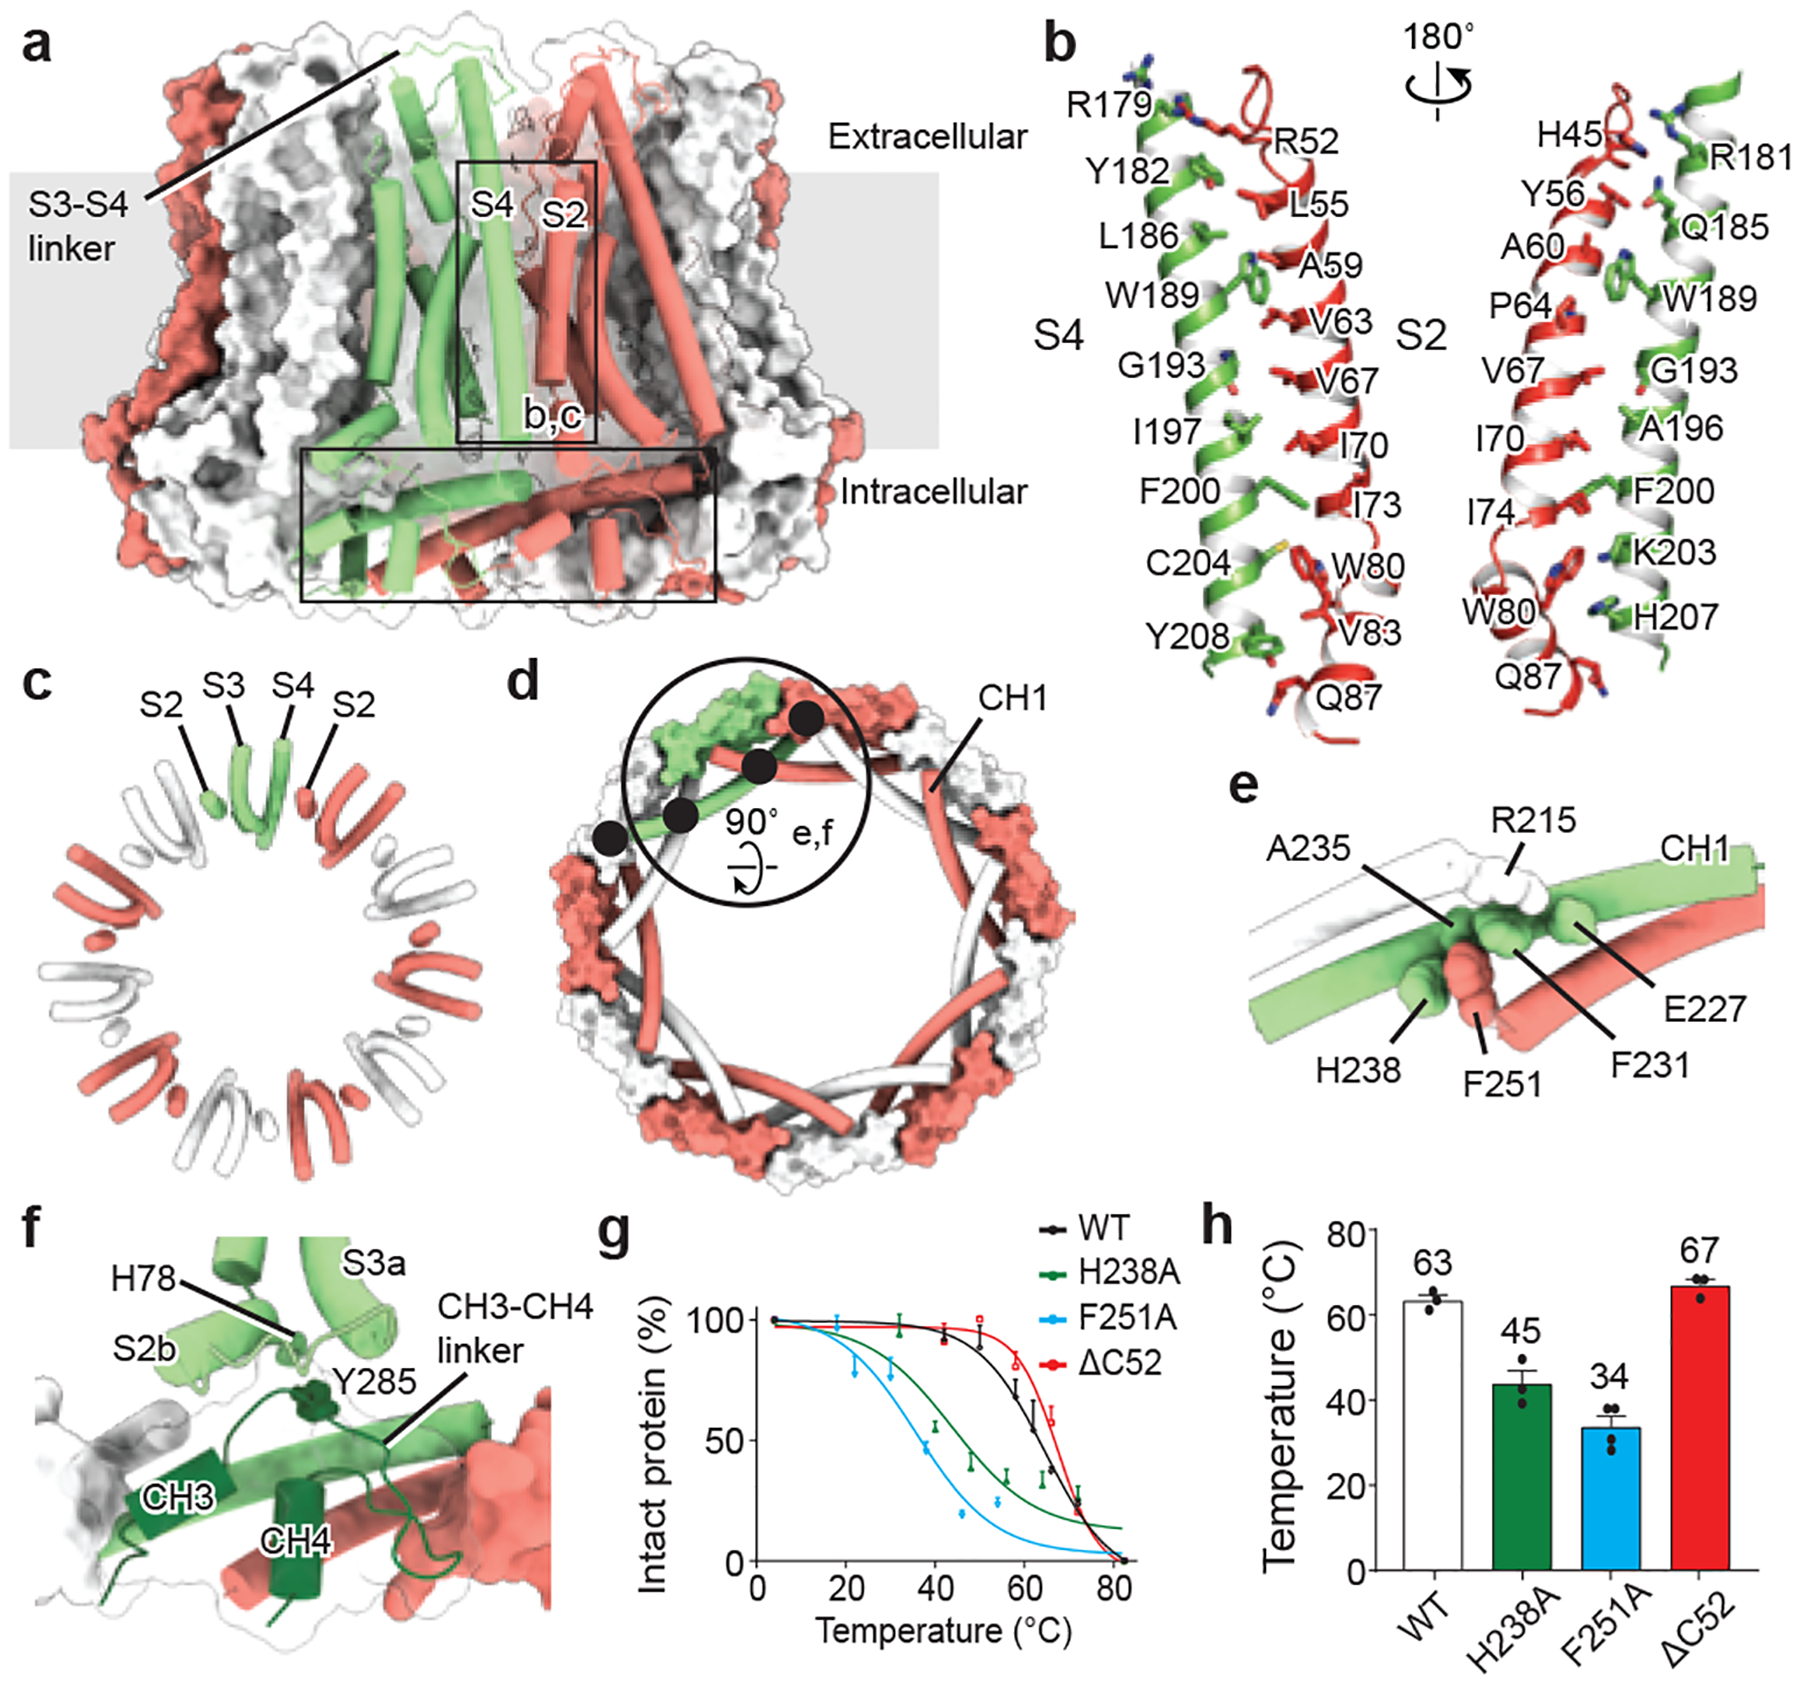
a, A view of the intersubunit interface of EDTA–CALHM2hemi at the TMD (vertical rectangle; shown in b, c) and at the CTD (horizontal rectangle). b, c, The intersubunit interface at the TMD between helix S2 and the adjacent S4, viewed in parallel to the membrane (b) or from the intracellular side (c). d, Interface at the CTD viewed from the intracellular side. Black filled circles indicate the four intersubunit interfaces of CH1. e, Enlargement of the large circle in d showing the interactions of three neighbouring CH1 helices. f, Enlargement of the large circle in d, showing the TMD–CTD interface and the exterior circular layer in the CTD formed by CH3, CH4 and the CH3–CH4 linker. g, h, Thermostability test of wild-type CALHM2, the mutants of key residues involved in the CH1 interactions in e, and the mutant with a deletion of 52 residues at the C-terminal end (ΔC52). Both F251A and H238A considerably decreased the thermostability of the protein, but the ΔC52 construct showed no effect. n = 3, 3, 4 or 3 biologically independent experiments were performed for wild-type CALHM2, CALHM2(H238A), CALHM2(F251A) or CALHM2(ΔC52), respectively. Graphs are mean ± s.e.m. Each dot indicates the value of one single independent experiment.
At the TMD layer, only the S2 and S4 helices of adjacent subunits interact with each other, mainly through hydrophobic interactions (Fig. 3b, c). By contrast, the TMD in connexins, innexins and VRACs forms a compact helix bundle, which results in different inter-subunit interfaces. Specifically, where in connexin the S1 and S2 helices of adjacent subunits mediate the inter-subunit interface4, in innexin there is a lack of interaction between adjacent TMDs8.
At the CTD layer, each long CH1 projects out to interact with 4 adjacent CH1 helices (2 on each side), weaving the 11 subunits into a large circular frame (Fig. 3d). We identified a major interaction located in the middle of CH1, sandwiched by the N- and C-terminals of two adjacent CH1 helices. These three adjacent CH1 helices dovetail to each other through aromatic and charged residues (Fig. 3e), which are conserved in the CALHM family and have crucial roles in channel assembly and stability (Fig. 3g, h, Extended Data Fig. 8). Moreover, CH3 and CH4—along with their linker—buckle into the space of the circular frame, forming an additional exterior circular layer (Fig. 3d, f). Such a complex interaction network in the CTD is absent in connexins, innexins and VRACs. The contact between the TMD and the CTD is mediated mainly by the CH3–CH4 linker with its cognate S2b and S3a segments, through the interaction between Y285 and H78 (Fig. 3f). Interestingly, a P86L polymorphism in CALHM1 that is linked with Alzheimer’s disease is located in the TMD–CTD interface (Extended Data Fig. 8). This polymorphism changes the functional properties of CALHM11,2,15,29, which suggests this interface has an important role in channel gating.
Inhibition mechanism by RUR
We compared the structures of EDTA–CALHM2hemi and RUR–CALHM2 (Fig. 4, Supplementary Video 1). The 11 CH1 helices of each structure are well-aligned, which provides support for the role of CH1 in constituting a rigid scaffold of the channel. By contrast, the TMD displays notable conformational changes in two aspects. First, RUR occupies the position of the vertical S1, and thus drives helix S1 to swing nearly 60° towards the pore axis; this reduces the pore diameter by approximately 27 Å (Fig. 4b, c). Second, there is obvious vertical compression and horizontal expansion, resulting in the entire TMD sliding towards the CTD and remodelling at the TMD–CTD interface (Fig. 4a).
Fig. 4 |. RUR inhibition and ion-conducting pore.
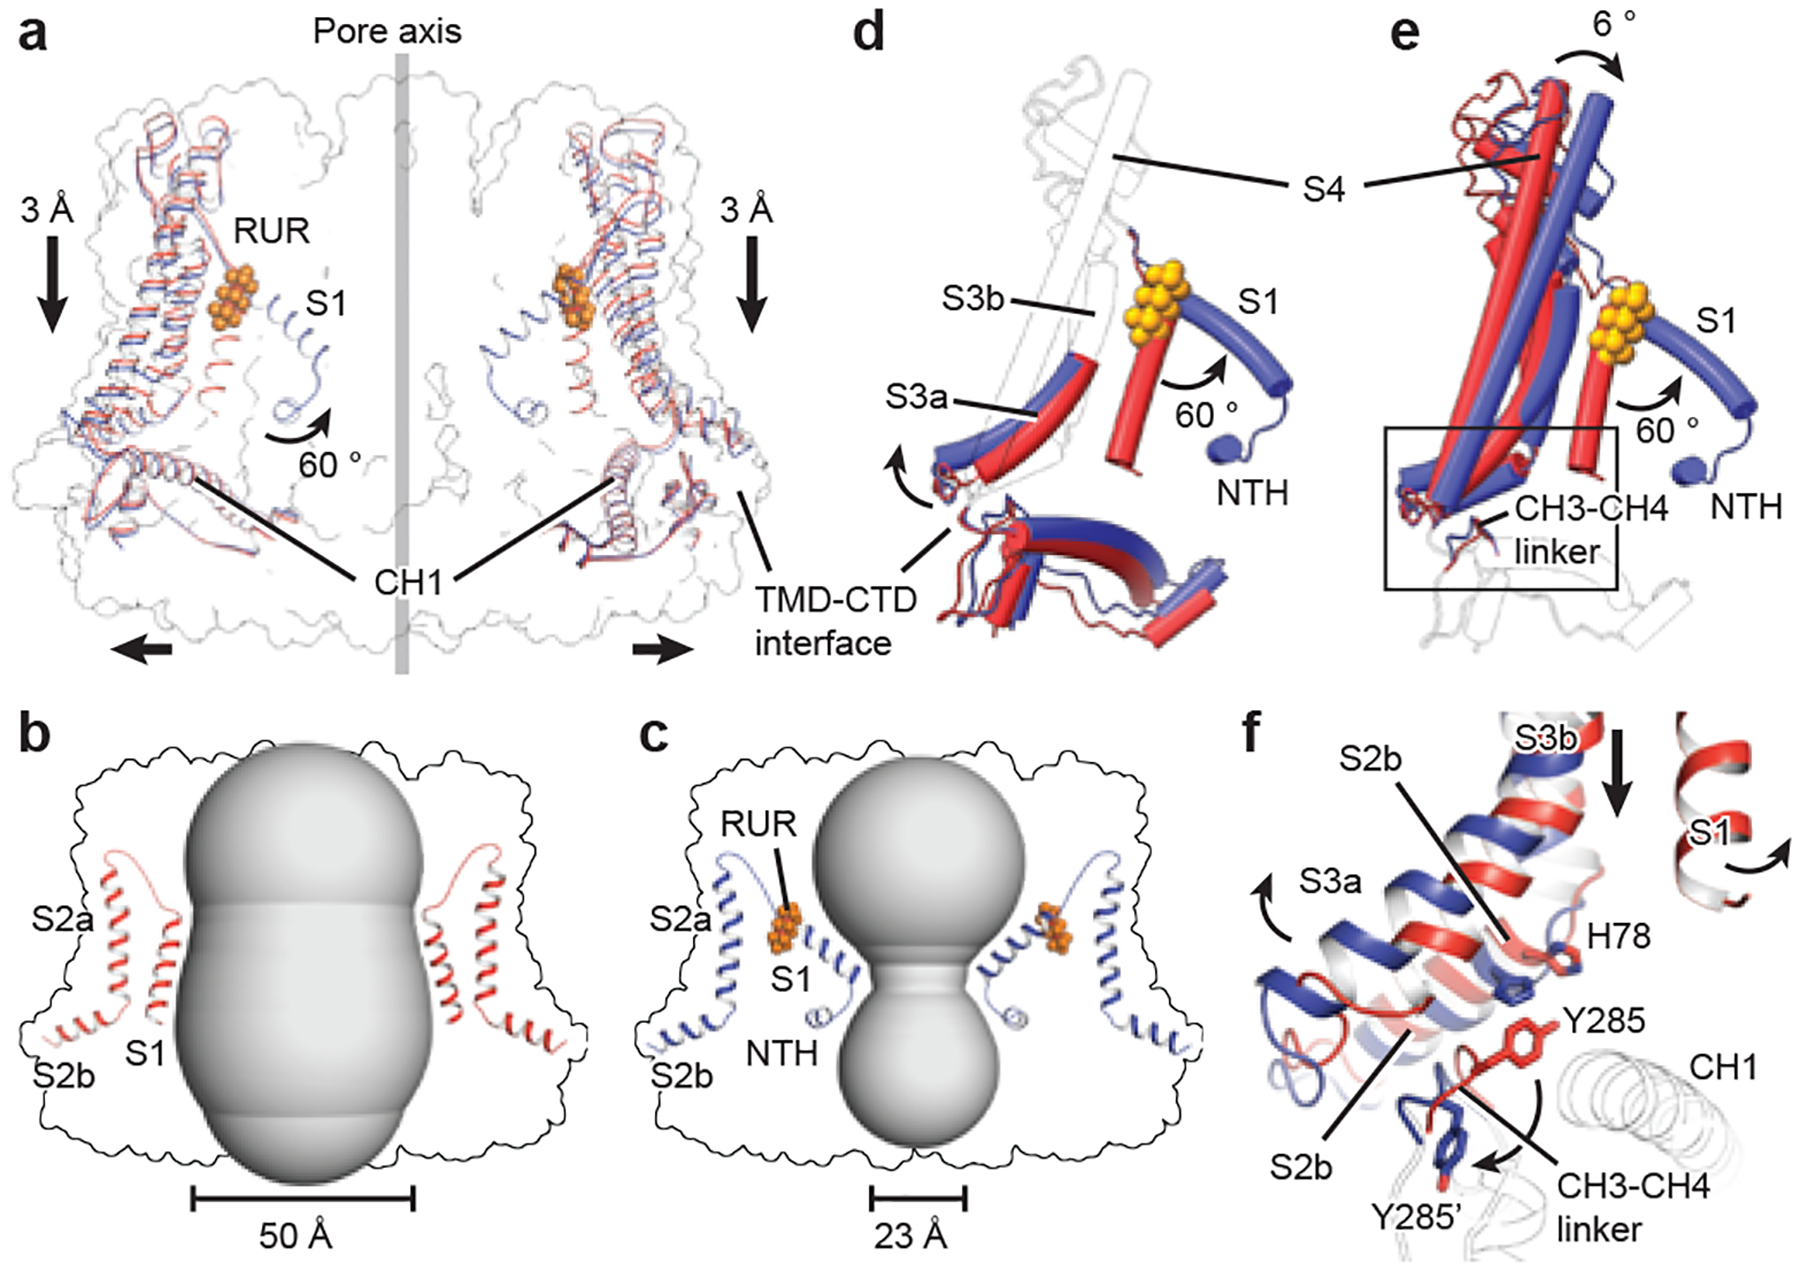
a, Superimposition of EDTA–CALHM2hemi (red) and RUR–CALHM2 (blue) using the 11 CH1 helices. Only two subunits are shown, for clarity. b, c, The shape of the ion-conducting pore in EDTA–CALHM2hemi (b) and in RUR–CALHM2 (c). The smallest pore diameters were estimated without considering the involvement of the NTHs; they do not represent the real pore size and are used only to show the change of the pore profile. d, e, Superimposition of a single subunit of EDTA–CALHM2hemi (red) and RUR–CALHM2 (blue) using either the TMD (d) or the CTD (e). Regions with conformational changes are highlighted in colour and the rest is shown as a transparent cartoon, for clarity. f, Enlargement of the rectangle in e, showing conformational changes between EDTA–CALHM2hemi (red) and RUR–CALHM2 (blue) at the TMD–CTD interface. The CTD is shown as a transparent cartoon for clarity.
To further understand the action of RUR, we compared single subunits of EDTA–CALHM2hemi and RUR–CALHM2 by superimposing their CTD or TMD (Fig. 4d, e). With the exceptions of helix S1 and the TMD–CTD interface (Fig. 4d), the TMD displays a rigid-body inward tilting towards the pore axis upon binding of RUR, which explains the vertical compression of the channel (Fig. 4e). In EDTA–CALHM2hemi, the vertical S1 loosely attaches to helix S3, with the S3a segment sterically restricting the CH3–CH4 linker on the CTD. The CTD is further coupled to the S2b segment through the interaction between Y285 on the CH3–CH4 linker and H78 on the S2b, thus supporting the TMD in an elevated position (Fig. 4f). The binding of RUR detaches helix S1 from S3, and segment S3a swaps outward and releases its restriction on the CH3–CH4 linker. As a result, Y285 flips nearly 180° (Fig. 4f), rupturing the coupling between Y285 and H78 and leading the entire TMD to move towards the CTD.
To define the functional states of EDTA–CALHM2hemi and RUR–CALHM2, we inspected into their ion-conducting pores. The pore diameters of EDTA–CALHM2 and RUR–CALHM2 at two extreme conditions, with all S1 in vertical or lifted conformation, were estimated to be 50 and 23 Å (respectively) without considering the 11 copies of the NTH (Fig. 4b, c). Although the NTHs are disordered in the high-resolution structures refined using C11 symmetry, we observed prominent S1 helix and NTH densities restricting the pore in one of the asymmetric RUR–CALHM2 classes (Extended Data Fig. 4), implying that the real pore sizes should be smaller. Indeed, truncation of the first 20 N-terminal residues (CALHM2(ΔN20)) showed a notable reduction in inhibition by RUR, which provides support for a role of the NTH in channel gating by physically restricting the pore; such a role is consistent with other channels with a similar topology (including connexins4,7, innexins8 and VRACs5,6). Moreover, a charge-neutralizing R10A mutant (CALHM2(R10A)) in the NTH showed a marked reduction in inhibition by RUR at negative membrane potentials, indicating the involvement of the NTH in the voltage-dependent inhibition by RUR (Extended Data Figs. 1a, d–f, 9).
We suggest that the EDTA–CALHM2hemi structure represents an active or open state, and the RUR–CALHM2 structure represents an inhibited state. The RUR functions as an antagonist instead of a pore blocker, based on its binding site. Despite being a nonspecific inhibitor for many ion channels19–21, this is—to our knowledge—the first time that the molecular mechanism that underlies inhibition by RUR has been elucidated. Relative to wild-type CALHM2, Ca2+-dependent inhibition remained unaffected for CALHM2(ΔN20) and CALHM2(R10A), implying that RUR and Ca2+ may not share the same binding site and that they may inhibit CALHM2 through different mechanisms (Extended Data Figs. 1a, d–f, 9).
CALHM2 gap junction
The EDTA–CALHM2 gap junction is docked by two hemichannels through the extracellular S3–S4 linker (Extended Data Fig. 10a). In contrast to the hemichannel, the pore in EDTA–CALHM2gap is smaller, and helix S1 is in a lifted conformation similar to that in RUR–CALHM2 (Extended Data Fig. 10b). The S1 helix is less well-defined than those in RUR–CALHM2 because it lacks the stabilization of the RUR molecule underneath. The docking of two hemichannels results in a marked conformational rearrangement at the junction, in which a flat loop in the S3–S4 linker is reformed into a triangle shape. As a result, two interfaces are created at the junction (Extended Data Fig. 10c, d), a primary interface between the paired subunits of two hemichannels and a minor interface between the diagonal subunits. The deletion of a segment (Δ143–146) in the S3–S4 linker hindered CALHM2 in forming a gap junction (Extended Data Fig. 10d, e).
Further investigation is required to reveal whether EDTA–CALHM2gap is in an inhibited state similar to that of RUR–CALHM2, and how the two hemichannels within a gap junction coordinate with each other. In addition, despite the observation of a CALHM2 gap junction in vitro, its existence in vivo remains to be determined.
Conclusion
Our CALHM2 structures showed the undecameric assembly of a CALHM family member, and describe a molecular mechanism that underlies inhibitory gating induced by the antagonist RUR (Fig. 5). The primary determinants for the channel gate of CALHM2 are the S1 helix and NTH. The Ca2+-free hemichannel favours helix S1 in a vertical conformation and loosely attached to S3, resulting in a large open pore. When RUR occupies the space in which the vertical S1 is located, it stabilizes helix S1 upward, which contracts the pore. We propose a two-section inhibitory mechanism, in which the S1 helix adjusts the pore size coarsely and the NTH makes fine adjustments, eventually physically occluding the pore. We speculate that helix S1 and the NTH of the 11 subunits may move individually (rather than concertedly) to assume the conformational change and thus adjust the pore size with high flexibility, which enables molecules of various sizes to pass through the pore. Our structures build a solid foundation for understanding the physiology and pharmacology of the CALHM family.
Fig. 5 |. Schematic of the RUR-induced inhibition mechanism.

Conformational changes are shown between EDTA–CALHM2hemi (a) and RUR–CALHM2 (b). The observed movement of helix S1 and the proposed movement of the NTH during channel inhibition are indicated. The region that cannot be modelled is indicated by dashed lines.
METHODS
No statistical methods were used to predetermine sample size. The experiments were not randomized and investigators were not blinded to allocation during experiments and outcome assessment.
Cloning
The full-length human CALHM1, CALHM2 and CALHM3 genes (http://www.uniprot.org; UniProtKB numbers: Q8IU99, Q9HA72 and Q86XJO, respectively) were synthesized by Genscript and subcloned into a pEG BacMam vector comprising an N- or C-terminal thrombin cleavage site, GFP and His8 tag30. We focused on CALHM2 because it showed the best biochemical properties among CALHM1, CALHM2 and CALHM3 (Extended Data Fig. 1g–i). CALHM2-mutant primers were synthesized from Eurofins USA and were produced using site-directed mutagenesis and/or primer extension PCR.
Construct screening
tsA201 cells were seeded into 2-ml plates to a final concentration of 0.9–1 × 10⁶ cells/ml in DMEM containing 10% (v/v) fetal bovine serum, transfected with N-terminally and C-terminally tagged CALHM2 plasmids using Lipofectamine 2000 (ThermoFisher), and placed at 37 °C for 24 hours. The next day, sodium butyrate was added to each well to a final concentration of 10 mM and placed at 30 °C. Twenty-four hours later, cells were imaged, collected, washed with 150 mM NaCl, and 20 mM Tris-HCl pH 8.0 buffer (TBS) and stored at −20 °C. Cell aliquots were thawed on ice, mixed with 0.5% digitonin-containing buffer and left to incubate on ice for 30 minutes. Mixtures were then centrifuged at 186,000g using a TLA 100.3 rotor (Beckman Coulter) for 20 minutes at 4 °C. The supernatant was carefully pipetted off and injected onto a 3 ml GE Healthcare Superose 5/150 GL column, prewashed with TBS buffer plus detergent, at a flow rate of 0.3 ml/min, and analysed to determine detergent solubility and retention time.
Protein expression and purification
The following purification was revised accordingly, and carried out as previously described31–35. DNA was transformed into DH10Bac cells to produce bacmid for baculovirus production. Flasks of tsA201 suspension cells (ATCC cat. no. CRL-11268, tested negative for mycoplasma contamination, and authenticated) were grown to a density of 3.0–3.5 × 10⁶ cells per millilitre at 37 °C. P2 virus (8%) (v/v) was added to each flask and incubated at 37 °C for 12 hours. Sodium butyrate was added to a final concentration of 10 mM and flasks were incubated at 30 °C. Cells were collected 48 hours after infection and frozen at −80 °C. For use, cells were thawed on ice and resuspended in TBS buffer supplemented with 1 mM PMSF, 0.8 μM aprotinin, 2 μg/ml leupeptin, and 2 mM pepstatin A; then, they were lysed via sonication for 15 minutes. The lysate was centrifuged at 3,000g for 10 minutes. The supernatant was ultracentrifuged at 186,000g in a Ti45 rotor (Beckman Coulter) at 4 °C for 1 hour. Membrane pellets were homogenized in TBS supplemented with protease inhibitors and solubilized in 1% digitonin at 4 °C for 2 hours. Membrane debris was removed by centrifugation at 186,000g in a Ti45 rotor at 4 °C for 1 hours.
The solubilized protein was applied to 10 ml of TALON resin preequilibrated with 3 column volumes of TBS supplemented with 10 mM imidazole and 0.1% digitonin (buffer A). The column was washed with 5 column volumes of buffer A, and eluted with 3 column volumes of elution buffer containing 250 mM imidazole, pH 8.0. CALHM2 N-terminal- and C-terminal-containing fractions were pooled and were concentrated directly for size-exclusion chromatography in TBS supplemented with 0.1% digitonin, pH 8.0. The initial purification using N-terminally and C-terminally GFP-tagged constructs used in cryo-EM yielded micrographs containing only hemichannels, and the 3D reconstructions indicated fuzzy tails hanging outside of the detergent micelle, resulting in low-resolution reconstructions. To eradicate the flexible GFP tag, thrombin digestion was implemented overnight at 4 °C at a ratio of 1:20 thrombin:protein. The resulting peak fractions containing GFP-cleaved CALHM2C were then combined and concentrated to 8–9 mg/ml or tested directly via negative-stain grids. GFP-cleaved CALHM2C in the presence of EDTA or RUR was frozen for further cryo-EM studies. A high concentration of RUR destabilizes CALHM2, based on a stability test using fluorescence-detection size-exclusion chromatography (FSEC) (Extended Data Fig. 1j). Therefore, we chose a RUR concentration of 1.5 mM that nearly saturated the proteins.
Cryo-EM sample preparation and data acquisition
Concentrated CALHM2C protein was preincubated with EDTA or RUR for 30 minutes on ice. The protein mixture (2.5 μl) was then applied to glow-discharged Quantifoil carbon grids (gold, 1.2/1.3-μm size/hole space, 300 mesh), blotted for 2 seconds at 100% humidity using a Vitrobot Mark III, and flash-frozen in vitreous liquid ethane. Particle images were collected using the FEI Titan Krios electron microscope equipped with a nominal magnification 130,000× Gatan K2 Summit direct electron detector, recording image stacks in super-resolution counting mode at a binned pixel size of 1.026 Å. Each image was dose-fractionated in 40 frames using a total exposure time of 8 seconds at 0.2 seconds per frame. The dose rate was 6.76 e− Å−2 s−1. All image stacks were collected using SerialEM36, an automated acquisition program. Nominal defocus values varied from 1.0 to 2.5 μm.
Cryo-EM data processing
Movies were motion-corrected using MotionCor237. Gctf38 was applied to non-dose-weighted micrographs to estimate defocus values. Particles were picked using Gautomatch (http://www.mrc-lmb.cam.ac.uk/kzhang/Gautomatch/). Templates were generated from the initial pilot results and subjected to two rounds of 2D classification using RELION 2.1 and RELION 3.0-beta-2 (ref.39). In the EDTA dataset, CryoSPARC40 was used to separate hemichannels and gap junctions from 2D classification results. In addition, CryoSPARC was used to obtain the initial models of the hemichannel and gap junction. For the EDTA–CALHM2 data, the hemichannel particles and gap-junction particles were further cleaned up by 2D classification, and the selected particles from 2D classification were subjected to 3D classification in RELION using maps from CryoSPARC low-pass-filtered of 60 Å as reference models. For the RUR–CALHM2 data, the EDTA–CALHM2 hemichannel map was used as a reference model during 3D classification. Particles from classes that showed high-resolution features were refined without applying symmetry, and particles from classes showing obvious C11 symmetry were further refined using C11 symmetry. In the RUR–CALHM2 dataset, in addition to the symmetric class that yielded the highest-resolution structure, two well-defined non-symmetric classes were observed. Both non-symmetric classes are ellipse-shaped when viewed perpendicular to the membrane, having the S1 helices in lifted conformation. In one of these two non-symmetric classes, prominent densities belonging to two subunits extending to the centre of the pore were observed. Interestingly, these two subunits are located on the opposite sides of the longer axis of the ellipse; it is possible that the ellipse shape is a result of the push between the S1 helix and NTH of these two subunits. To assess the structural heterogeneity of the first transmembrane helix S1, we analysed the particles that yielded maps with highest resolutions of RUR–CALHM2 and EDTA–CALHM2 using an approach that combined symmetry expansion and signal subtraction, in which all the subunits were subtracted and classified without image alignment in RELION. For RUR–CALHM2, two different conformations of helix S1 appeared with 70% in lifted conformation and 13% in vertical conformation attached to S3, with the rest not being well-defined. No RUR densities are observed in the class with the vertical S1. For EDTA–CALHM2hemi, the 3D classification of a single subunit reveals that approximately 48% of the S1 helices are in vertical conformation and attached to S3, whereas the rest are not well-defined. We suggest this may be caused by the high flexibility of helix S1 in the absence of RUR, and that the non-resolved densities may present the intermediate states of S1 between the lifted and vertical conformation. By contrast, 3D classification of single subunits of EDTA–CALHM2gap did not yield meaningful results. The proportion of the single subunits in a gap junction structure is probably too small to perform reliable signal subtraction and subsequent 3D classification.
Model building
De novo model building of RUR–CALHM2 was carried out using Coot41, guided by bulky residues and secondary structure prediction. The architecture of CALHM2 is mainly α helices, which greatly assisted in registering assignment. The EDTA–CALHM2 models were built based on the RUR–CALHM2 model. Model building of the less-well-defined regions—including the NTH, S1 helix and part of the extracellular loops—were carried out using the maps refined without a soft solvent mask, and the maps of the single subunit obtained through symmetry expansion, signal subtraction and 3D classification. The models were then subjected to real-space refinement using phenix.refine42 with secondary structure restraints. The refined models were manually examined and adjusted in Coot. Although we can fit side chains in most parts of the protein, owing to intrinsic positional uncertainty we only fitted protein backbone into the densities of the NTH, S1 helix and part of the extracellular loops based on secondary structure prediction, and our electrophysiology experiment on a mutant (CALHM2(E37R)) located on S1. The exact position of residues in these regions (residues 13–40 and 138–152) should be interpreted with caution. For validation of the refined structures, Fourier shell correlation39 curves were applied to calculate the difference between the final model and electron microscopy map. The geometries of the atomic models were evaluated using MolProbity43. Figures were created using PyMOL44 and UCSF Chimera45.
Thermostability experiment
Wild-type CALHM2 and mutants were transfected into tsA201 cells as described in ‘construct screening’. After collection, mutants were extracted in TBS buffer supplemented with 10 mM n-dodecyl β-d-maltoside and 2 mM cholesteryl hemisuccinate Tris salt at 4 °C for 1 hour. Solubilized samples were ultracentrifuged at 186,000g for 20 minutes at 4 °C to remove cell debris and membranes. The resulting supernatants were heated at selected temperatures for 10 minutes and centrifuged at 186,000g at 4 °C for 20 min to remove any aggregates. Heated supernatants were loaded onto a 3 ml GE Healthcare Superose 5/150 GL column for high-performance liquid chromatography to measure GFP intensity (excitation 488 nm and emission 508 nm) and compared to 4-°C controls.
Electrophysiology
Flasks of tsA201 suspension cells were grown to a density of 1.0 × 10⁶ cells per millilitre at 37 °C and infected with 1–5% (v/v) human CALHM2C P2 virus. Twelve hours later, 5 mM sodium butyrate was added, and the cells were left to incubate at 30 °C for an additional 24 hours. Infected cells were plated to a final density of 0.3 × 10⁶ cells per millilitre in a 24-well plate on microscope cover glass (Fisher), incubated for 3 hours and recorded 24–48 hours after infection. Whole-cell patch-clamp recordings were collected at room temperature using a HEKA EPC-10 amplifier. Cells were held at −60 mV and data were recorded at 20 kHz and filtered at 1 kHz. Inhibitor- and activator-containing buffers were applied using a two-channel theta-glass pipette. The bath solution was prepared using 140 mM NaCl, 5.4 mM KCl, 5 mM CaCl2, 1 mM MgCl2 10 mM HEPES and 20 mM sucrose pH 7.4, and electrodes were filled with an internal solution of 130 mM KCl, 10 mM NaCl, 1 mM CaCl2, 10 mM HEPES, and 11 mM EGTA (pH 7.3). All data were collected using Patchmaster software (HEKA).
Deglycosylation test
Five hundred microlitres of pelleted cells was thawed on ice, mixed with 100 μl of 1% digitonin detergent and left to incubate for 45 minutes at 4°C. Detergent–cell mixtures were then centrifuged at 3,000g for 10 min at 4 °C. Supernatant was transferred into fresh Eppendorf tubes and centrifuged at 186,000g for 20 min at 4 °C. High-speed supernatant was then transferred into fresh Eppendorf tubes for a second time. Each sample was divided into four tubes; the first two tubes as the control and the other two tubes mixed with 0.5 μl (250 U) of endoglycosidase H (NEB P0702S) or PNGase F (NEB P0704S), respectively. Samples were left nutating overnight at 4 °C at optimum pH. The following day, all samples were centrifuged at 186,000g for 20 min at 4 °C, mixed with 5× sample loading buffer to a final concentration of 1× and run on a 4–20% SDS–PAGE gel with protein standard. Unstained gel was analysed using a fluorescent gel imager to detect GFP.
Reporting summary
Further information on research design is available in the Nature Research Reporting Summary linked to this paper.
Data availability
The cryo-EM density map and coordinates of EDTA–CALHM2hemi, EDTA–CALHM2gap, and RUR–CALHM2 have been deposited in the Electron Microscopy Data Bank (EMDB) under accession numbers EMDB-20788, EMDB-20790 and EMDB-20789, respectively, and in the Research Collaboratory for Structural Bioinformatics Protein Data Bank under accession codes 6UIV, 6UIX and 6UIW, respectively. The single subunit map(s) obtained from signal subtraction and associated mask have been deposited under the corresponding EMDB accession number.
Extended Data
Extended Data Fig. 1 |. Electrophysiology experiments, construct screening and purification.
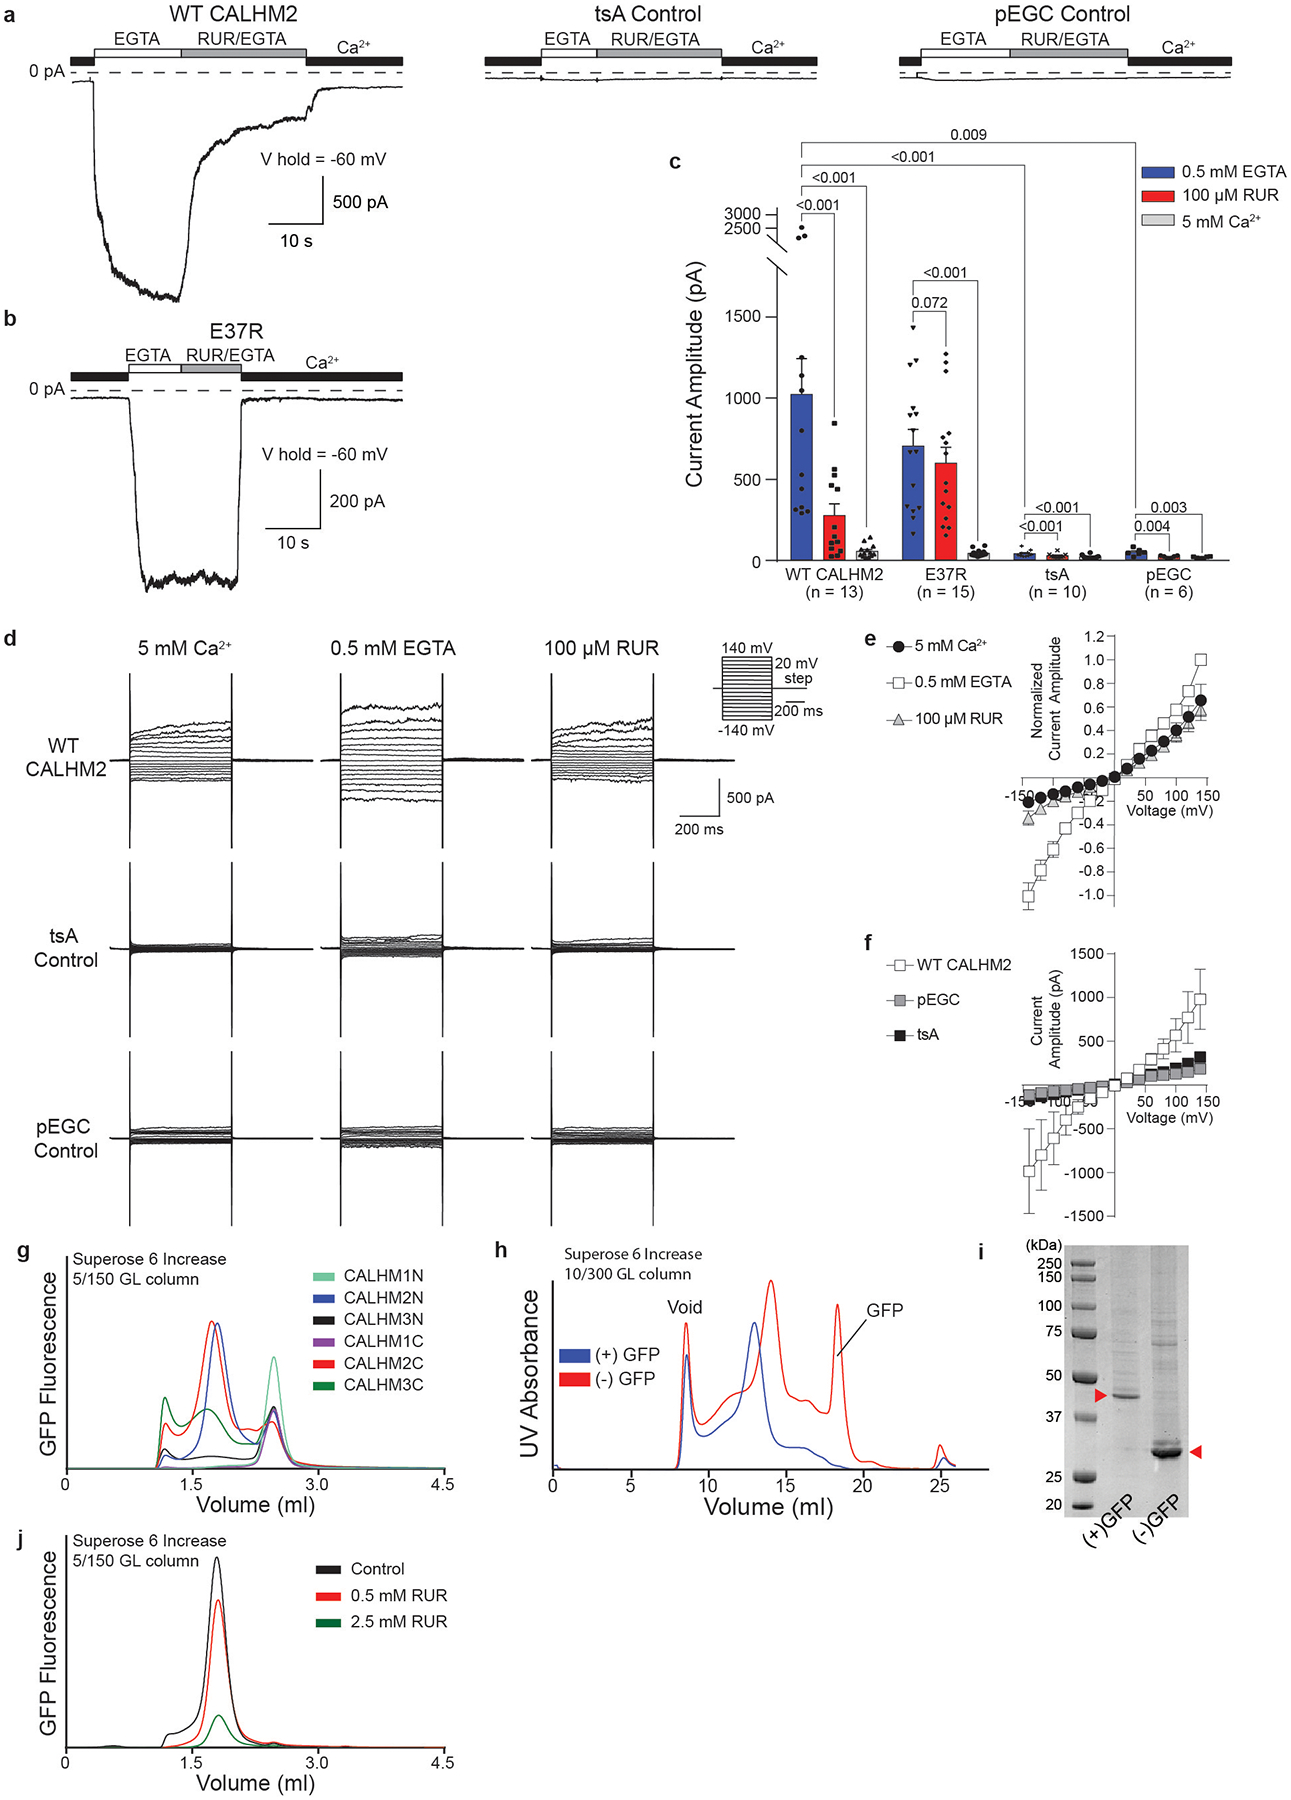
a, b, Representative current traces recorded in whole-cell mode at −60 mV for cells expressing wild-type CALHM2, tsA control cells, tsA cells transfected with empty pEGC vector (a) or tsA cells expressing CALHM2(E37R) (b). Cells were switched from bath buffer that contained 5 mM Ca2+ to one that contained 0.5 mM EGTA (0 mM Ca2+) to induce the current. The current was inhibited using a buffer that contained 100 μM RUR and 0.5 mM EGTA. n = 13, 15, 10 or 6 biologically independent experiments were performed for wild-type CALHM2, CALHM2(E37R), tSA control or pEGC control, respectively. c, Quantification of current amplitude in 0.5 mM EGTA, 100 μM RUR and 0.5 mM EGTA, and 5 mM Ca2+ conditions for CALHM2-expressing and control cells from a, b. Two-tailed paired and unpaired t-tests were applied to calculate P values (using GraphPad Prism 7), from within and outside of each cell type, respectively. Each dot indicates the value of one single independent experiment. RUR inhibition was nearly abolished in the CALHM2(E37R) mutant. d, Representative current–voltage relationships obtained by applying 500-ms voltage pulses ranging from 140 mV to −140 mV from a holding potential of 0 mV (20-mV steps) to cells expressing wild-type CALHM2 (top), tsA control cells (middle) and tsA cells transfected with empty pEGC vector (bottom). Currents were recording in the presence of 5 mM Ca2+, 0.5 mM EGTA (0 mM Ca2+) or 100 μM RUR and 0.5 mM EGTA. n = 7, 6 or 4 biologically independent experiments were performed for wild-type CALHM2, tSA control or pEGC control, respectively. e, The data of wild-type CALHM2 in d were normalized to the amplitude of the current recorded in the presence of EGTA at 140 mV and calculated as mean ± s.e.m. from 7 cells. f, Averaged current amplitude of cells expressing wild-type CALHM2 (n = 7), cells transfected with empty pEGC vector (n = 4) and tsA control cells (n = 6) in the presence of 0.5 mM EGTA, plotted as mean ± s.e.m. g, FSEC profiles showing that human CALHM2 N-terminally tagged with GFP (CALHM2N) and human CALHM2 C-terminally tagged with GFP (CALMH2C) have the best biochemical properties among human CALHM1, CALHM2 and CALHM3 when solubilized in digitonin. This experiment was repeated three times yielding similar results. h, Size-exclusion chromatography profiles of CALHM2C in digitonin before (blue) and after (red) GFP cleavage. After cleavage, the main peak shifted towards a smaller molecular weight. Purification of CALHM2C was repeated multiple times (>10), yielding similar results in each case. i, SDS gel of purified CALHM2C (indicated by red arrows) before (left band) and after (right band) GFP cleavage. j, Stability test of purified CALHM2C in the presence of RUR at two concentrations using FSEC, showing that a high concentration of RUR decreases CALHM2 stability. This experiment was repeated five times, each yielding similar results.
Extended Data Fig. 2 |. Factors that affect the formation of a gap junction.
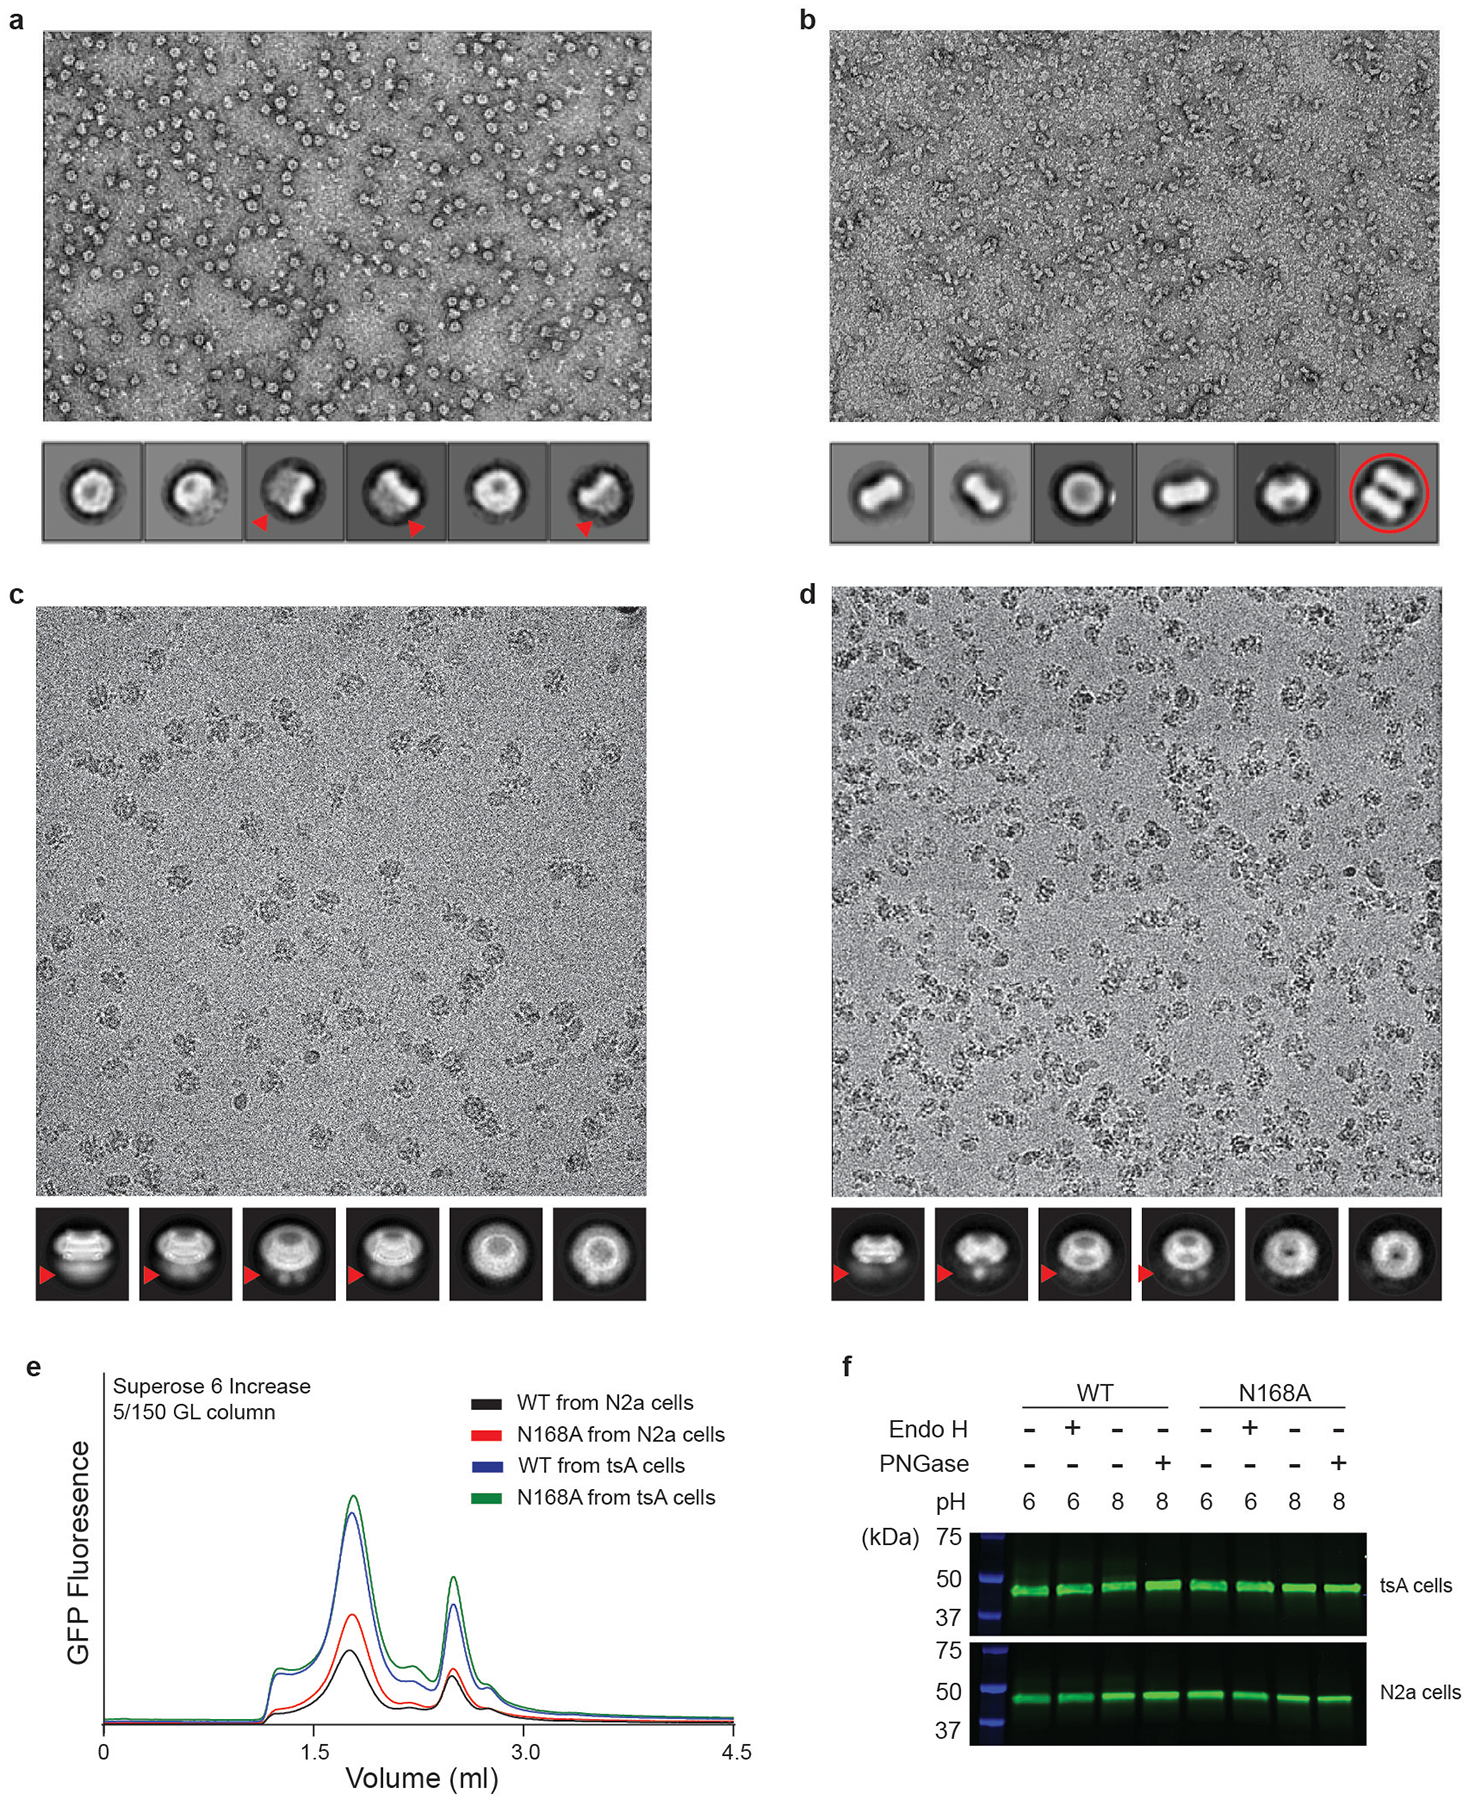
a, A representative micrograph of purified CALHM2N by negative-stain electron microscopy; selected 2D classes are shown below. Fuzzy areas (indicated by red arrows) are caused by flexible GFP tags; this is also implied in c and d. Only hemichannels, and not gap junctions, appear in the micrograph. b, A representative micrograph of purified CALHM2C (from which the GFP tag has been cleaved) by negative-stain electron microscopy. The fuzzy areas in a, c, d disappeared in the 2D classes, which confirms that they are indeed due to the GFP tag. One of the 2D class averages represents a gap junction (red circle). c, A representative micrograph of purified CALHM2N by cryo-EM in the presence of 1 mM EDTA, collected using the Titan Krios; selected 2D classes are shown below. Only hemichannels, and not gap junctions, are observed. d, A representative micrograph of purified CALHM2C by cryo-EM using the Talos Arctica; selected 2D classes are shown below. Only hemichannels, and not gap junctions, are seen. e, FSEC profile of wild-type CALHM2 and the CALHM2(N168A) mutant, expressed in tsA 201 and N2a cells. This experiment was repeated three times, each yielding similar results. f, The wild-type CALHM2 ran at the same height in SDS gel before and after treatment using 250 U of Endo H and 250 U PNGase at optimum pH. Moreover, the CALHM2(N168A) mutant ran at the same height as the wild-type CALHM2. These data suggest CALHM2 is not glycosylated. This experiment was repeated multiple times (Endo H, n = 6; PNGase, n = 3), all yielding non-glycosylation phenotypes.
Extended Data Fig. 3 |. The workflow of cryo-EM data processing for EDTA–CALHM2.
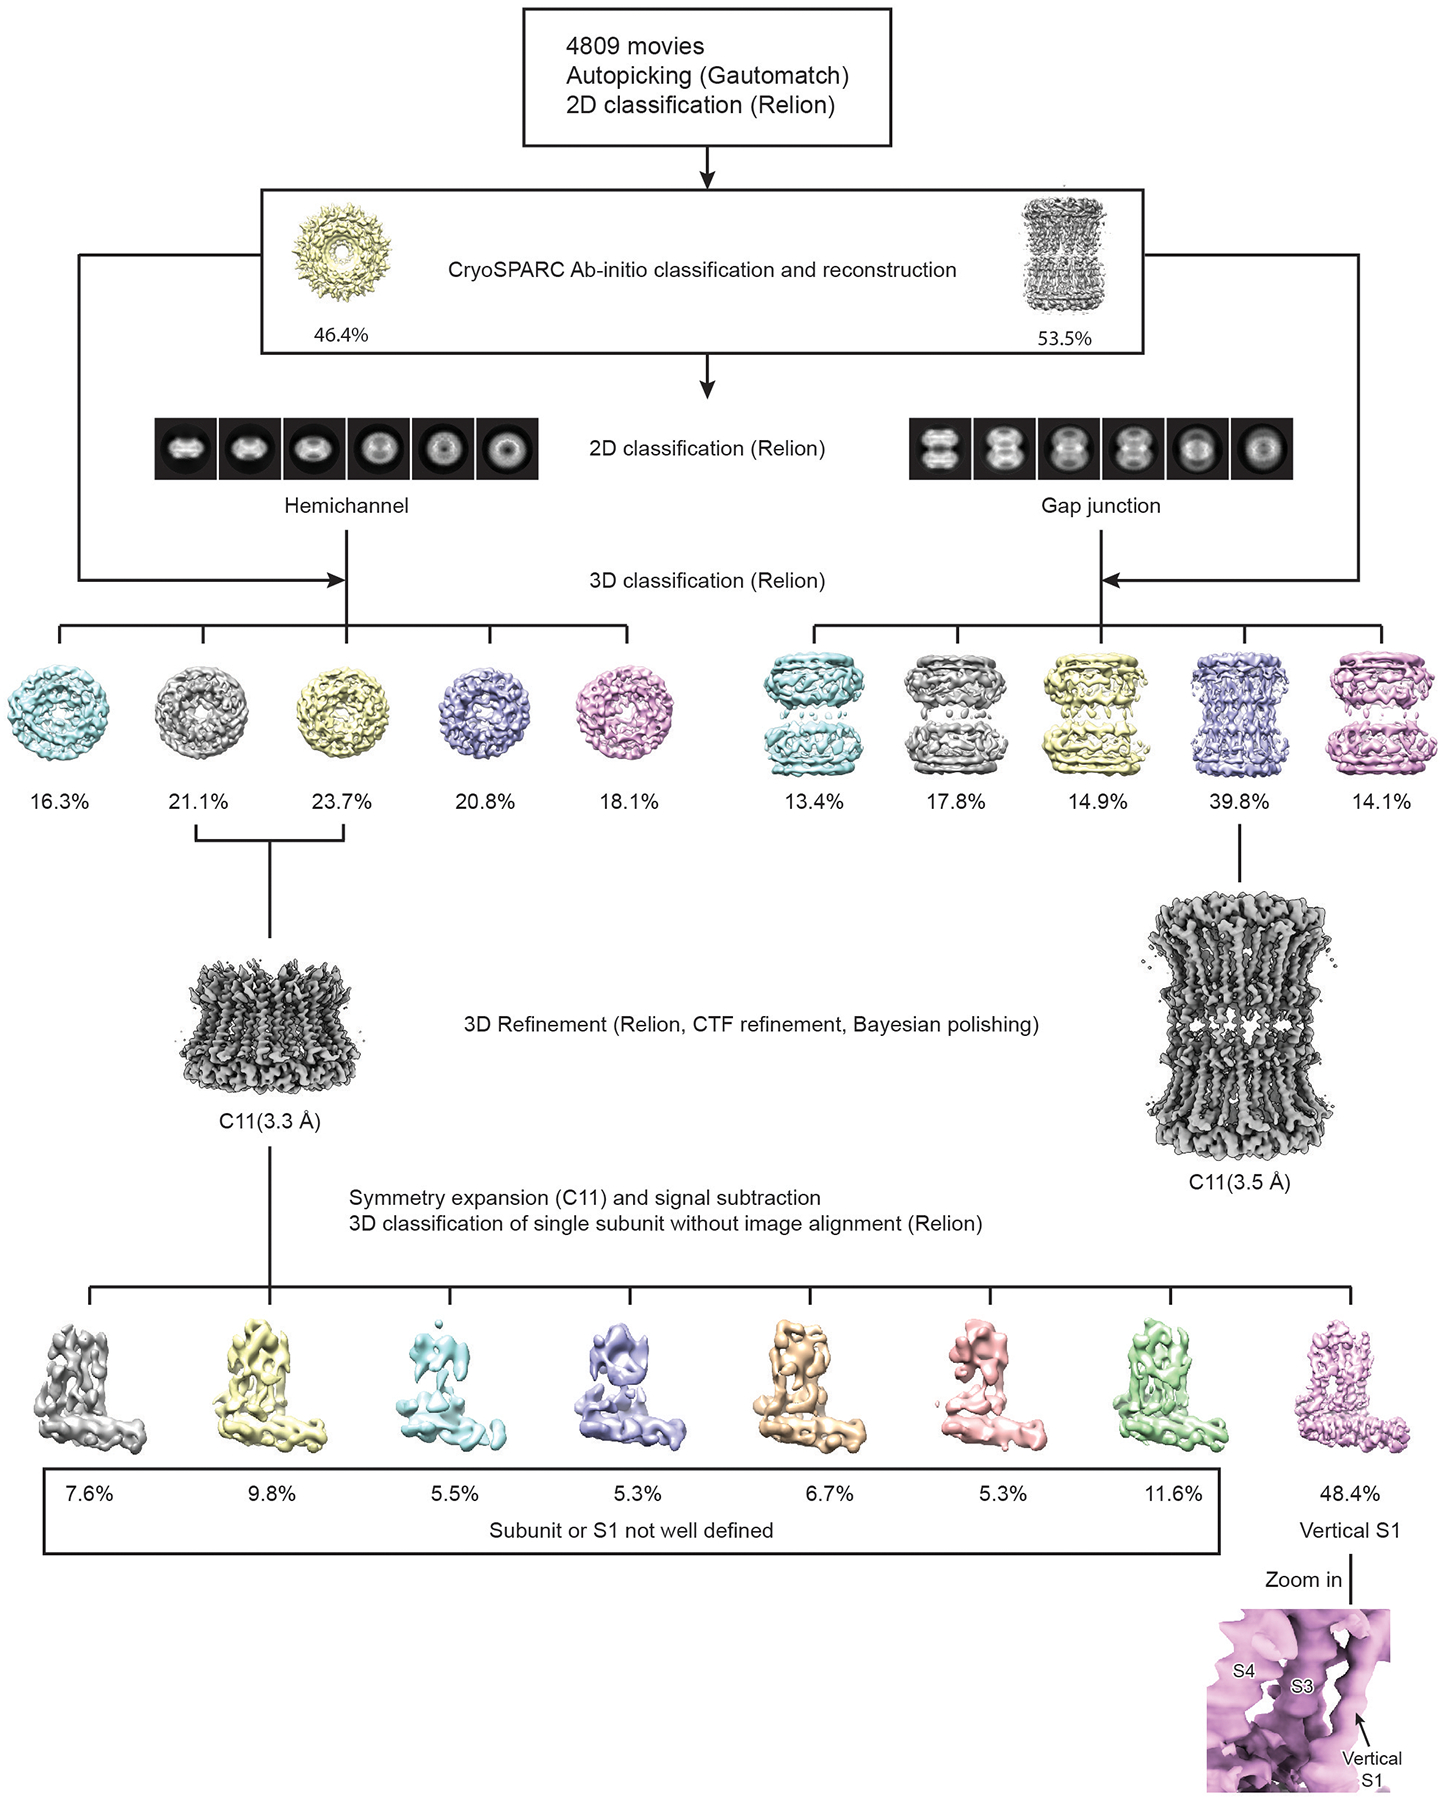
A total of 4,809 movies was collected using a Titan Krios equipped with K2. Particles were autopicked using Gautomatch, and visually examined in RELION to eradicate false-positive selections. After manual clean-up, particles were subjected to two rounds of 2D classification in RELION. Ab initio reconstruction with two classes was performed in CryoSPARC to separate hemichannel and gap-junction particles, and to generate initial models of the hemichannel and gap junction. Hemichannel and gap-junction particles were further cleaned up using 2D and 3D classification in RELION. Particles from 3D classes that showed high-resolution features and obvious C11 symmetry were combined and refined in RELION. To assess the structural heterogeneity of the helix S1, an approach that combined symmetry expansion and signal subtraction was carried out, in which all the subunits were subtracted and classified without image alignment in RELION.
Extended Data Fig. 4 |. The workflow of cryo-EM data processing for RUR–CALHM2.
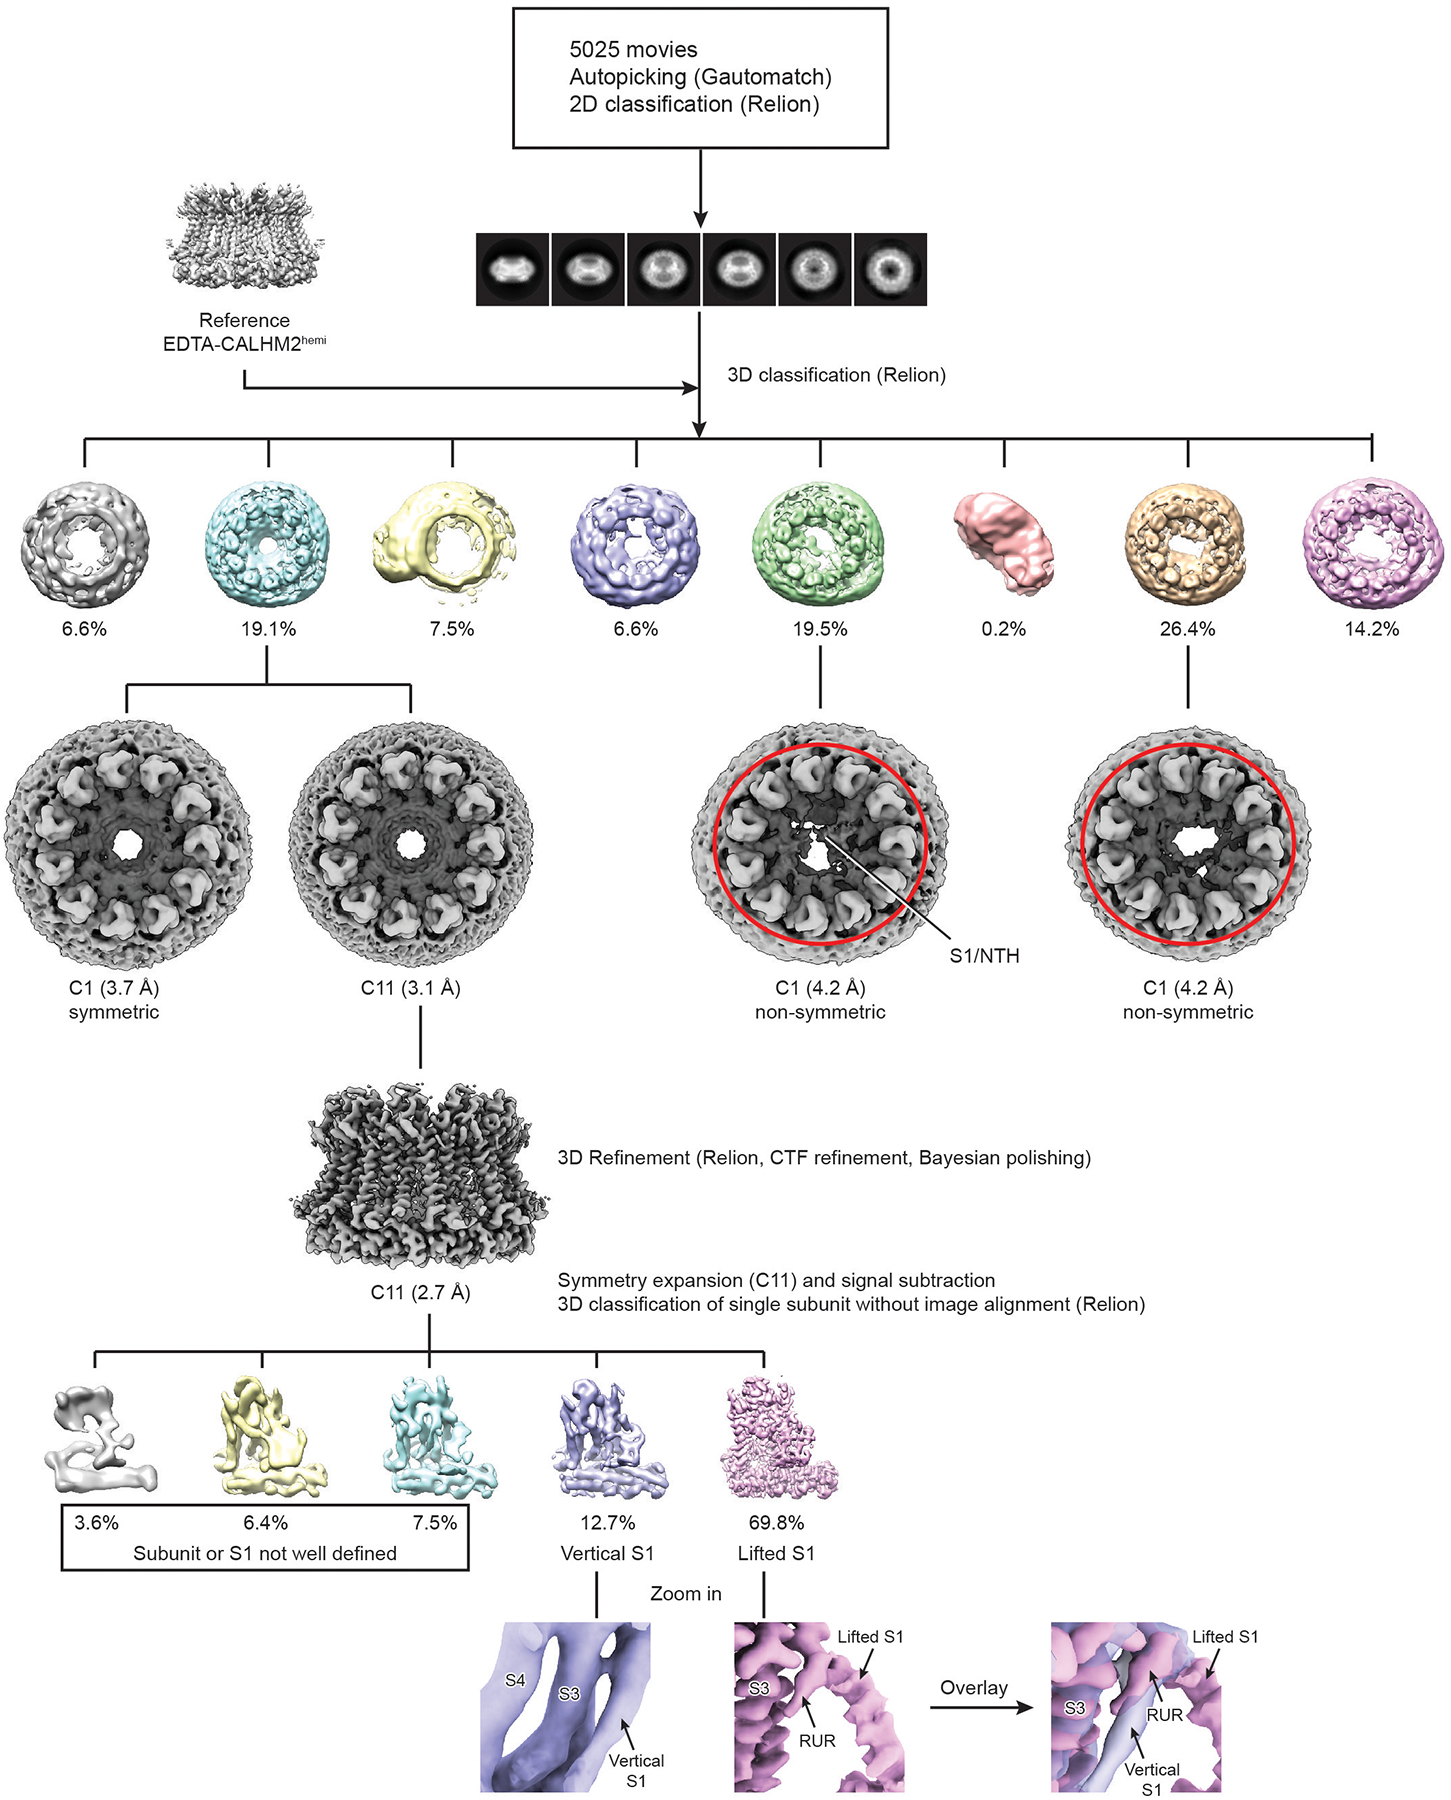
A total of 5,025 movies was collected using a Titan Krios equipped with K2. Particles were autopicked using Gautomatch, and visually examined in RELION to eradicate false-positive selections. After manual clean-up, particles were subjected to two rounds of 2D classification in RELION. Three-dimensional classification using the map of EDTA–CALHM2hemi as an initial model yielded three classes with high-resolution features. Particles from the three classes were refined without applying symmetry, and particles from the class that showed obvious C11 symmetry were further refined using C11 symmetry. The two non-symmetric classes are highlighted by the red ellipses. The densities of the S1 helix and NTH that extend to the pore centre in one of the non-symmetric class are labelled. To assess the structural heterogeneity of helix S1, an approach that combined symmetry expansion and signal subtraction was carried out, in which all the subunits were subtracted and classified without image alignment in RELION.
Extended Data Fig. 5 |. Cryo-EM analysis of human CALHM2.
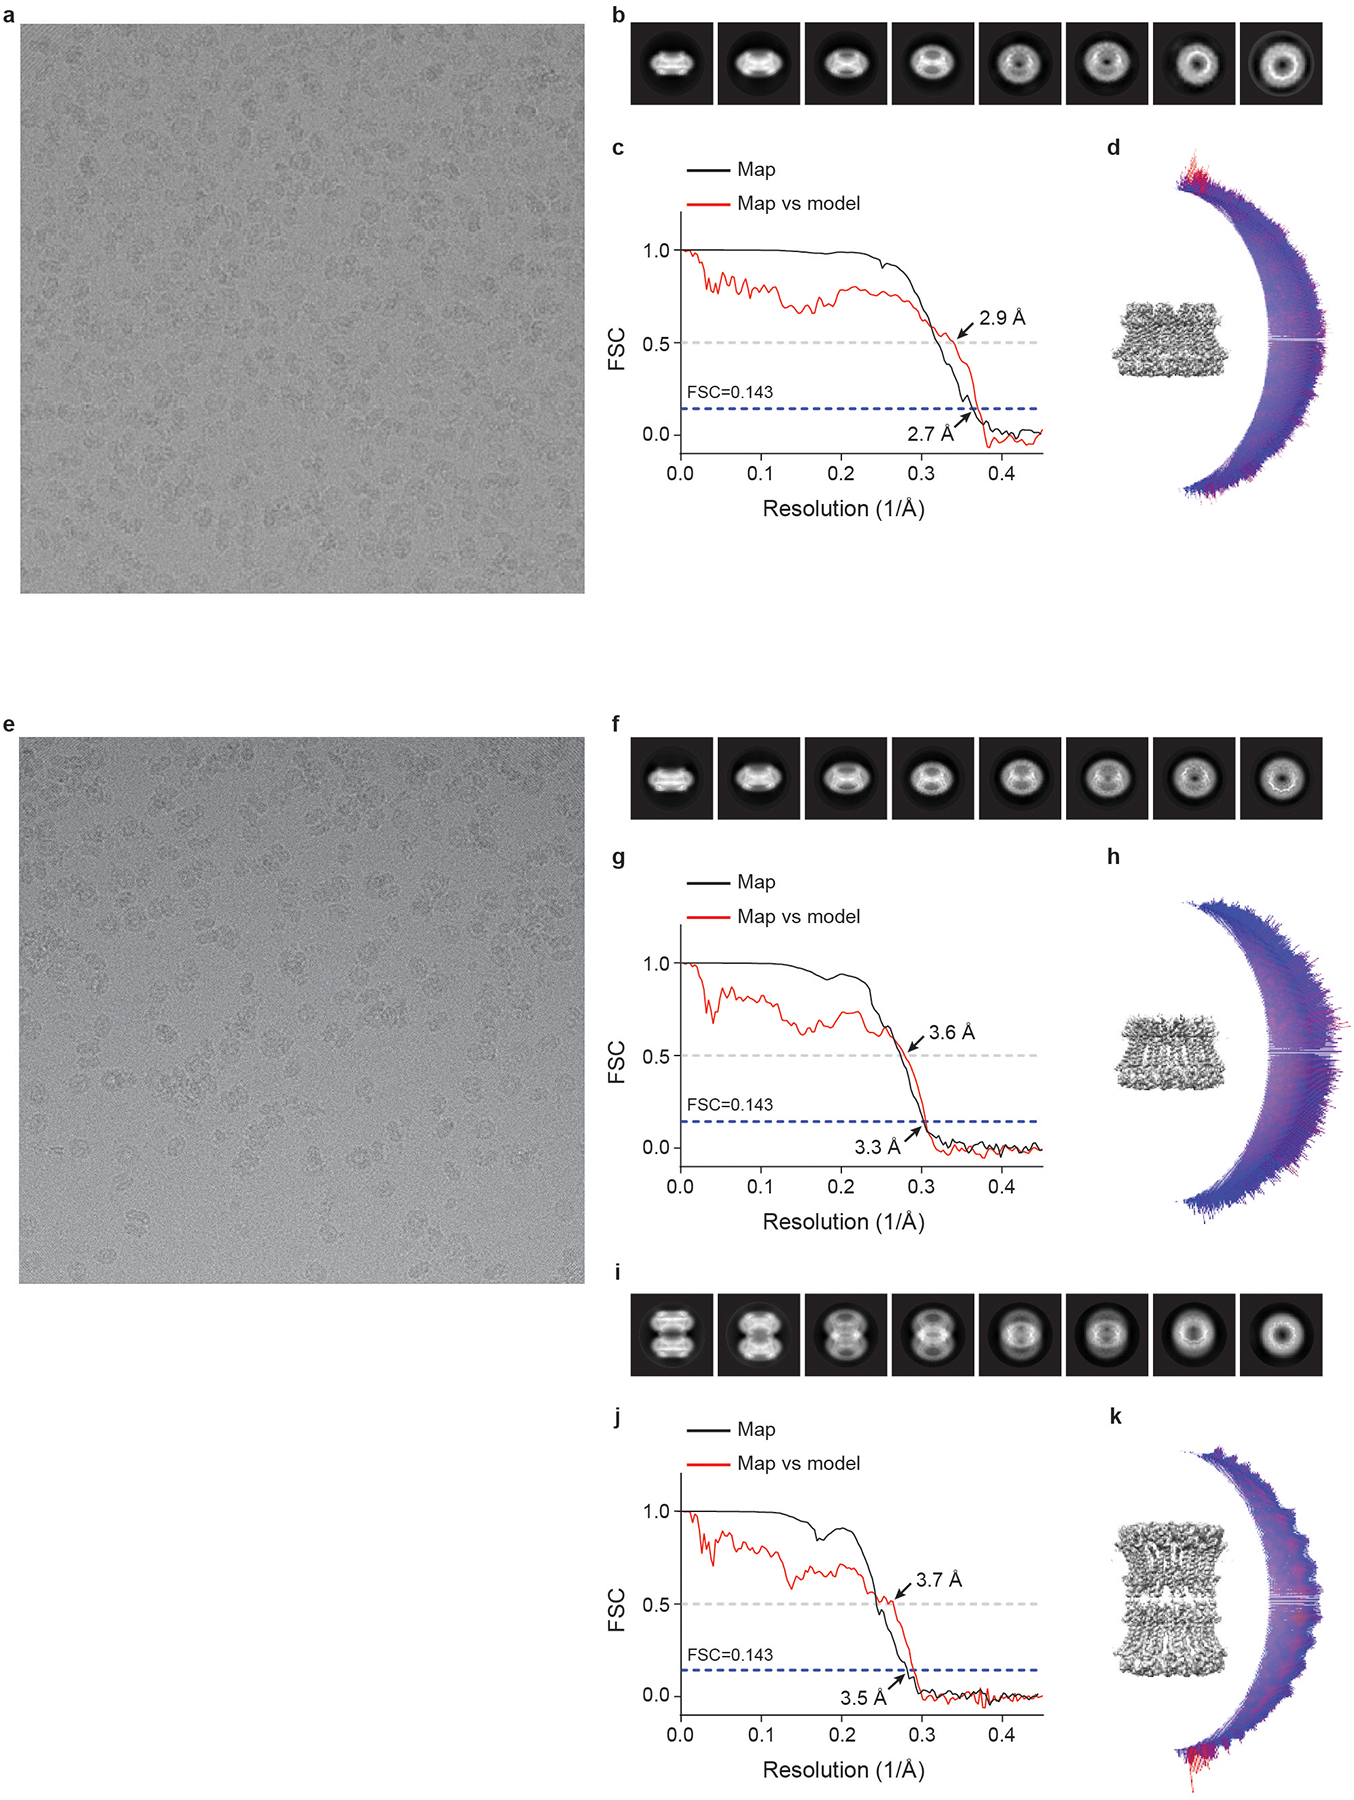
a, e, Representative electron micrograph of RUR–CALHM2 (a, out of 5,025 micrographs) and EDTA–CALHM2 (e, out of 4,809 micrographs). b, f, i, Selected 2D class averages of the electron micrographs of RUR–CALHM2 (b), EDTA–CALHM2hemi (f) and EDTA–CALHM2gap (i). c, g, j, The gold-standard Fourier shell correlation curves for the electron microscopy maps of RUR–CALHM2 (c), EDTA–CALHM2hemi (g) and EDTA–CALHM2gap (j) are shown in black, and the Fourier shell correlation curves between the atomic model and the final electron microscopy map are shown in red. d, h, k, The angular distribution of particles used for the refinement of RUR–CALHM2 (d), EDTA–CALHM2hemi (h) and EDTA–CALHM2gap (k).
Extended Data Fig. 6 |. Representative densities of the reconstructions of RUR–CALHM2, EDTA–CALHM2hemi and EDTA–CALHM2gap.
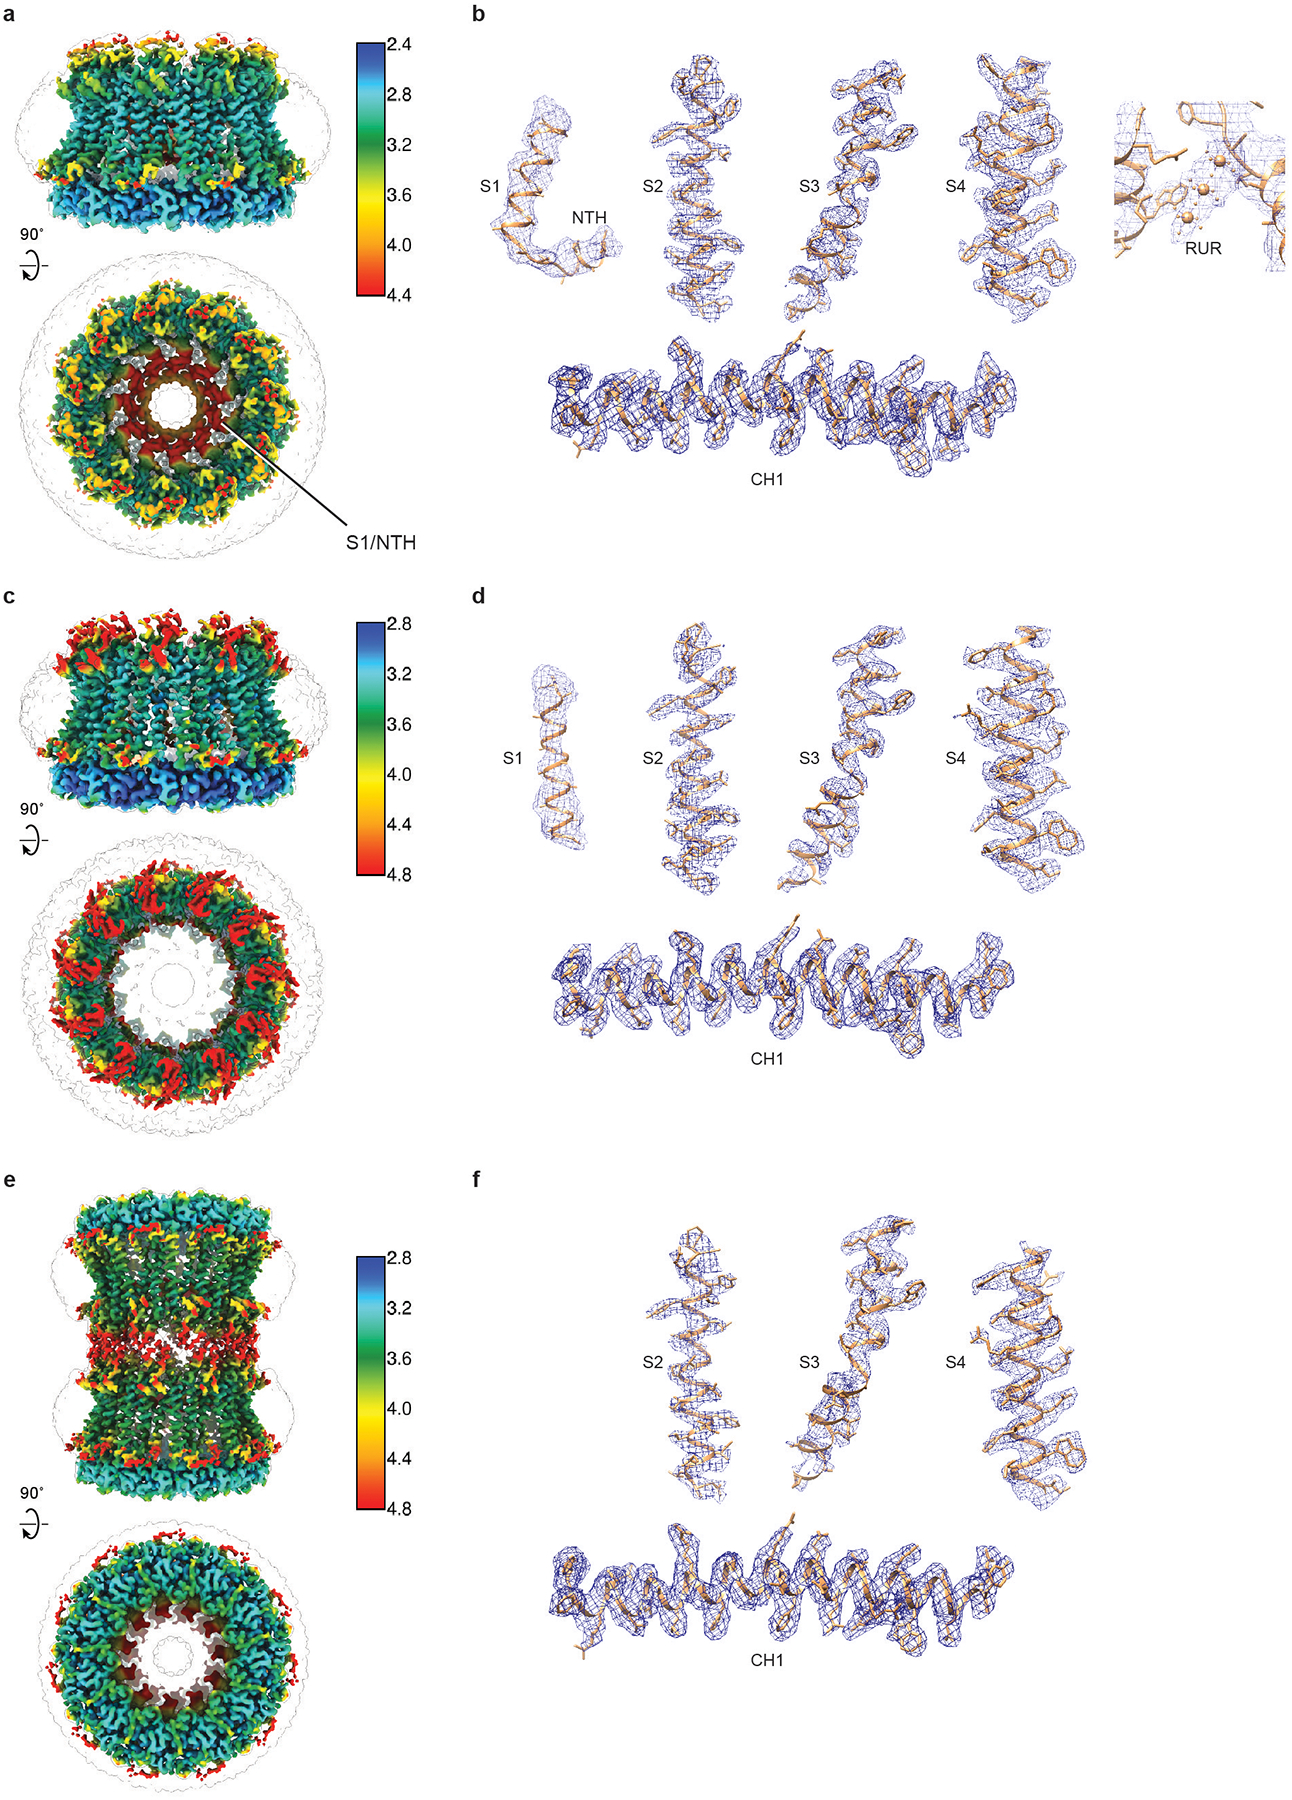
a, c, e, Local-resolution estimation of the structure of RUR–CALHM2 (a), EDTA–CALHM2hemi (c) and EDTA–CALHM2gap (e), calculated using Bsoft46. b, d, f, Representative densities of RUR–CALHM2 (b), EDTA–CALHM2hemi (d) and EDTA–CALHM2gap (f). The putative RUR-binding site density is shown in the panel on the right in b.
Extended Data Fig. 7 |. Comparison of EDTA–CALHM2hemi and EDTA–CALHM2gap with the connexin-46 gap junction, innexin-6 gap junction and a VRAC.
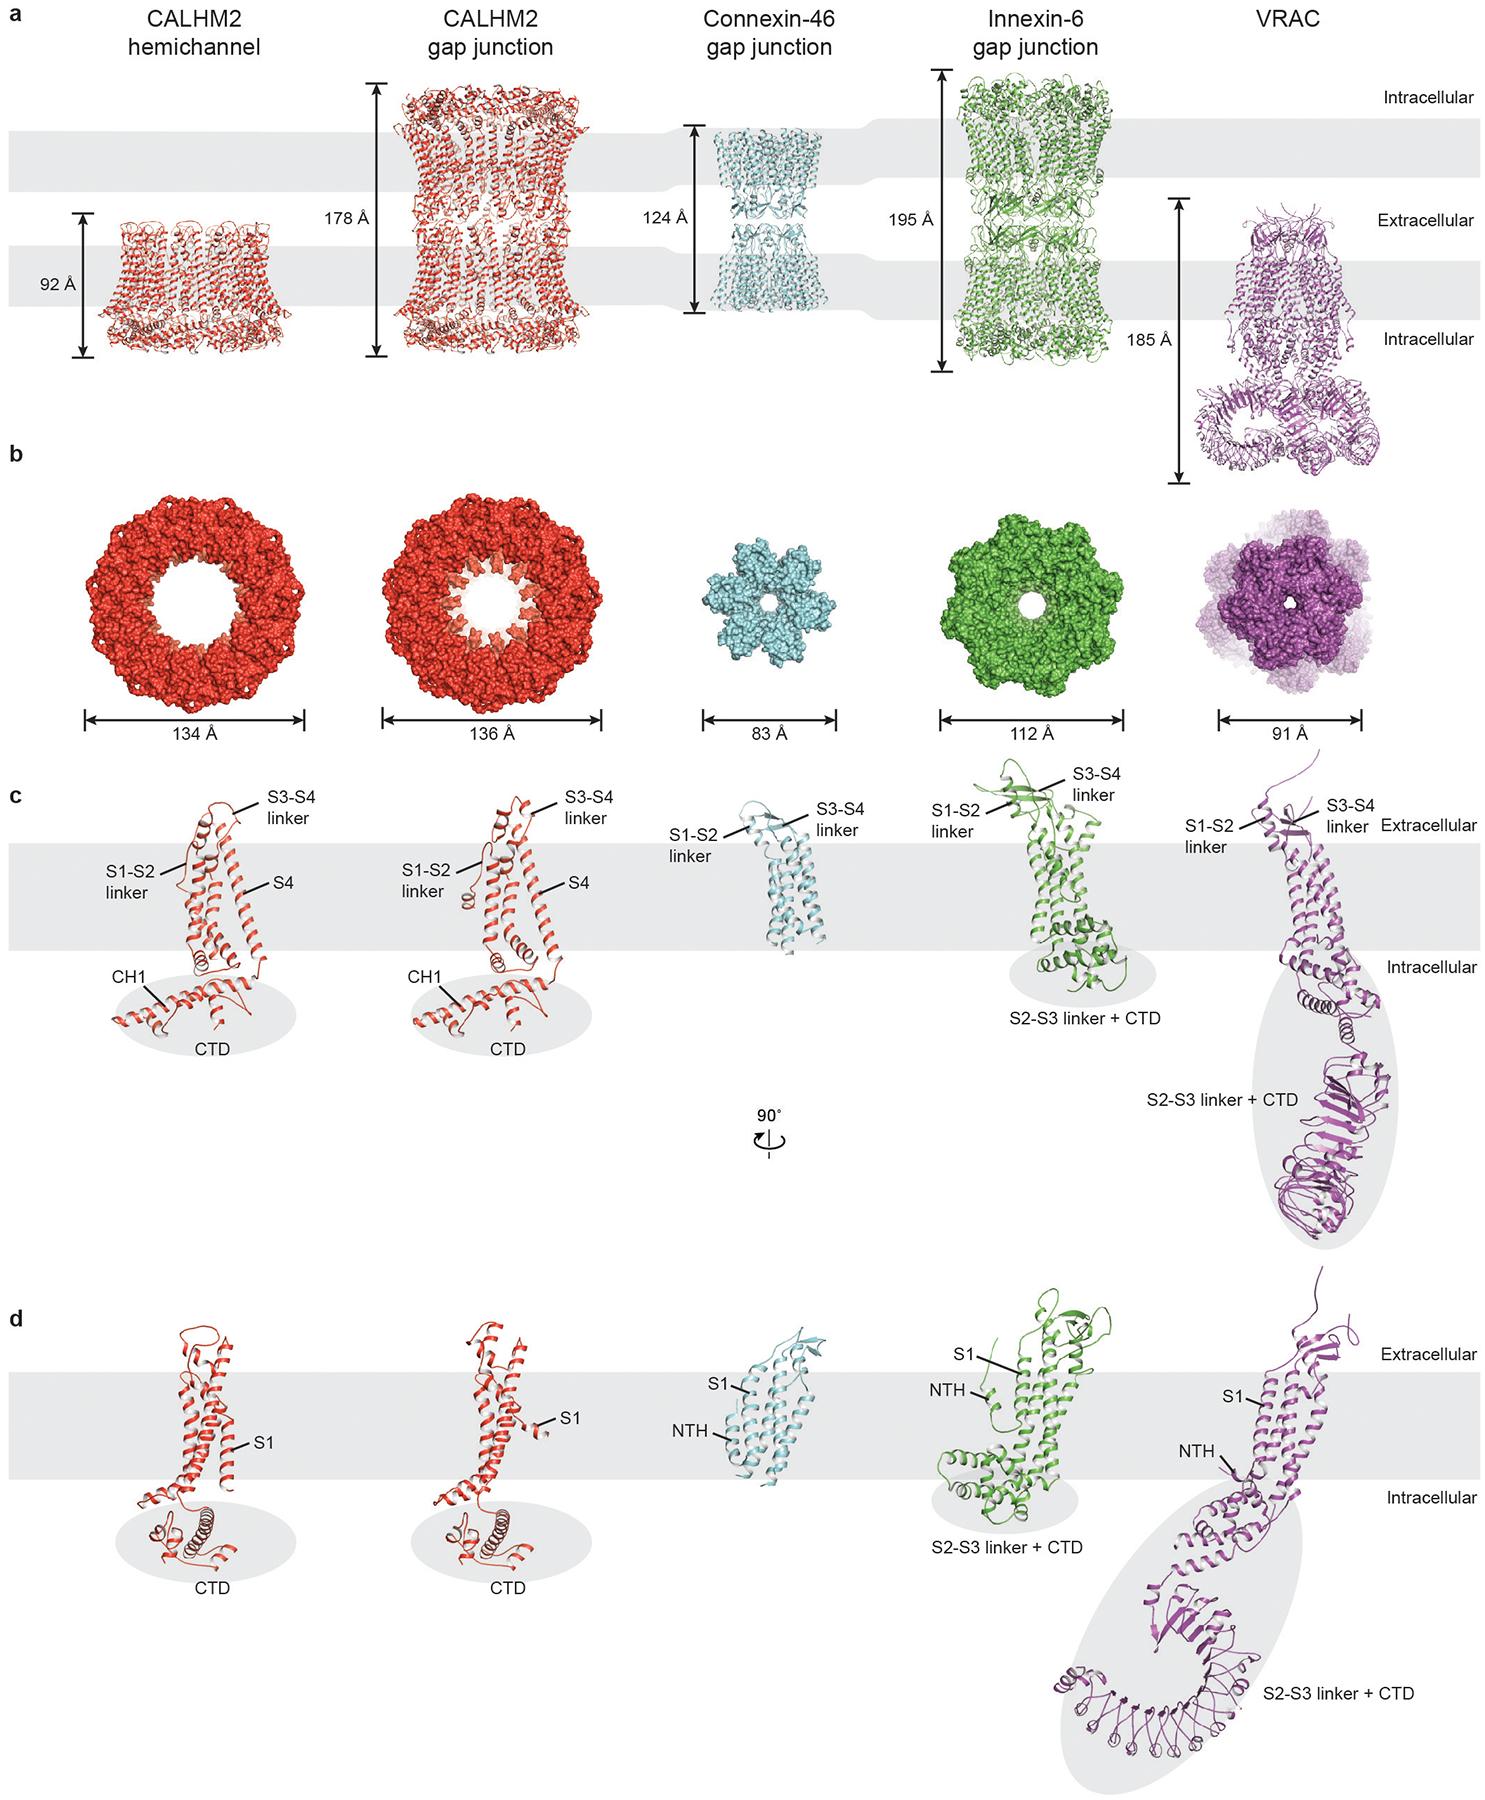
a, b, Overall structure comparison viewed parallel to the membrane (a, cartoon representation) and viewed from the intracellular side (b, surface representation), showing notable differences in symmetry, size and shape. The VRAC in b is viewed from the extracellular side. The size of the VRAC in b represents the largest diameter of the transmembrane domain. c, d, Single-subunit comparison in two different views viewed parallel to the membrane. The intracellular domains are highlighted using grey ellipses, and the grey rectangles represent cell membranes. The buried surface area in each pair of protomers in the CALHM2 gap junction is 378 Å2 (4,161 Å2 for an undecamer), which is substantially smaller than the equivalent buried surface area in connexin (94 Å2; or 5,654 Å2 for a hexamer) and innexin (1,550 Å2; or 12,397 Å2 for an octamer).
Extended Data Fig. 8 |. Secondary structure arrangement and domain organization of the human CALHM2, and sequence alignment of the human CALHM family.
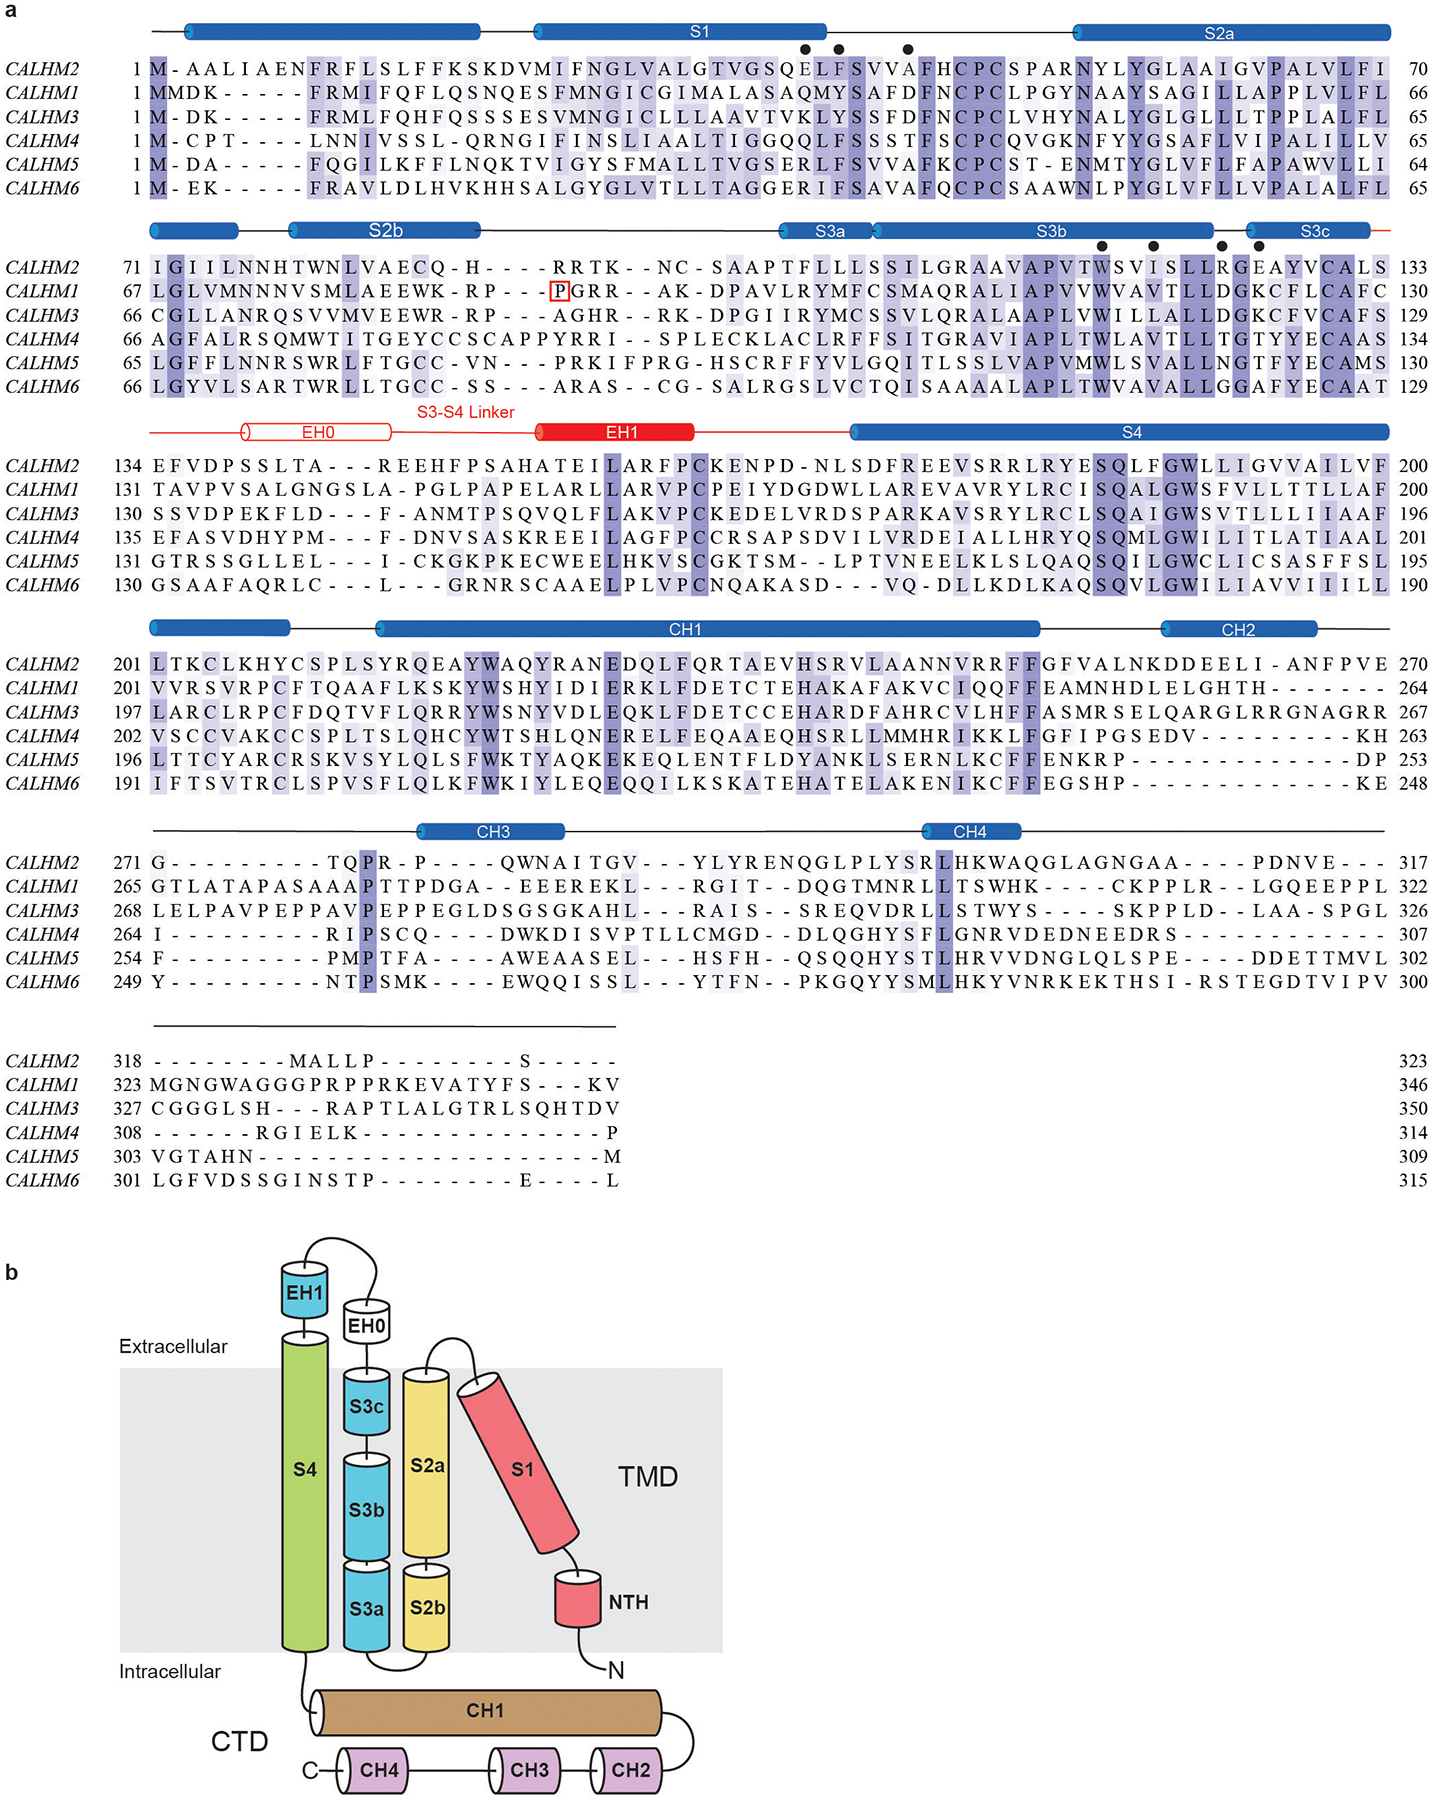
a, The secondary structure prediction of human CALHM2, and sequence alignment of CALHM family members CALHM1, CALHM2, CALHM3, CALHM4, CALHM5 and CALHM6. Secondary structure prediction was performed using the JPred online server47. Sequences were aligned using the Clustal Omega program and coloured using BLOSUM62 by conservation. Residues involved in RUR binding are marked with black filled circles. The extracellular helix (EH) 0 in the S3–S4 linker is formed upon the docking of two hemichannels. P86 in human CALHM1 is boxed in red. b, Domain organization of the human CALHM2 protomer.
Extended Data Fig. 9 |. The role of NTH in inhibition by RUR.
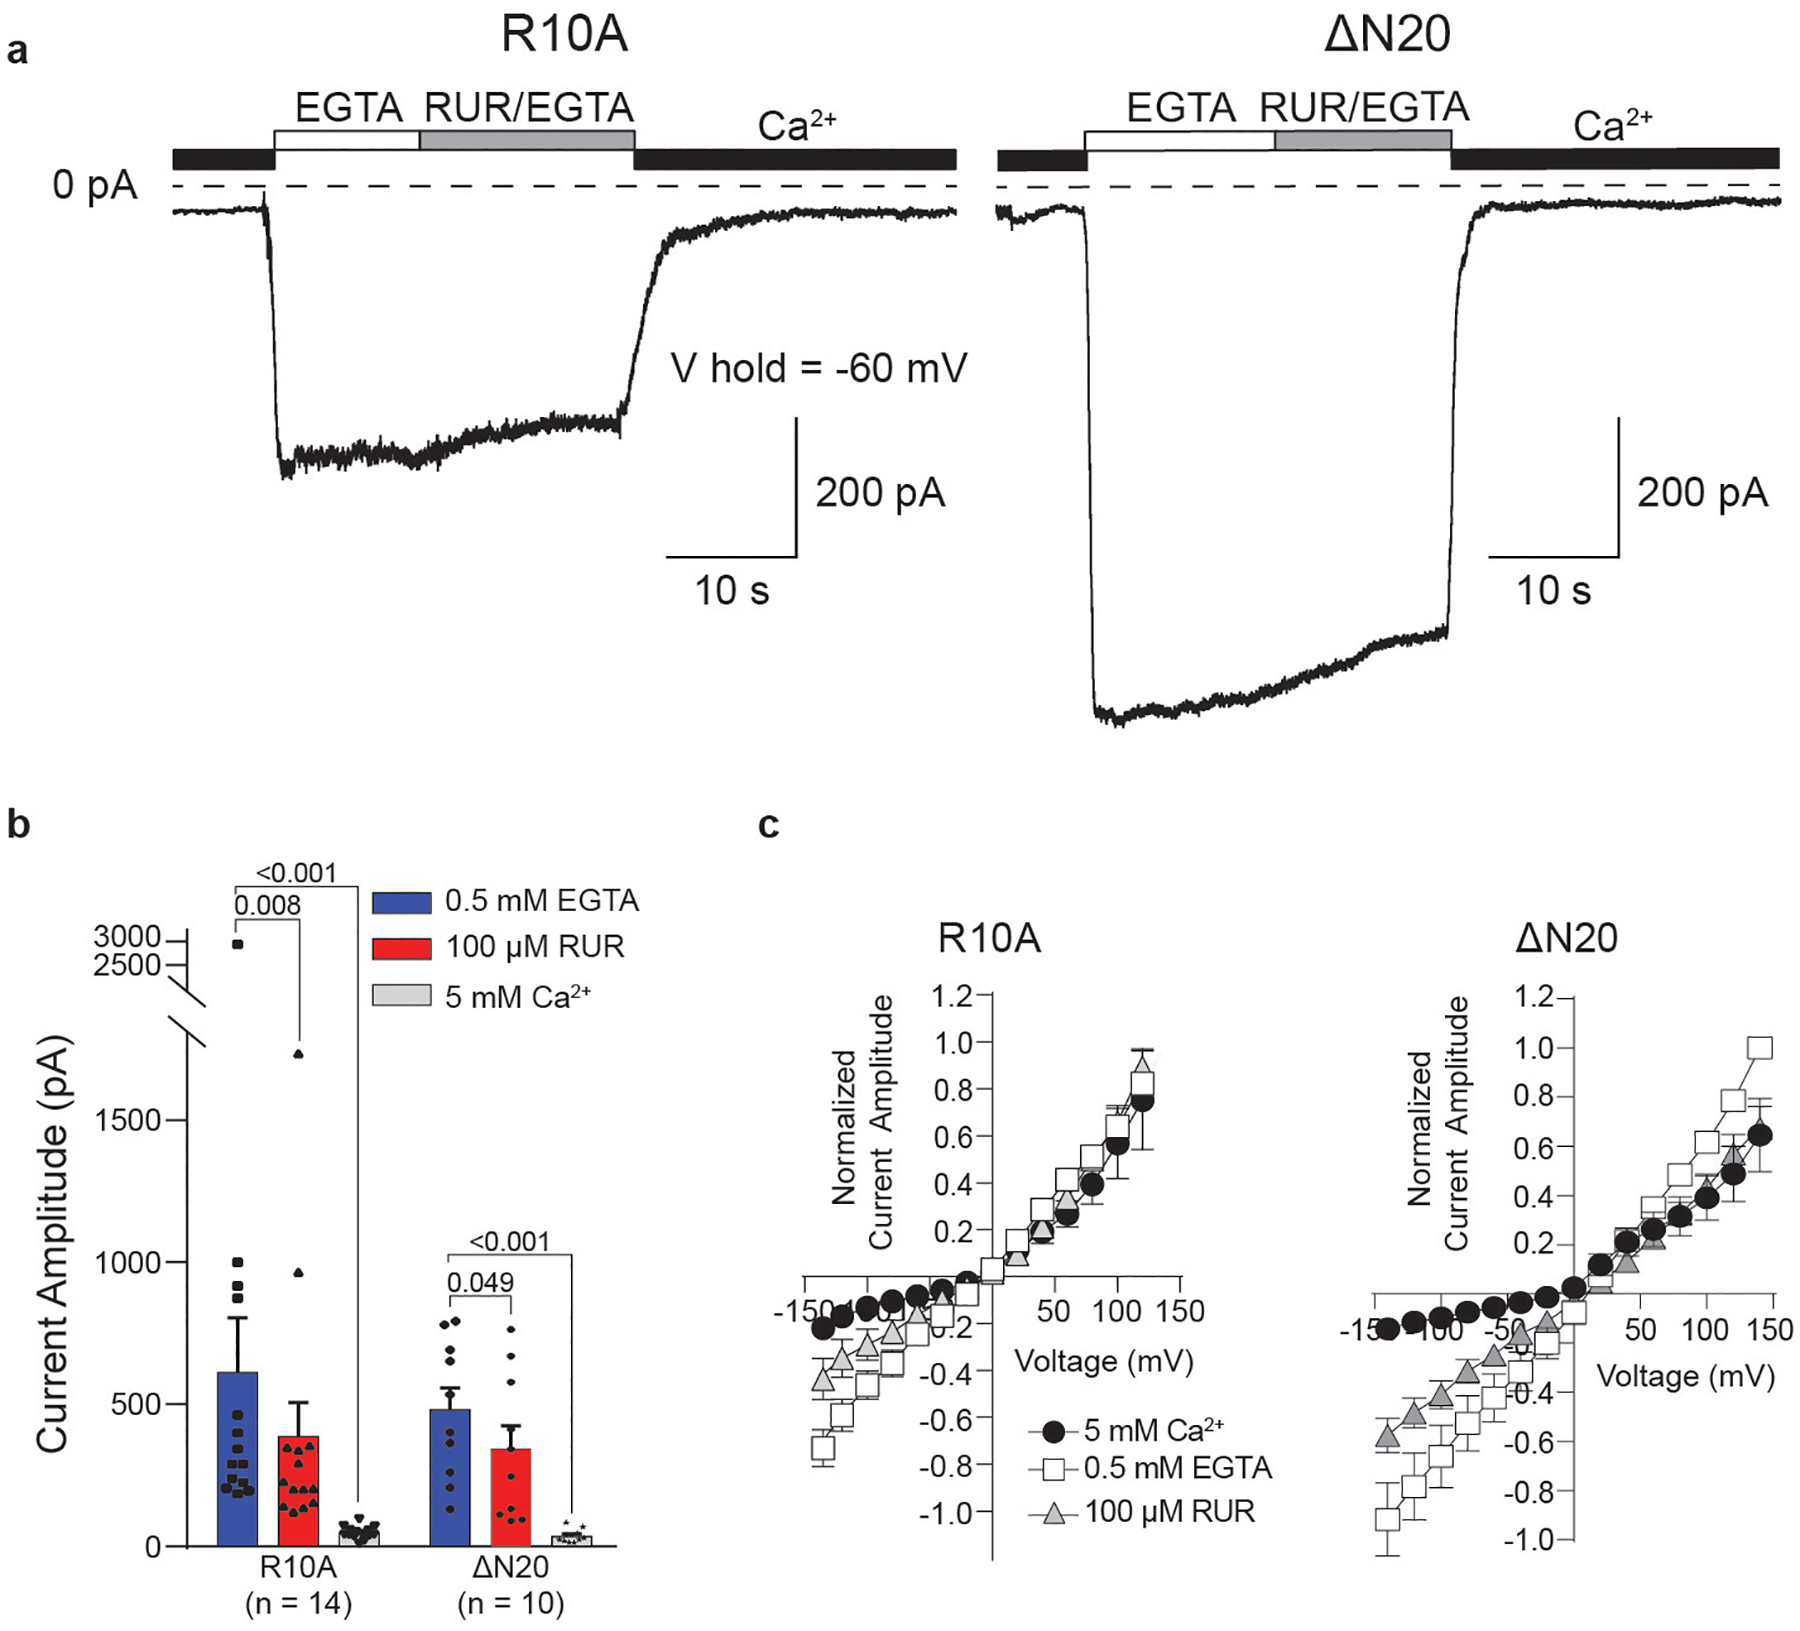
a, Representative current traces recorded in whole-cell mode at −60 mV in cells expressing CALHM2(R10A) or CALHM2(ΔN20). Human CALHM2 has three positively charged and two negatively charged residues in the NTH, resulting in one net positive charge. Out of these charged residues, R10 is the only residue that is conserved across CALHM1, CALHM2 and CALHM3. Cells were switched from bath buffer that contained 5 mM Ca2+ to one that contained 0.5 mM EGTA (0 mM Ca2+) to induce current. Current was inhibited using a buffer that contained 100 μM RUR and 0.5 mM EGTA. n = 14 or 10 biologically independent experiments were performed for CALHM2(R10A) or CALHM2(ΔN20), respectively. b, Quantification of current amplitude in 0.5 mM EGTA, 100 μM RUR and 0.5 mM EGTA, and 5 mM Ca2+ conditions for cells expressing CALHM2(R10A) or CALHM2(ΔN20), from a. Two-tailed paired t-tests were applied to calculate P values for comparisons using GraphPad Prism 7. Graphs are mean ± s.e.m. Each dot indicates the value of one single independent experiment. c, Current–voltage relationships were obtained by applying 500-ms voltage pulses that ranged from 140 to −140 mV from a holding potential of 0 mV (20-mV steps) to cells that express CALHM2(R10A) or CALHM2(ΔN20). Currents were recorded in the presence of 5 mM Ca2+, 0.5 mM EGTA and 100 μM RUR. Data were normalized to the amplitude of the current recorded in the presence of EGTA at 140 mV, and calculated as mean ± s.e.m. n = 7 biologically independent experiments were performed each for CALHM2(R10A) and CALHM2(ΔN20).
Extended Data Fig. 10 |. The CALHM2 gap junction.
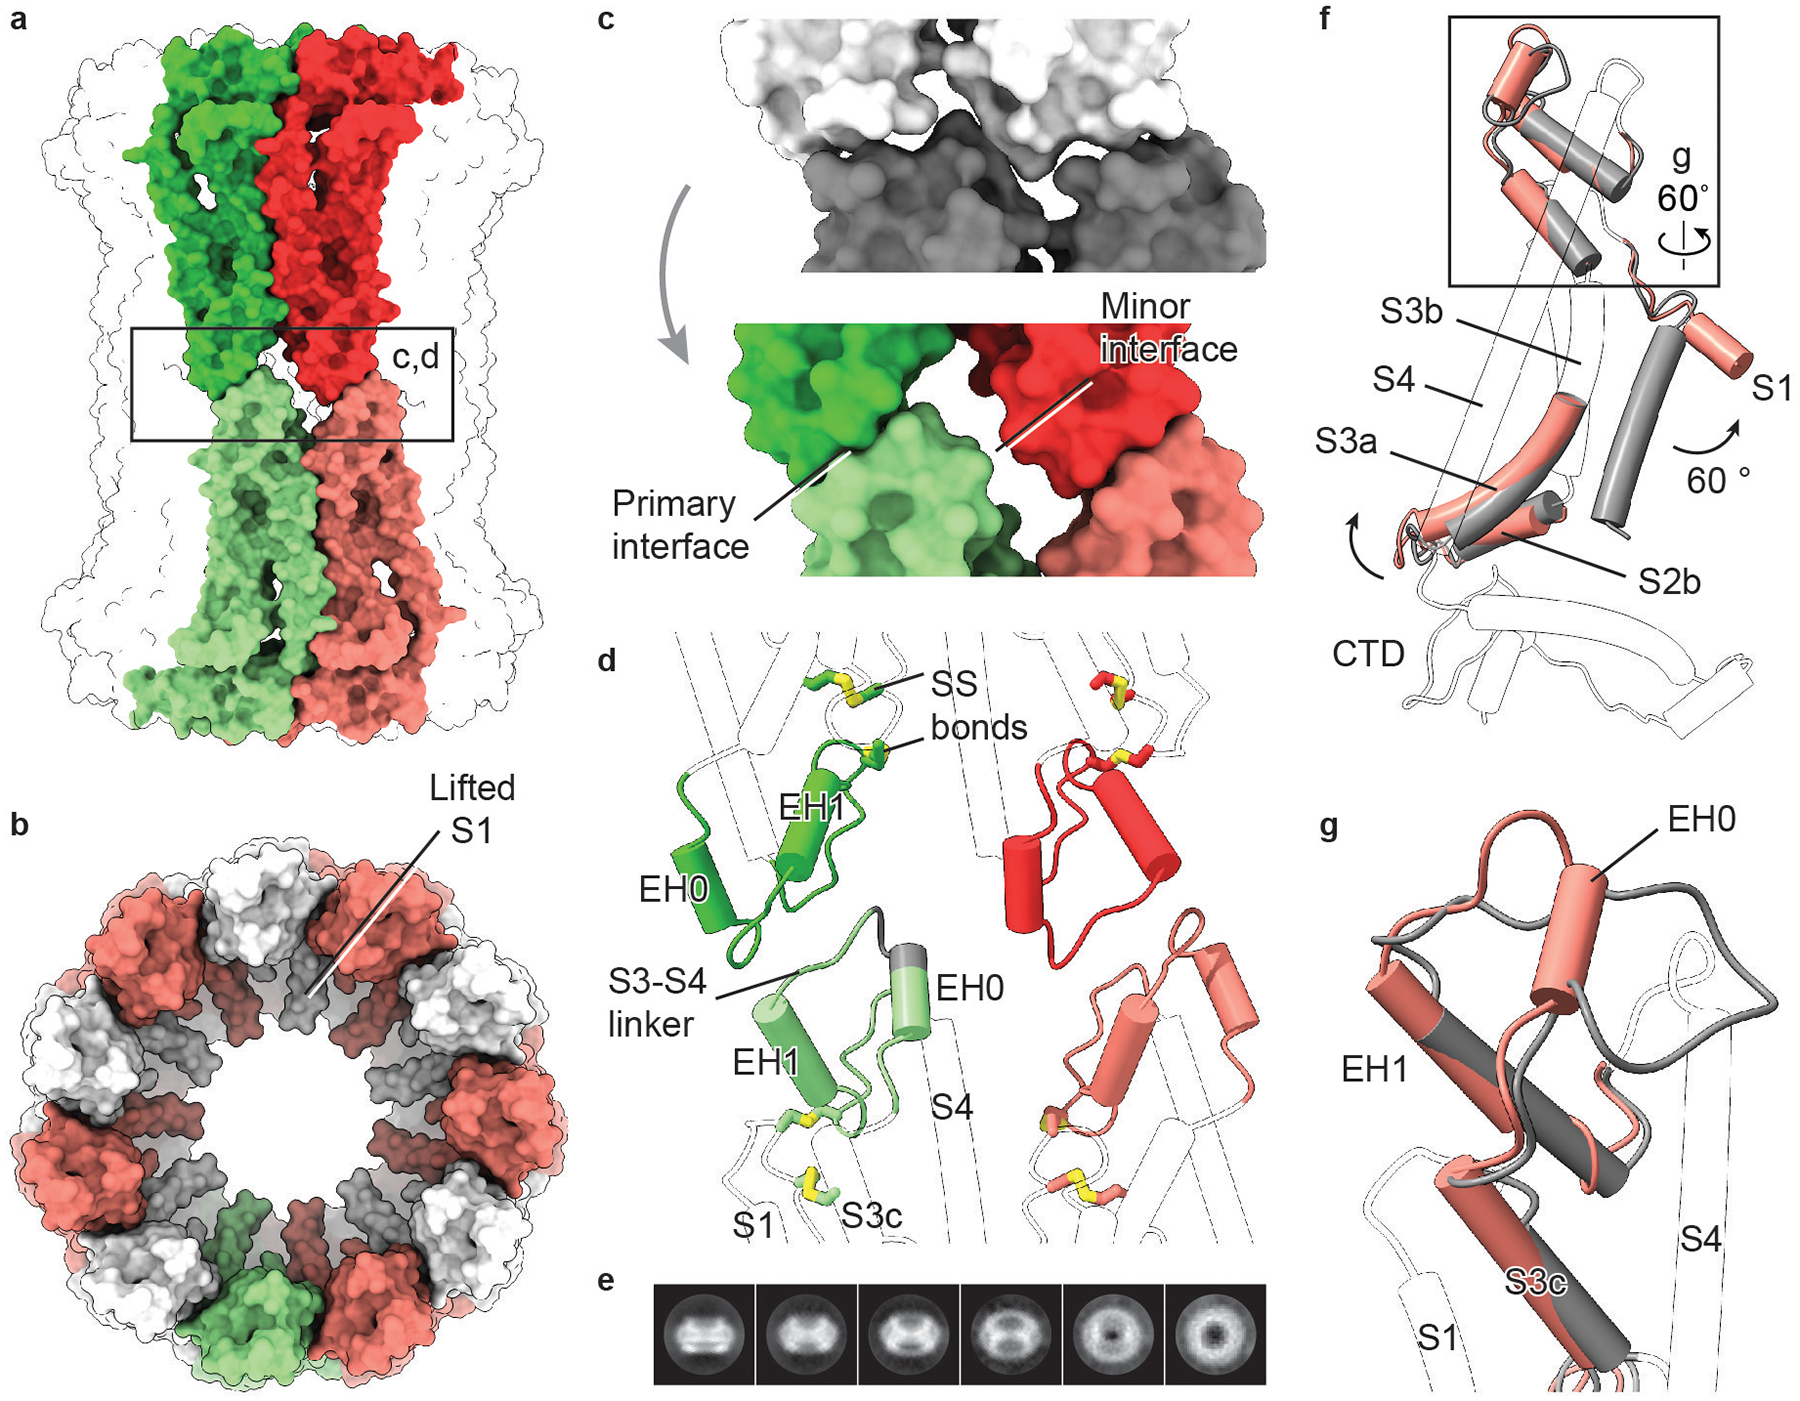
a, Surface representation of a gap junction viewed parallel to the membrane. Two paired subunits are highlighted. b, Surface representation of a hemichannel in the gap junction, viewed from extracellular side. c, Interface remodelling when docking two hemichannels (shown in grey; top) into a gap junction (shown in colour; bottom). d, Cartoon representation of the interface between two hemichannels. The two disulfide bonds are shown. The grey segment of S3–S4 linker represents deleted residues in a mutant (CALHM2(Δ143–146)). Only parts involved in the docking of hemichannels and disulfide bonds are highlighted in colour. e, Selected 2D class averages of CALHM2(Δ143–146). This mutant yielded only hemichannels, and not gap junctions. f, Superimposition of single subunits of EDTA–CALHM2hemi (grey) and EDTA–CALHM2gap (pink) using the CTD. Only parts with conformational changes are highlighted in colour. To understand the conformational changes upon docking, we compared single subunits of a hemichannel and a gap junction. In the hemichannel, the loop connecting segment S3c and EH1 in the S3–S4 linker is flat and lacks extensive contact with the rest of the protein, giving rise to a flexible area that is probably required for the initiation of docking. Indeed, the S3–S4 linker is defined better in RUR–CALHM2 than in EDTA–CALHM2hemi, by forming interactions with the adjacent subunit. We suggest that the restricted S3–S4 linker in the RUR–CALHM2 hinders the docking of the hemichannels. g, Enlargement of the box in f, showing the remodelling of the S3–S4 linker from EDTA–CALHM2hemi (grey) to EDTA–CALHM2gap (pink). Upon docking, the S3c–EH1 loop remodels into two short loops and a short α helix (EH0); the EH0–EH1 loop forms the primary interface and EH0 forms the minor interface in d. This motion accompanies an elevation of the S3–S4 linker and segment S3c that leads to an outward flexing of S3a, which breaks the loose interface between S3a and helix S1 in f. As a consequence, the S1 helix is detached from S3 and moves into a lifted conformation. The conformational changes of TMD upon docking in EDTA–CALHM2 are notably consistent with those induced by RUR. Moreover, the two docked hemichannels in the gap junction have similar conformations of their S1 helices.
Supplementary Material
Acknowledgements
We thank G. Zhao and X. Meng for the support with data collection at the David Van Andel Advanced Cryo-Electron Microscopy Suite; the HPC team of VARI for computational support; D. Nadziejka for technical editing and E. Haley for proofreading. J.D. is supported by a McKnight Scholar Award, a Klingenstein-Simon Scholar Award and the National Institutes of Health (NIH) (grant R01NS111031).
Footnotes
Competing interests: The authors declare no competing interests.
Online content Any methods, additional references, Nature Research reporting summaries, source data, extended data, supplementary information, acknowledgements, peer review information; details of author contributions and competing interests; and statements of data and code availability are available at https://doi.org/10.1038/s41586-019-1781-3
Supplementary information is available for this paper at https://doi.org/10.1038/s41586-019-1781-3
Peer review information Nature thanks Kenton Swartz and the other, anonymous, reviewer(s) for their contribution to the peer review of this work.
References
- 1.Dreses-Werringloer U et al. A polymorphism in CALHM1 influences Ca2+ homeostasis, Aβ levels, and Alzheimer’s disease risk. Cell 133, 1149–1161 (2008). [DOI] [PMC free article] [PubMed] [Google Scholar]
- 2.Ma Z et al. Calcium homeostasis modulator 1 (CALHM1) is the pore-forming subunit of an ion channel that mediates extracellular Ca2+ regulation of neuronal excitability. Proc. Natl Acad. Sci. USA 109, E1963–E1971 (2012). [DOI] [PMC free article] [PubMed] [Google Scholar]
- 3.Taruno A et al. CALHM1 ion channel mediates purinergic neurotransmission of sweet, bitter and umami tastes. Nature 495, 223–226 (2013). [DOI] [PMC free article] [PubMed] [Google Scholar]
- 4.Maeda S et al. Structure of the connexin 26 gap junction channel at 3.5 Å resolution. Nature 458, 597–602 (2009). [DOI] [PubMed] [Google Scholar]
- 5.Deneka D, Sawicka M, Lam AKM, Paulino C & Dutzler R Structure of a volume-regulated anion channel of the LRRC8 family. Nature 558, 254–259 (2018). [DOI] [PubMed] [Google Scholar]
- 6.Kefauver JM et al. Structure of the human volume regulated anion channel. eLife 7, e38461 (2018). [DOI] [PMC free article] [PubMed] [Google Scholar]
- 7.Myers JB et al. Structure of native lens connexin 46/50 intercellular channels by cryo-EM. Nature 564, 372–377 (2018). [DOI] [PMC free article] [PubMed] [Google Scholar]
- 8.Oshima A, Tani K & Fujiyoshi Y Atomic structure of the innexin-6 gap junction channel determined by cryo-EM. Nat. Commun 7, 13681 (2016). [DOI] [PMC free article] [PubMed] [Google Scholar]
- 9.Abbracchio MP, Burnstock G, Verkhratsky A & Zimmermann H Purinergic signalling in the nervous system: an overview. Trends Neurosci 32, 19–29 (2009). [DOI] [PubMed] [Google Scholar]
- 10.Burnstock G Historical review: ATP as a neurotransmitter. Trends Pharmacol. Sci 27, 166–176 (2006). [DOI] [PubMed] [Google Scholar]
- 11.Ma Z et al. CALHM3 is essential for rapid ion channel-mediated purinergic neurotransmission of GPCR-mediated tastes. Neuron 98, 547–561 (2018). [DOI] [PMC free article] [PubMed] [Google Scholar]
- 12.Ma Z, Tanis JE, Taruno A & Foskett JK Calcium homeostasis modulator (CALHM) ion channels. Pflugers Arch 468, 395–403 (2016). [DOI] [PMC free article] [PubMed] [Google Scholar]
- 13.Ma Z, Saung WT & Foskett JK Action potentials and ion conductances in wild-type and CALHM1-knockout type II taste cells. J. Neurophysiol 117, 1865–1876 (2017). [DOI] [PMC free article] [PubMed] [Google Scholar]
- 14.Siebert AP et al. Structural and functional similarities of calcium homeostasis modulator 1 (CALHM1) ion channel with connexins, pannexins, and innexins. J. Biol. Chem 288, 6140–6153 (2013). [DOI] [PMC free article] [PubMed] [Google Scholar]
- 15.Dreses-Werringloer U et al. CALHM1 controls the Ca2+-dependent MEK, ERK, RSK and MSK signaling cascade in neurons. J. Cell Sci 126, 1199–1206 (2013). [DOI] [PMC free article] [PubMed] [Google Scholar]
- 16.Vingtdeux V et al. CALHM1 ion channel elicits amyloid-β clearance by insulin-degrading enzyme in cell lines and in vivo in the mouse brain. J. Cell Sci 128, 2330–2338 (2015). [DOI] [PMC free article] [PubMed] [Google Scholar]
- 17.Cisneros-Mejorado A et al. Blockade and knock-out of CALHM1 channels attenuate ischemic brain damage. J. Cereb. Blood Flow Metab 38, 1060–1069 (2018). [DOI] [PMC free article] [PubMed] [Google Scholar]
- 18.Martinez-Palomo A, Braislovsky C & Bernhard W Ultrastructural modifications of the cell surface and intercellular contacts of some transformed cell strains. Cancer Res 29, 925–937 (1969). [PubMed] [Google Scholar]
- 19.Caterina MJ, Rosen TA, Tominaga M, Brake AJ & Julius D A capsaicin-receptor homologue with a high threshold for noxious heat. Nature 398, 436–441 (1999). [DOI] [PubMed] [Google Scholar]
- 20.Kirichok Y, Navarro B & Clapham DE Whole-cell patch-clamp measurements of spermatozoa reveal an alkaline-activated Ca2+ channel. Nature 439, 737–740 (2006). [DOI] [PubMed] [Google Scholar]
- 21.Peier AM et al. A heat-sensitive TRP channel expressed in keratinocytes. Science 296, 2046–2049 (2002). [DOI] [PubMed] [Google Scholar]
- 22.Bai XC, Rajendra E, Yang G, Shi Y & Scheres SH Sampling the conformational space of the catalytic subunit of human γ-secretase. eLife 4, e11182 (2015). [DOI] [PMC free article] [PubMed] [Google Scholar]
- 23.Foote CI, Zhou L, Zhu X & Nicholson BJ The pattern of disulfide linkages in the extracellular loop regions of connexin 32 suggests a model for the docking interface of gap junctions. J. Cell Biol 140, 1187–1197 (1998). [DOI] [PMC free article] [PubMed] [Google Scholar]
- 24.Purnick PE, Oh S, Abrams CK, Verselis VK & Bargiello TA Reversal of the gating polarity of gap junctions by negative charge substitutions in the N-terminus of connexin 32. Biophys. J 79, 2403–2415 (2000). [DOI] [PMC free article] [PubMed] [Google Scholar]
- 25.Verselis VK, Ginter CS & Bargiello TA Opposite voltage gating polarities of two closely related connexins. Nature 368, 348–351 (1994). [DOI] [PubMed] [Google Scholar]
- 26.Oh S, Rivkin S, Tang Q, Verselis VK & Bargiello TA Determinants of gating polarity of a connexin 32 hemichannel. Biophys. J 87, 912–928 (2004). [DOI] [PMC free article] [PubMed] [Google Scholar]
- 27.Oh S, Abrams CK, Verselis VK & Bargiello TA Stoichiometry of transjunctional voltage-gating polarity reversal by a negative charge substitution in the amino terminus of a connexin32 chimera. J. Gen. Physiol 116, 13–31 (2000). [DOI] [PMC free article] [PubMed] [Google Scholar]
- 28.Michalski K, Henze E, Nguyen P, Lynch P & Kawate T The weak voltage dependence of pannexin 1 channels can be tuned by N-terminal modifications. J. Gen. Physiol 150, 1758–1768 (2018). [DOI] [PMC free article] [PubMed] [Google Scholar]
- 29.Moreno-Ortega AJ, Ruiz-Nuño A, García AG & Cano-Abad MF Mitochondria sense with different kinetics the calcium entering into HeLa cells through calcium channels CALHM1 and mutated P86L-CALHM1. Biochem. Biophys. Res. Commun 391, 722–726 (2010). [DOI] [PubMed] [Google Scholar]
- 30.Goehring A et al. Screening and large-scale expression of membrane proteins in mammalian cells for structural studies. Nat. Protocols 9, 2574–2585 (2014 [DOI] [PMC free article] [PubMed] [Google Scholar]
- 31.Winkler PA, Huang Y, Sun W, Du J & Lü W Electron cryo-microscopy structure of a human TRPM4 channel. Nature 552, 200–204 (2017). [DOI] [PubMed] [Google Scholar]
- 32.Huang Y, Roth B, Lü W & Du J Ligand recognition and gating mechanism through three ligand-binding sites of human TRPM2 channel. eLife 8, e50175 (2019). [DOI] [PMC free article] [PubMed] [Google Scholar]
- 33.Fan C, Choi W, Sun W, Du J & Lü W Structure of the human lipid-gated cation channel TRPC3. eLife 7, e36852 (2018). [DOI] [PMC free article] [PubMed] [Google Scholar]
- 34.Huang Y, Winkler PA, Sun W, Lü W & Du J Architecture of the TRPM2 channel and its activation mechanism by ADP-ribose and calcium. Nature 562, 145–149 (2018). [DOI] [PubMed] [Google Scholar]
- 35.Haley E et al. Expression and purification of the human lipid-sensitive cation channel TRPC3 for structural determination by single-particle cryo-electron microscopy. J. Vis. Exp 143, e58754 (2018). [DOI] [PubMed] [Google Scholar]
- 36.Mastronarde DN Automated electron microscope tomography using robust prediction of specimen movements. J. Struct. Biol 152, 36–51 (2005). [DOI] [PubMed] [Google Scholar]
- 37.Zheng SQ et al. MotionCor2: anisotropic correction of beam-induced motion for improved cryo-electron microscopy. Nat. Methods 14, 331–332 (2017). [DOI] [PMC free article] [PubMed] [Google Scholar]
- 38.Zhang K Gctf: real-time CTF determination and correction. J. Struct. Biol 193, 1–12 (2016). [DOI] [PMC free article] [PubMed] [Google Scholar]
- 39.Scheres SH RELION: implementation of a Bayesian approach to cryo-EM structure determination. J. Struct. Biol 180, 519–530 (2012). [DOI] [PMC free article] [PubMed] [Google Scholar]
- 40.Punjani A, Rubinstein JL, Fleet DJ & Brubaker MA cryoSPARC: algorithms for rapid unsupervised cryo-EM structure determination. Nat. Methods 14, 290–296 (2017). [DOI] [PubMed] [Google Scholar]
- 41.Emsley P, Lohkamp B, Scott WG & Cowtan K Features and development of Coot. Acta Crystallogr. D 66, 486–501 (2010). [DOI] [PMC free article] [PubMed] [Google Scholar]
- 42.Afonine PV et al. Towards automated crystallographic structure refinement with phenix.refine. Acta Crystallogr. D 68, 352–367 (2012). [DOI] [PMC free article] [PubMed] [Google Scholar]
- 43.Chen VB et al. MolProbity: all-atom structure validation for macromolecular crystallography. Acta Crystallogr. D 66, 12–21 (2010). [DOI] [PMC free article] [PubMed] [Google Scholar]
- 44.Delano W The PyMOL Molecular Graphics System, https://pymol.org/ (2002).
- 45.Pettersen EF et al. UCSF Chimera—a visualization system for exploratory research and analysis. J. Comput. Chem 25, 1605–1612 (2004). [DOI] [PubMed] [Google Scholar]
- 46.Heymann JB & Belnap DM Bsoft: image processing and molecular modeling for electron microscopy. J. Struct. Biol 157, 3–18 (2007). [DOI] [PubMed] [Google Scholar]
- 47.Drozdetskiy A, Cole C, Procter J & Barton GJ JPred4: a protein secondary structure prediction server. Nucleic Acids Res 43, W389–W394 (2015). [DOI] [PMC free article] [PubMed] [Google Scholar]
Associated Data
This section collects any data citations, data availability statements, or supplementary materials included in this article.
Supplementary Materials
Data Availability Statement
The cryo-EM density map and coordinates of EDTA–CALHM2hemi, EDTA–CALHM2gap, and RUR–CALHM2 have been deposited in the Electron Microscopy Data Bank (EMDB) under accession numbers EMDB-20788, EMDB-20790 and EMDB-20789, respectively, and in the Research Collaboratory for Structural Bioinformatics Protein Data Bank under accession codes 6UIV, 6UIX and 6UIW, respectively. The single subunit map(s) obtained from signal subtraction and associated mask have been deposited under the corresponding EMDB accession number.


