

Abstract
1s2p resonant inelastic x-ray scattering (1s2p RIXS) has proven successful in the determination of the differential orbital covalency (DOC, the amount of metal vs. ligand character in each d molecular orbital) of highly covalent centrosymmetric iron environments including heme models and enzymes. However, many reactive intermediates have non-centrosymmetric environments, e.g. the presence of strong metal-oxo bonds, which results in the mixing of metal 4p character into the 3d orbitals. This leads to significant intensity enhancement in the metal K-pre-edge and as shown here, the associated 1s2p RIXS features, which impact their insight into electronic structure. Binuclear oxo bridged high spin Fe(III) complexes are used to determine the effects of 4p mixing on 1s2p RIXS spectra. In addition to developing the analysis of 4p mixing on K-edge XAS and 1s2p RIXS data, this study explains the selective nature of the 4p mixing that also enhances the analysis of L-edge XAS intensity in terms of DOC. These 1s2p RIXS biferric model studies enable new structural insight from related data on peroxo bridged biferric enzyme intermediates. The dimeric nature of the oxo bridged Fe(III) complexes further results in ligand-to-ligand interactions between the Fe(III) sites and angle dependent features just above the pre-edge that reflect the superexchange pathway of the oxo bridge. Finally, we present a methodology that enables DOC to be obtained when L-edge XAS is inaccessible and only 1s2p RIXS experiments can be performed as in many metalloenzyme intermediates in solution.
Graphical Abstract
Introduction
The chemical and physical properties of the active sites in many proteins and enzymes are often determined by first-row transition metal ions. Spectroscopic tools to enhance the understanding of the metal 3d orbitals and their covalent ligand interactions are therefore of high importance. X-ray spectroscopy involves creating a core-hole and thus offers an element specific method for obtaining detailed insight into the electronic structure.1 This is a particular advantage in highly covalent environments such as heme metallo-enzymes, where the metal signal can be obscured by the strong heme background in other spectroscopic methods. Soft X-ray absorption spectroscopy (XAS) in particular transition metal L2,3-edge XAS, which studies the metal 2p → 3d transitions, has proven to be invaluable in determining detailed electronic structure information including the ligand-to-metal (LMCT) and metal-to-ligand (MLCT) charge transfer character (i.e. donor and acceptor bonding) for each metal 3d orbital (i.e. the differential orbital covalency, DOC).2-4 As soft X-rays usually require high vacuum conditions partially due to the e− detection over photon detection and low penetration depth, L-edge XAS is often not suitable for metallo-proteins and enzymes. Hard X-ray 1s2p resonant inelastic X-ray scattering (1s2p RIXS) measurements have a high penetration depth and do not require an UHV sample environment. This RIXS experiment involves resonantly exciting a 1s electron into unoccupied 3d orbitals, followed by a photon emitted by the decay of a 2p electron to fill the 1s core hole.5 Thus both the photon-in and photon-out energies are appropriate for metallo-enzymes in solution. The resulting 1s2p RIXS final states have the same configurations as the L-edge XAS final states, but with different selection rules than in direct L-edge XAS.6 In a previous study on cytochrome c, 1s2p RIXS only data were used to determine the DOC of the ferrous and ferric protein sites starting from well described heme model complexes.7 Characteristic features in the 1s2p RIXS planes were identified that reflect the main influences of the electronic structure changes associated with going from the heme model complex with two axial imidazole ligands to the heme protein with axial methionine and histidine ligands. 7
The intensity and shape of the K-pre-edge is largely dominated by the local ligation around the transition metal ion. In a complex with close to inversion symmetry the 1s → 3d pre-edge transitions are electric quadrupole allowed and relatively weak. In the absence of an inversion center, metal 4p character can mix into the 3d orbitals and contribute electric dipole allowed intensity in the K-pre-edge. Since this is approximately 100 times stronger than 1s → 3d transitions, only a few percent of 4p mixing can perturb and dominate the pre-edge spectral shape.8 1s2p RIXS planes are constructed by moving the incident energy through the pre-edge region for fixed emission energies or the other way around. By integrating along the energy transfer direction (i.e. the vertical axis in the RIXS plane that is the energy difference between the photon in and the photon out), the full K-edge XAS is obtained. Therefore, 1s2p RIXS planes will also be affected by a loss of inversion. Importantly, due to the 2-dimensional nature of the RIXS planes, this electric dipole contribution to the pre-edge region can also provide information on the electronic structure that complements the insight available from direct 2p → 3d L-edge XAS.
Mixing of 4p character into the 3d orbitals can occur in two ways. One is a direct interaction due to the non-centrosymmetric components of the ligand field, which corresponds to a direct matrix element between the metal 3d and 4p orbitals.9 In this ligand field theory method, the amount of 4p character mixed into the 3d orbitals is independent of the ligand-metal covalent overlaps and has been used without the explicit inclusion of LMCT in the Hamiltonian.10-13 The alternative and more efficient mechanism of p/d mixing involves their covalent interactions with the ligands. This requires the explicit inclusion of the ligand orbitals in the Hamiltonian resulting in a 3 × 3 matrix:
| (1) |
where the metal 3d (at an energy Δ) mixes with the ligand p orbitals through their overlap T, and the same ligand orbital further overlaps the metal 4p orbital, T4p (at an energy Δ4p).14 In this study, the LMCT p/d mixing method is included as a direct result of the covalent bonds (additional details are given in the Supporting Information).
Many key biological active sites in particular the high valent Fe(IV)=O heme and nonheme enzyme intermediates and their model complexes15,16 have no inversion center at the Fe site leading to intense K-pre-edge XAS features. This is also the case for the biferric peroxo and high-valent biferryl intermediates found in nonheme diiron enzymes and their model complexes.17-19 1s2p RIXS offers a unique opportunity to study these complexes due to its element selectivity and sensitivity to DOC. In this study, we determine the effects of 3d/4p mixing on the spectral shape of 1s2p RIXS 2D maps of binuclear high-spin ferric Fe(III) complexes having approximate Oh and C4v local symmetry. We have chosen high-spin Fe(III) systems as these are well understood from L-edge XAS2 and provide a good starting point to understand the 4p mixing effects of an Fe(III)-oxo bond. In addition, they have key structural features anticipated to be present in biferric peroxo enzyme intermediates.20 Three Fe-dimer complexes were studied: The hydroxo bridged Fe2-OH-(HBpz3)2(μ-ac)2 complex (hbpz3 = tri-1-pyrazolylborate, μ-ac = carboxylate bridge)21 has a quasi-octahedral local Fe environment and serves as a centrosymmetric reference (see Figure 1 A). Deprotonation of the hydroxo bridge to form a biferric oxo-bridge (with the same ligand environment, Fe2-oxo-(HBpz3)2(μ-ac)2, Figure 1 B), leads to short Fe-O bond lengths (1.96 to 1.79 Å in μ-OH and μ-oxo, respectively). This eliminates the approximate inversion symmetry at the Fe reducing the local symmetry to approximately C4v. Both complexes have an Fe-O-Fe angle of ~124°. A second oxo-bridged biferric complex is included in this study, where the ligand system is changed to hedta, and the Fe-O-Fe bond angle increases to 165° (Figure 1 C), but keeps the same Fe-oxo bond lengths, the high-spin configuration and approximate local C4v symmetry.
Figure 1:

Crystal structures of the three model compounds Fe2-OH-(HBpz3)2(μ-ac)2 (A), Fe2-oxo-(HBpz3)2(μ-ac)2 (B) and Fe2-oxo-hedta2 (C).
In this study, the L-edge, K-edge XAS spectra and 1s2p RIXS 2D maps of all three complexes are analyzed to extract the DOC using a valence bond configuration interaction (VBCI) mulitplet model to fit L-edge XAS and RIXS data.2,6,7 The 2p core-hole in the L-edge XAS and 1s2p RIXS final states leads to strong 2p spin-orbit coupling and 2p-3d Coulomb repulsion that influence the relative intensities and shapes of the L3- and L2-edge and the 1s2p RIXS maps and must be included in the multiplet analysis to quantitatively estimate covalency (i.e. DOC). Advantages (and disadvantages) of the strong electric dipole intensity contributions from 4p mixing to the RIXS planes are determined by comparing cuts through the 1s2p RIXS map to L-edge and K-edge XAS data. For many biological systems, L-edge XAS cannot be measured and only 1s2p RIXS would be available. Therefore the determination of the covalent ligand-metal bonding in terms of DOC from 1s2p RIXS planes alone is further developed. This study also provides new insight into the molecular orbital origin of the 4p mixing in Fe=O systems and explains the dominant 3d(z2)/4p(z) intensity contribution found experimentally. The DOC allows access to the covalent mixing in the oxo-dπ and oxo-dσ orbitals, which are the frontier molecular orbitals (FMOs) in metal-oxo systems that play a key role in many reactions.
To fully analyze the data, we take two complementary approaches. One where we use the VBCI multiplet model to fit the experimental data and extract bonding information in terms of DOC from experiment. This is then compared to Mulliken populations from DFT calculations enabling the correlation of the experimental RIXS data to the DFT calculations. This complementary approach also provides insight into dimer specific covalent mixing through inter-oxo bridged ligand-ligand interactions and angle dependent inter Fe transitions reflecting oxo superexchange pathways
Using the advanced insight from the analysis of the full 1s2p RIXS maps of the hydroxo- and oxo-bridged model complexes as references, we also gain new insight into the geometric structures of several peroxo bridged biferric enzyme intermediates, in particular when an oxo bridge is also present that would greatly impact reactivity.
Experimental and Computational Methods
Sample Preparation:
Crystalline samples of Fe2-OH-(HBpz3)2(μ-ac)2, Fe2-oxo-(HBpz3)2(μ-ac)2, and Fe2-oxo-hedta2 were prepared following standard procedures.21-24
Experimental Methods:
In this study, two experimental methods have been employed: soft X-ray L-edge XAS and 1s2p RIXS. These experiments have been performed at the Stanford Synchrotron Radiation Lightsource (SSRL) at beam lines 10-1 (L-edge XAS) and 6-2 (1s2p RIXS).25 Experimental details on both methods are given in the Supporting Material. All data sets (L-edge XAS, 1s2p RIXS) have been measured at least twice to ensure reproducible and reliable data. Special attention has been paid to avoid photo damage by moving over the sample and illuminating each sample spot for only a short amount of time.
All 1s2p RIXS planes are normalized to unity at the edge-jump allowing for a direct comparison with K-edge XAS results. The pre-edge in a 1s2p RIXS experiment includes the tail of the intense 1s → 4p transitions at approximately 15 eV above the pre-edge. This leads to an increase of the pre-edge background and complicates the direct comparison of L-edge data with constant incident energy (CIE, i.e. vertical) cuts through the RIXS plane. In order to estimate the RIXS pre-edge intensity from the tail of the rising-edge, the full RIXS planes were fit to extract the true pre-edge region as described previously.7,26
Charge Transfer Multiplet Simulations:
To simulate both L-edge and RIXS X-ray spectra, charge transfer multiplet calculations were performed.27-30 The calculations were performed in the C4v crystal field symmetry for all three complexes. Covalent mixing of ligand character into unoccupied 3d orbitals was modeled using the valence bond configuration interaction (VBCI) approach. Ligand-to-metal charge transfer (LMCT) is introduced via a ( = ligand hole) configuration that is mixed into the dn configuration in the ground state. LMCT charge transfer channels were included through the overlap parameters T(B1), T(A1), T(E), and T(B2) with the corresponding ligand-to-metal charge transfer energy Δ. 4p mixing was included by the introduction of an additional ligand-to-metal(4p) charge transfer (LM4pCT) configuration. Here, the LM4pCT channels were included via T(A1) (4pz/3dz2) and T(E) (4px,y/3dxz,yz) as allowed in C4v symmetry at an energy Δ4p. Details including a description of the model and the calculation of absolute absorption intensities normalized to the edge jump are given in the Supporting Material. The metal-ligand covalency for each of the symmetry blocks (i.e. the DOC) was calculated using the projection method.2 Here, each 3d hole has 100% metal character. Upon ligand-to-metal covalent mixing, the metal character decreases (and ligand character in the 3d orbitals increases).
Initial VBCI fits to the L-edge XAS spectra were obtained using a trust region reflective non-linear least squares fitting approach from a series of 100 sets of start parameters that were randomly generated. From these, the best parameter set was determined by their refinement of simultaneously fitting to both the L-edge XAS and 1s2p RIXS data (see Supporting Information for more details).
Density Functional Theory Calculations:
All calculations were carried out using the ORCA quantum chemistry program, version 4.0.0.2.31 For all calculations, the non-optimized crystal structures of the three complexes21-23 were used. The B3LYP functional32 was employed with standard polarized triple-zeta basis set def2-TZVPP33 and auxiliary basis set def2/J,34 and the more flexible CP(PPP) basis set35 on the central di-iron ions. A dense integration grid (grid4), and tight convergence criteria were enforced.
For TD-DFT derived K pre-edge XAS spectra,36-40 the application of scalar relativistic corrections (ZORA)41,42 did not lead to a better description and has thus been omitted, as found previously.38 For all XAS calculations, electric dipole, electric quadrupole and magnetic dipole contributions are included. Calculated K pre-edge spectra were visualized using the ORCA_MAPSPC module with a Gaussian broadening of 1.0 eV. For transitions that are electric-dipole allowed, the electric-quadrupole and magnetic dipole contributions become origin dependent.43-45 To account for this, the origin adjusted method (ABSQ) using a minimization procedure that guarantees the fastest convergence of the multipole expansion was used, which gave similar results as the origin independent method (ABSOI)43,46 in the energy range of interest. A constant energy shift of 151.5 eV was applied to the calculated spectra. Mulliken population analyses47 were performed using the QMForge Suite.48
Results and Analysis
Three sets of data were obtained for the three complexes: Fe L-edge and K-edge XAS, and 1s2p RIXS. In this section, the L-edge XAS data are presented together with their charge transfer multiplet simulations and the resulting DOC. This is then compared to the results of DFT calculations. The K-edge is presented both from K-edge XAS and from high-resolution constant emission energy (CEE) cuts in the pre-edge and the extended pre-edge region of the RIXS plane and analyzed using TD-DFT calculations. The constant incident energy (CIE) cuts are then presented, connected to the L-edge XAS and analyzed with the multiplet model. Finally, given a well defined relevant model complex we show that the 1s2p RIXS plane alone can be used to define the DOC of an intermediate in solution.
L-edge XAS and DOC
Soft X-ray L-edge XAS directly probes the unoccupied Fe 3d orbitals via electric dipole allowed 2p → 3d transitions and therefore experimentally quantitatives the covalency (by the decrease in d character and therefore intensity due to bonding). L-edge XAS for Fe2-OH-(HBpz3)2(μ-ac)2, Fe2-oxo-(HBpz3)2(μ-ac)2, and Fe2-oxo-hedta2 are shown in Figure 2 A-C (black), respectively.
Figure 2:

Experimental L-edge XAS together with their charge transfer multiplet simulations of Fe2-OH-(HBpz3)2(μ-ac)2(A), Fe2-oxo-(HBpz3)2(μ-ac)2 (B), and Fe2-oxo-hedta2 (C). Experimental spectra are shown in black, while simulations are shown in red.
The Fe2-OH-(HBpz3)2(μ-ac)2 L-edge XAS spectrum (Figure 2A) is very similar to those of typical high spin Oh Fe(III) complexes.2 For high spin ferric L3-edges, the low energy intensity at 707.1 eV (v1) originates predominantly from transitions into dπ orbitals (t2g-like) with a small amount of dσ (eg-like) character, while the intensity around 708.9 eV (w1) contains similar dπ and dσ contributions to the intensity (mixed by the 3d-2p exchange).49
Upon going from an OH to an oxo bridge (Figure 2 A to B and C), the L-edge XAS spectra change reflecting the change in electronic structure due to the shortened Fe-oxo bonds (by ~0.2 Å).21-23 The shortened Fe-O(bridge) bond length in the oxo dimer reduces the local geometric structure from quasi Oh to C4v. As a result, the low and high energy peaks broaden due to the energy splitting of the t2 π (into b2 (dxy) and e (dxz,yz)) and e σ (into b1 (dx2–y2) and a1 (dz2)) degeneracies.
The Fe2-OH-(HBpz3)2(μ-ac)2 peak at 707.2 eV (v1) incident energy splits into two well separated features at 706.1 and 707.0 eV for Fe2-oxo-(HBpz3)2(μ-ac)2(v2 and v3), and 706.3 and 707.2 eV for Fe2-oxo-hedta2(v4 and v5). The main peak at 708.9 eV (w1) for Fe2-OH-(HBpz3)2(μ-ac)2 splits into two well separated peaks at 708.1 and 707.7 eV for Fe2-oxo-(HBpz3)2(μ-ac)2(w2 and w3), and into a main peak at 708.7 eV and a shoulder at ~708.2 eV for Fe2-oxo-hedta2(w4 and w5). Due to the shorter Fe-O(bridge) bond length, the z2 level shifts to higher energies, while the xy level should be at lowest energy. Quantitatively, the precise energy of these splittings are strongly influenced by the pd and dd e−-e− Coulomb repulsion and exchange.50,51
The absolute integrated intensity of a normalized and background subtracted Fe L-edge XAS spectrum reflects the total metal 3d character of the unoccupied valence orbitals.52,53 For the three biferric complexes, the integrated intensities are: 47 ± 3 units (Fe2-OH-(HBpz3)2(μ-ac)2), 41 ± 8 units (Fe2-oxo-(HBpz3)2(μ-ac)2) and 45 ± 7 units (Fe2-oxo-hedta2). They represent similar metal 3d characters within error, with the trends of an increased covalent mixing (i.e. decreased intensity, therefore lower metal d character) upon deprotonation of the Fe-OH bridge (with the same (HBpz3)2(μ-ac)2 ligand environment) and a decreased covalency (increased metal d character) upon exchanging the non-oxo ligand environment (HBpz3(μ-ac)2 to hedta2).
While the total intensity is given by the ground state, the spectral shape is determined by the final states that are reached via the 2p → 3d electric dipole transitions.53 To interpret the experimental spectra, simulations using charge transfer multiplet calculations are necessary that take the 3d/2p-core-hole interaction properly into account.50 Figure 2A-C (red curves) shows the best fits of Fe2-OH-(HBpz3)2(μ-ac)2, Fe2-oxo-(HBpz3)2(μ-ac)2, and Fe2-oxo-hedta2 L-edge spectra, respectively, using multiplet calculations with valence bond configuration interaction (VBCI) included. Details on the parameters used are given in the Supporting Information. Note that these best fits result from the simultaneous analysis of the L-edge XAS (Figure 2) and 1s2p RIXS data (vide infra). All spectral features and trends are well described including the additional ligand field broadening and splittings for the oxo bridged complexes.
For all three complexes, a high spin ground state is found consistent with experiment. By using the projection method on the ground state configurations, the metal 3d character for each individual 3d orbital, i.e. the differential orbital covalency (DOC), was determined.2 The resulting values from the total d character from the L-edge XAS total intensity and from DFT Mulliken population analyses are given in Table 1.
Table 1:
Summary of L-edge Integrated Intensities, DOC Simulation Results, and Molecular Orbital Calculations. Note that the value for Fe(e) is per orbital and the e set carries twice this amount.
| L-edge + 1s2p RIXS covalency (%) | DFT covalency (%) | ||||||||||
|---|---|---|---|---|---|---|---|---|---|---|---|
| intensity | Fe(b2) | Fe(e) | Fe(b1) | Fe(a1) | total | Fe(b2) | Fe(e) | Fe(b1) | Fe(a1) | total | |
| Fe2-OH-(HBpz3)2(μ-ac)2 | 47 ± 3 | 88 | 88 | 74 | 74 | 413 | 84 | 88 | 74 | 74 | 408 |
| Fe2-oxo-(HBpz3)2(μ-ac)2 | 41 ± 8 | 89 | 80 | 76 | 67 | 392 | 86 | 79 | 78 | 68 | 390 |
| Fe2-oxo-hedta2 | 45 ± 7 | 91 | 84 | 77 | 69 | 405 | 88 | 81 | 76 | 68 | 394 |
The VBCI derived DOCs agree with the values found from DFT and with the total experimental intensity in showing an increased covalency (i.e. decreased metal d character) in going from Fe2-OH-(HBpz3)2(μ-ac)2 to Fe2-oxo-(HBpz3)2(μ-ac)2 (413 to 392%), as well as a decreased covalency (increased metal d character) by changing the Fe2-oxo ligation from (HBpz3)2(μ-ac)2 to hedta2 (392 to 405%). Upon lowering the local symmetry from an OH to an oxo bridge, the orbitals having direct overlap with the bridging oxygen (local z-direction) are affected the most. The e (d(xz/yz) (dπ)) metal character decreases from 88 to 80% per orbital and the a1 (d(z2) (dσ)) metal character decreases from 74 to 67%. In going to the hedta2 Fe2-oxo dimer, the largest changes are observed in the dπ orbitals (89→91% for b2 and 80→84% for e). Both, experiment and DFT calculations reflect these changes.
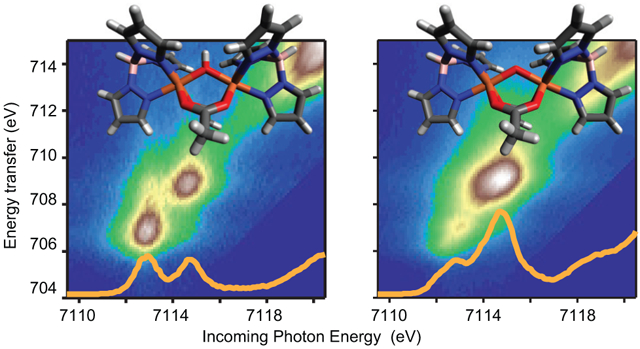
In the 1s2p RIXS process, a 1s electron is excited into unoccupied 3d orbitals with potential 4p character mixed in via electric quadrupole and electric dipole transition moments, respectively. This absorption process probes the unoccupied density of states with the corresponding incident energy being plotted along the horizontal axis in the 2D maps (Figure 3). In the electric dipole 2p → 1s emission process, plotted as the transfer energy (difference between the energy of the photon in and the photon out, vertical axis) in the 1s2p RIXS planes, the occupied density of states is probed through the Coulomb and exchange interaction of the 2p core-hole with the 3d electrons. Figure 3 shows the 1s2p RIXS planes normalized to the edge-jump of Fe2-OH-(HBpz3)2(μ-ac)2 (A), Fe2-oxo-(HBpz3)2(μ-ac)2 (B), and Fe2-oxo-hedta2 (C). The maximum of the color scale is set to the maximum intensity in the individual pre-edge region. All three complexes show pre-edge intensities between ~7112-7116 eV clearly separated from the rising edge (visible at >7119 eV) in the 2D presentation.
Figure 3:

Experimental 1s2p RIXS planes of (A) Fe2-OH-(HBpz3)2(μ-ac)2, (B) Fe2-oxo-(HBpz3)2(μ-ac)2, and (C) Fe2-oxo-hedta2. All spectra are normalized to the edge jump and plotted such that the maximum intensity is in the pre-edge region. (D)-(F) show the corresponding K-edge spectra from the integrated RIXS plane (red solid) and the direct K-edge XAS measurement (blue dashed, top), together with the CEE cut (green solid, middle). The direct K-edge data are adapted from Ref. 8. The bottom figures show the fits to the K-edge derived from the integrated RIXS planes. The resulting background subtracted pre-edge fit is shown in light green solid.
For S=5/2 high spin systems in quasi Oh environments, two main transitions to the intermediate state (1s → 3d) are expected into the t2g and eg orbitals,8 while for the oxo-bridged systems in C4v symmetry four transitions are expected due to the additional C4v ligand field splitting (t2g (Oh) splits into b2, e, and eg (Oh) into b1, a1). As expected, the Fe2-OH-(HBpz3)2(μ-ac)2 RIXS map shows two separated pre-edge peaks with similar intensities at 7112.9 and 7114.6 eV. In going to the oxo-bridged complexes, the pre-edge intensity pattern changes. In both oxo bridged high spin ferric complexes, one dominant feature at ~7114.8 eV (Fe2-oxo-(HBpz3)2(μ-ac)2, Figure 3B) and 7114.4 eV (Fe2-oxo-hedta2, Figure 3C) is visible together with a low intensity feature at lower energies. The high intensity of the ~7114.8 and ~7114.4 eV peaks emphasizes the relevance of the additional electric dipole intensity due to the 4p character mixed in the 3d orbitals.
A more detailed analysis is done by cuts through the 2D 1s2p RIXS plane: Diagonal cuts through the RIXS plane along the constant emission energy (CEE) give K-edge like spectra with higher resolution than conventional K-edge XAS due to the long-lived 2p core-hole final state54,55 These will be analyzed in the next section (K-Edge and CEE Spectra). Vertical cuts along the transfer energy direction at constant initial energy (CIE) reach final states that are identical to those reached in direct L-edge XAS but with different selection rules.6 This allows a direct comparison of 1s2p RIXS and L-edge XAS and will be presented in a later section (L-edge-like CIE cuts).
K-Edge and CEE Spectra
The Pre-Edge Region
K-pre-edge XAS involves 1s → 3d transitions into unoccupied valence orbitals. These spectra are shown in Figure 3 (D-F) as derived from the integrated RIXS map (red solid, top) and the direct K-edge XAS measurement (blue dashed, top). The 1s2p RIXS derived K-edge aligns well with the direct K-edge XAS measurement taken from Ref 8, including absolute intensities. The K-pre-edge spectrum of the approximately Oh complex, Fe2-OH-(HBpz3)2(μ-ac)2, resolves two peaks at ~7113 and ~7114.5 eV, consistent with other high spin d5 studies.8 Upon lowering the local symmetry to C4v in the μ-oxo bridged complexes (Figure 3E and F), the pre-edge intensity doubles due to additional mixing of 4p character in the 3d orbitals. The increased intensity is most pronounced in the higher energy region of the K-pre-edge at ~7114.5 eV.
These observations become more prominent in the CEE cuts as shown in Figure 3D-F (green solid, middle). In high spin S=5/2 Fe(III) K-pre-edges the multiplet effects simplify to a one electron orbital description.8 Therefore, two main transitions are expected in Oh symmetry and four transitions in C4v due to the additional orbital splittings. As anticipated, the Fe2-OH-(HBpz3)2(μ-ac)2 spectrum contains two CEE peaks, while four peaks are necessary to fit the CEE cuts of Fe2-oxo-hedta2 and Fe2-oxo-(HBpz3)2(μ-ac)2 (see Figure 3 D-F bottom).
The full K-edges i.e. integrated 1s2p RIXS planes, were fit with two (OH-bridged) and four peaks (oxo-bridged) in the pre-edge region together with a proper background. Note that relative intensities in the CEE cuts do not necessarily represent the correct intensity ratios due to off diagonal intensity contributions in the 1s2p RIXS planes. The fits to the three complexes are shown in Figure 3D-F (bottom) and Figure S2 together with a description of the procedure to fit the data. For Fe2-OH-(HBpz3)2(μ-ac)2, the low energy peak at 7112.9 eV accounts for 55% of the total pre-edge intensity, or 5.9 out of 10.7 total units of intensity normalized to the edge jump (Table 2).
Table 2:
Results of a multiple peak fit to the K pre-edge of the three complexes. The energy position is given in eV, while the intensity is given in absolute units.
| total intensity |
peak i | peak ii | |||||||
|---|---|---|---|---|---|---|---|---|---|
| energy | intensity | energy | intensity | ||||||
| Fe2-OH-(HBpz3)2(μ-ac)2 | 10.7 | 7112.9 | 5.9 | 7114.7 | 4.8 | ||||
| total intensity |
peak 1 | peak 2 | peak 3 | peak 4 | |||||
| energy | int. | energy | int. | energy | int. | energy | int. | ||
| Fe2-oxo-(HBpz3)2(μ-ac)2 | 24.9 | 7112.5 | 2.8 | 7113.0 | 2.7 | 7114.2 | 6.0 | 7115.0 | 13.4 |
| Fe2-oxo-hedta2 | 22.7 | 7112.4 | 1.6 | 7113.0 | 4.1 | 7113.8 | 2.8 | 7114.5 | 14.2 |
In Fe2-oxo-(HBpz3)2(μ-ac)2 and Fe2-oxo-hedta2, the local symmetry lowers to C4v due to the short Fe-O bridge bond, and 4p character is mixed into the 3d orbitals.8,10-12,56,57 In C4v symmetry, the 4p(z) orbital is allowed to mix with the 3d(z2) (a1) and the 4p(x, y) orbitals are allowed to mix with the 3d(xz, yz) (e). The mixing of 4p character into the 3d orbitals results in a 1s → 4p electric dipole contribution to the pre-edge. As a consequence, the total pre-edge intensities of the Fe2-oxo-(HBpz3)2(μ-ac)2 and Fe2-oxo-hedta2 spectra increase by around a factor of two relative to the Fe2-OH-(HBpz3)2(μ-ac)2 pre-edge intensity. In more detail, the spectral shapes of both μ-oxo-bridged complexes are now dominated by an intense feature at higher energies, which is better resolved in the CEE cuts. The four peaks fit to the data (Figure 3(bottom)) reveals that the highest energy peak at ~7115 eV gains considerable intensity, while the two lower energy peaks (peaks 1 and 2 in Table 2, the b2 and e components in C4v), which correlate to the first peak for the quasi octahedral Fe2-OH-(HBpz3)2(μ-ac)2 complex, do not gain intensity. Therefore, only a1 mixing occurs, even though dπ/px,y (e) mixing is allowed by group theory.
Estimating the amount of 4p character mixed into the 3d pre-edge of the experimental spectrum was achieved by subtracting the estimated quadrupole contribution taken from the Fe2-OH-(HBpz3)2(μ-ac)2 K-edge data.8 The total intensities for Fe2-oxo-hedta2 and Fe2-oxo-(HBpz3)2(μ-ac)2 are 22.7 and 24.9 units, respectively, while the Fe2-OH-(HBpz3)2(μ-ac)2 total intensity is 10.7 units. From the L-edge results in Table 1, Fe2-oxo-hedta2 has 0.98 of the metal d character of Fe2-OH-(HBpz3)2(μ-ac)2 (i.e. 2% more covalent), while Fe2-oxo-(HBpz3)2(μ-ac)2 has 0.95 of the metal d character (i.e. 5% more covalent). Assuming that the K-pre-edge spectrum of Fe2-OH-(HBpz3)2(μ-ac)2 consists purely of electric quadrupole transitions, the expected quadrupole intensities of Fe2-oxo-hedta2 and Fe2-oxo-(HBpz3)2(μ-ac)2 are ~10.5 and ~10.2 units, respectively. This gives ~12.2 and ~14.7 units of intensity for the electric dipole contribution to the Fe2-oxo-hedta2 and Fe2-oxo-(HBpz3)2(μ-ac)2 spectra, respectively. From these values, the percentage of 4p mixing into the 3d orbitals can be estimated. Following Westre et al.8 this pre-edge extracted intensity correlates to 6% and 7% 4p mixing into the 3d orbitals for Fe2-oxo-hedta2 and Fe2-oxo-(HBpz3)2(μ-ac)2, respectively.
From a Mulliken analysis of the DFT results for the two μ-oxo complexes, the amount of 4p character that is mixed into the 3d orbitals is given in Table 3. The total amount of 4p character is less than what is found experimentally, but similar to the experiment, there is only a limited amount of 4p character in the xz/yz orbitals, while more is present in the z2 orbital for both μ-oxo complexes. Note that a small amount of 4p character is also found in Fe2-OH-(HBpz3)2(μ-ac)2 due to the lower than Oh symmetry of the actual Fe(III) site, which leads to an increased intensity at 7114.8 eV in the experimental spectrum and a deviation from the nominal 3/2 ratio of the t2g/eg intensities (Table 2). However, the effect is small (<0.7 % (see Ref. 8)) and does not significantly alter the estimate of 4p character mixed into the 3d orbitals in the oxo-bridged complexes.
Table 3:
Amount of 4p character mixed into the unoccupied 3d orbitals from a Mulliken analysis of the DFT single point calculations. The small values that are found in orbitals with x and y character originate from a deviation of the C4v symmetry.
| Amount of 4p character [%] | ||||
|---|---|---|---|---|
| xy | xz/yz | x2 – y2 | z2 | |
| Fe2-OH-(HBpz3)2(μ-ac)2 | 0.3 | 0.2 | 0.3 | 0.5 |
| Fe2-oxo-(HBpz3)2(μ-ac)2 | 0.3 | 0.8 | 0.3 | 2.0 |
| Fe2-oxo-hedta2 | 0.2 | 1.7 | 1.0 | 3.8 |
While the VBCI multiplet analysis is required for fitting the L-edge XAS spectrum, the K pre-edge can be correlated to TD-DFT calculations. Figure 4A shows the comparison of the experimental K-edges with the TD-DFT derived spectra. The top panel shows the TD-DFT spectra of Fe2-OH-(HBpz3)2(μ-ac)2 (red), Fe2-oxo-(HBpz3)2(μ-ac)2 (blue) and Fe2-oxo-hedta2 (green), which are compared to the experimental CEE cuts (middle panel) and the K-pre-edge spectra (bottom panel). The three TD-DFT spectra exhibit comparable intensities in the lower energy peak at around 7113 eV. At higher energies (~7115 eV) the two oxo-bridged complexes gain significant intensity with the main peak of Fe2-oxo-(HBpz3)2(μ-ac)2 (blue) being 0.5 eV higher in energy than Fe2-oxo-hedta2 (green), consistent with the experimental results. Each calculated spectrum consists of three contributions: electric dipole, magnetic dipole, and electric quadrupole contributions. The TD-DFT calculations do not do particularly well with respect to the quadrupole distribution, but nicely reproduce the large intensity increase observed in the oxo bridged dimers due to the dipole contribution. The individual contributions for the three complexes are shown in Figure 4B-D. For Fe2-OH-(HBpz3)2(μ-ac)2 (B), the spectrum is dominated by the quadrupole contribution (blue) as expected for a high spin ferric complex with quasi Oh local symmetry. The calculated spectra for both oxo-bridged complexes Fe2-oxo-(HBpz3)2(μ-ac)2 (C) and Fe2-oxo-hedta2 (D) exhibit a strong electric dipole intensity contribution (green) only at the higher energy side of the spectra, consistent with experiment. The intense electric dipole transition at ~7115 eV derives from excitations into the z2 orbital. As observed experimentally above, there is no significant electric dipole intensity contribution from excitations into the d(xz/yz) orbitals, which are also allowed to mix with 4px,y by group theory.
Figure 4:

A: Comparison of the TD-DFT derived K pre-edge results (top) with the CEE cuts (middle) and the experimental K pre-edge (bottom) for Fe2-OH-(HBpz3)2(μ-ac)2 (red), Fe2-oxo-(HBpz3)2(μ-ac)2 (blue) and Fe2-oxo-hedta2 (green). The individual contributions from the electric dipole and quadrupole (green and blue, respectively) together with the magnetic dipole (orange) are shown in B-D for the three complexes. The sum of all three contributions is shown in red.
Extended Pre-Edge Region
In the experimental K-edge XAS spectra at 3-4 eV above the pre-edge features, additional intensity is present at around 7118.5 eV in the Fe(III)-oxo dimers. In Figure 5(A-C) this is shown for the background subtracted 1s2p RIXS integrated pre-edges (blue) as well as for the CEE cuts (red). A blowup of the extended energy region as well as the non-background subtracted spectra are shown in the Supporting Information. For Fe2-OH-(HBpz3)2(μ-ac)2(A), there is no detectable intensity at around 7118.5 eV, while intensity in this region is clearly visible for Fe2-oxo-(HBpz3)2(μ-ac)2 (B) and also present but weaker for Fe2-oxo-hedta2 (C).
Figure 5:

Background subtracted K-edge (blue) and CEE cuts (red) for (A) Fe2-OH-(HBpz3)2(μ-ac)2, (B) Fe2-oxo-(HBpz3)2(μ-ac)2, and (C) Fe2-oxo-hedta2. The corresponding TD-DFT calculations (K-edge with 1 eV braodening) are shown in D-F and VBCI simulations in G-I. The dashed vertical lines represent the energy separation of the pre-edge (left of line) and extended pre-edge (right of line).
Previously, intensity in this energy region has been observed for a number of complexes including ferric- and ferrous-hexacyanide6 and Fe(III)-oxalate. However, in these complexes, this additional feature arises from Fe 4p mixing into the unoccupied ligand π* orbitals with t1u symmetry (in Oh).6 Complexes without unoccupied ligand π* orbitals relatively close in energy to the d manifold such as ferric- and ferrous-(tacn2)i do not show a feature in this energy range.6 Due to the donating nature of the ligands, this mechanism is also not active for the Fe-oxo/OH complexes in this study.
In periodic materials, intensity has been observed from core transitions into non-local states through Fe(1)(4p)-O(2p)-Fe(2)(3d) mixing.10,11,58-61 A 1s electron is excited into the 4p character on Fe(1) that is mixed into the 3d orbitals of the (non-excited) Fe(2) via an intermediate O 2p orbital (Figure 6 A,B). The resulting intensity appears a few eV higher in energy than the pre-edge, as the electronic relaxation associated with the 1s core-hole creation on Fe(1) acts on the d valence orbitals of Fe(1) but not on the Fe(2) d orbitals. The core-hole on Fe(1) shifts its 4p down in energy, which allows an increased mixing with the Fe(2)(3d) orbitals. This mixing is sensitive to the Fe-O bond length and in particular Fe-O-Fe angle. For the lower energy 3d (π) orbitals on Fe(2), optimal mixing is expected in a 90 degree Fe-O-Fe arrangement due to the Fe(1)(4pz)-O(2pz) σ/π mixing (Figure 6A), which is more effective than the Fe(1)(4px)-O(2px) π/π mixing that is required for a 180 degree Fe-O-Fe arrangement (Figure 6B). For the Fe(2) 3d(z2) delocalized transitions, a high intensity feature in the extended pre-edge region is expected for a linear Fe-O-Fe arrangement. However, this dσ transition is at higher energy (~10 Dq) and obscured by the rising edge intensity.
Figure 6:

Non-local Fe 4p - O 2p - Fe 3d sketch of the orbital interaction for a Fe-O-Fe arrangement of 90° (A) and 180° (B). Local LMCT mechanism (C): Energy separation of the LMCT satellite for the final state multi-electron configurations taking charge transfer and Coulomb repulsion energies into account (left) and adding the LMCT mixing (right), which further splits the energy levels. Its intensity gets enhanced through 4p character mixed into the 3d orbitals.
This predicted behavior is reproduced in the TD-DFT calculations of the K-pre-edge (Figure 5D-F). The first higher energy feature at ~7118 eV originates from an Fe1(1s) transition into the Fe(1)(4p)-O(2p)-Fe(2)(3d(xz/yz)) orbitals. This peak is very weak in Fe2-OH-(HBpz3)2(μ-ac)2, has more intensity in Fe2-oxo-hedta2 and is strongest for Fe2-oxo-(HBpz3)2(μ-ac)2. While the calculated intensity is higher than the experimentally observed intensity and the energy separation from the pre-edge is lower (3.7 and 4.2 (exp) vs 2.6 and 3.3 eV (TD-DFT) for Fe2-oxo-(HBpz3)2(μ-ac)2and Fe2-oxo-hedta2, respectively), the expected angular dependence of the intensity (Figure 6A and B) is reproduced with Fe2-oxo-(HBpz3)2(μ-ac)2 (Fe-O-Fe ∢ ~123) being more intense than Fe2-oxo-hedta2(∢ ~165). The Fe1(1s) to Fe(1)(4p)-O(2p)-Fe(2)(3d(z2)) final state configurations are also calculated to be present at ~1.5-2.5 eV higher in energy relative to the Fe2 dπ delocalized excitations and also show the expected opposite angular dependence. Core excitation into the 4s orbitals mixed with 4p62 appear ~3 eV higher in energy and are buried under the rising edge intensity.
The presence of additional peaks in the extended pre-edge region of the non-centrosymmetric μ-oxo complexes (at ~7118 eV) is also consistent with the predictions of VBCI simulations for these complexes (Figure 5(G-I)). These features are LMCT satellites that are associated with the main pre-edge features. In the multi-electron configuration description, the 3d6 configuration is separated in energy from the 3d5 configuration by the charge transfer energy Δ and the LMCT mixing strength, where denotes a ligand hole. In the presence of a 1s core-hole, this energy difference gets corrected by the Coulomb repulsion energy Δ + Udd – Usd, where Udd describes the 3d-3d and Usd the 1s-3d Coulomb repulsion. This is shown in the level diagram in Figure 6 C. Its transition energy appears ~3-4 eV above the main pre-edge peak, in the energy region of the additional features in the experimental spectra (Figure 5(A-C) at ~7118 eV). The LMCT satellite intensity also gets enhanced through mixing of Fe 4p character into the ligand, which can further mix with the Fe 3d orbitals in the absence of an inversion center. Its intensity therefore depends on Δ and the LMCT mixing strength, however, it is less pronounced than what is experimentally observed.
Thus, the higher energy features that are observed in the CEE cuts and (less pronounced) in the K-pre-edge of these non-centrosymmetric Fe(III) dimer complexes, have two contributions: the dominant delocalized transition to the neighboring Fe with a strong Fe-O-Fe angle dependence and the weaker LMCT satellite. While both mechanisms lead to a single excitation feature, the experimental feature in the expanded pre-edge region of the CEE cuts is broad and with some structure (~1.7 eV, see Figure 5(A-C), and expanded in Supporting Information). The experimental data therefore point to contributions from both intensity mechanisms for the higher energy features. Note that the LMCT satellites only have observable intensity in non-centrosymmetric complexes and the non-local transitions only occur in bridged dimers with a highly covalent bridging ligand.
The presence of the LMCT satellite intensity through 4p mixing also has implications for the 1s3d and 2p3d Coulomb and exchange interaction, U1s3d and U2p3d, respectively. Experimentally in 1s2p RIXS, the additional intensity in the extended pre-edge region is found on the diagonal through the main peak (Figure 3). In the charge transfer multiplet simulations, this requires U1s3d = U2p3d + 1 eV, i.e. more local screening of the 2p core hole. While a difference between U1s3d and U2p3d has only a minor effect on the K-pre-edge region, it has a strong effect on the LMCT satellite region (see Supporting Material). Thus 3d/4p mixing in non-centrosymmetric sites gives LMCT satellite intensity, enabling 1s2p RIXS to be unique in sensitivity to the relative values of U1s3d and U2p3d.
L-edge-like CIE cuts
The advantage of recording 1s2p RIXS maps compared to K-edge XAS spectra, is their two-dimensionality. As discussed above, a CEE (diagonal) cut gives a high resolution K-edge XAS-like spectrum, while a CIE (vertical) cut gives an L-edge-like spectrum.5-7,63 This has advantages over the direct L-edge XAS in that, by appropriately choosing the incident energy, a transition from the 1s orbital into a selected dπ or dσ orbital can specifically enhance L-edge final states containing this dπ or dσ contribution. The dπ and dσ character in direct L-edge XAS is complicated by multiplet effects from the strong 2p3d Coulomb interaction. Alternatively, the direct interpretation of π and σ character from each CIE cut can be complicated by intensity bleeding effects from peaks at higher incoming and transfer energy due to the large lifetime broadening in the incoming photon energy axis. Figure 7 shows selected CIE cuts for all three complexes (red and green for the OH-bridged complex, and orange, red, green, blue for the oxo-bridged complexes through selected contributions to the K-pre-edge) and compares these to their direct L-edge XAS spectra (shown in blue). Only the L3-edge-like region is shown for clarity. The full spectra are given in the Supporting Material.
Figure 7:

Blow-up of the L3 region of the 1s2p RIXS planes together with the CIE cuts at selected energies (vertical lines in RIXS planes) compared to the direct L-edge XAS spectrum: (A) Fe2-OH-(HBpz3)2(μ-ac)2, (B) Fe2-oxo-(HBpz3)2(μ-ac)2, and (C) Fe2-oxo-hedta2.
For Fe2-OH-(HBpz3)2(μ-ac)2(Figure 7 A), the CIE cut through the dπ region (red curve) leads to an L-edge-like spectrum with a peak at the same energy as the low energy peak of the direct L-edge spectrum (blue). Similarly, the dσ CIE cut (green curve) gives an L-edge-like spectrum with a peak corresponding to the main peak of the direct L-edge XAS. Both cuts also show intensity at higher and lower energies, respectively. These point to a small amount of σ character in the lower energy L-edge peak, and π character in the higher energy L-edge peak, similar to what has been found previously from theoretical simulations of L-edge XAS character in Oh high spin FeIII complexes.49 Due to the width of the RIXS feature in the incoming photon energy direction, however, some intensity bleeds into the σ region (for the dπ CIE) and the π region (for the dσ CIE).
For the two oxo-bridged dimer complexes, four CIE cuts at peak energies found from the K-edge and CEE cut fits, are shown together with the direct L-edge XAS. In the oxo-dimer Fe2-oxo-(HBpz3)2(μ-ac)2 complex (B), the two lower energy CIE cuts (orange and red) show an enhanced splitting in line with a low energy shoulder in the direct L-edge XAS (blue). This indicates the C4v splitting of the dπ orbitals. Also the two higher energy CIE cuts at 7113.7 (light green) and 7114.8 eV (dark green) at the 1s → 3d(x2 – y2) and 1s → 3d(z2) transition energies, respectively, show a splitting of 0.4 eV. This splitting is also visible in the direct L-edge XAS spectrum, where two intense peaks with an energy separation of 0.6 eV are observed. The 3d(z2) intensity is electric dipole resonance enhanced (from the 4pz mixed into the 3dz2) and appears on the higher energy side of the L-edge XAS spectrum.
For Fe2-oxo-hedta2, a CIE cut through the lower energy side of the low energy 1s2p RIXS feature (orange) has its maximum aligned with a weak low energy shoulder in the direct L-edge XAS spectrum (blue) at 706.4 eV. The CIE cut across the maximum of the dπ feature (red) has its maximum aligned with the maximum of the low energy feature of the direct L-edge XAS spectrum. The L-edge XAS low energy feature therefore contains a large amount of dπ character and the small shoulder in the L-edge dπ region originates from a splitting of the dπ orbitals again due to the C4v symmetry. Additional intensity is also present in the higher energy part of the CIE cut, which mostly originates from a bleed-over from the intensity of the strong feature in the 1s2p RIXS plane at higher energy. The two cuts through the dσ region (light and dark green) lead to two L-edge-like spectra separated by approximately 0.3 eV with the higher energy cut (dark green) through the 4p dipole intensity enhanced region appearing at the higher energy side of the L-edge spectrum. Since the 4p mixing is into the d(z2) orbital, we can identify the high energy side of the L-edge XAS spectrum as originating mostly from the 2p → 3d(z2) transition.
The 1s2p RIXS VBCI simulations with the parameters used to derive the DOC in Table 1 successfully reproduce the experimental observations, including all energy splittings and relative intensities as shown in Figure 8. Thus these charge transfer multiplet calculations are capable of properly simulating the electronic structures of non-centrosymmetric complexes from direct L-edge XAS and 1s2p RIXS spectra. The 2D nature of the 1s2p RIXS maps with the ability to compare individual cuts (CIE and CEE) for different data sets, provides an enhanced sensitivity of the VBCI fits relative to fits only to the L-edge XAS. This is despite strong electric dipole transition contributions from 3d/4p mixing that does not significantly contribute to the direct L-edge XAS (see also the Supporting Information). Therefore, combining both methods give the most accurate solution space for the parameters used in the VBCI analysis and thus the DOCs in Table 1.
Figure 8:

VBCI simulations of the 1s2p RIXS planes: Blow-up of the Kα1 (L3) region together with the CIE at selected energies (vertical lines in RIXS map) compared to the direct L-edge XAS simulations: (A) Fe2-OH-(HBpz3)2(μ-ac)2, (B) Fe2-oxo-(HBpz3)2(μ-ac)2, and (C) Fe2-oxo-hedta2.
DOC from 1s2p RIXS alone
In the analysis above, the combination of L-edge XAS and 1s2p RIXS data have been used together to simulate spectra and to obtain DOCs. A goal of the present study is to use 1s2p RIXS for systems where L-edge XAS is not accessible (as in a metallo-enzyme intermediate in solution) to obtain DOC of the associated Frontier Molecular Orbitals involved in reactivity. Further, this needs to be accomplished for non-centrosymmetric systems as many of the key intermediates are FeIV=O heme enzymes. We therefore constructed an approach to extract DOC from data where only the 1s2p RIXS plane is available for the intermediate, but when both L-edge XAS and 1s2p RIXS are available on a related model complex. Here, we treat the Fe2-oxo-hedta2 complex as the "intermediate" where only RIXS data are available and Fe2-oxo-(HBpz3)2(μ-ac)2 as the well defined related model complex. For this, we searched for key spectral features in the 2D RIXS maps that allow a step-wise progression between the RIXS planes from Fe2-oxo-(HBpz3)2(μ-ac)2 to Fe2-oxo-hedta2. Figure 9 shows a collection of experimental 1s2p RIXS cuts (solid curves) together with the corresponding simulations (dashed curves) for Fe2-oxo-(HBpz3)2(μ-ac)2 (red) and Fe2-oxo-hedta2 (black). Four characteristic changes are observed in going from the reference Fe2-oxo-(HBpz3)2(μ-ac)2 to Fe2-oxo-hedta2: (i) The change in the overall spectral shape of the CEE cuts in the pre-edge region (7111-7117 eV, Figure 9A). The energy splitting between the σ and π regions decreases, together with an increased π energy splitting. (ii) The CIE cut through the dπ(xy/zy) feature of the RIXS plane at 7113.0 eV incident energy (Figure 9A) shows an increase in intensity (Figure 9B) due to a decreased π(xz/yz) LMCT mixing. (iii) 1s → 3d excitation into the xy orbital appears on the low energy side of the dπ peak at 7112.2 eV in Figure 9A. CIE cuts at this energy show a similar intensity for both Fe-oxo complexes. (Figure 9C) (iv) The CEE pre-edges of the Fe2-oxo dimer complexes at 7114.8 and 7114.4 eV in Figure 9A are dominated by electric dipole transitions due to 4pz(a1) character mixed in the 3d(z2) orbitals. The CIE cuts through these energies (Figure 9D) show a narrower L3-edge-like peak for Fe2-oxo-hedta2.
Figure 9:

Characteristic spectral changes when going from Fe2-oxo-(HBpz3)2(μ-ac)2 to Fe2-oxo-hedta2. A: Comparison of the CEE cuts. B: CIE cuts through the π(xz/yz) feature at 7113 eV. C: CIE cuts through the lower energy feature of π character (xy) at 7112.2 eV D: CIE cuts through the main intensity dipole region (3d(z2) symmetry) normalized to one and shifted such that the spectra are energy aligned at half intensity. - Color scale: Red solid - experimental Fe2-oxo-(HBpz3)2(μ-ac)2; black solid - experimental Fe2-oxo-hedta2; dashed red - simulated Fe2-oxo-(HBpz3)2(μ-ac)2; dashed black - simulated Fe2-oxo-hedta2; dashed green - simulated Fe2-oxo-hedta2 with RIXS only.
Based only on these observed spectral changes starting from the well-defined Fe2-oxo-(HBpz3)2(μ-ac)2 complex (from L-edge XAS and 1s2p RIXS), the 1s2p RIXS only Fe2-oxo-hedta2 plane could be simulated (green dashed line in Figure 9). The corresponding DOC values are given in Table 4 bottom row, together with the L-edge + RIXS derived values for Fe2-oxo-(HBpz3)2(μ-ac)2 and Fe2-oxo-hedta2 taken from Table 1 (in italic). As also found from the full data set simulations in Table 1, RIXS only simulations find Fe2-oxo-hedta2 less covalent than Fe2-oxo-(HBpz3)2(μ-ac)2, with larger increases in d(xz/yz) π and d(z2) σ character. Thus a large number of characteristic quantitative differences (relative to a well defined model) are available to properly simulate the 1s2p RIXS plane in the absence of an L-edge XAS spectrum, despite the strong spectral distortion associated with the electric dipole intensity contributions from 3d/4p mixing in non-centrosymmetric complexes.
Table 4:
DOC values derived from the full data set (L-edge + 1s2p RIXS) for Fe2-oxo-(HBpz3)2(μ-ac)2 and Fe2-oxo-hedta2, as well as for using the Fe2-oxo-hedta2 1s2p RIXS plane alone. Note that the first two rows are a repetition from Table 1 for simplicity. Note that the value for Fe(e) is per orbital and the e set carries twice the amount.
| DOC metal character (%) | ||||||
|---|---|---|---|---|---|---|
| Fe(b2) | Fe(e) | Fe(b1) | Fe(a1) | total | ||
| Fe2-oxo-(HBpz3)2(μ-ac)2 | (L-edge+RIXS) | 89 | 80 | 77 | 67 | 392 |
| Fe2-oxo-hedta2 | (L-edge+RIXS) | 91 | 84 | 77 | 69 | 405 |
| Fe2-oxo-hedta2 | (RIXS only) | 90 | 85 | 79 | 71 | 410 |
Discussion
For systems containing local inversion symmetry, only electric quadrupole allowed 1s → 3d transitions occur, allowing the direct extraction of the DOC from 1s2p RIXS with the advantage of accessing L-edge XAS forbidden final states.6 Upon loss of inversion symmetry, 4p character can mix into the 3d orbitals, giving an electric dipole allowed 1s → 4p intensity contribution to the K-pre-edge region and therefore significantly enhancing their intensity.8,10-12,56,57
In going from Fe2-OH-(HBpz3)2(μ-ac)2 to Fe2-oxo-(HBpz3)2(μ-ac)2, the Fe-O bridge bond length shortens leading to a loss of local inversion symmetry to C4v enabling 4p mixing into specific 3d orbitals, and a splitting of the π and σ orbitals that is visible in the L-edge XAS, 1s2p RIXS and CEE spectra (Figures 2 and 3). Simultaneous L-edge XAS and 1s2p RIXS multiplet simulations that now include the 4p mixing were developed and used to determine the DOC (Table 1). For Fe2-oxo-(HBpz3)2(μ-ac)2 they give increased oxo covalent mixing into the dπ and dσ orbitals, which are the frontier molecular orbitals (FMOs) in metal-oxo systems, that activate reactivity perpendicular to and along the Fe=O bond, respectively.
While both the d(z2) and the d(xz/yz) orbitals have high covalencies in the oxo bridged complexes and are allowed to mix with the 4p orbitals (a1 (p(z)/d(z2)) and e (p(x, y)/d(xz, yz))), only 4p(z) mixing into the 3d(z2) orbital is experimentally found to be significant based experiment and TD-DFT calculations. As shown in Ref 10, p mixing into d orbitals originates from their simultaneous overlap with the same ligand valence orbital. This selective 3d(z2)/4p(z) mixing in oxo bridged Fe dimers can therefore be explained by a simple orbital overlap picture. Figure 10 shows a sketch of the orbitals involved in e (left) and a1 (right) mixing via interaction with a p ligand valence orbital. The e overlap is of π character and this directionality limits the mixing between the oxo 2p(x/y) and the metal 4p(x/y) orbitals. The a1 overlap is of σ character, leading to strong oxo 2pz and Fe 4p(z) overlap and a dominant contribution of the 3d(z2)-4p(z) mixing to the spectral shape, i.e. the observed enhanced intensity of only the a1 channel.
Figure 10:

Sketch of the orbitals involved in e (left) and a1 (right) 3d/4p mixing via ligand mixing for the ligand 2p - metal 3d (bottom) and ligand 2p - metal 4p orbitals (top).
The two dimensionality of the 1s2p RIXS maps generally allows excitations of selected K-pre-edge intermediate states and, via vertical CIE cuts, projections of specific final states in the direct L-edge XAS spectrum that are identified through the specific symmetry of the allowed 3d/4p mixing. The enhanced intensity of only the a1 channel described above additionally enables the selective determination of dz2 character in the L-edge XAS spectra of Fe2-oxo-(HBpz3)2(μ-ac)2 and Fe2-oxo-hedta2 through the strong enhancement of a1 states in the L-edge-like CIE cuts.
Correlation of the two oxo-bridged complexes through the results of the DOC from VBCI simulations of the RIXS data and Mulliken analyses of the associated DFT calculations, provides further insight into the differences in their electronic structure. In quantitatively comparing the HB(pz)3(μ-ac)2 to the hedta2 ligand systems the total covalency of the Fe-O-Fe in the latter is lower both in experiment and DFT calculations, particularly for the dπ orbitals. Interestingly, both the oxo and total ligand contribution in the ferric unoccupied d orbitals have decreased. As the Fe-O-Fe bond lengths are the same, this decrease in the covalency of the hedta ligated complex can have two possible origins: i) the increase in Fe-O-Fe angle from 125 to 164.9 degrees, or ii) the difference in the ligand systems. Both possibilities are tested in the Supporting Information. Variation in the Fe-O-Fe angle with fixed hedta ligand has no effect. Calculations on hypothetical FeIII-oxo monomers with the same ligations show that the hedta is a better donor than the (HBpz3)(μ-ac) ligation. In FeIII-oxo monomers this is compensated by the oxo donation leading to equivalent d character in both. In the oxo bridged dimers the oxo donation is shared between the two FeIII leading to less oxo donation per Fe and in the (HBpz3)2(μ-ac)2 complex increased ligand donation to compensate. However, in the Fe2-oxo-hedta2 complex the larger negative charge on each ligand limits its ability to donate and an increased net Fe character is observed both in RIXS data and calculations. In contrast to a lack of Fe-O-Fe angle effect on the covalency of the oxo bond, there is an effect on the extended pre-edge region where the experimental intensity decreases with increasing angle. This delocalized transition is unique to the dimers and reflects the oxo 2p superexchange pathway between the two Fe centers. However, in contrast to the 3d/4p single site mixing responsible for the dipole intensity of the pre-edge transition that involves the oxo 2pz orbital, the delocalized transition intensity requires an oxo 2px,y mechanism (for the 90° angle) as it involves mixing into the low energy dπ of the adjacent Fe.
By going from a complex with a known structure and using the insight from the spectral features in the 2D 1s2p RIXS data to an unknown complex, as we did by going from Fe2-OH-(HBpz3)2(μ-ac)2 to Fe2-oxo-(HBpz3)2(μ-ac)2 and to Fe2-oxo-hedta2, a clear assignment of spectral changes in different energy regions and hence elucidating the orbital contributions to these regions becomes possible. These RIXS correlations enable specific assignments of features in their corresponding CEE cuts (also called high energy resolution fluorescence detection (HERFD) spectra). These alone can then be used to assist in assigning HERFD spectra of related complexes. This approach provides insight into the structures of biferric peroxo intermediates P’ in 4-aminobenzoate N-oxygenase (AurF) and P in ribonucleotidereductase (RNR), for which HERFD spectra were recently published by Cutsail et al.62 Here, we use the assignments of the 2D 1s2p RIXS planes of the two pyrazolyl borate complexes Fe2-OH-(HBpz3)2(μ-ac)2 and Fe2-oxo-(HBpz3)2(μ-ac)2 to interpret their HERFD spectral features. We then go from these structures with two μ-1,3-carboxylate bridges and a μ-hydroxo or μ-oxo, respectively, to structures with two μ-1,3-carboxylates and a μ-1,2-peroxo or a μ-1,2-hydroperoxo bridge.
Figure 11 A shows the HERFD data for the model complexes Fe2-OH-(HBpz3)2(μ-ac)2 (blue) and Fe2-oxo-(HBpz3)2(μ-ac)2(green) (i.e. CEE cuts from Figure 3), and the biferric enzyme intermediates P’ of AurF (red)62 and P in RNR (Ecβ-W48F/D84E) (yellow). 62 Relative to the μ-hydroxo bridged complex (blue), the intensity in the spectrum of P in RNR (yellow) increases, but not as much as for the μ-oxo bridged model complex (green). The P’ in AurF spectrum (red) shows only a slightly higher total intensity than Fe2-OH-(HBpz3)2(μ-ac)2 with the additional intensity found at ~7113.5 eV leading to a broad peak with little structure.
Figure 11:

A: Experimental HERFD data for Fe2-OH-(HBpz3)2(μ-ac)2 (blue), Fe2-oxo-(HBpz3)2(μ-ac)2 (green), AurF-P’ (red) and RNR-P (yellow). The AurF-P’ and RNR-P data are adapted from Ref. 62. B: TD-DFT calculations of Fe2-X-(HB(pz)3)2(μ-ac)2 with X = oxo (solid green), hydroxo (solid blue), peroxo (solid yellow), hydroperoxo (solid red), as well as of Fe2-X-Y-(HB(pz)3)2(ac)2 with X = hydroperoxo and Y = hydroxo (dashed grey) and oxo (dashed purple), and monodentate carboxylates. C: Their corresponding DFT optimized structures.
For additional insight, we obtained optimized structures for Fe2-OH-(HBpz3)2(μ-ac)2 and Fe2-oxo-(HBpz3)2(μ-ac)2 that agree with crystallography (Figure 11 C, left), used these as references for the hypothetical complexes Fe2-hydroperoxo-(HBpz3)2(μ-ac)2 and Fe2-peroxo-(HBpz3)2(μ-ac)2 (middle), where the P complex in RNR has been shown to be a cis-μ-1,2-peroxo by resonance Raman64 and the P’ in AurF a cis-μ-1,2-hydroperoxo from NRVS,20vand calculated their TD-DFT spectra (Figure 11 B). The theoretical spectra reasonably correlate to the experimental spectra for the related biferric enzyme peroxo intermediates.
The calculated μ-peroxo complex has Fe-O distances of 1.91Å, which are shorter than the Fe-O bond length of μ-hydroxo (1.96Å) but longer than in μ-oxo (1.81Å). Consistent with these bond length trends, the observed moderate increase in the 3d(z2) intensity at ~7114.6 eV in the experimental RNR-P spectrum is therefore due to 4p(z) mixing for both Fe relative to the μ-hydroxo model complex, but much less than in the μ-oxo bridged model complex, as it is also observed in their calculated TD-DFT spectra. These results are consistent with resonance Raman results.
In going to P’ in AurF the HERFD intensity is lower than in RNR-P. This is consistent with NRVS data on P’ in AurF. In our DFT optimized structure of the μ-hydroperoxo complexe, the Fe-O distance for the non-protonated oxygen of the peroxo is the same as in the μ-hydroxo (1.95Å) while the Fe-OH distance for the protonated oxo is significantly longer (2.16Å). This leads to a ligand field (LF) splitting of the z2 peaks for each Fe with the transition to the Fe with the protonated oxygen being at lower energy, but gaining intensity through additional 4p(z) mixing. Based on the additional intensity in the HERFD spectrum of P’ in AurF at ~7113.5 eV, this LF prediction is observed in the experimental spectrum, and confirmed in the TD-DFT calculated spectrum where the d(z2) from the two FeIII splits in energy producing the new feature at ~7113.5 eV. Recent resonance Raman data on P’ in CmlI, an intermediate equivalent to P’ in AurF, have suggested that there may also be a μ-oxo bridge present in this intermediate.65 This would have a strong impact on its reaction coordinate as an oxo bridge would stabilize the biferric site against the single electron transfer computationally derived from P’ in AurF. The HERFD data in Figure 11 A for P’ in AurF refute the presence of an additional μ-oxo bridge and are alternatively consistent with a μ-hydroxo bridge in addition to the μ-1,2-hydroperoxo. Inclusion of an additional μ-oxo (dashed purple in Figure 11 B) into the μ-1,2-hydroperoxo structure leads to an intensity increase at 7114.8 eV that is not observed experimentally. Inclusion of an additional μ-hydroxo (dashed grey) leads to a two feature spectrum without the additional intensity at ~7113.5 eV.
While the above analysis of the 1s2p RIXS planes and L-edge XAS spectra of structurally aligned models allowed for a clear interpretation of the HERFD data for the corresponding peroxo intermediates, the availability of full 1s2p RIXS planes on these would have been preferred as we would have then been able to extract the DOC and therefore obtain insight into the FMOs. While for P in RNR the two Fe sites are close to equivalent, this is not the case for P’ in AurF due to protonation of the peroxo. This leads to the two peaks corresponding to the z2 transitions on each Fe in the HERFD spectra. This splitting would allow tuning into the z2 of each Fe ion by individual vertical (i.e. CIE) cuts through the RIXS plane to enhance the L-edge-like spectrum and hence the ligand field information that is associated with each Fe.
Conclusion
The 1s2p RIXS intensity of non-centrosymmetric metal systems is strongly affected by electric dipole character resulting from metal 4p mixing into the 3d orbitals. This mixing reflects the frontier molecular orbitals that are key to reactivity in metal-oxo intermediates. This strongly affects the CEE cuts and results in the 3d/4p selective enhancement of specific L-edge final states in the CIE cuts.
A methodology is developed to include the p/d mixing via covalent overlap with the ligand in the multiplet analysis of 1s2p RIXS planes and to extract DOC information from enzyme intermediates in solution, providing 1s2p RIXS data are available on relevant models. In the present study bridged biferric model RIXS data were extended to obtain structural insight into biferric non-heme peroxo enzyme intermediates and in ongoing studies will be applied on Fe(IV)=O intermediates as their oxo-Fe(IV) bond strongly affects their spectral shape in regions important to π and σ FMO contributions to reactivity.
Supplementary Material
Acknowledgement
This work was supported by the National Institutes of Health (Grant GM-40392 to E.I.S.). Use of the Stanford Synchrotron Radiation Lightsource (SSRL), SLAC National Accelerator Laboratory, is supported by the US Department of Energy (DOE), Office of Science, Office of Basic Energy Sciences under Contract DE-AC02-76SF00515. The SSRL Structural Molecular Biology Program is supported by the DOE Office of Biological and Environmental Research, and by the National Institutes of Health, National Institute of General Medical Sciences (Grant P41GM103393 to K.O.H and B.H). T.K. acknowledges financial support by the German Research Foundation (DFG) Grant KR3611/2-1. M.L.B. acknowledges the support of the Human Frontier Science Program and The Royal Society of Chemistry (RM1802-4019). M.L. acknowledges support from the Marcus and Amalia Wallenberg Foundation.
Footnotes
Supporting Information Available
The Supporting Information is available free of charge on the ACS Publications website. Additional information and details are given on the experimental methods (L-edge and 1s2p RIXS), 3d4p charge transfer multiplet simulations including a detailed description of the model, absolute intensities and used parameters, as well as details on the data fitting routines and results, additional information, details and explanations on the parameter dependence of the satellite energy position, and the full CIE/L-edge cut region is shown. Hypothetical monomer Fe-oxo model complexes are described for comparison with the Fe-oxo dimers complexes.
tacn = 1,4,7 triazacyclononane.
References
- (1).Baker ML; Mara MW; Yan JJ; Hodgson KO; Hedman B; Solomon EI Coordination Chemistry Reviews 2017, 345, 182–208. [DOI] [PMC free article] [PubMed] [Google Scholar]
- (2).Wasinger EC; de Groot FMF; Hedman B; Hodgson KO; Solomon EI Journal of the American Chemical Society 2003, 125, 12894–12906. [DOI] [PubMed] [Google Scholar]
- (3).Hocking RK; Wasinger EC; de Groot FMF; Hodgson KO; Hedman B; Solomon EI Journal of the American Chemical Society 2006, 128, 10442–10451. [DOI] [PubMed] [Google Scholar]
- (4).Hocking RK; Wasinger EC; Yan Y-L; deGroot FMF; Walker FA; Hodgson KO; Hedman B; Solomon EI Journal of the American Chemical Society 2007, 129, 113–125. [DOI] [PMC free article] [PubMed] [Google Scholar]
- (5).Glatzel P; Bergmann U Coordination Chemistry Reviews 2005, 249, 65–95. [Google Scholar]
- (6).Lundberg M; Kroll T; DeBeer S; Bergmann U; Wilson SA; Glatzel P; Nordlund D; Hedman B; Hodgson KO; Solomon EI Journal of the American Chemical Society 2013, 135, 17121–17134. [DOI] [PMC free article] [PubMed] [Google Scholar]
- (7).Kroll T; Hadt RG; Wilson SA; Lundberg M; Yan JJ; Weng T-C; Sokaras D; Alonso-Mori R; Casa D; Upton MH; Hedman B; Hodgson KO; Solomon EI Journal of the American Chemical Society 2014, 136, 18087–18099. [DOI] [PMC free article] [PubMed] [Google Scholar]
- (8).Westre TE; Kennepohl P; DeWitt JG; Hedman B; Hodgson KO; Solomon EI Journal of the American Chemical Society 1997, 119, 6297–6314. [Google Scholar]
- (9).Ballhausen CJ Introduction to Ligand Field Theory; McGraw-Hill Book Company, 1962. [Google Scholar]
- (10).Arrio M-A; Rossano S; Bruder C; Galoisy L; Calas G Europhysics Letters 2000, 51, 454–460. [Google Scholar]
- (11).Vercamer V; Hunault MOJY; Lelong G; Haverkort MW; Calas G; Arai Y; Hijiya H; Paulatto L; Brouder C; Arrio M-A; Juhin A Physical Review B 2017, 94, 245115. [Google Scholar]
- (12).Hunault M; Vercamer V; Haverkort MW; Arrio M-A; Brouder C; Calas G; Juhin A Journal of Physics: Conference Series 2016, 721, 012005. [Google Scholar]
- (13).Hunault MOJY; Khan W; Minar J; Kroll T; Sokaras D; Zimmermann P; Delgado-Jaime MU; de Groot FMF Inorganic Chemistry 2017, 56, 10882–10892. [DOI] [PMC free article] [PubMed] [Google Scholar]
- (14).deBeer George S; Brant P; Solomon EI Journal of the American Chemical Society 2005, 127, 667–674. [DOI] [PubMed] [Google Scholar]
- (15).Baik M; Newcomb M; Friesner R; Lippard S Chemical Reviews 2003, 103, 2385–2419. [DOI] [PubMed] [Google Scholar]
- (16).Meunier B; de Visser SP; Shaik S Chemical Reviews 2004, 104, 3947–3980. [DOI] [PubMed] [Google Scholar]
- (17).Huang X; Groves JT Chemical Reviews 2018, 118, 2491–2553. [DOI] [PMC free article] [PubMed] [Google Scholar]
- (18).Solomon EI; Light KM; Liu LV; Srnec M; Wong SD Accounts of Chemical Research 2013, 46, 2725–2739. [DOI] [PMC free article] [PubMed] [Google Scholar]
- (19).Jasniewski AJ; Que L Jr. Chemical Reviews 2018, 118, 2554–2592. [DOI] [PMC free article] [PubMed] [Google Scholar]
- (20).Park K; Li N; Kwak Y; Srnec M; Bell CB; Liu LV; Wong SD; Yoda Y; Kitao S; Seto M; Hu M; Zhao J; Krebs C; Bollinger JM Jr.; Solomon EI Journal of the American Chemical Society 2017, 139, 7062–7070. [DOI] [PMC free article] [PubMed] [Google Scholar]
- (21).Armstrong WH; Lippard SJ Journal of the American Chemical Society 1984, 106, 4632–4633. [Google Scholar]
- (22).Armstrong WH; Lippard SJ Journal of the American Chemical Society 1983, 105, 4837–4838. [Google Scholar]
- (23).Lippard SJ; Schugar HJ; Walling C Inorganic Chemistry 1967, 6, 1825–1831. [Google Scholar]
- (24).Schugar H; Walling C; Jones RB; Gray HB Journal of the American Chemical Society 1967, 89, 3712–3720. [Google Scholar]
- (25).Sokaras D; Weng T-C; Nordlund D; Alonso-Mori R; Velikov P; Wenger D; Garachtchenko A; George M; Borzenets V; Johnson B; Rabedeau T; Bergmann U Review of Scientific Instruments 2013, 84, 053102. [DOI] [PMC free article] [PubMed] [Google Scholar]
- (26).Glatzel P; Bergmann U; Yano J; Visser H; Robblee JH; Gu W; de Groot FMF; Christou G; Pecoraro VL; Cramer SP; Yachandra VK Journal of the American Chemical Society 2004, 126, 9946–9959. [DOI] [PMC free article] [PubMed] [Google Scholar]
- (27).Cowan RD The Theory of Atomic Structure and Spectra; University of California Press: Berkeley, 1981. [Google Scholar]
- (28).Butler PH Point Group Symmetry: Applications, Methods and Tables; Plenum Press: New York, 1981. [Google Scholar]
- (29).Thole BT; van der Laan G; C.Fuggle J; Sawatzky GA; Karnatak RC; Esteva J-M Physical Review B 1985, 32, 5107–5118. [DOI] [PubMed] [Google Scholar]
- (30).de Groot FMF; Kotani A Core Level Spectroscopy of Solids; CRC Press, Boca Raton, FL, 2008. [Google Scholar]
- (31).Neese F Wiley Interdisciplinary Reviews: Computational Molecular Science 2012, 2, 73–78. [DOI] [PMC free article] [PubMed] [Google Scholar]
- (32).Dirac PAM Proceedings of the Cambridge Philosophical Society 1930, 26, 376. [Google Scholar]
- (33).Weigend F; Ahlrichs R Physical Chemistry Chemical Physics 2005, 7, 3297. [DOI] [PubMed] [Google Scholar]
- (34).Weigend F Physical Chemistry Chemical Physics 2006, 8, 1057. [DOI] [PubMed] [Google Scholar]
- (35).Neese F Inorganica Chimica Acta 2002, 337, 181. [Google Scholar]
- (36).DeBeer George S; Petrenko T; Neese F The Journal of Physical Chemistry A 2008, 112, 12936–12943. [DOI] [PubMed] [Google Scholar]
- (37).DeBeer-George S; Petrenko T; Neese F Inorganica Chimica Acta (60th birthday issue of Prof. E.I. Solomon) 2008, 361, 965–972. [Google Scholar]
- (38).Chandrasekaran P; Stieber SCE; Collins TJ; Que L Jr.; Neese F; DeBeer S Dalton Transactions 2011, 40, 11070–11079. [DOI] [PMC free article] [PubMed] [Google Scholar]
- (39).Roemelt M; Beckwith MA; Duboc C; Collomb M-N; Neese F; DeBeer S Inorganic Chemistry 2012, 51, 680–687. [DOI] [PubMed] [Google Scholar]
- (40).Rees JA; Martin-Diaconescu V; Kovacs JA; DeBeer S Inorganic Chemistry 2015, 54, 6410–6422. [DOI] [PMC free article] [PubMed] [Google Scholar]
- (41).van Lenthe E; Baerends EJ; Snijders JG The Journal of Chemical Physics 1993, 99, 4597. [Google Scholar]
- (42).Wullen JV The Journal of Chemical Physics 1998, 109, 392. [Google Scholar]
- (43).Bernadotte S; Atkins AJ; Jacob CR Journal of Chemical Physics 2012, 137, 204106. [DOI] [PubMed] [Google Scholar]
- (44).List NH; Jensen JKTSHJA; Norman P Journal of Chemical Physics 2015, 142, 244111. [DOI] [PubMed] [Google Scholar]
- (45).Sørensen L; Guo M; Lindh R; Lundberg M Molecular Physics 2017, 115, 174–189. [Google Scholar]
- (46).Ray K; DeBeer-George S; Solomon EI; Wieghardt K; Neese F Chemistry - A European Journal 2007, 13, 2783. [DOI] [PubMed] [Google Scholar]
- (47).Mulliken RS The Journal of Chemical Physics 1955, 23, 1833–1840. [Google Scholar]
- (48).Tenderholt AL QMForge: Tools for Converting the Output from QM Calculations into Something More Useful. February-15-2016; http://qmforge.sourceforge.net. [Google Scholar]
- (49).Hocking RK; DeBeer George S; Raymond KN; Hodgson KO; Hedman B; Solomon EI Journal of the American Chemical Society 2010, 132, 4006–4015. [DOI] [PMC free article] [PubMed] [Google Scholar]
- (50).de Groot FMF Chemical Reviews 2001, 101, 1779–1808. [DOI] [PubMed] [Google Scholar]
- (51).Kroll T; Aristov VY; Molodtsova OV; Ossipyan YA; Vyalikh DV; Büchner B; Knupfer M Journal of Physical Chemistry A 2009, 113, 8917–8922. [DOI] [PubMed] [Google Scholar]
- (52).Thole B; van der Laan G Physical Review A 1988, 38, 1943. [DOI] [PubMed] [Google Scholar]
- (53).Kurian R; Kunnus K; Wernet P; Butorin SM; Glatzel P; de Groot FMF Journal of Physics: Condensed Matter 2012, 24, 452201. [DOI] [PubMed] [Google Scholar]
- (54).Krause MO; Oliver JH Journal of Physical and Chemical Reference Data 1979, 8, 329. [Google Scholar]
- (55).de Groot FMF; Krisch MH; Vogel J Physical Review B 2002, 66, 195112. [Google Scholar]
- (56).George SD; Brant P; Solomon EI Journal of the American Chemical Society 2005, 127, 667–674. [DOI] [PubMed] [Google Scholar]
- (57).Guo M; Sørensen LK; Delcey MG; Pinjari RV; Lundberg M Physical Chemistry Chemical Physics 2016, 18, 3250–3259. [DOI] [PubMed] [Google Scholar]
- (58).Vankó G; de Groot FMF; Huotari S; Cava RJ; Lorenz T; Reuther M arXiv 2008, 0802.2744. [Google Scholar]
- (59).Glatzel P; Mironea A; Eeckhout SG; Sikora M; Giuli G Physical Review B 2008, 77, 115133. [Google Scholar]
- (60).Juhin A; de Groot F; Vanko G; Calandra M; Brouder C Physical Review B 2010, 81, 115115. [Google Scholar]
- (61).Cabaret D; Bordage A; Juhin A; Arfaoui M; Gaudry E Physical Chemistry Chemical Physics 2010, 12, 5619. [DOI] [PubMed] [Google Scholar]
- (62).Cutsail GE; Blaesi EJ; Pollock CJ; Bollinger JM; Krebs C; DeBeer S Journal of Inorganic Biochemistry 2020, 203, 110877. [DOI] [PMC free article] [PubMed] [Google Scholar]
- (63).Yan JJ; Kroll T; Baker ML; Wilson SA; Decreau R; Lundberg M; Sokaras D; Glatzel P; Hedman B; Hodgson KO; Solomon EI Proceedings of the National Academy of Sciences 2019, 116, 2854âĂŞ2859. [DOI] [PMC free article] [PubMed] [Google Scholar]
- (64).Skulan AJ; Brunold TC; Baldwin J; Saleh L; Bollinger JM Jr.; Solomon EI Journal of the American Chemical Society 2004, 126, 8842–8855. [DOI] [PubMed] [Google Scholar]
- (65).Jasniewski AJ; Komor AJ; Lipscomb JD; Que L Jr Journal of the American Chemical Society 2017, 139, 10472–10485. [DOI] [PMC free article] [PubMed] [Google Scholar]
Associated Data
This section collects any data citations, data availability statements, or supplementary materials included in this article.