

Sleep is regulated in a homeostatic manner. Sleep deprivation increases sleep need, which is compensated mainly by increased EEG δ power during non-rapid eye movement sleep (NREMS) and, to a lesser extent, by increased sleep amount. Although genetic factors determine the constitutive level of sleep need and sleep amount in mice and humans, the molecular entity behind sleep need remains unknown.
Keywords: kinase, SIK3, sleep
Abstract
Sleep is regulated in a homeostatic manner. Sleep deprivation increases sleep need, which is compensated mainly by increased EEG δ power during non-rapid eye movement sleep (NREMS) and, to a lesser extent, by increased sleep amount. Although genetic factors determine the constitutive level of sleep need and sleep amount in mice and humans, the molecular entity behind sleep need remains unknown. Recently, we found that a gain-of-function Sleepy (Slp) mutation in the salt-inducible kinase 3 (Sik3) gene, which produces the mutant SIK3(SLP) protein, leads to an increase in NREMS EEG δ power and sleep amount. Since Sik3Slp mice express SIK3(SLP) in various types of cells in the brain as well as multiple peripheral tissues from the embryonic stage, the cell type and developmental stage responsible for the sleep phenotype in Sik3Slp mice remain to be elucidated. Here, we generated two mouse lines, synapsin1CreERT2 and Sik3ex13flox mice, which enable inducible Cre-mediated, conditional expression of SIK3(SLP) in neurons on tamoxifen administration. Administration of tamoxifen to synapsin1CreERT2 mice during late infancy resulted in higher recombination efficiency than administration during adolescence. SIK3(SLP) expression after late infancy increased NREMS and NREMS δ power in male synapsin1CreERT2; Sik3ex13flox/+ mice. The expression of SIK3(SLP) after adolescence led to a higher NREMS δ power without a significant change in NREMS amounts. Thus, neuron-specific expression of SIK3(SLP) after late infancy is sufficient to increase sleep.
SIGNIFICANCE STATEMENT The propensity to accumulate sleep need during wakefulness and to dissipate it during sleep underlies the homeostatic regulation of sleep. However, little is known about the developmental stage and cell types involved in determining the homeostatic regulation of sleep. Here, we show that Sik3Slp allele induction in mature neurons in late infancy is sufficient to increase non-rapid eye movement sleep amount and non-rapid eye movement sleep δ power. SIK3 signaling in neurons constitutes an intracellular mechanism to increase sleep.
Introduction
Sleep is a well-conserved behavior in vertebrates and invertebrates (Cirelli, 2009; Dubowy and Sehgal, 2017) and is regulated in a homeostatic manner so that the drive for sleep becomes stronger after sleep deprivation, resulting in compensatory increases in sleep intensity (Suzuki et al., 2013), which has been modeled as Process S of the two-process model (Borbély, 1982; Daan et al., 1984; Franken et al., 1991, 2001). Sleep amount is regulated under genetic control in humans and mice. Large-scale genome-wide association studies have reported several genetic loci associated with interindividual self-reported sleep duration (Dashti et al., 2019). Recently, several gene mutations were reported to be associated with human pedigrees with a short sleep phenotype (Shi et al., 2019; Xing et al., 2019). Each inbred mouse strain has a characteristic sleep time (Franken et al., 2001; Gurcel et al., 2007; Miyoshi et al., 2019). However, the molecular and neural mechanisms that determine the homeostatic regulation of sleep remain unknown.
Recently, we established the Sleepy mutant pedigree, which exhibits increases in NREM sleep (NREMS) amount and NREMS δ power (Funato et al., 2016). Sleepy mutant mice, Sik3Slp mice, have a splice mutation in the salt-inducible kinase 3 (Sik3) gene, which leads to the in-frame deletion of exon 13-encoded region that contains a protein kinase A (PKA)-phosphorylation site. This PKA site, the 551st serine residue, is crucial for increased sleep (Honda et al., 2018). Although the systemic expression of mutant SIK3 protein, SIK3(SLP), increased NREMS amount and NREMS δ power, the spatial, temporal, and cellular profiles of SIK3(SLP) responsible for the sleep phenotypes in Sik3Slp mice remain uncharacterized.
One possibility is that increased sleep in Sik3Slp mice is attributable to the expression of SIK3(SLP) outside the brain. SIK3 is expressed in various tissues, including the liver, cartilage, and blood cells, and is required for the proper development of the skeletal system, adipose tissues, and glucose/lipid metabolism (Sasagawa et al., 2012; Uebi et al., 2012), and macrophage differentiation and interleukin production (Darling et al., 2017). Sleep/wakefulness is susceptible to the effect of other organs and the systemic state of inflammation via nervous and humoral pathways (Imeri and Opp, 2009; Besedovsky et al., 2019).
The second possibility is the involvement of SIK3(SLP) in non-neural cells, such as astrocytes and microglia (Wigren and Porkka-Heiskanen, 2018). Astrocytes have been shown to modulate sleep need (Halassa et al., 2009; Pelluru et al., 2016; Haydon, 2017). Glial SIK3 affects neuronal excitability in Drosophila (H. Li et al., 2019).
Another possibility is that the sleep amount in adulthood is determined during brain development or in the early postnatal period, as observed for anxiety and depressive behaviors. It is known that events and experiences during the early postnatal period affect anxiety or depressive behaviors in adulthood (Gross et al., 2002; Uchida et al., 2010). A temporal lack of serotonin receptor 5-HT1A during the early postnatal stage, not in adulthood, enhance anxiety behavior in adult mice (Gross et al., 2002). SIK3 suppresses cyclic AMP responsive element (CRE)-dependent transcription (Takemori and Okamoto, 2008; Sonntag et al., 2018), which can alter the expression of various genes. Since Sik3 is expressed in brains as early as E13.5 (see Results), altered cyclic AMP responsive element-dependent transcription in Sik3Slp mice can affect multiple aspects of brain development, such as cell migration, neural differentiation, axon guidance, and synaptogenesis (Ehrlich and Josselyn, 2016), which may eventually increase sleep need in adulthood because sleep need can be encoded by synaptic proteins (Tononi and Cirelli, 2014; Ehrlich and Josselyn, 2016; Wang et al., 2018).
To investigate the above possibilities, we newly developed synapsin1CreERT2 and Sik3ex13flox mouse lines that enable the neuron-specific, temporally regulated expression of SIK3(SLP) with tamoxifen administration. The recombination efficiency examined using ROSA-LacZ mice was consistent with the expression patterns of synapsin1 and CreERT2 and dependent on the age of the tamoxifen-administered mice. The expression of SIK3(SLP) in neurons from late infancy led to increased sleep in adult mice.
Materials and Methods
Mice
Mice were housed under humidity- and temperature-controlled conditions on a 12:12 h light/dark cycle. Food and water were provided ad libitum. Mice were weaned at 4 weeks of age and housed in groups of 4 or 5. All mice were maintained on C57BL/6N background. The days of insemination and the day of birth are designated embryonic day 0.5 (E0.5) and postnatal day 0 (P0), respectively. RosaLacZ mouse (The Jackson Laboratory #002073; https://www.jax.org/strain/002073) (Soriano, 1999), Ai9 or RosatdTomato (The Jackson Laboratory #007909; https://www.jax.org/strain/007909) (Madisen et al., 2010) mouse lines were used. Sik3Slp mice have a single nucleotide substitution immediately after exon 13 resulting in the skipping of exon 13 that encodes well-conserved PKA site, 551st serine residue (Funato et al., 2016; Honda et al., 2018). All animal experiments in this study were approved (Protocol #180094) and conducted following the guidelines established by the Institutional Animal Care and Use Committee of the University of Tsukuba.
Generation of Sik3ex13flox/+ mice
A genomic fragment containing exon 13 (156 bp) of the Sik3 gene was isolated from a C57BL/6 mouse genomic BAC clone from an RP23 mouse genomic BAC library (Advanced GenoTechs). A 1.7 kb fragment of the FRT-PGK-neo-FRT-loxP cassette was inserted in the opposite direction after exon 13. The targeting vector also contains a loxP sequence before exon 13. The targeting vector was linearized and electroporated into the C57BL/6N ES cell line RENKA. Correctly targeted clones were injected into eight-cell stage ICR mouse embryos, which were cultured to produce blastocysts and then transferred to pseudopregnant ICR females. The resulting chimeric male mice were crossed with female C57BL/6N mice to establish the Sik3ex13flox; neo/+ line. Sik3ex13flox; neo/+ mice were crossed with Actb-Flp knock-in mice to remove the neomycin resistance gene with the Flp-FRT system to establish the Sik3ex13flox/+ line.
Generation of synapsin1CreERT2 mice
We created synapsin1CreERT2 mice as previously reported with some modifications (Sato et al., 2018) The guide RNA (gRNA) sequence that was 5′-AGGGCTGTCTAGGGGTTTAG-3′ was inserted into the entry site of pX330 (Addgene #42230; https://www.addgene.org/42230/: 42230; RRID:Addgene_42230) as described previously (Mizuno et al., 2014). For the construction of a donor vector, 2647 bp of the IRES-iCreERT2 sequence flanked by SalI and SacI sites was artificially synthesized (Eurofins Genomics) and subsequently inserted into a pBluescript II SK (–) vector. For the 5′- and 3′-arms of the targeting vector, two 2.0 kb fragments were amplified from the synapsin1 genomic DNA regions of C57BL/6N mice and then inserted into the AscI and PmeI sites of the vector using an In-Fusion HD Cloning Kit (TaKaRa), respectively. The resultant vector has the IRES-iCreERT2 sequence 22 bp downstream of the stop codon of the synapsin1a isoform. Pregnant female serum gonadotropin and human chorionic gonadotropin were intraperitoneally injected into female C57BL/6N mice (Charles River Laboratories), and unfertilized oocytes were collected from their oviducts. We then performed in vitro fertilization with these oocytes and the sperm from male C57BL/6N mice. The pX330 and donor vectors for the synapsin1 gene were microinjected into the zygote. Shortly after, survived zygotes were transferred into oviducts in pseudopregnant ICR females. The genomic DNA sequence of F0 mice was examined by PCR and direct sequencing. F0 male synapsin1CreERT2 mice were crossed with C57BL/6N females. Since the synapsin1 gene is located on the X chromosome, male synapsin1CreERT2 mice were obtained from a mating of a WT male and a synapsin1CreERT2 female.
Tamoxifen supplementation
Tamoxifen (T5648, Sigma Millipore) was prepared as a 20 mg/ml stock solution in corn oil (Wako #032-17016) (Fujiyama et al., 2009). To examine the effect of tamoxifen on adolescent and adult mice, mice were administered tamoxifen in corn oil intraperitoneally at 100 mg/kg of body weight for 5 consecutive days; 500 μg of tamoxifen at 2-3 weeks is generally equivalent to 100 mg/kg body weight. These administration protocols were determined to achieve the best recombination efficiency with minimal side effects and intervention of pup rearing according to previous reports (Chang et al., 2013; Valny et al., 2016; Jahn et al., 2018). The administration of corn oil alone was used as vehicle control. Brains were dissected 7–8 d after the last injection of tamoxifen, fixed in 4% PFA, and subjected to X-gal staining or immunohistochemistry as described below. Tamoxifen administration did not alter body weight.
RT-PCR
For checking Cre and synapsin1 expression, brains and peripheral tissues were dissected from P14 male synapsin1CreERT2; Sik3ex13flox/+ mice (see Fig. 1B). For embryonic expression of Sik3, the brains and livers were dissected from male WT E13.5 embryos under a dissecting microscope and from WT P1, P7, and P14 pups (see Fig. 3C). For expression of Sik3 exon 13 deletion allele after tamoxifen administration, brains and livers were dissected from P172 Sik3slp mouse and P90 synapsin1CreERT2; Sik3ex13flox/+ mice fter tamoxifen administration at P28, P29, P30, P31, and P32 (see Fig. 3D). Total RNA was isolated using an RNeasy Lipid Tissue Mini Kit (QIAGEN) and used for cDNA synthesis with oligo dT primers and a PrimeScript Reverse Transcriptase kit (TaKaRa). PCRs were performed using PrimeSTAR GXL DNA polymerase or TaKaRa Ex Taq (TaKaRa). The following primers were used: synapsin1-forward, 5′-GCTTCTTCTCGTCGCTGTCT-3′; synapsin1- reverse, 5′-TGCTTGTCTTCATCCTGGTG-3′; Cre-forward, 5′-TGCCCAAGAAGAAGAGGAAAGT-3′; Cre-reverse, 5′-TGGTCAAAGTCAGTGCGTTC-3′; beta-actin-forward, 5′-GACCCAGATCATGTTTGAGACCT-3′; beta-actin-reverse, 5′-ACGCAGCTCAGTAACAGTCC-3′; Sik3-forward (used in Fig. 3D), 5′-GAACAGATCTGCAGGCACAA-3′; Sik3-reverse (used in Fig. 3D), 5′-CATCCACAGGGGTAACTGCT-3′; Sik3-qS13 (used in Fig. 3C), 5′-TTGTCAATGAGGAGGCACAC-3′; Sik3-qAS23 (used in Fig. 3C), 5′- TCTTCTCCAGGGTCCTCTCA-3′.
Figure 1.
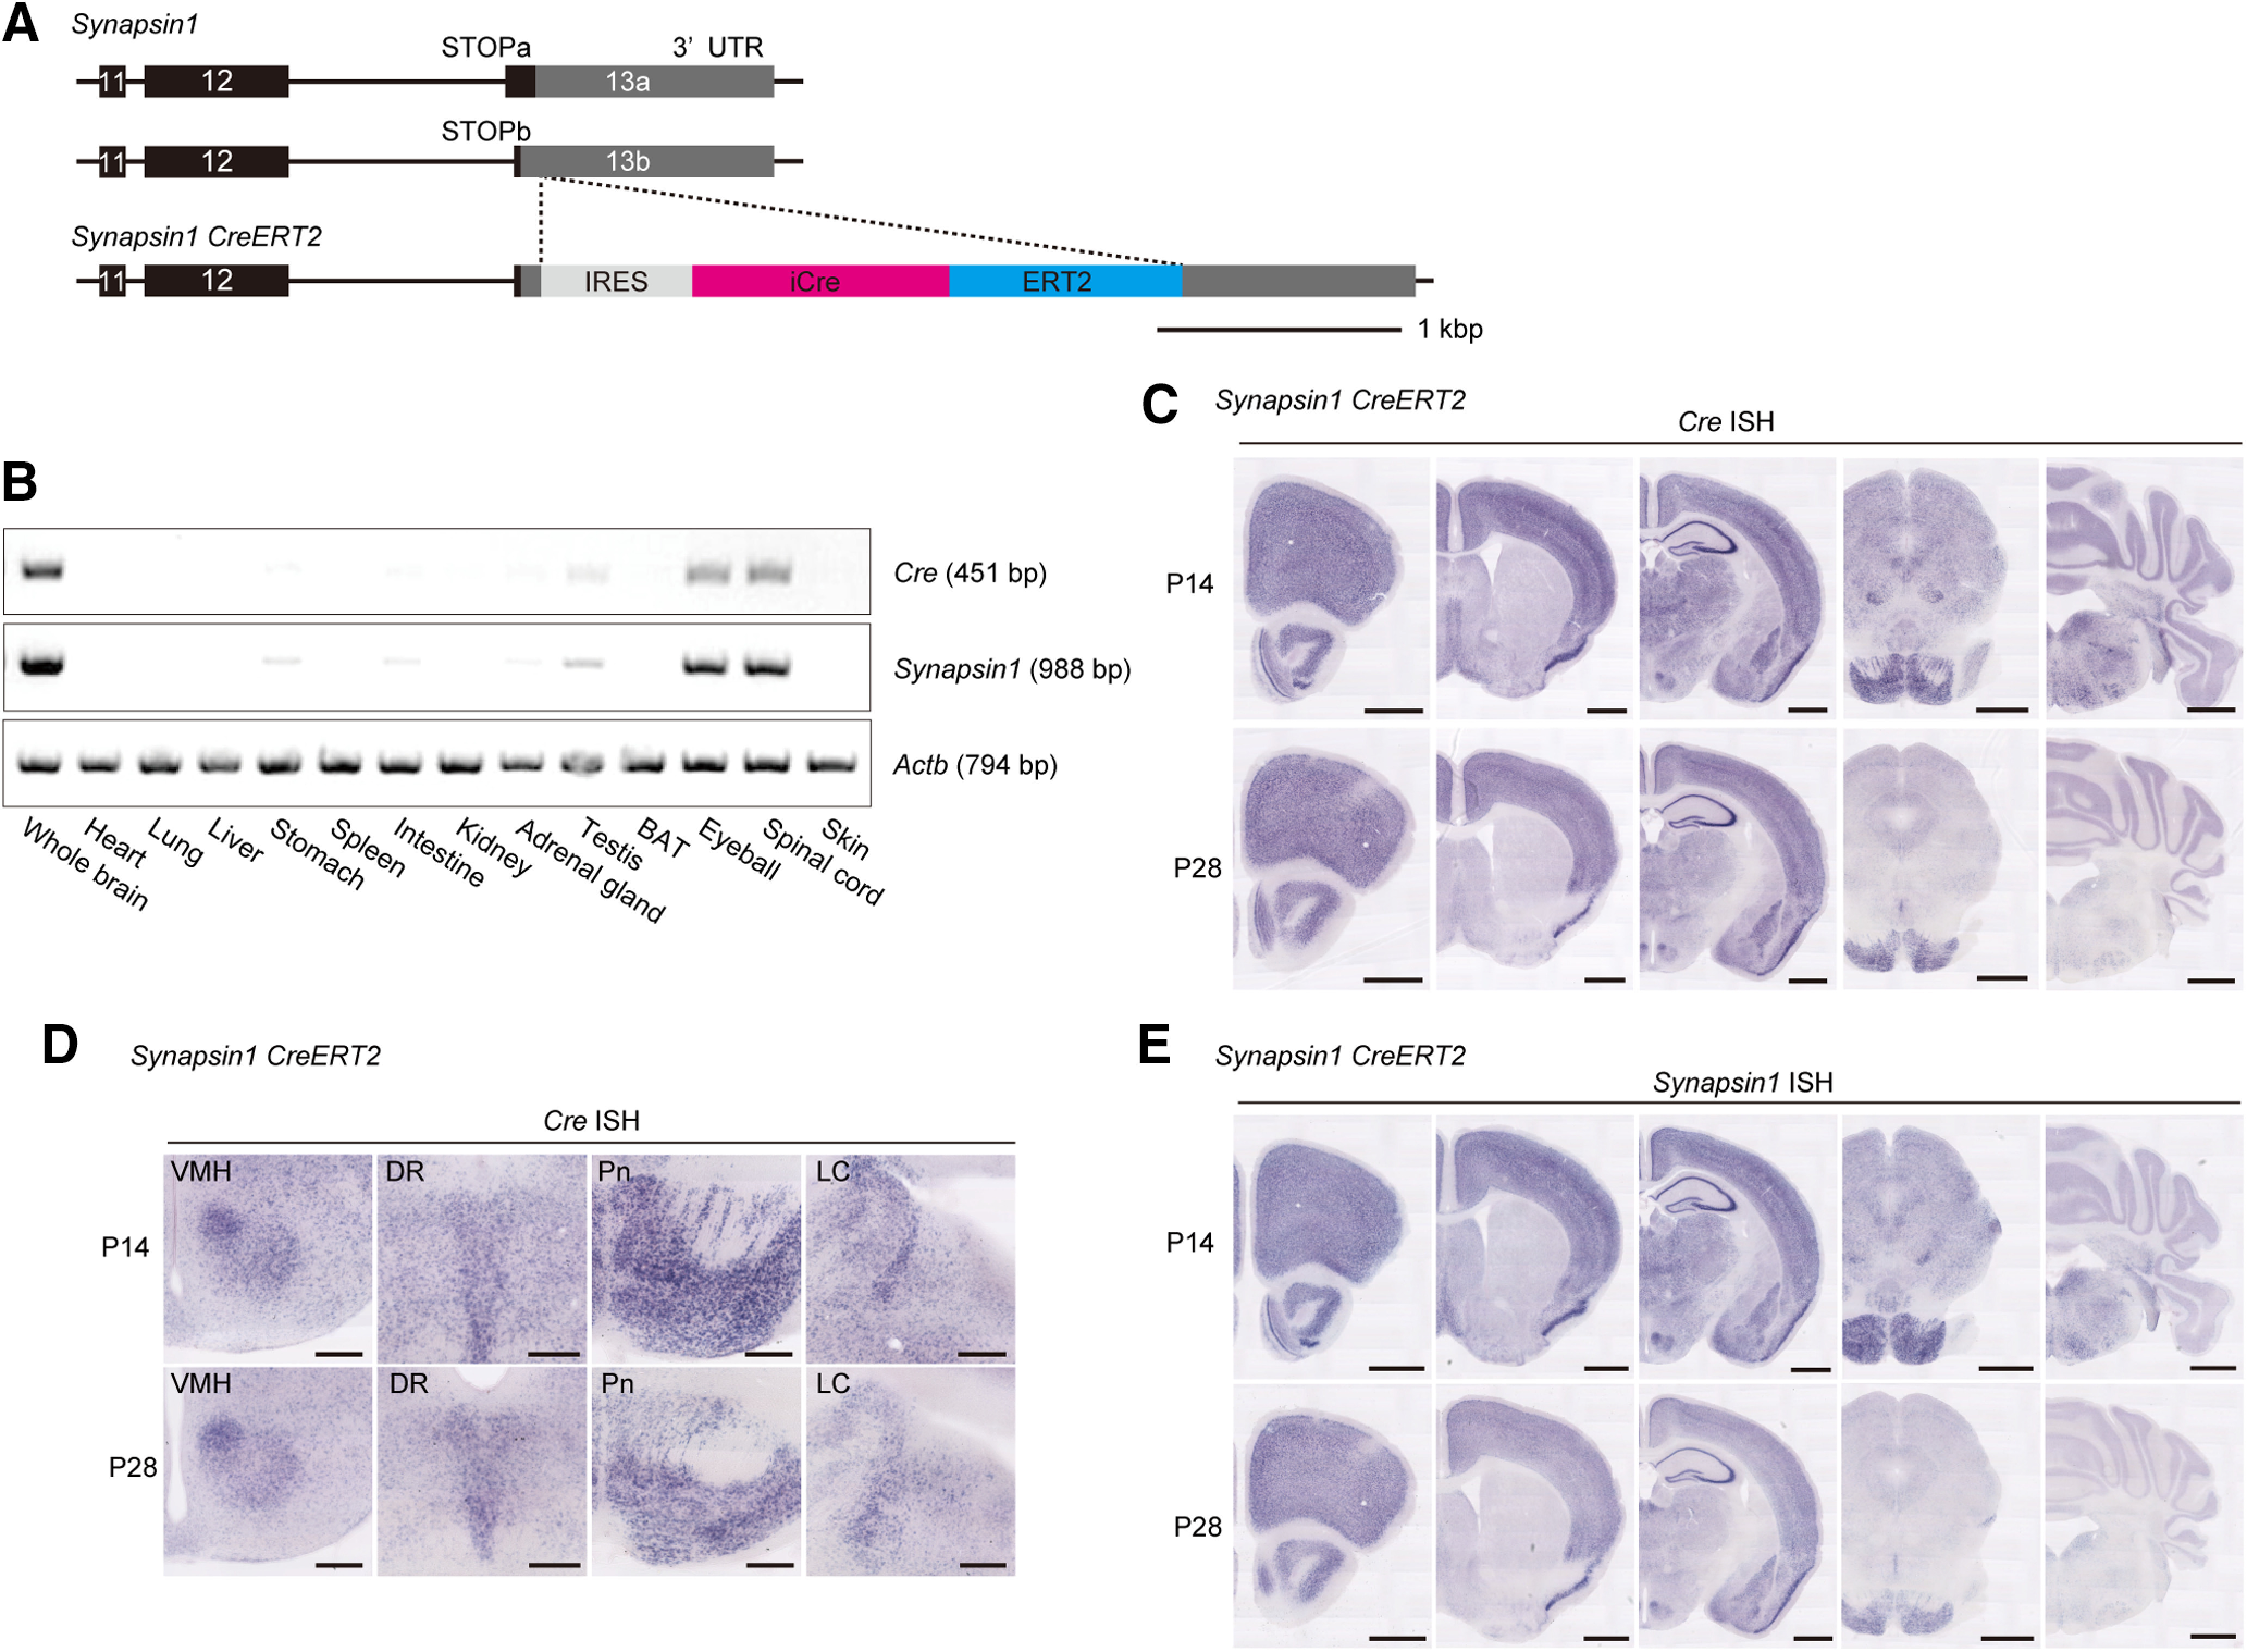
Generation and characterization of synapsin1CreERT2 mice. A, Schematic diagram of the synapsin1CreERT2 genomic construct. The last three exons of synapsin1a (top) and synapsin1b isoforms (middle) are indicated. The stop codon of synapsin1a is located behind that of synapsin1b. The IRES-iCre-ERT2 sequence was inserted after the stop codon of synapsin1a (bottom). B, RT-PCR showed Cre and synapsin1 expression in the brain, spinal cord, and eyeball of male synapsin1CreERT2 mice. β-actin (Actb) was used as a loading control. C, Representative Cre expression in the brains of male synapsin1CreERT2 mice at the ages of P14 (top) and P28 (bottom). D, Selected brain regions expressing Cre in male synapsin1CreERT2 mice at the ages of P14 (top) and P28 (bottom). E, Representative synapsin1 expression in male synapsin1CreERT2 mice at P14 (top) and P28 (bottom). DR, Dorsal raphe nucleus; LC, locus coeruleus; Pn, pontine nucleus; VMH, ventromedial hypothalamic nucleus. Scale bars: C, E, 1 mm; D, 250 μm.
Figure 3.

Tamoxifen treatment induced SIK3(SLP) expression. A, Genomic structure of the Sik3ex13flox mice (top). Cre recombinase removes the exon 13-containing regions (bottom). B, Structures of WT SIK3 protein and SIK3(SLP) protein that lacks the exon 13-encoded region. C, RT-PCR using the brains and livers of WT mice of different ages. The lower bands (asterisks) shown in the brains correspond to a minor transcript variant skipping exon 15. D, RT-PCR using the brains and livers of synapsin1CreERT2; Sik3ex13flox/+ mice treated with corn oil or tamoxifen. The cerebral cortex (Ctx) and hypothalamus (Hypo) of the tamoxifen-treated synapsin1CreERT2; Sik3ex13flox/+ mice showed shorter bands (asterisks) corresponding to Sik3(Slp) in addition to the Sik3(Wild type). Sik3Slp/Slp mouse tissues only have the shorter bands. E, Western blotting of brain homogenates. An antibody specific to SIK3(SLP) detected the protein (asterisks) in tamoxifen-administered synapsin1CreERT2; Sik3ex13flox/+ mice and Sik3Slp/Slp mice (top row). An antibody specific to the exon 13-encoded region detected WT SIK3 protein in tamoxifen- or vehicle-administered synapsin1CreERT2; Sik3ex13flox/+ mouse brains, but not in Sik3Slp/Slp mouse brains (middle row). β-tubulin was used as a loading control (bottom row).
ISH
Adult male mice were perfused transcardially with PBS followed by 4% PFA in PBS. The brains were postfixed with 4% PFA in PBS at 4°C overnight, cryoprotected in 30% sucrose in PBS for 2 d, embedded in OCT compound (Sakura Finetech), and stored at −80°C until use. The brains were cryosectioned at 60 µm thickness and stored in tissue cryoprotectant solution at −20°C. ISH was performed using digoxigenin (DIG)-labeled antisense probes. Fragment of synapsin1 cDNA was generated by RT-PCR using Ex Taq (TaKaRa) from total RNA isolated from adult C57BL/6N mouse brains with TRIzol reagent (Thermo Fisher Scientific). Fragments of iCre cDNA were generated by PCR using Ex Taq (TaKaRa) from the targeting vector. Following primers were used to generate probes: for synapsin1, 5′-GCTTCTTCTCGTCGCTGTCT-3′ and 5′-TGCTTGTCTTCATCCTGGTG-3′; for iCre: 5′-TGCCCAAGAAGAAGAGGAAAGT-3′ and 5′-TGGTCAAAGTCAGTGCGTTC-3′. The amplified fragment was cloned into pGEM-T Easy (Promega) and linearized with SpeI. The linearized plasmids were purified and used to produce DIG-labeled, single-stranded RNA probes using a DIG RNA labeling kit with T7 polymerase (Roche Diagnostics). First, tissue cryoprotectant solution was carefully removed from the brain sections by washing with PBS. The sections were treated with 4% PFA and 0.3% Triton X-100 for 15 min. Sections were then permeabilized with 1 μg/ml proteinase K for 30 min at 37°C, treated twice with 0.75% glycine for 15 min, and with 4% PFA for 5 min. The sections were acetylated with 0.25% acetic anhydride in 0.1 m triethanolamine for 15 min, prehybridized for 1-2 h at 60°C, and then hybridized overnight with a DIG-labeled probe at 60°C; after washing twice with 2× SSC/50% formamide/0.1% N-lauroylsarcosine for 20 min at 50°C, incubated with 5 μg/ml RNase A for 20 min at 37°C, and washed with 2× SSC/0.1% N-lauroylsarcosine and 0.2× SSC/0.1% N-lauroylsarcosine at 37°C for 20 min for 2 times, respectively. The sections were treated with 1% blocking reagent (Roche Diagnostics #11096176001) and incubated with alkaline phosphatase-conjugated anti-DIG Fab fragments (Roche Diagnostics #11175041910). After the sections were washed with TBST for 10 min for 3 times, the reactions were visualized with a BCIP/NBT substrate solution (Roche Diagnostics) for 2 h (synapsin1) or 6 h (iCre).
Immunohistochemistry
Adult mice were perfused with PBS followed by 4% PFA in PBS, and then brains were dissected and postfixed in 4% PFA in PBS at 4°C overnight. Fixed brains were cryoprotected in 30% sucrose in PBS for 2 d, embedded in OCT compound (Sakura Finetech), and frozen at −80°C. The brains were cryosectioned at 40 µm thickness and stored in tissue cryoprotectant solution at −20°C. For double immunostaining of β-galactosidase and NeuN, the sections of male synapsin1CreERT2; RosaLacZ/+ mice were rinsed with PBS and incubated in 1% Block Ace (Snow Brand Milk Products) in PBS with 0.1% Tween 20 (0.1% PBST) for 2 h at room temperature. This procedure was followed by overnight incubation with mouse anti-β-galactosidase (1:500; Promega #Z3783) and rabbit anti-NeuN (1:5000; Abcam #EPR12763) in 0.4% Block Ace in 0.1% PBST overnight at 4°C. The sections were rinsed with PBS and then incubated with AlexaFluor-488 donkey anti-mouse IgG (1:1000; Thermo Fisher Scientific #A-21202; RRID:AB_141607) and AlexaFluor-594 donkey anti-rabbit lgG (1:000; Thermo Fisher Scientific #A-21207; RRID:AB_141637) in 0.4% Block Ace in 0.1% PBST for 2 h at room temperature. Immunohistochemistry of GFAP and Iba1 was performed as described previously (Iwasaki et al., 2018). Sections of female synapsin1CreERT2; RosatdTomato/+ mice were rinsed with PBS and mounted with Vectashield mounting medium with DAPI (Vector Lab, #H-1200; RRID:AB_2336790). The primary antibodies used were as follows: rabbit anti-GFAP (1:1000; Dako #Z0334) and rabbit anti-Iba1 (1:500; Wako #019-91741). The secondary antibody was Fluor-488 goat anti-rabbit IgG (1:1000; Thermo Fisher Scientific #A-11008; RRID:AB_143165). Fluorescence imaging was conducted using an LSM 780/800 confocal microscope system (Carl Zeiss).
X-Gal staining
Detection of β-galactosidase activity using X-gal was performed as previously described (Fujiyama et al., 2009, 2018). Adult brains and tissues were perfused with PBS followed by 4% PFA in PBS and postfixed with 4% PFA at 4°C overnight. The brains were cryoprotected in 30% sucrose in PBS, embedded in OCT compound (Sakura Finetek), and stored at −80°C until use. The brains of male synapsin1CreERT2; RosaLacZ/+ mice were cryosectioned coronally at a thickness of 40 μm and stored in tissue cryoprotectant solution at −20°C. After several washes with PBS, fixed tissues were incubated in the X-gal solution (0.05% X-gal, 1 mm MgCl2, 3 mm K4Fe(CN)6, 3 mm K3Fe(CN)6, and 0.1% Triton X-100 in PBS) at 37°C for 24 h. Stained samples were washed with PBS. After mounting and drying, nuclear fast red staining was performed. Bright-field imaging was conducted using a NanoZoomer XR (Hamamatsu).
Western blot
The brains of male Sik3Slp/Slp mice, Sik3ex13flox/+ mice and synapsin1CreERT2; Sik3ex13flox/+ mice were quickly dissected after cervical dislocation. Brains were homogenized using a rotor-stator homogenizer (PRO Scientific) in ice-cold lysis buffer [50 mm Tris-HCl, pH 7.6, 150 mm NaCl, 1× PhosSTOP (Roche Diagnostics), 1 mm EDTA, 1× protease inhibitor (Roche Diagnostics)], and then centrifuged at 14,000 rpm at 4°C. Protein concentrations were determined by micro BCA assay (Thermo Fisher Scientific); 50 μg of protein in each sample was subjected to SDS-PAGE (7% acrylamide) and transferred to PVDF membranes. Blots were subsequently washed in TBST and incubated overnight at 4°C with the primary antibody in TBST with 5% BSA. The following antibodies were used for immunoblotting: rabbit anti-SIK3(SLP) (1:2000; immunized using a peptide, QLEYKAVPA, by Eurofins), rabbit anti-SIK3 Exon13 (1:2000) (Honda et al., 2018), and rabbit anti-β-tubulin (1:1000; #2128; Cell Signaling Technology). The blots were then washed and incubated with HRP-conjugated, donkey anti-rabbit IgG (1:2000 dilution in TBST with 5% BSA; Jackson ImmunoResearch Laboratories; RRID:AB_2307391). After washing, the blots were exposed to Clarity Western ECL Substrate (Bio-Rad). Chemiluminescence signaling was detected using FUSION Solo 6S.EDGE (Vilber-Lourmat).
EEG/EMG electrode implantation surgery
At 8-9 weeks of age, male mice were anesthetized with isoflurane, and the cranium was exposed. Each mouse was implanted with an EEG/EMG electrode containing four electrode pins and two flexible stainless-steel wires as reported previously (Miyoshi et al., 2019). The electrode pins were lowered to the dura under stereotaxic control, and the electrode socket was subsequently attached to the skull with dental cement (3M ESPE, RelyX U200 Unicem Syringe Dental Resin Cement). Two ipsilateral pins (AP: 0.5 mm, ML: −1.27 mm, DV: −1.3 mm; and AP: −4.5 mm, ML: −1.27 mm, DV: −1.3 mm) were used for the EEG recording. For the EMG recording, two stainless wires were inserted into the neck extensor muscles. All mice were allowed at least 7 d for recovery from the surgery. After the recovery period, all mice were attached to a tether cable and then allowed habituation to the recording conditions at least for 7 d.
EEG/EMG recording and analysis
EEG/EMG signaling was obtained and analyzed as previously described with some modifications (Miyoshi et al., 2019). The recording room was kept under a 12:12 h light/dark cycle and constant temperature (24°C-25°C). The EEG/EMG signals were amplified, filtered (EEG: 0.3-300 Hz; EMG: 30-300 Hz) with a multichannel amplifier (NIHON KODEN, #AB-611J), and digitized at a sampling rate of 250 Hz using an analog-to-digital converter (National Instruments #PCI-6220). The EEG/EMG data were visualized and semiautomatically analyzed by MATLAB (The MathWorks)-based software followed by visual inspection. Each 20 s epoch was staged into wakefulness, NREMS, and REMS. Wakefulness was scored based on the presence of low-amplitude, fast EEG activity, and high-amplitude, variable EMG activity. NREMS was characterized by high- amplitude, δ (1-4 Hz)-frequency EEG waves and low EMG tonus, whereas REMS was staged based on theta (6-9 Hz)-dominant EEG oscillations and EMG atonia. The total time spent in wakefulness, NREMS, and REMS was derived by summing the total number of 20 s epochs in each state. Epochs that contained movement artifacts were included in the state totals but excluded from subsequent spectral analysis. EEG signals were subjected to FFT analysis from 1 to 30 Hz with a 1 Hz bin using MATLAB-based custom software. The EEG power density in each frequency bin was expressed as a percentage of the sum of 16-30 Hz bins EEG power of all sleep/wake states. For total time spent in each vigilance stage, 20 s epoch analysis yielded similar results to 4 s epoch analysis (total wake time: t(24) = 0.887, p = 0.384, Student's t test; total NREMS time: t(24) = −1.138, p = 0.266, Student's t test; total REMS time: t(24) = 1.063, p = 0.298, Student's t test, tamoxifen-administered synapsin1CreERT2; Sik3+/+ mice, n = 9). However, 4 s epoch analysis resulted in shorter episode duration compared with 20 s epoch staging (wake: t(14.253) = −8.476, p = 6.10 × 10⁻⁷, Welch's t test; NREMS: t(18.677) = −15.729, p = 3.17 × 10⁻¹², Welch's t test; REMS: t(24) = −4.768, p = 7.5 × 10⁻⁵, Student's t test).
For sleep deprivation, we performed sleep-deprived for 6 h from the onset of the light phase, ZT0, by gentle handling, which allowed mice to sleep for only 1 min during sleep deprivation (Suzuki et al., 2013). Mice expressing SIK3(SLP) remained awake during sleep deprivation, similar to WT mice, consistent with the fact that Sik3Slp mice exhibited similar wake responses to environmental stimuli as WT mice (Funato et al., 2016). Relative δ density over the sum of 1-30 Hz bins during NREMS during ZT6-ZT9 was calculated for both the basal recording and after 6 h sleep deprivation. During sleep deprivation, food and water were available. EEG power density was calculated as described above. NREMS δ power change was calculated as hourly average of δ power divided by the average of δ power at ZT11 of the basal recording.
Process S simulation
According to the two-process model of sleep regulation, the homeostatic Process S consists of an increasing and a decreasing exponential process during wakefulness and sleep, respectively (Borbély, 1982; Daan et al., 1984), which was modeled by a saturating exponential function (Franken et al., 1991, 2001; Huber et al., 2000). Time course of Process S was calculated iteratively by assuming that it increases according to an exponential saturating function (Eq. 1) during wakefulness or REMS and decreases according to an exponential function (Eq. 2) during NREMS (Franken et al., 2001, 2006).
and are values of S for consecutive epochs. Ti is the time constant of the increasing exponential saturating function with an upper asymptote (UA), and Td is the time constant of the decreasing exponential function with a lower asymptote (LA). dt is the time step of the iteration (epoch duration). UA was set to the 99% level of δ power during NREMS, and LA was set to the intercept of δ power distribution of REMS and NREMS by use of Kernel density estimation (Franken et al., 2001, 2006). EEG data of the basal recording from ZT0 for 24 h followed by 6 h sleep deprivation and subsequent recording for 18 h were used. All epochs of NREMS were combined, and the median δ power was calculated every 20 min, which was used for determining the parameters (Ti, Td) to minimize the mean square of the difference between empirical data and simulation. The median δ power of the first 20 min of the combined NREMS was determined as an initial value of S (S0). To save computational effort, initially, the best combination of Ti and Td was selected for a range of Ti (0-25 h, 1 h step) and Td (0-25 h, 0.25 h step), and then further optimized with finer steps (0.1 h step for both Ti and Td) within the 2 h around the initial combination of time constants. The goodness of the fit was assessed by the sum of the square of residuals. The simulation was performed using Python 3.7. Hourly average of Process S was expressed as absolute power (see Fig. 8F,G) and normalized power, which was divided by the power of Process S during the last 4 h of the light phase of the basal recording.
Figure 8.
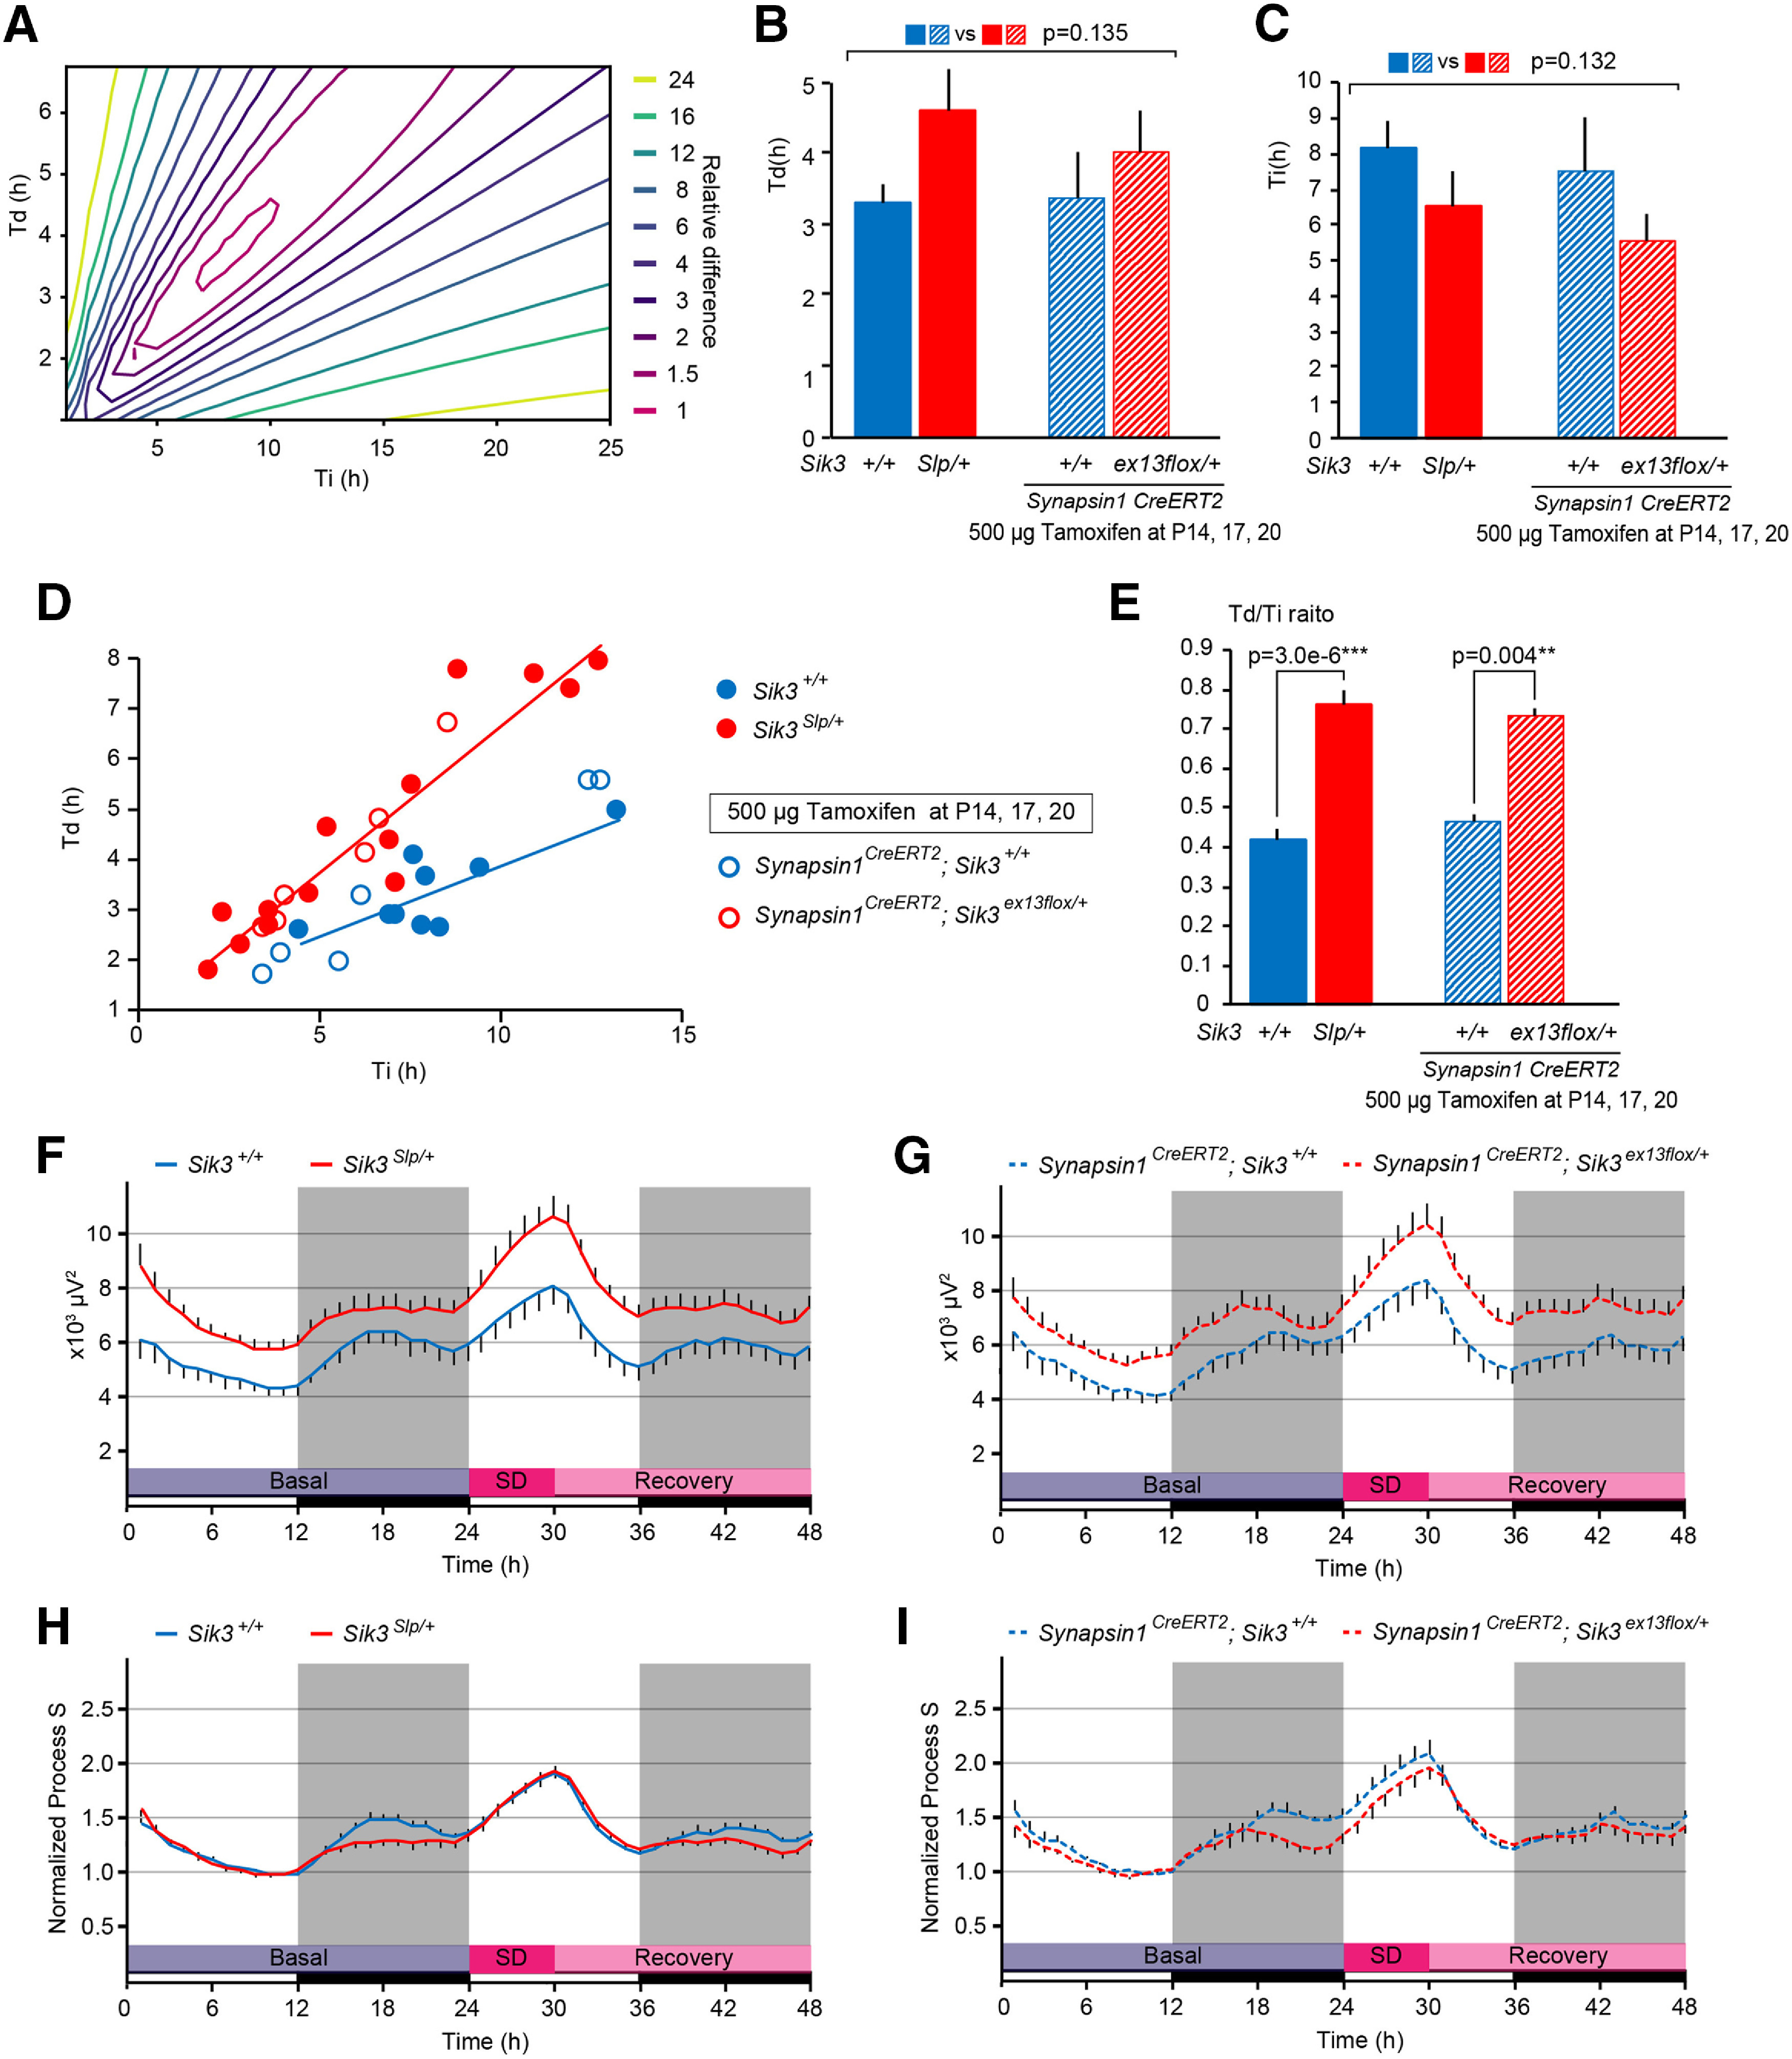
Sleep need dynamics of SIK3(SLP)-expressing mice. A, Representative contour plot of the sum of square of differences between simulated Process S and empirical data as a function of an increasing (Ti) and a decreasing (Td) constant. B, Td of Sik3+/+, Sik3Slp/+, synapsin1CreERT2; Sik3+/+, and synapsin1CreERT2; Sik3ex13flox/+ mice. Two-way ANOVA. C, Ti of Sik3+/+, Sik3Slp/+, synapsin1CreERT2; Sik3+/+, and synapsin1CreERT2; Sik3ex13flox/+ mice. Two-way ANOVA. D, Scatter plot of Ti and Td of Sik3+/+, Sik3Slp/+, synapsin1CreERT2; Sik3+/+, and synapsin1CreERT2; Sik3ex13flox/+ mice. Regression lines were drawn for Sik3+/+ (n = 9, R2 = 0.6376) and Sik3Slp/+ (n = 14, R2 = 0.8839) mice. E, Td/Ti ratios of Sik3+/+, Sik3Slp/+, synapsin1CreERT2; Sik3+/+, and synapsin1CreERT2; Sik3ex13flox/+ mice. Two-way ANOVA followed by Tukey's test. F, Simulated Process S for Sik3+/+ and Sik3Slp/+ mice. Sik3+/+ mice (n = 9), Sik3Slp/+ mice (n = 14). G, Simulated Process S for synapsin1CreERT2; Sik3+/+, and synapsin1CreERT2; Sik3ex13flox/+ mice. Synapsin1CreERT2; Sik3+/+ mice (n = 6), synapsin1CreERT2; Sik3ex13flox/+ mice (n = 6). H, Simulated Process S normalized by that during the last 4 h of the light phase of the basal recording for Sik3+/+ and Sik3Slp/+ mice. Sik3+/+ mice (n = 9), Sik3Slp/+ mice (n = 14). I, Simulated Process S normalized by that during the last 4 h of the light phase of the basal recording for synapsin1CreERT2; Sik3+/+, and synapsin1CreERT2; Sik3ex13flox/+ mice. Synapsin1CreERT2; Sik3+/+ mice (n = 6), synapsin1CreERT2; Sik3ex13flox/+ mice (n = 6). **p < 0.01. ***p < 0.001. Data are group mean ± SEM.
Experimental design and statistical analysis
The sample size was determined using Python 3.6 based on averages and SDs that were obtained in previous studies (Funato et al., 2016; Honda et al., 2018). The experimenters were blinded to genotypes and treatment assignments. Statistical analyses were performed using SPSS Statistics 26 (IBM). q values used in Tukey's test were calculated with R. All data were tested for Gaussian distribution and variance. Homogeneity of variance was tested with Levene's test. We used Student's t test for pairwise comparisons, one-way repeated-measures ANOVA for multiple comparisons with multiple data points, and two-way ANOVA for multiple comparisons involving two independent variables. ANOVAs were subjected to Tukey's test. When deviation from normality or lack of homogeneity of variances occurred (p < 0.05), Welch's t test was used for pairwise comparison. p < 0.05 was considered statistically significant.
Results
Earlier administration of tamoxifen led to higher recombination efficiency in synapsin1CreERT2 mice
To express SIK3(SLP) protein in neurons from a specific developmental stage, we generated two mouse lines: synapsin1CreERT2 (Fig. 1A) and Sik3ex13flox mice (see Fig. 3A). Synapsin1CreERT2 mice have an IRES-Cre-ERT2 sequence after the stop codon of synapsin1 (Fig. 1A) and show strong expression of Cre in the brain and spinal cord and low expression in other peripheral tissues, such as the testis, stomach, intestine, and adrenal gland (Fig. 1B). At P14, Cre ISH showed broad and strong expression in the cerebral cortex, thalamus, hypothalamus, and brainstem with moderate expression in the striatum and several brain stem regions in synapsin1CreERT2 mice (Fig. 1C). At P28, Cre was expressed strongly in the cerebral cortex, hippocampus, and thalamus but moderately or weakly in the hypothalamus and brainstem compared with P14, except for the ventromedial hypothalamic nucleus, raphe nuclei, pontine nucleus, and locus coeruleus (LC) (Fig. 1D). The age-dependent decrease in Cre expression recapitulated synapsin1 expression in synapsin1CreERT2 mice (Fig. 1E).
Next, we examined tamoxifen-dependent recombination efficiency after administrations at the late infancy and adolescence stages of synapsin1CreERT2; ROSALacZ/+ mice. When the mice received three intraperitoneal injections of 500 μg tamoxifen during late infancy (P14, P17, and P20), the synapsin1CreERT2; ROSALacZ/+ mice showed strong β-galactosidase expression in the cerebral cortex, hippocampus, basal ganglia, thalamus, hypothalamus, and cerebellum with mild expression in the caudoputamen (Fig. 2A). Whereas β-galactosidase expression tended to be low in the brainstem, strong expressions were observed in the pontine nuclei, dorsal raphe nucleus, locus coeruleus, nucleus ambiguous, dorsal motor nucleus of the vagus nerve, parasolitary nucleus, and lateral reticular nucleus (Fig. 2B). The β-galactosidase activity was also detected in the retina and several peripheral tissues, including the adrenal medulla, neural cells in the stomach and intestine walls, and several cells in the seminiferous tubules of the testis (data not shown).
Figure 2.
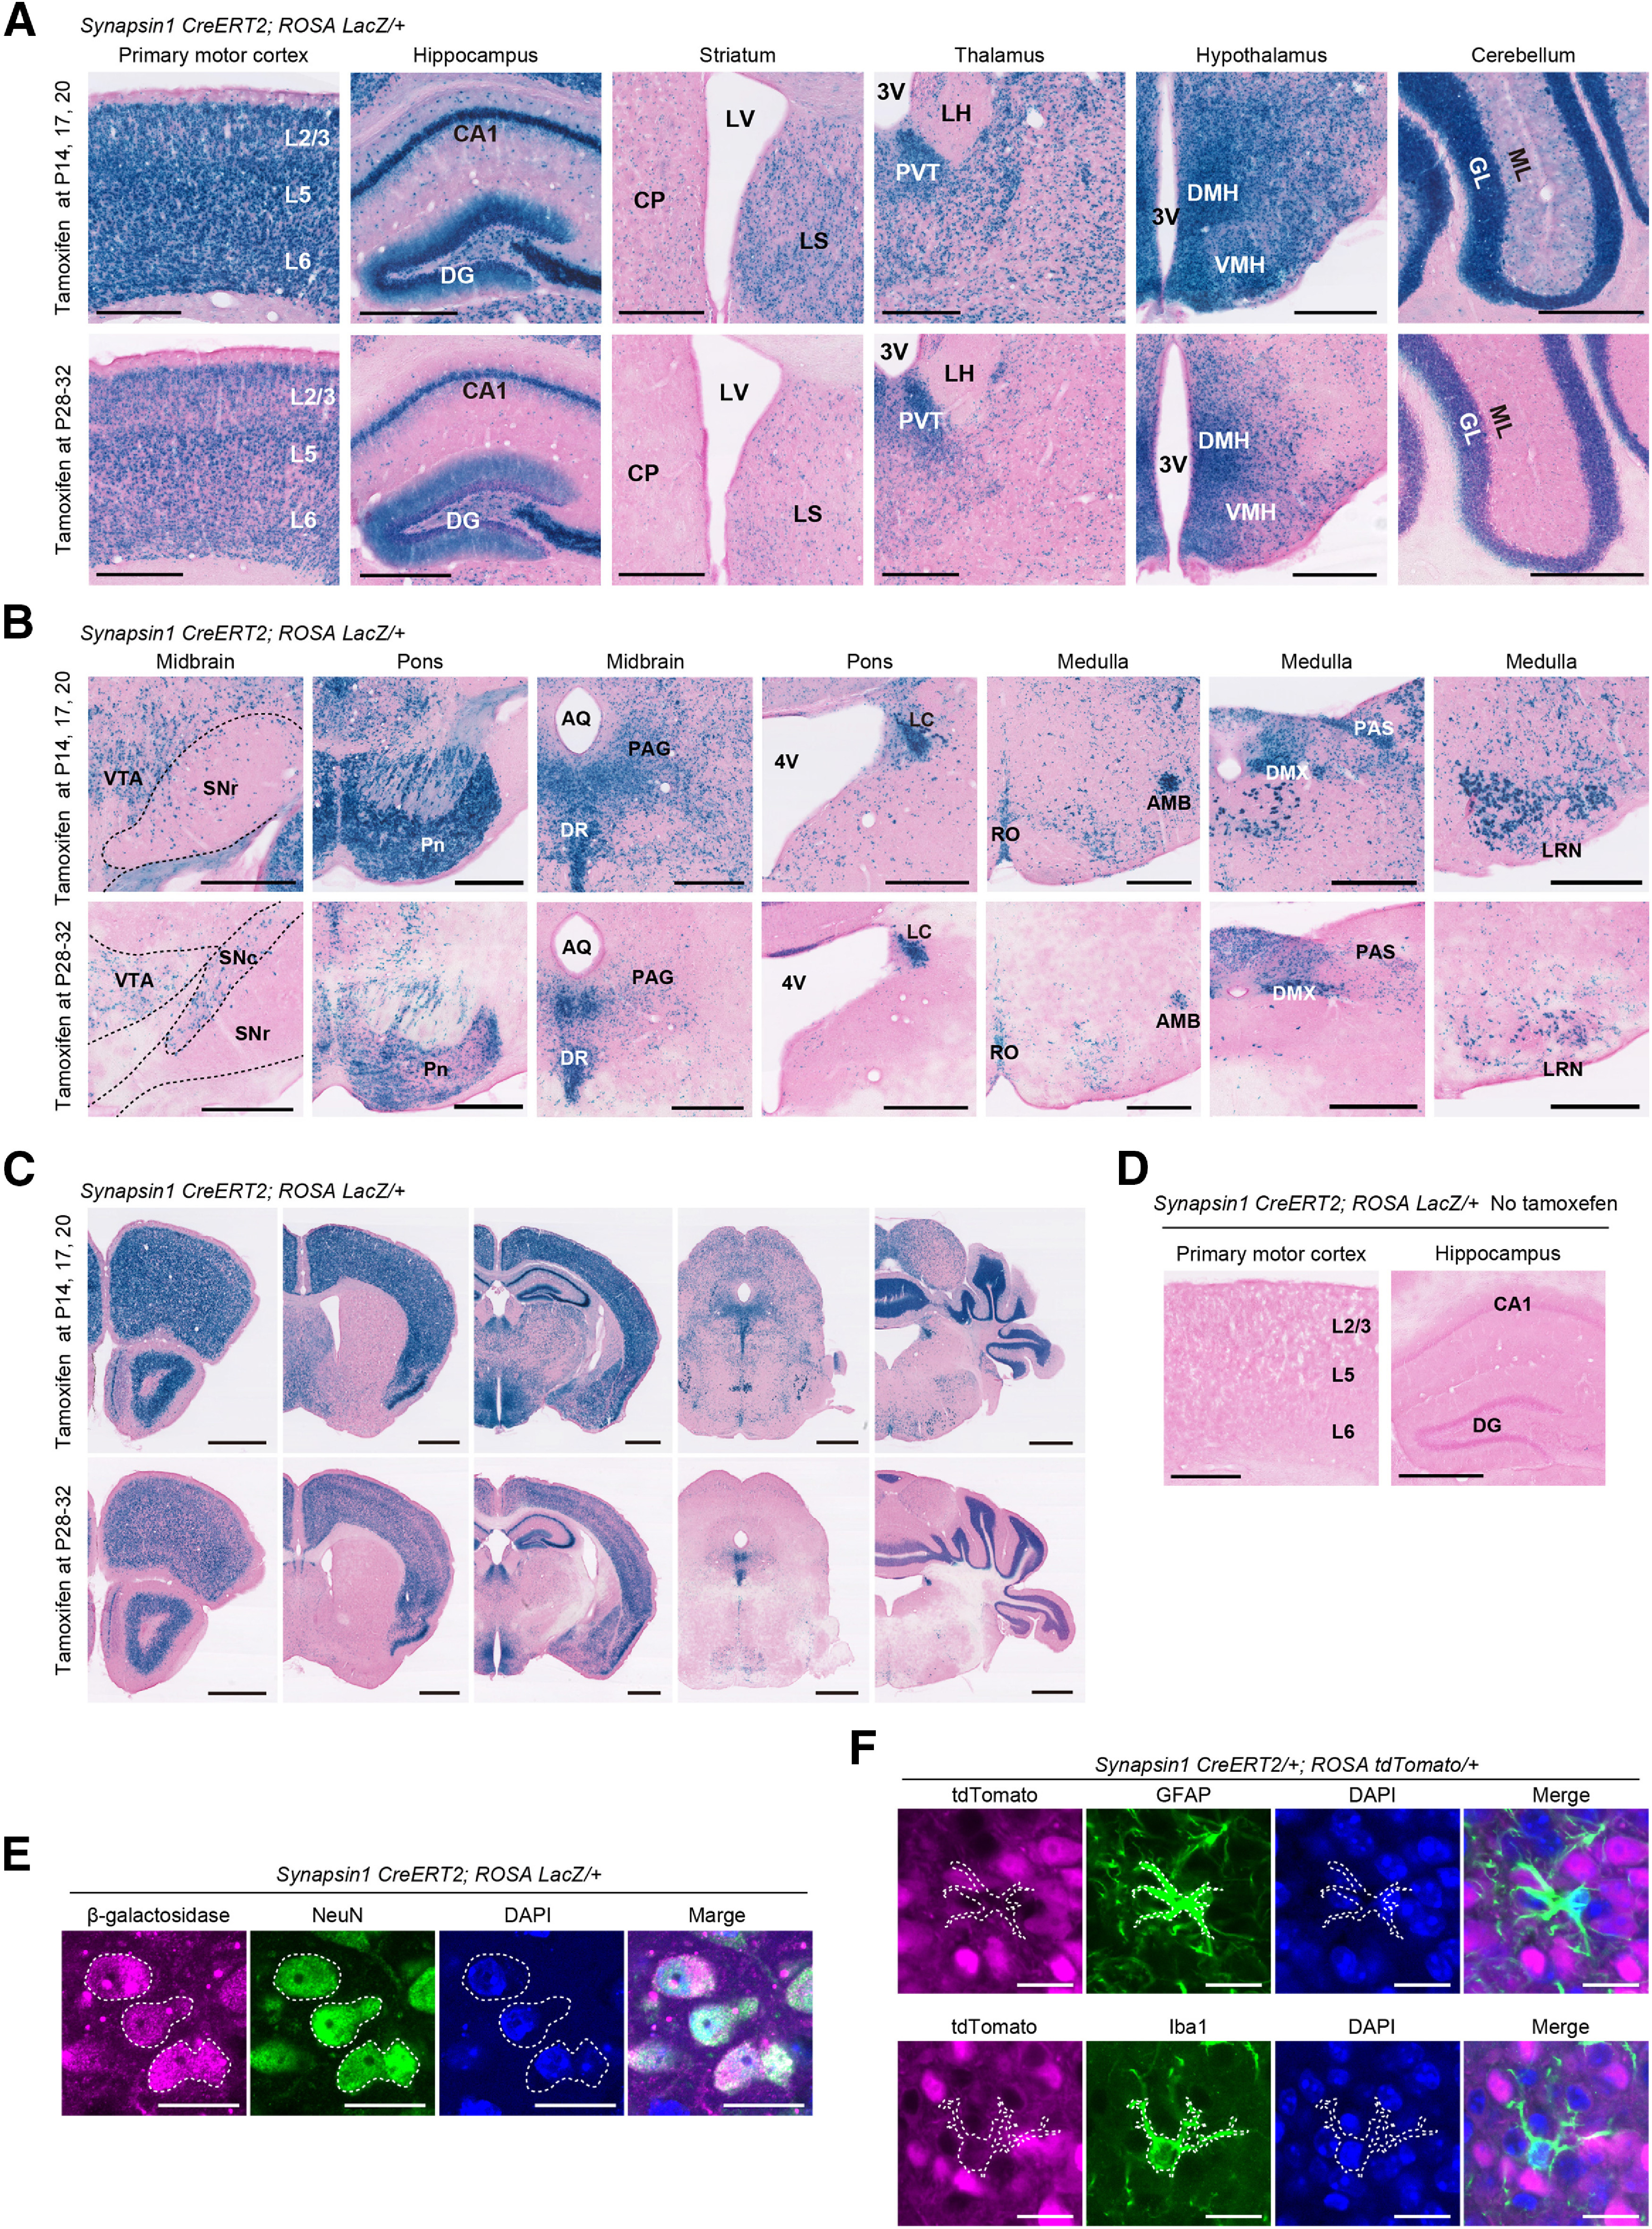
Tamoxifen-dependent recombination in synapsin1CreERT2 mice. A, B, X-gal staining of various brain regions in male synapsin1CreERT2; RosaLacZ/+ mice administered tamoxifen during late infancy at P14, P17, and P20 (top) and during adolescence at P28, P29, P30, P31, and P32 (bottom). The brains were harvested 7-8 d after the last tamoxifen administration. C, Low-magnification X-gal staining images of coronal brain sections in male synapsin1CreERT2; RosaLacZ/+ mice administered tamoxifen during late infancy at P14, P17, and P20 (top), and during adolescence at P28, P29, P30, P31, and P32 (bottom). D, X-gal staining of primary motor cortex and hippocampus in male synapsin1CreERT2; RosaLacZ/+ mice without the administration of tamoxifen. E, Intraperitoneal tamoxifen injection (100 mg/kg, 5 times at P28, P29, P30, P31, and P32) induced β-galactosidase expression in the arcuate nucleus of male synapsin1CreERT2; RosaLacZ/+ mice (leftmost). β-galactosidase-expressing cells overlap with NeuN-positive cells (white dotted line). F, Intraperitoneal tamoxifen injection (100 mg/kg, 5 times at P59, P60, P61, P62, and P63) induced tdTomato expression in the arcuate nucleus of female synapsin1CreERT2/+; RosatdTomato/+ mice (leftmost). tdTomato-expressing cells did not overlap with GFAP-positive cells (white dotted line, top row) or IbaI-positive cells (white dotted line, bottom row). Scale bars: A, B, D, 500 μm; C, 1 mm; E, F, 20 μm. AMB, Nucleus ambiguus; AQ, cerebral aqueduct; CP, caudoputamen; DG, dentate gyrus; GL, granular layer; DMH, dorsomedial hypothalamus; DMX, dorsal motor nucleus of the vagus nerve; DR, dorsal raphe nucleus; LC, locus coeruleus; LH, lateral habenula; LRN, lateral reticular nucleus; LS, lateral septum; LV, lateral ventricle; ML, molecular layer; PAG, periaqueductal gray; PAS, parasolitary nucleus; Pn, pontine nucleus; PVT, paraventricular thalamus; RO, raphe obscurus; SNr, substantia nigra pars reticulata; VMH, ventromedial hypothalamus; VTA, ventral tegmental area.
In the second protocol, when the mice received five intraperitoneal injections of 100 mg/kg tamoxifen during adolescence (P28, P29, P30, P31, and P32), the numbers of X-gal spots in brain regions were smaller than those observed following administration at late infancy (Fig. 2C). However, brain regions, including the medial hypothalamus, dorsal raphe nucleus, LC, nucleus ambiguous, and dorsal motor nucleus of the vagus nerve, showed similar levels of X-gal expression between late infancy and adolescence (Fig. 2A,B). No X-gal spots were observed in synapsin1CreERT2; ROSALacZ/+ mice without tamoxifen supplementation, indicating tight control of Cre recombinase activity in synapsin1CreERT2 mice (Fig. 2D).
Neuron-specific Cre recombination was confirmed by colocalization of β-galactosidase and NeuN expressions in tamoxifen-administered synapsin1CreERT2; ROSALacZ/+ mice (Fig. 2E), and the lack of tdTomato expression in GFAP-positive astrocytes or Iba1-positive microglia in tamoxifen-administered synapsin1CreERT2/+; ROSAtdTomato/+ mice (Fig. 2F).
Tamoxifen administration induced SIK3(SLP) expression in synapsin1CreERT2; Sik3ex13flox/+ mice
We generated a Sik3ex13flox/+ mouse line in which Sik3 exon 13 is flanked with loxP sequences (Fig. 3A). Sik3ex13flox/+ mice enable the Cre recombinase-dependent expression of SIK3(SLP) protein that lacks the exon 13-encoded region (Fig. 3B). RT-PCR confirmed Sik3 mRNA expression in the brain and liver as early as E13.5 in WT embryos (Fig. 3C). The administration of tamoxifen in synapsin1CreERT2; Sik3ex13flox/+ mice led to the expression of Sik3(Slp) mRNA in the brain but not the liver, which was not observed in vehicle-administered mice (Fig. 3D). The administration of tamoxifen in synapsin1CreERT2; Sik3ex13flox/+ mice at either late infancy or adolescence resulted in the appearance of SIK3(SLP) and a decrease in WT SIK3 protein in the brains, which was detected with anti-SIK3 exon 13 antibody (Fig. 3E).
Tamoxifen administration during late infancy increased NREMS
We confirmed that vehicle-administered synapsin1CreERT2; Sik3ex13flox/+ mice showed similar sleep/wake behavior as vehicle-administered synapsin1+; Sik3ex13flox/+ mice. The two groups of vehicle-administered mice showed similar time spent in wake (synapsin1+; Sik3ex13flox/+ mice: 711.1 ± 21.4 min for 24 h, 203.7 ± 6.9 min during the light phase, 507.4 ± 20.1 min during the dark phase; synapsin1CreERT2; Sik3ex13flox/+ mice: 690.8 ± 10.9 min for 24 h, 199.2 ± 6.9 min during the light phase, 491.6 ± 9.7 min during the dark phase; F(1,72) = 1.301, p = 0.258, two-way ANOVA), NREMS (synapsin1+; Sik3ex13flox/+ mice: 649.7 ± 18.6 min for 24 h, 453.4 ± 5.8 min during the light phase, 196.3 ± 18.2 min during the dark phase; synapsin1CreERT2; Sik3ex13flox/+ mice: 670.7 ± 12.2 min for 24 h, 458.3 ± 6.9 min during the light phase, 212.4 ± 9.2 min during the dark phase; F(1,72) = 1.65, p = 0.203, two-way ANOVA) and REMS (synapsin1+; Sik3ex13flox/+ mice: 79.3 ± 4.2 min for 24 h, 62.9 ± 3.2 min during the light phase, 16.3 ± 2.1 min during the dark phase; synapsin1CreERT2; Sik3ex13flox/+ mice: 78.5 ± 3.3 min for 24 h, 62.4 ± 3.2 min during the light phase, 16.1 ± 1.0 min during the dark phase; F(1,72) = 0.042, p = 0.839, two-way ANOVA), and EEG spectral profiles, except for the δ power during REMS (δ during wake: 1.430 ± 0.053 in synapsin1+; Sik3ex13flox/+ mice, 1.539 ± 0.049 in synapsin1CreERT2; Sik3ex13flox/+ mice, t(24) = 1.442, p = 0.162, Student's t test; theta during wake: 0.954 ± 0.027 in synapsin1+; Sik3ex13flox/+ mice, 0.998 ± 0.032 in synapsin1CreERT2; Sik3ex13flox/+ mice, t(24) = 1.026, p = 0.315, Student's t test; δ during NREMS: 4.239 ± 0.190 in synapsin1+; Sik3ex13flox/+ mice, 4.348 ± 0.298 in synapsin1CreERT2; Sik3ex13flox/+ mice, t(20.346) = 0.295, p = 0.771, Welch's t test; theta during NREMS: 1.661 ± 0.054 in synapsin1+; Sik3ex13flox/+ mice, 1.688 ± 0.047 in synapsin1CreERT2; Sik3ex13flox/+ mice, t(24) = 0.36, p = 0.722, Student's t test; δ during REMS: 0.881 ± 0.023 in synapsin1+; Sik3ex13flox/+ mice, 0.989 ± 0.032 in synapsin1CreERT2; Sik3ex13flox/+ mice, t(24) = 2.635, p = 0.015, Student's t test; theta during REMS: 1.152 ± 0.062 in synapsin1+; Sik3ex13flox/+ mice, 1.264 ± 0.043 in synapsin1CreERT2; Sik3ex13flox/+ mice, t(24) = 1.423, p = 0.168, Student's t test).
We then investigated sleep/wakefulness in adult synapsin1CreERT2; Sik3ex13flox/+ mice that were administered tamoxifen during late infancy. Tamoxifen-treated synapsin1CreERT2; Sik3ex13flox/+ mice exhibited a decreased wake time and an increased NREMS time over 24 h and during the dark phase and similar REMS time compared with tamoxifen-treated synapsin1CreERT2; Sik3+/+ mice (Fig. 4A–C; wake: F(1,72) = 73.561, p < 0.001, two-way ANOVA; wake in 24 h: q(72) = −7.428, p = 2.664 × 10⁻⁹, Tukey's test; wake in dark: q(72) = −6.864, p = 2.928 × 10⁻⁸, Tukey's test; NREMS: F(1,72) = 79.373, p < 0.001, two-way ANOVA; NREMS in 24 h: q(72) = 7.716, p = 7.773 × 10⁻¹⁰, Tukey's test; NREMS in dark: q(72) = 6.979, p = 1.799 × 10⁻⁸, Tukey's test; REMS: F(1,72) = 3.011, p = 0.087, two-way ANOVA). During the early dark phase, tamoxifen-treated synapsin1CreERT2; Sik3ex13flox/+ mice exhibited longer NREMS and REMS time (Fig. 4D–F; wake t(18.6) = 1.400 × 10⁻⁵, Welch's t test; NREMS: t(24) = 4.703, p = 8.800 × 10⁻¹⁵, Student's t test; REMS: t(24) = 3.209, p = 4.000 × 10⁻³, Student's t test). Additionally, spectral analysis showed increased δ power during the wake, NREMS, and REMS and increased theta power during the REMS of the tamoxifen-treated synapsin1CreERT2; Sik3ex13flox/+ mice (Fig. 4G–I; wake δ: t(36) = 2.098, p = 0.043, Student's t test; NREMS δ: t(36) = 2.926, p = 0.006, Student's t test; REMS δ: t(36) = 2.626, p = 0.013, Student's t test; REMS theta: t(36) = 2.418, p = 0.021, Student's t test).
Figure 4.
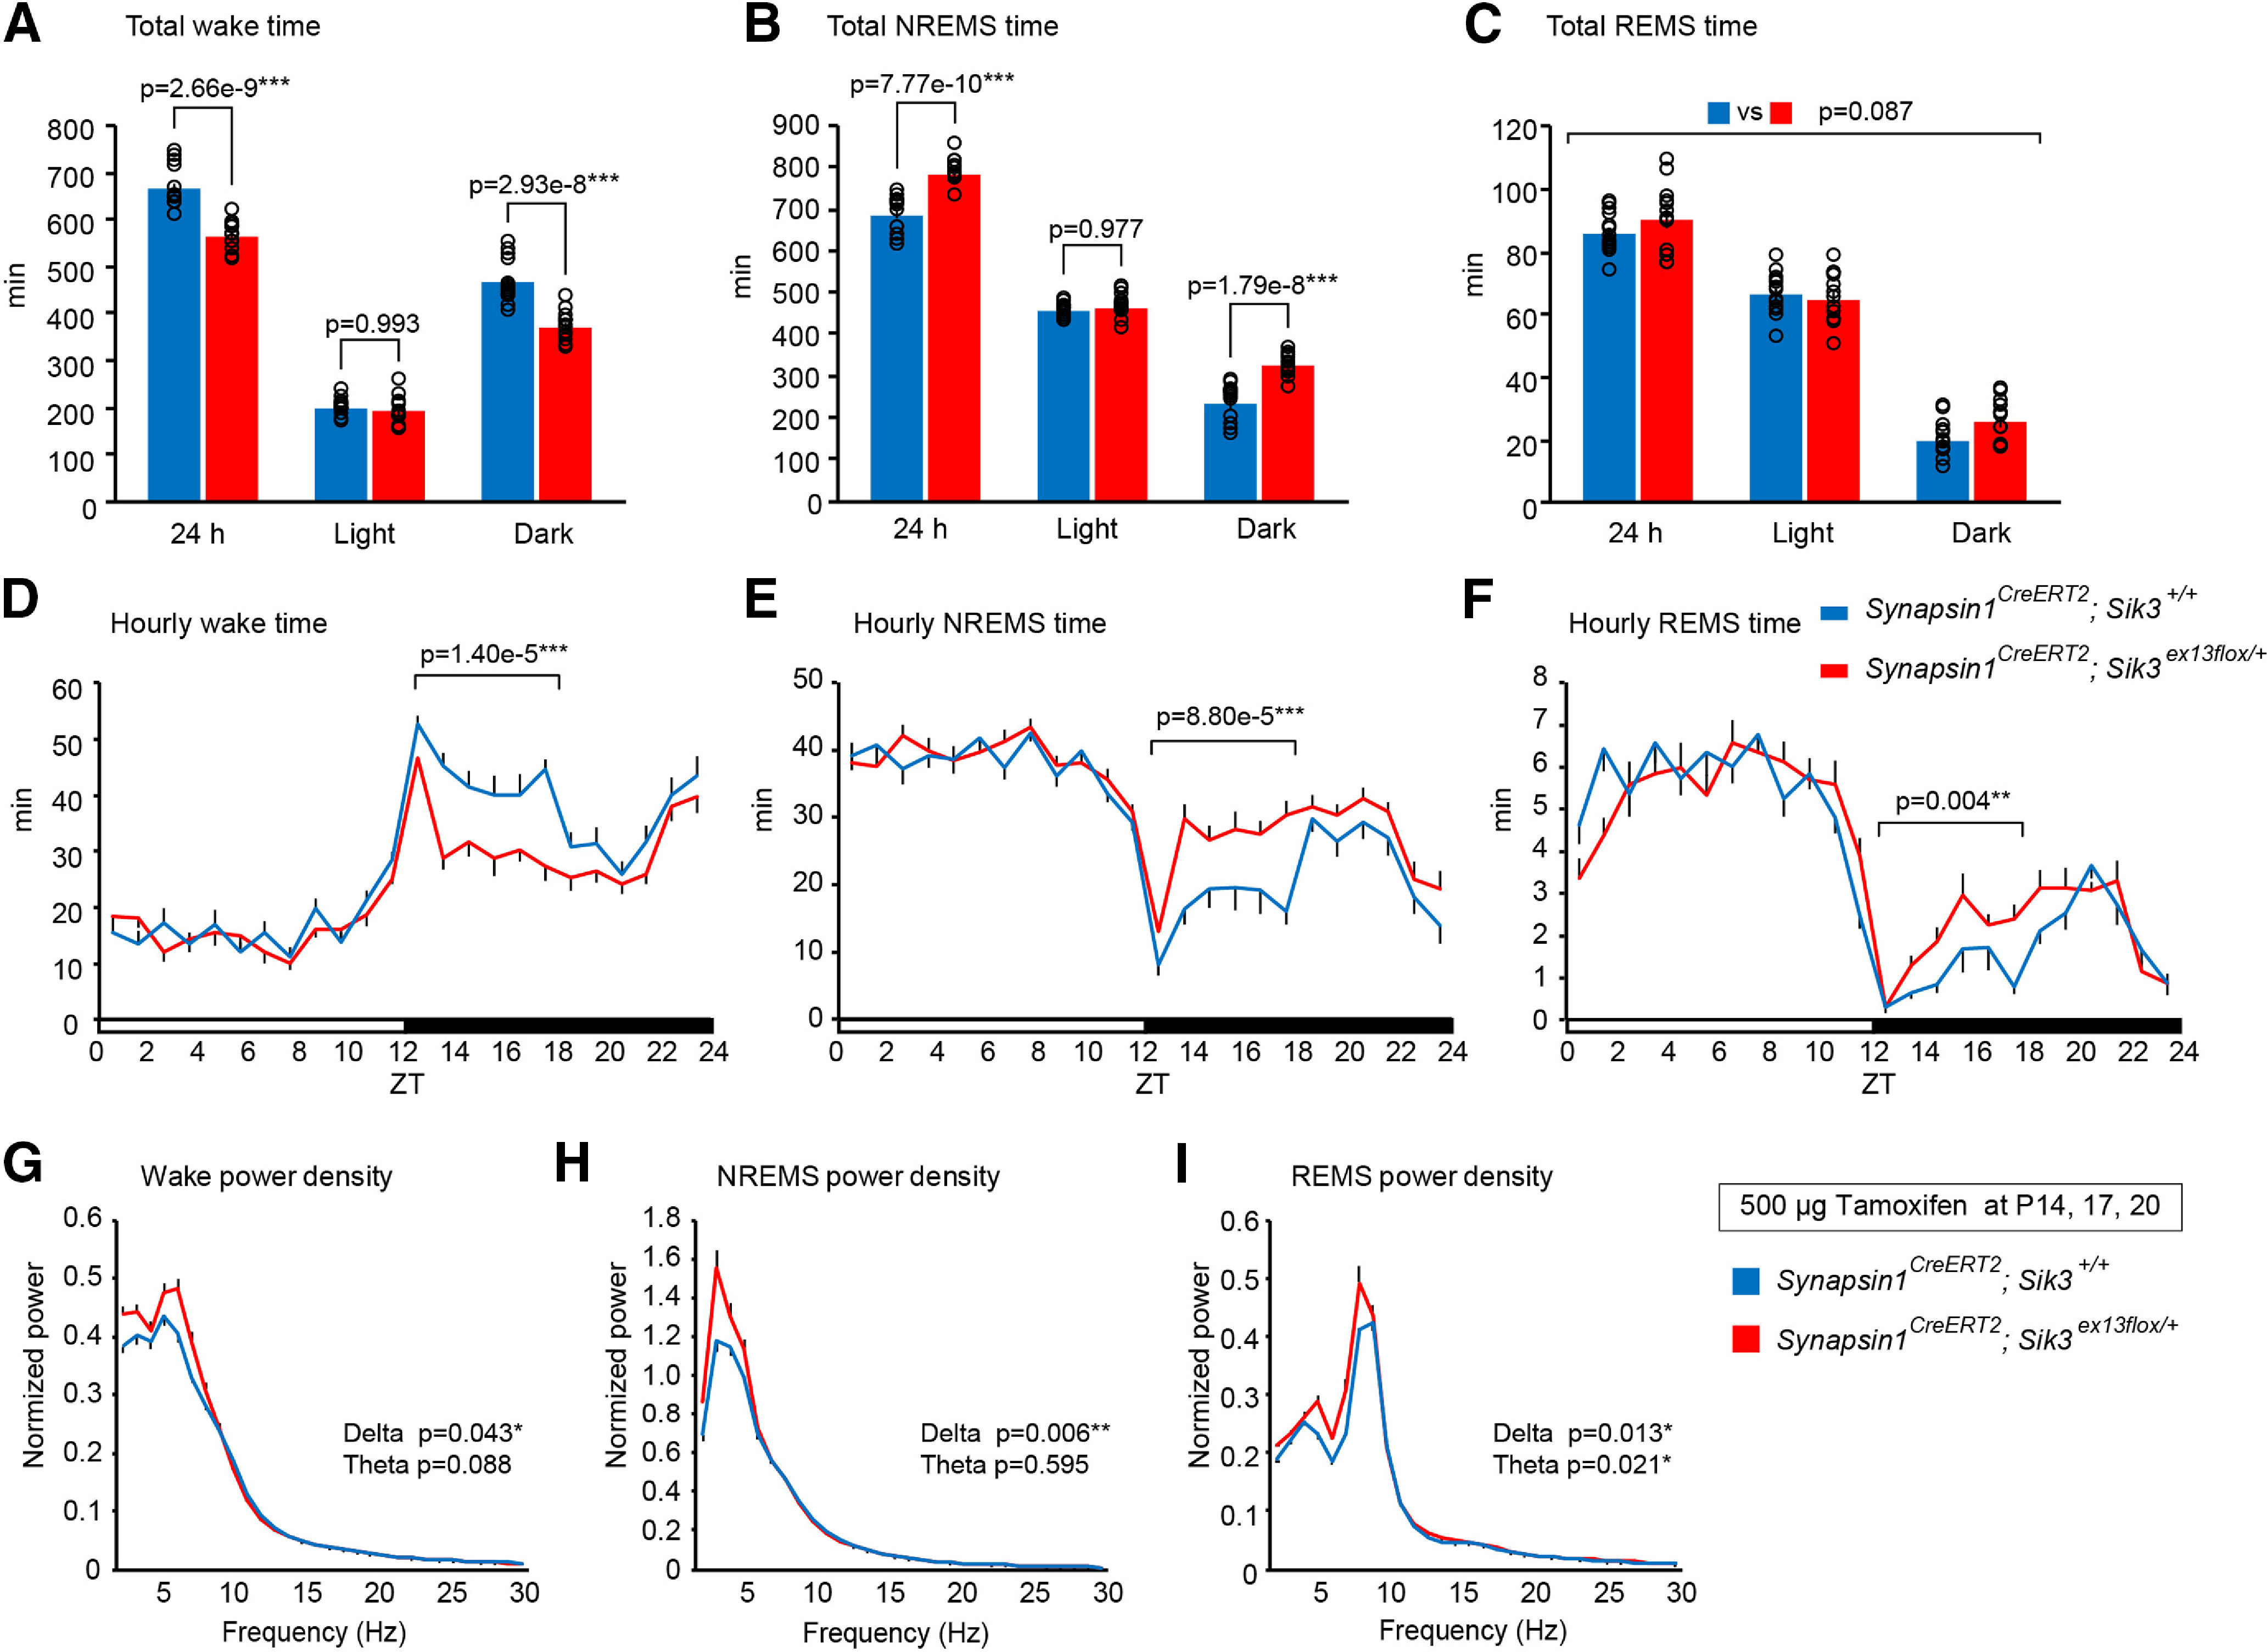
Sleep/wakefulness of synapsin1CreERT2; Sik3ex13flox/+ mice injected with tamoxifen during late infancy. A–C, Time spent in wake (A), NREMS (B), and REMS (C) over 24 h and during the light and dark phases of synapsin1CreERT2; Sik3ex13flox/+ mice that were administered tamoxifen at P14, P17, and P20. Two-way ANOVA followed by Tukey's test; n = 13 mice per group. D–F, Daily variations of wake (D), NREMS (E), and REMS (F) of the tamoxifen-administered synapsin1CreERT2; Sik3ex13flox/+ mice. Two-tailed t test for the total time in early dark phases (ZT12-18); n = 13 mice per group. G–I, EEG power spectra of the tamoxifen-administered synapsin1CreERT2; Sik3ex13flox/+ mice in wake (G), NREMS (H), and REMS (I). n = 13 mice per group. Two-tailed t test for the δ- and theta-ranges. Data are mean ± SEM. *p < 0.05. **p < 0.01. ***p < 0.001.
Next, we examined the homeostatic regulation of sleep/wakefulness in adult synapsin1CreERT2; Sik3ex13flox/+ mice that were administered tamoxifen during late infancy. After 6 h of sleep deprivation from ZT0 to ZT6, both tamoxifen-administered synapsin1CreERT2; Sik3ex13flox/+ and synapsin1CreERT2; Sik3+/+ mice showed higher δ density than the basal condition (Fig. 5A; F(1,34) = 48.74, p = 4.72 × 10⁻⁸, two-way ANOVA; sleep deprivation vs basal recording in synapsin1CreERT2; Sik3+/+ mice: q(34) = 3.665, p = 0.004, Tukey's test; after sleep deprivation vs basal recording in synapsin1CreERT2; Sik3ex13flox/+ mice: q(34) = 6.208, p = 3.00 × 10⁻⁶, Tukey's test). Importantly, synapsin1CreERT2; Sik3ex13flox/+ showed a larger increase in NREMS δ power than synapsin1CreERT2; Sik3+/+ mice for 6 h after sleep deprivation (Fig. 5B; F(1,60) = 5.313, p =0.025, two-way ANOVA). Spectral analysis also showed that increased δ power for 3 h after sleep deprivation during NREMS, but not during wake or REMS (Fig. 5C–E; wake δ: t(10) = 0.219, p = 0.831, Student's t test; NREMS δ: t(10) = 4.487, p = 0.001, Student's t test; REMS δ: t(10) = 0.988, p = 0.346, Student's t test). Thus, the expression of SIK3(SLP) after late infancy enhanced increase in δ power during NREMS in response to sleep loss.
Figure 5.

Sleep/wakefulness of synapsin1CreERT2; Sik3ex13flox/+ mice injected with tamoxifen during late infancy after 6 h of sleep deprivation. A, NREMS δ density during ZT6-ZT9 in the basal recordings of the tamoxifen-administered synapsin1CreERT2; Sik3ex13flox/+ mice (n = 13) and synapsin1CreERT2; Sik3+/+ mice (n = 13) and after 6 h of sleep deprivation in the tamoxifen-administered synapsin1CreERT2; Sik3ex13flox/+ mice (n = 6) and synapsin1CreERT2; Sik3+/+ mice (n = 6). Two-way ANOVA followed by Tukey's test. B, NREMS δ power changes after sleep deprivation relative to that during ZT11 under the basal condition. Two-way ANOVA n = 6 mice per group. C–E, EEG power spectra of the tamoxifen-administered synapsin1CreERT2; Sik3ex13flox/+ mice (n = 6) and synapsin1CreERT2; Sik3+/+ mice (n = 6) in wake (C), NREMS (D), and REMS (E) after sleep deprivation. Two-tailed t test for the δ- and theta-ranges. Data are group mean ± SEM. *p < 0.05. **p < 0.01. ***p < 0.001.
Tamoxifen administration during adolescence increased NREMS δ power
Next, we investigated sleep/wakefulness in adult synapsin1CreERT2; Sik3ex13flox/+ mice that were administered tamoxifen during adolescence, or at 5 consecutive days from P28. Tamoxifen-treated synapsin1CreERT2; Sik3ex13flox/+ mice exhibited similar times spent in wake, NREMS, or REMS to tamoxifen-administered synapsin1CreERT2; Sik3+/+ mice (Fig. 6A–C; for wake: F(1,96) = 2.629, p = 0.108, two-way ANOVA; for NREMS: F(1,96) = 3.279, p = 0.073, two-way ANOVA; for REMS: F(1,96) = 0.907, p = 0.343, two-way ANOVA). The circadian variations in the wake, NREMS, and REMS time were also similar between the tamoxifen-administered synapsin1CreERT2; Sik3ex13flox/+ mice and the control mice (Fig. 6D–F; wake: F(1,768) = 2.67, p = 0.103, two-way ANOVA; NREMS: F(1,768) = 3.839, p = 0.050, two-way ANOVA; REMS: F(1,768) = 0.589, p = 0.443, two-way ANOVA). Furthermore, the tamoxifen-treated synapsin1CreERT2; Sik3ex13flox/+ mice showed an elevated δ power density during NREMS but not during wake or REMS (Fig. 6G–I; wake δ: t(32) = −0.062, p = 0.951, Student's t test; NREMS δ: t(25.723) = 2.769, p = 0.01, Welch's t test; REMS δ: t(32) = −2.004, p = 0.054, Student's t test).
Figure 6.
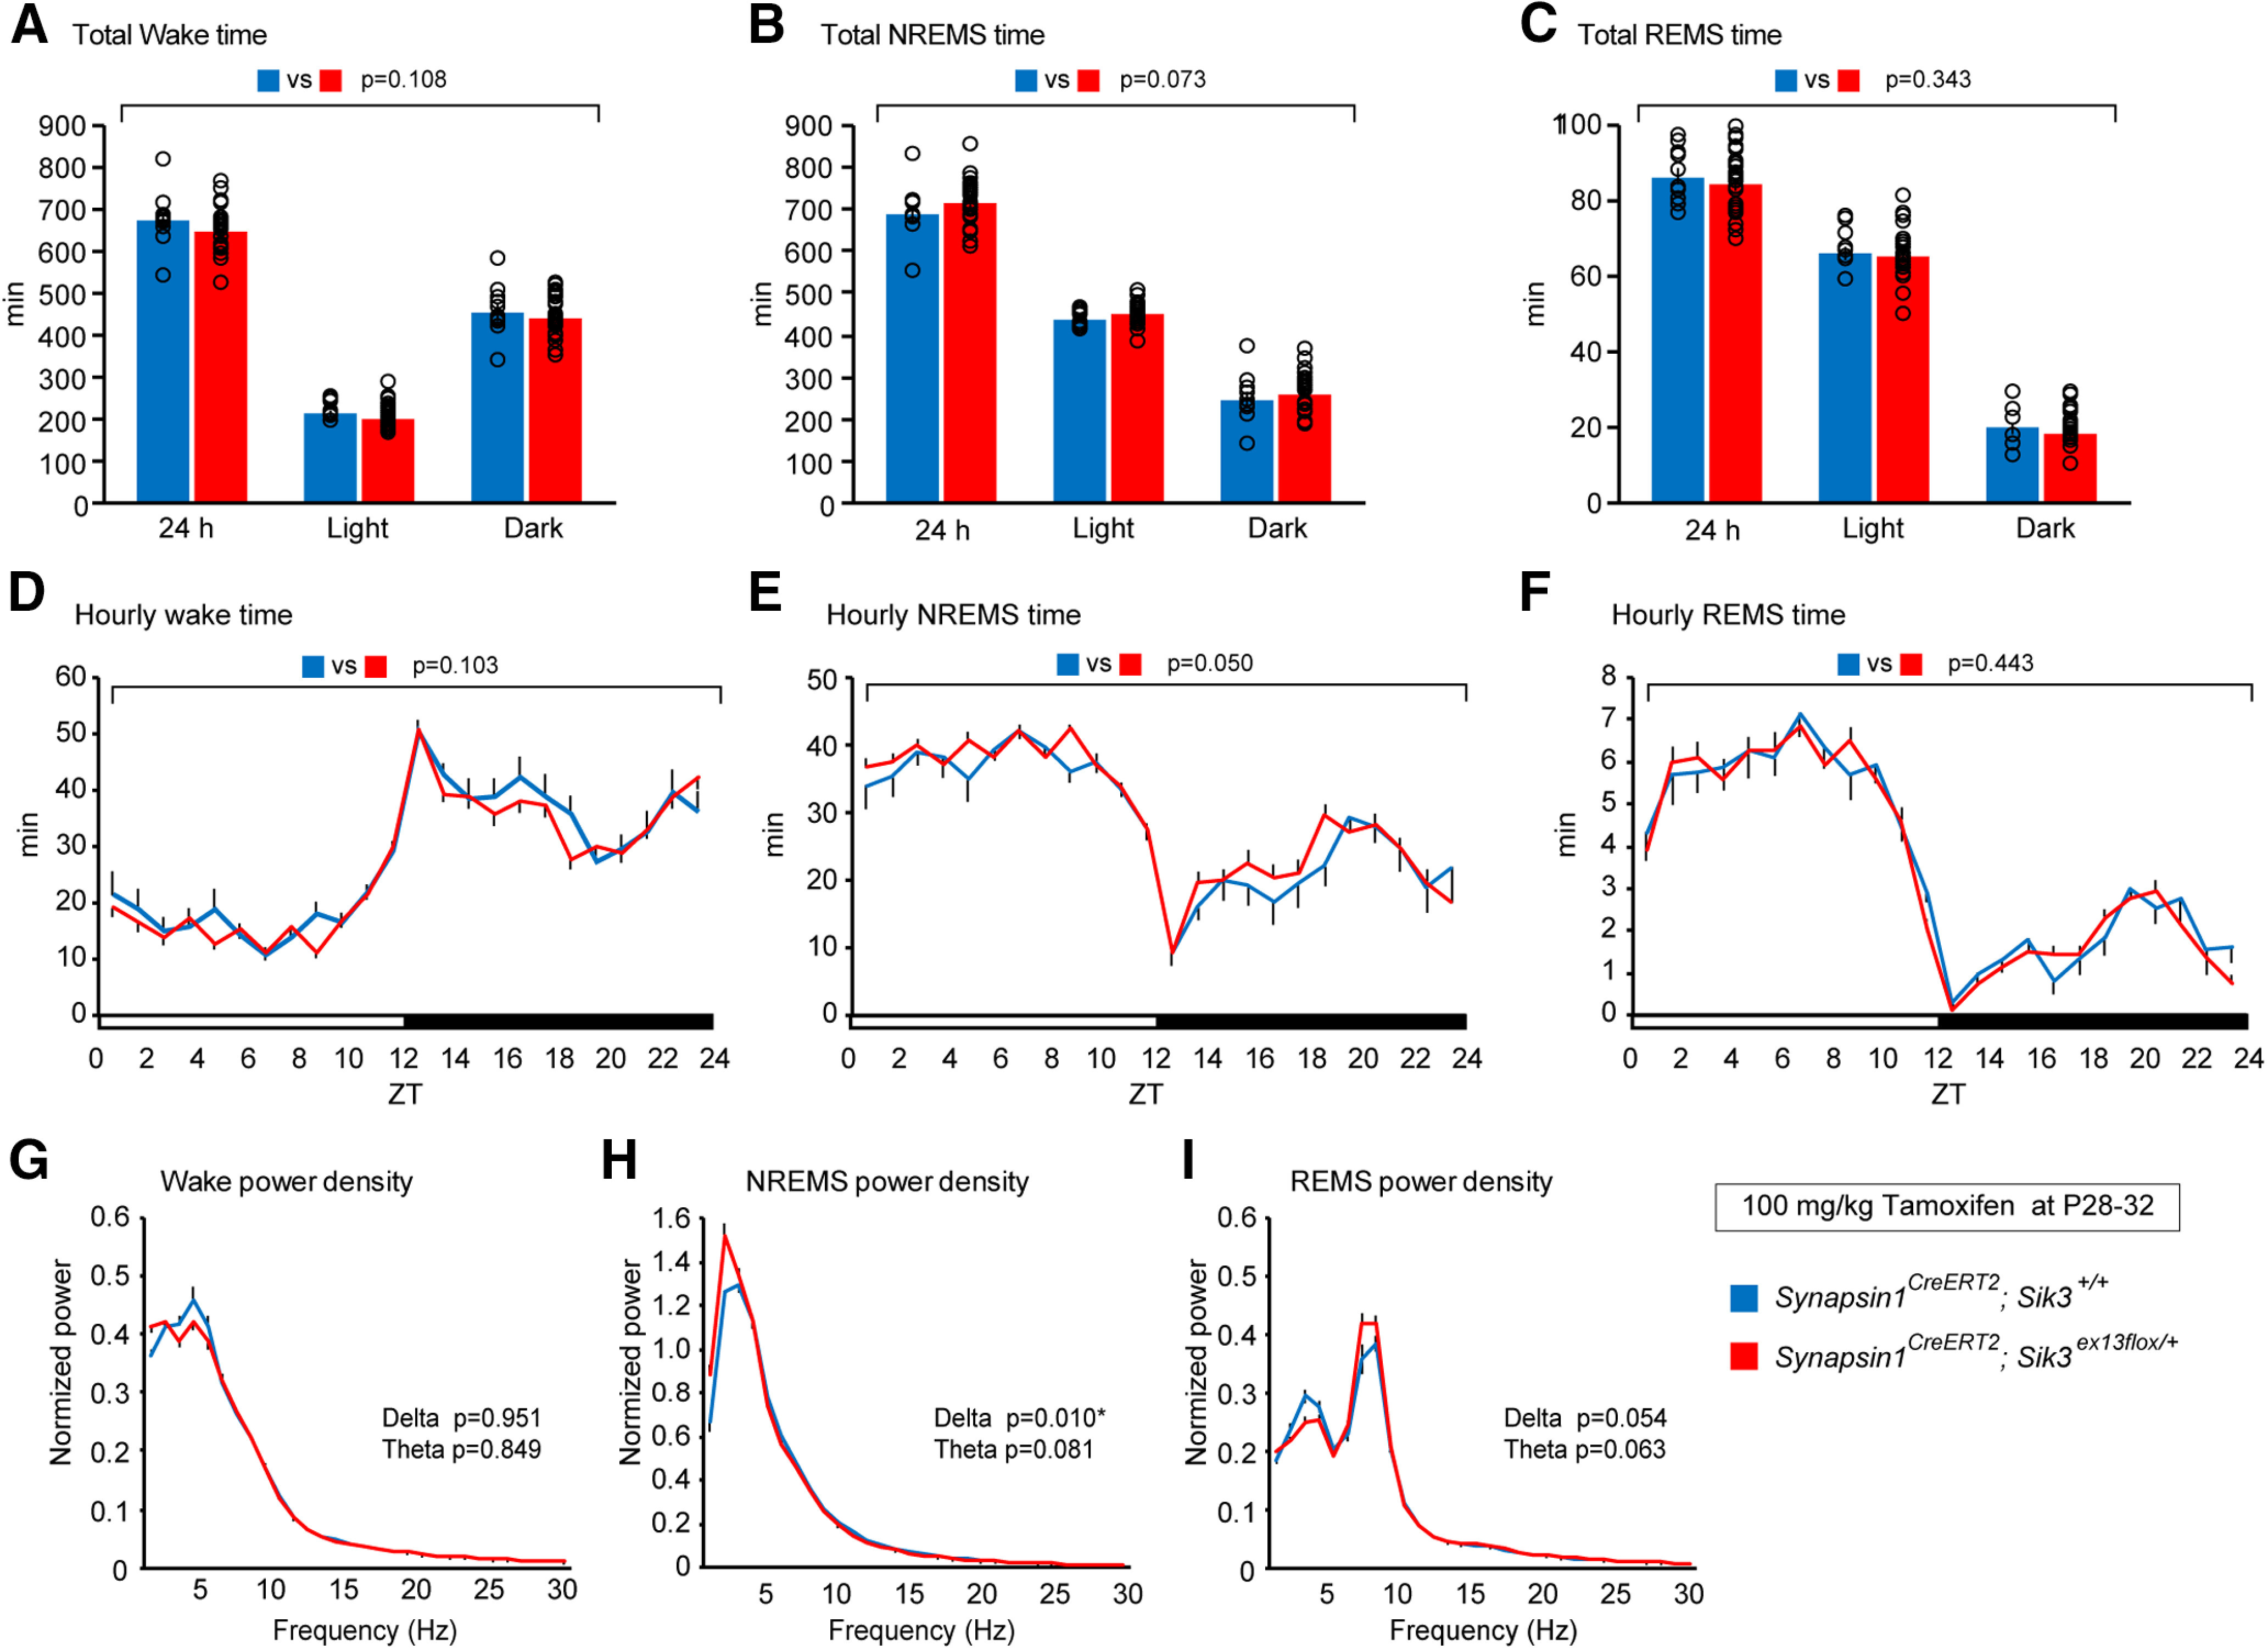
Sleep/wakefulness of synapsin1CreERT2; Sik3ex13flox/+ mice injected with tamoxifen during adolescence. A–C, Time spent in wake (A), NREMS (B), and REMS (C) over 24 h and during the light and dark phases of synapsin1CreERT2; Sik3ex13flox/+ mice that were administered tamoxifen at P28, P29, P30, P31, and P32. Two-way ANOVA. D–F, Daily variations in wake (D), NREMS (E), and REMS (F) of the tamoxifen-administered synapsin1CreERT2; Sik3ex13flox/+ mice. Two-way ANOVA. G–I, EEG power spectra of the tamoxifen-administered synapsin1CreERT2; Sik3ex13flox/+ mice in wake (G), NREMS (H), and REMS (I). Two-tailed t test for the δ- and theta-ranges. Synapsin1CreERT2; Sik3+/+ mice (n = 10) and synapsin1CreERT2; Sik3ex13flox/+ mice (n = 24). *p < 0.05. **p < 0.01. Data are group mean ± SEM.
After 6 h of sleep deprivation from ZT0 to ZT6, both tamoxifen-administered synapsin1CreERT2; Sik3ex13flox/+ and synapsin1CreERT2; Sik3+/+ mice showed higher NREMS δ density after sleep deprivation than the basal condition (Fig. 7A; F(1,52) = 64.456, p = 1.15 × 10⁻¹⁰, two-way ANOVA; sleep deprivation vs basal recording in synapsin1CreERT2; Sik3ex13flox/+ mice: q(52) = 7.147, p = 1.72 × 10⁻⁸, Tukey's test; sleep deprivation vs basal recording in synapsin1CreERT2; Sik3+/+ mice: q(52) = 4.584, p = 1.66 × 10⁻⁴, Tukey's test). Synapsin1CreERT2; Sik3ex13flox/+ and synapsin1CreERT2; Sik3+/+ mice showed a similar δ power increase after sleep deprivation (Fig. 7B; F(1120) = 0.306, p =0.581, two-way ANOVA). An increased δ density was observed for 3 h after sleep deprivation during NREMS but not during wake or REMS (Fig. 7C–E; wake δ: t(20) = −0.818, p = 0.423, Student's t test; NREMS δ: t(20) = 2.431, p = 0.025, Student's t test; REMS δ: t(20) = −0.748, p = 0.463, Student's t test). These results indicated that synapsin1CreERT2; Sik3ex13flox/+ mice administered tamoxifen during adolescence increased δ power during NREMS both in basal and after sleep deprivation; however, the degree of the increased δ power after sleep loss was similar to the control mice.
Figure 7.

Sleep/wakefulness of synapsin1CreERT2; Sik3ex13flox/+ mice injected with tamoxifen during adolescence after 6 h of sleep deprivation. A, NREMS δ density during ZT6-ZT9 under the basal condition in the tamoxifen-administered synapsin1CreERT2; Sik3ex13flox/+ mice (n = 24) and synapsin1CreERT2; Sik3+/+ mice (n = 10) and after 6 h of sleep deprivation in the tamoxifen-administered synapsin1CreERT2; Sik3ex13flox/+ mice (n = 12) and synapsin1CreERT2; Sik3+/+ mice (n = 10). Two-way ANOVA followed by Tukey's test. B, NREMS δ power change after 6 h sleep deprivation relative to that during ZT11 under the basal condition in the tamoxifen-administered synapsin1CreERT2; Sik3ex13flox/+ mice (n = 12) and synapsin1CreERT2; Sik3+/+ mice (n = 10). Two-way ANOVA. C–E, EEG power spectra of the tamoxifen-administered synapsin1CreERT2; Sik3ex13flox/+ mice (n = 12) and synapsin1CreERT2; Sik3+/+ mice (n = 10) in wake (C), NREMS (D), and REMS (E) after 6 h sleep deprivation. Two-tailed t test for the δ- and theta-ranges. *p < 0.05. **p < 0.01. ***p < 0.001. Data are group mean ± SEM.
SIK3(SLP) expression increased Td/Ti ratio of process S
Last, we investigated sleep need dynamics of tamoxifen-administered synapsin1CreERT2; Sik3ex13flox/+ mice with tamoxifen administration during late infancy and Sik3Slp/+ mice (Funato et al., 2016) using simulation analysis. We simulated Process S based on sleep/wake patterns over 48 h, including 6 h of sleep deprivation according to Franken et al. (2001, 2006) and determined the time constants, Ti and Td, by minimizing the differences to empirical δ power for a range of Ti (0-25 h) and Td (0-25 h) values (Fig. 8A). Sik3Slp/+ and synapsin1CreERT2; Sik3ex13flox/+ mice showed a tendency toward longer Td and shorter Ti values compared with Sik3+/+ and synapsin1CreERT2; Sik3+/+ mice, respectively, whereas the changes did not reach significance (Fig. 8B,C; Td: F(1,31) = 2.353, p = 0.135, two-way ANOVA; Ti: F(1,31) = 2.39, p = 0.132, two-way ANOVA). Distributions of Td and Ti of Sik3Slp/+ and synapsin1CreERT2; Sik3ex13flox/+ mice exhibited higher Td against Ti compared with those of Sik3+/+ and synapsin1CreERT2; Sik3+/+ mice, respectively (Fig. 8D). The regression line for Sik3Slp/+ mice data had a larger slope than that for Sik3+/+ mice. Since the differences in Td against Ti distributions can be assessed directly as decreasing to increasing time constant ratio (Td/Ti) ratios, we further examined the Td/Ti ratios of each mouse group. Td/Ti ratios of Sik3Slp/+ and synapsin1CreERT2; Sik3ex13flox/+ mice were higher than those of Sik3+/+ and synapsin1CreERT2; Sik3+/+ mice, respectively (Fig. 8E; F(1,31) = 45.929, p = 1.374 × 10⁻⁷, two-way ANOVA; Sik3+/+ vs Sik3Slp/+: t(31) = 6.301, p = 3.00 × 10⁻⁶, Tukey's test; synapsin1CreERT2; Sik3+/+ vs synapsin1CreERT2; Sik3ex13flox/+: t(31) = 3.768, p = 0.004, Tukey's test). The simulated Process S of Sik3Slp/+ and synapsin1CreERT2; Sik3ex13flox/+ mice was shown as raw values (Fig. 8F,G) and as normalized values that were divided by that during the last 4 h of the light phase of the basal recording (Fig. 8H,I).
Discussion
The present study used newly developed synapsin1CreERT2 and Sik3ex13flox mouse lines and demonstrated that the expression of SIK3(SLP) protein in neurons from late infancy is sufficient to cause the sleep phenotype of Sik3Slp mice and Sik3S551A mice in adulthood (Funato et al., 2016; Honda et al., 2018).
We previously reported that the systemic expression of SIK3(SLP) and SIK3 (S551A) led to longer NREMS time and increased NREMS δ power (Funato et al., 2016; Honda et al., 2018) and that the alanine substitution of PKA phosphorylation sites of SIK1 and SIK2 increased NREMS δ power (Park et al., 2020). In the present study, we showed that a greater Td/Ti of Sik3Slp mice and synapsin1CreERT2; Sik3ex13flox/+ mice compared with Sik3+/+ mice and synapsin1CreERT2; Sik3ex13flox/+ mice. Lower normalized Process S of Sik3Slp mice and synapsin1CreERT2; Sik3ex13flox/+ mice during the dark phase may be because of shorter wake time during the dark phase (Fig. 4A) (Funato et al., 2016). Future studies on SIK3 will lead to elucidation of the neural substrates of the Process S dynamics, which may be associated with synaptic function and structure (Tononi and Cirelli, 2014; Wang et al., 2018).
The effect of SIK3(SLP) on sleep need in Sik3Slp mice could be attributed to tissues outside the nervous systems, non-neuronal cells in the brain, and altered brain development, rather than mature neurons. Since synapsin1 is expressed in mature neurons at the late phase of synaptogenesis (Garin and Escher, 2001; Ziv and Garner, 2004) and synapsin1CreERT2; Sik3ex13flox mice administered tamoxifen during late infancy demonstrated the increased NREMS time and NREMS δ power seen in Sik3Slp mice, the current study showed that the sleep phenotypes in Sik3Slp mice are caused by the expression of SIK3(SLP) in mature neurons, although it does not deny the possibility that SIK3(SLP) expressed in non-neuronal cells or outside the nervous system is also involved in sleep change in Sik3Slp mice.
Since sleep deprivation is primarily compensated by an increased NREMS δ power, not by an increased NREMS amount, it is reasonable that the lower expression of SIK3(SLP) in synapsin1CreERT2; Sik3ex13flox mice administered tamoxifen during adolescence led to an increased NREMS δ power in adulthood without significant change in NREMS amount. Lower recombination efficiency in adolescent compared with infant synapsin1CreERT2 mice may account for the weaker sleep phenotype of synapsin1CreERT2; Sik3ex13flox mice administered tamoxifen during adolescence than during late infancy. Although we cannot deny the possibility that the sleep need in adulthood is determined between late infancy and adolescence, our preliminary study (K.I., unpublished data) showed that the sleep amount in adult mice can be modulated by the expression of SIK3(SLP) in adulthood.
Currently, there is no consensus on whether sleep need is encoded by full populations of neurons or a specific set of neurons. Our result allows both interpretations. More time spent in NREMS in synapsin1CreERT2; Sik3ex13flox mice with tamoxifen administration during late infancy than during adolescence suggests that sleep need may depend on the number of SIK3(SLP)-positive neurons. This interpretation supports the hypothesis that sleep need reflects entire neural activities during wakefulness and is correlated with the number of neurons involved, as Clock-mutant chimera mice showed circadian behavior changes depending on the Clock-mutant cell dosage (Low-Zeddies and Takahashi, 2001).
Another interpretation is that the regional difference in the induction of mutant Sik3Slp allele accounts for differential sleep amount in synapsin1CreERT2; Sik3ex13flox mice. Since the execution of sleep/wakefulness transitions and maintenance is controlled by distributed neural networks in the brain (Liu and Dan, 2019), SIK3(SLP) expression in a certain brain region may directly or indirectly affect this sleep-regulating network to enhance NREMS. There are several brain regions where SIK3(SLP) was induced by tamoxifen administration during late infancy, not by administration during adolescence. Given that brain regions where SIK3(SLP) is induced by tamoxifen administration during late infancy are associated with sleep need encoding, brain regions showing very low Cre-dependent recombinase activity after the administration of tamoxifen during late infancy may not be crucial for sleep need determination in synapsin1CreERT2; Sik3ex13flox mice. For example, although the lateral habenula, caudoputamen, and substantia nigra pars reticulata are involved in sleep regulation (Cui et al., 2014; Cizeron et al., 2020; Liu et al., 2020), very low Cre-dependent recombination was observed in these regions of synapsin1CreERT2; ROSALacZ/+ mice after tamoxifen administration during late infancy. Thus, these regions may not be responsible for increased sleep in synapsin1CreERT2; Sik3ex13flox mice or, presumably, in Sik3Slp mice.
Synapsin1CreERT2 mice showed abundant Cre expression in the cerebral cortex but weak expression in the caudoputamen and several brain stem areas, as was previously reported for synapsin1 expression (Melloni et al., 1993; Melloni and DeGennaro, 1994). Synapsin1 is a synaptic vesicle phosphoprotein, and synapsin1-deficient mice exhibited epileptic seizures (L. Li et al., 1995; Etholm et al., 2012) and a decreased number of synaptic vesicle pools (L. Li et al., 1995; Baldelli et al., 2007). Moreover, synapsin1 is one of the sleep-need-index phosphoproteins that constitute a molecular signature of sleep need (Wang et al., 2018). Although we observed decreased synapsin1 expression in synapsin1CreERT2 mice (data not shown), which may have resulted from Cre cassette insertion in the 3′UTR region regulating mRNA stability (Mayr, 2016), synapsin1CreERT2 mice showed sleep/wake behaviors similar to those of WT mice. Thus, synapsin1CreERT2 mice work as a valuable tool that allows us to temporally manipulate gene expression in neurons.
We found that the recombination efficiency differs depending on the brain region. For example, the LC and nucleus ambiguus showed a high recombination efficiency in tamoxifen-treated synapsin1CreERT2; ROSALacZ/+ mice despite the moderate expression of Cre in the LC and nucleus ambiguus of synapsin1CreERT2 mice. Different regional concentrations of tamoxifen in the brain resulting from different levels of accessibility or permissiveness of the blood–brain barrier near the circumventricular organs (Iusuf et al., 2011; Jahn et al., 2018) may have also facilitated uneven recombination efficiency.
In conclusion, this study provides a tool to modify sleep amount and NREMS δ power through a selected population of cells and proved the concept of neuronal encoding of sleep need.
Footnotes
This work was supported by Ministry of Education, Culture, Sports, Science and Technology World Premier International Research Center Initiative to M.Y.; Japan Society for the Promotion of Science KAKENHI (17H06095 to M.Y. and H.F.; 16K15187, 17H04023, 17H05583, and 20H00567 to H.F.; 26507003 and 18968064 to C.M. and H.F.;20J12137 to K.I.; 15J00393 and 18K14811 to T.F.); Ministry of Education, Culture, Sports, Science and Technology KEKENHI (15K21745 to H.F.); Japan Society for the Promotion of Science Funding Program for World-Leading Innovative R&D on Science and Technology (FIRST Program) to M.Y.; and Uehara Memorial Foundation, Naito Foundation, and Astellas Foundation for Research on Metabolic Disorders to H.F. We thank Yanagisawa/Funato laboratory members and International Institute for Integrative Sleep Medicine members for the kind support, technical assistance, and discussion.
The authors declare no competing financial interests.
References
- Baldelli P, Fassio A, Valtorta F, Benfenati F (2007) Lack of synapsin I reduces the readily releasable pool of synaptic vesicles at central inhibitory synapses. J Neurosci 27:13520–13531. 10.1523/JNEUROSCI.3151-07.2007 [DOI] [PMC free article] [PubMed] [Google Scholar]
- Besedovsky L, Lange T, Haack M (2019) The sleep-immune crosstalk in health and disease. Physiol Rev 99:1325–1380. 10.1152/physrev.00010.2018 [DOI] [PMC free article] [PubMed] [Google Scholar]
- Borbély AA (1982) A two process model of sleep regulation. Hum Neurobiol 1:195–204. [PubMed] [Google Scholar]
- Chang I, Bramall AN, Baynash AG, Rattner A, Rakheja D, Post M, Joza S, McKerlie C, Stewart DJ, McInnes RR, Yanagisawa M (2013) Endothelin-2 deficiency causes growth retardation, hypothermia, and emphysema in mice. J Clin Invest 123:2643–2653. 10.1172/JCI66735 [DOI] [PMC free article] [PubMed] [Google Scholar]
- Cirelli C (2009) The genetic and molecular regulation of sleep: from fruit flies to humans. Nat Rev Neurosci 10:549–560. 10.1038/nrn2683 [DOI] [PMC free article] [PubMed] [Google Scholar]
- Cizeron M, Qiu Z, Koniaris B, Gokhale R, Komiyama NH, Fransén E, Grant SG (2020) A brainwide atlas of synapses across the mouse life span. Science 369:270–275. 10.1126/science.aba3163 [DOI] [PMC free article] [PubMed] [Google Scholar]
- Cui W, Mizukami H, Yanagisawa M, Aida T, Nomura M, Isomura Y, Takayanagi R, Ozawa K, Tanaka K, Aizawa H (2014) Glial dysfunction in the mouse habenula causes depressive-like behaviors and sleep disturbance. J Neurosci 34:16273–16285. 10.1523/JNEUROSCI.1465-14.2014 [DOI] [PMC free article] [PubMed] [Google Scholar]
- Daan S, Beersma DG, Borbely AA (1984) Timing of human sleep: recovery process gated by a circadian pacemaker. Am J Physiol 246:R161–R183. 10.1152/ajpregu.1984.246.2.R161 [DOI] [PubMed] [Google Scholar]
- Darling NJ, Toth R, Arthur JS, Clark K (2017) Inhibition of SIK2 and SIK3 during differentiation enhances the anti-inflammatory phenotype of macrophages. Biochem J 474:521–537. 10.1042/BCJ20160646 [DOI] [PMC free article] [PubMed] [Google Scholar]
- Dashti HS, Jones SE, Wood AR, Lane JM, van Hees VT, Wang H, Rhodes JA, Song Y, Patel K, Anderson SG, Beaumont RN, Bechtold DA, Bowden J, Cade BE, Garaulet M, Kyle SD, Little MA, Loudon AS, Luik AI, Scheer FA, et al. (2019) Genome-wide association study identifies genetic loci for self-reported habitual sleep duration supported by accelerometer-derived estimates. Nat Commun 10:12. 10.1038/s41467-019-08917-4 [DOI] [PMC free article] [PubMed] [Google Scholar]
- Dubowy C, Sehgal A (2017) Circadian rhythms and sleep in Drosophila melanogaster. Genetics 205:1373–1397. 10.1534/genetics.115.185157 [DOI] [PMC free article] [PubMed] [Google Scholar]
- Ehrlich DE, Josselyn SA (2016) Plasticity-related genes in brain development and amygdala-dependent learning. Genes Brain Behav 15:125–143. 10.1111/gbb.12255 [DOI] [PubMed] [Google Scholar]
- Etholm L, Bahonjic E, Walaas SI, Kao HT, Heggelund P (2012) Neuroethologically delineated differences in the seizure behavior of synapsin 1 and synapsin 2 knock-out mice. Epilepsy Res 99:252–259. 10.1016/j.eplepsyres.2011.12.004 [DOI] [PubMed] [Google Scholar]
- Franken P, Tobler I, Borbély AA (1991) Sleep homeostasis in the rat: simulation of the time course of EEG slow-wave activity. Neurosci Lett 130:141–144. 10.1016/0304-3940(91)90382-4 [DOI] [PubMed] [Google Scholar]
- Franken P, Chollet D, Tafti M (2001) The homeostatic regulation of sleep need is under genetic control. J Neurosci 21:2610–2621. 10.1523/JNEUROSCI.21-08-02610.2001 [DOI] [PMC free article] [PubMed] [Google Scholar]
- Franken P, Dudley CA, Estill SJ, Barakat M, Thomason R, O'Hara BF, McKnight SL (2006) NPAS2 as a transcriptional regulator of non-rapid eye movement sleep: genotype and sex interactions. Proc Natl Acad Sci USA 103:7118–7123. 10.1073/pnas.0602006103 [DOI] [PMC free article] [PubMed] [Google Scholar]
- Fujiyama T, Yamada M, Terao M, Terashima T, Hioki H, Inoue YU, Inoue T, Masuyama N, Obata K, Yanagawa Y, Kawaguchi Y, Nabeshima YI, Hoshino M (2009) Inhibitory and excitatory subtypes of cochlear nucleus neurons are defined by distinct bHLH transcription factors, Ptf1a and Atoh1. Development 136:2049–2058. 10.1242/dev.033480 [DOI] [PubMed] [Google Scholar]
- Fujiyama T, Miyashita S, Tsuneoka Y, Kanemaru K, Kakizaki M, Kanno S, Ishikawa Y, Yamashita M, Owa T, Nagaoka M, Kawaguchi Y, Yanagawa Y, Magnuson MA, Muratani M, Shibuya A, Nabeshima YI, Yanagisawa M, Funato H, Hoshino M (2018) Forebrain Ptf1a Is Required for Sexual Differentiation of the Brain. Cell Rep 24:79–94. [DOI] [PubMed] [Google Scholar]
- Funato H, Miyoshi C, Fujiyama T, Kanda T, Sato M, Wang Z, Ma J, Nakane S, Tomita J, Ikkyu A, Kakizaki M, Hotta-Hirashima N, Kanno S, Komiya H, Asano F, Honda T, Kim SJ, Harano K, Muramoto H, Yonezawa T, et al. (2016) Forward-genetics analysis of sleep in randomly mutagenized mice. Nature 539:378–383. 10.1038/nature20142 [DOI] [PMC free article] [PubMed] [Google Scholar]
- Garin N, Escher G (2001) The development of inhibitory synaptic specializations in the mouse deep cerebellar nuclei. Neuroscience 105:431–441. 10.1016/S0306-4522(01)00127-0 [DOI] [PubMed] [Google Scholar]
- Gross C, Zhuang X, Stark K, Ramboz S, Oosting R, Kirby L, Santarelli L, Beck S, Hen R (2002) Serotonin1A receptor acts during development to establish normal anxiety-like behaviour in the adult. Nature 416:396–400. 10.1038/416396a [DOI] [PubMed] [Google Scholar]
- Gurcel L, Pradervand S, Petit B, Pfister C, Hagenbuchle O, Hara BF, Franken P, Tafti M, Maret S, Dorsaz S, Gurcel L, Pradervand S, Petit B, Pfister C, Hagenbuchle O, O'Hara BF, Franken P, Tafti M (2007) Homer1a is a core brain molecular correlate of sleep loss. Proc Natl Acad Sci USA 104:20090–20095. 10.1073/pnas.0710131104 [DOI] [PMC free article] [PubMed] [Google Scholar]
- Halassa MM, Florian C, Fellin T, Munoz JR, Lee SY, Abel T, Haydon PG, Frank MG (2009) Astrocytic modulation of sleep homeostasis and cognitive consequences of sleep loss. Neuron 61:213–219. 10.1016/j.neuron.2008.11.024 [DOI] [PMC free article] [PubMed] [Google Scholar]
- Haydon PG (2017) Astrocytes and the modulation of sleep. Curr Opin Neurobiol 44:28–33. 10.1016/j.conb.2017.02.008 [DOI] [PMC free article] [PubMed] [Google Scholar]
- Honda T, Fujiyama T, Miyoshi C, Ikkyu A, Hotta-Hirashima N, Kanno S, Mizuno S, Sugiyama F, Takahashi S, Funato H, Yanagisawa M (2018) A single phosphorylation site of SIK3 regulates daily sleep amounts and sleep need in mice. Proc Natl Acad Sci USA 115:10458–10463. 10.1073/pnas.1810823115 [DOI] [PMC free article] [PubMed] [Google Scholar]
- Huber R, Deboer T, Tobler I (2000) Effects of sleep deprivation on sleep and sleep EEG in three mouse strains: empirical data and simulations. Brain Res 857:8–19. 10.1016/S0006-8993(99)02248-9 [DOI] [PubMed] [Google Scholar]
- Imeri L, Opp MR (2009) How (and why) the immune system makes us sleep. Nat Rev Neurosci 10:199–210. [DOI] [PMC free article] [PubMed] [Google Scholar]
- Iusuf D, Teunissen SF, Wagenaar E, Rosing H, Beijnen JH, Schinkel AH (2011) P-glycoprotein (ABCB1) transports the primary active tamoxifen metabolites endoxifen and 4-hydroxytamoxifen and restricts their brain penetration. J Pharmacol Exp Ther 337:710–717. 10.1124/jpet.110.178301 [DOI] [PubMed] [Google Scholar]
- Iwasaki K, Komiya H, Kakizaki M, Miyoshi C, Abe M, Sakimura K, Funato H, Yanagisawa M (2018) Ablation of central serotonergic neurons decreased REM sleep and attenuated arousal response. Front Neurosci 12:535. 10.3389/fnins.2018.00535 [DOI] [PMC free article] [PubMed] [Google Scholar]
- Jahn HM, Kasakow CV, Helfer A, Michely J, Verkhratsky A, Maurer HH, Scheller A, Kirchhoff F (2018) Refined protocols of tamoxifen injection for inducible DNA recombination in mouse astroglia. Sci Rep 8:5913. 10.1038/s41598-018-24085-9 [DOI] [PMC free article] [PubMed] [Google Scholar]
- Li H, Russo A, DiAntonio A (2019) SIK3 suppresses neuronal hyperexcitability by regulating the glial capacity to buffer K+ and water. J Cell Biol 78:239–252. [DOI] [PMC free article] [PubMed] [Google Scholar]
- Li L, Chin LS, Shupliakov O, Brodin L, Sihra TS, Hvalby O, Jensen V, Zheng D, McNamara JO, Greengard P (1995) Impairment of synaptic vesicle clustering and of synaptic transmission, and increased seizure propensity, in synapsin I-deficient mice. Proc Natl Acad Sci USA 92:9235–9239. 10.1073/pnas.92.20.9235 [DOI] [PMC free article] [PubMed] [Google Scholar]
- Liu D, Dan Y (2019) A motor theory of sleep-wake control: arousal-action circuit. Annu Rev Neurosci 42:27–46. 10.1146/annurev-neuro-080317-061813 [DOI] [PubMed] [Google Scholar]
- Liu D, Li W, Ma C, Zheng W, Yao Y, Tso CF, Zhong P, Chen X, Song JH, Choi W, Paik SB, Han H, Dan Y (2020) A common hub for sleep and motor control in the substantia nigra. Science 367:440–445. 10.1126/science.aaz0956 [DOI] [PubMed] [Google Scholar]
- Low-Zeddies SS, Takahashi JS (2001) Chimera analysis of the Clock mutation in mice shows that complex cellular integration determines circadian behavior. Cell 105:25–42. 10.1016/S0092-8674(01)00294-X [DOI] [PMC free article] [PubMed] [Google Scholar]
- Madisen L, Zwingman TA, Sunkin SM, Oh SW, Zariwala HA, Gu H, Ng LL, Palmiter RD, Hawrylycz MJ, Jones AR, Lein ES, Zeng H (2010) A robust and high-throughput Cre reporting and characterization system for the whole mouse brain. Nat Neurosci 13:133–140. 10.1038/nn.2467 [DOI] [PMC free article] [PubMed] [Google Scholar]
- Mayr C (2016) Evolution and biological roles of alternative 3′UTRs. Trends Cell Biol 26:227–237. 10.1016/j.tcb.2015.10.012 [DOI] [PMC free article] [PubMed] [Google Scholar]
- Melloni RH, DeGennaro LJ (1994) Temporal onset of synapsin I gene expression coincides with neuronal differentiation during the development of the nervous system. J Comp Neurol 342:449–462. 10.1002/cne.903420311 [DOI] [PubMed] [Google Scholar]
- Melloni RH, Hemmendinger LM, Hamos JE, DeGennaro LJ (1993) Synapsin I gene expression in the adult rat brain with comparative analysis of mRNA and protein in the hippocampus. J Comp Neurol 327:507–520. 10.1002/cne.903270404 [DOI] [PubMed] [Google Scholar]
- Miyoshi C, Kim SJ, Ezaki T, Ikkyu A, Hotta-Hirashima N, Kanno S, Kakizaki M, Yamada M, Wakana S, Yanagisawa M, Funato H (2019) Methodology and theoretical basis of forward genetic screening for sleep/wakefulness in mice. Proc Natl Acad Sci USA 116:16062–16067. 10.1073/pnas.1906774116 [DOI] [PMC free article] [PubMed] [Google Scholar]
- Mizuno S, Dinh TT, Kato K, Mizuno-Iijima S, Tanimoto Y, Daitoku Y, Hoshino Y, Ikawa M, Takahashi S, Sugiyama F, Yagami KI (2014) Simple generation of albino C57BL/6J mice with G291T mutation in the tyrosinase gene by the CRISPR/Cas9 system. Mamm Genome 25:327–334. 10.1007/s00335-014-9524-0 [DOI] [PubMed] [Google Scholar]
- Park M, Miyoshi C, Fujiyama T, Kakizaki M, Ikkyu A, Honda T, Choi J, Asano F, Mizuno S, Takahashi S, Yanagisawa M, Funato H (2020) Loss of the conserved PKA sites of SIK1 and SIK2 increases sleep need. Sci Rep 10:8676. 10.1038/s41598-020-65647-0 [DOI] [PMC free article] [PubMed] [Google Scholar]
- Pelluru D, Konadhode RR, Bhat NR, Shiromani PJ (2016) Optogenetic stimulation of astrocytes in the posterior hypothalamus increases sleep at night in C57BL/6J mice. Eur J Neurosci 43:1298–1306. 10.1111/ejn.13074 [DOI] [PMC free article] [PubMed] [Google Scholar]
- Sasagawa S, Takemori H, Uebi T, Ikegami D, Hiramatsu K, Ikegawa S, Yoshikawa H, Tsumaki N (2012) SIK3 is essential for chondrocyte hypertrophy during skeletal development in mice. Development 139:1153–1163. 10.1242/dev.072652 [DOI] [PubMed] [Google Scholar]
- Sato Y, Tsukaguchi H, Morita H, Higasa K, Tran MT, Hamada M, Usui T, Morito N, Horita S, Hayashi T, Takagi J, Yamaguchi I, Nguyen HT, Harada M, Inui K, Maruta Y, Inoue Y, Koiwa F, Sato H, Matsuda F, et al. (2018) A mutation in transcription factor MAFB causes focal segmental glomerulosclerosis with Duane retraction syndrome. Kidney Int 94:396–407. 10.1016/j.kint.2018.02.025 [DOI] [PubMed] [Google Scholar]
- Shi G, Xing L, Wu D, Bhattacharyya BJ, Jones CR, McMahon T, Chong SY, Chen JA, Coppola G, Geschwind D, Krystal A, Ptáček LJ, Fu YH (2019) A rare mutation of β1-adrenergic receptor affects sleep/wake behaviors. Neuron 103:1044–1055.e7. 10.1016/j.neuron.2019.07.026 [DOI] [PMC free article] [PubMed] [Google Scholar]
- Sonntag T, Vaughan JM, Montminy M (2018) 14-3-3 proteins mediate inhibitory effects of cAMP on salt-inducible kinases (SIKs). FEBS J 285:467–480. 10.1111/febs.14351 [DOI] [PMC free article] [PubMed] [Google Scholar]
- Soriano P (1999) Generalized lacZ expression with the ROSA26 Cre reporter strain. Nat Genet 21:70–71. 10.1038/5007 [DOI] [PubMed] [Google Scholar]
- Suzuki A, Sinton CM, Greene RW, Yanagisawa M (2013) Behavioral and biochemical dissociation of arousal and homeostatic sleep need influenced by prior wakeful experience in mice. Proc Natl Acad Sci USA 110:10288–10293. 10.1073/pnas.1308295110 [DOI] [PMC free article] [PubMed] [Google Scholar]
- Takemori H, Okamoto M (2008) Regulation of CREB-mediated gene expression by salt inducible kinase. J Steroid Biochem Mol Biol 108:287–291. 10.1016/j.jsbmb.2007.09.006 [DOI] [PubMed] [Google Scholar]
- Tononi G, Cirelli C (2014) Sleep and the price of plasticity: from synaptic and cellular homeostasis to memory consolidation and integration. Neuron 81:12–34. 10.1016/j.neuron.2013.12.025 [DOI] [PMC free article] [PubMed] [Google Scholar]
- Uchida S, Hara K, Kobayashi A, Funato H, Hobara T, Otsuki K, Yamagata H, McEwen B, Watanabe Y (2010) Early life stress enhances behavioral vulnerability to stress through the activation of REST4-mediated gene transcription in the medial prefrontal cortex of rodents. J Neurosci 30:15007–15018. 10.1523/JNEUROSCI.1436-10.2010 [DOI] [PMC free article] [PubMed] [Google Scholar]
- Uebi T, Itoh Y, Hatano O, Kumagai A, Sanosaka M, Sasaki T, Sasagawa S, Doi J, Tatsumi K, Mitamura K, Morii E, Aozasa K, Kawamura T, Okumura M, Nakae J, Takikawa H, Fukusato T, Koura M, Nish M, Hamsten A, et al. (2012) Involvement of SIK3 in glucose and lipid homeostasis in mice. PLoS One 7:e37803. 10.1371/journal.pone.0037803 [DOI] [PMC free article] [PubMed] [Google Scholar]
- Valny M, Honsa P, Kirdajova D, Kamenik Z, Anderova M (2016) Tamoxifen in the mouse brain: implications for fate-mapping studies using the tamoxifen-inducible Cre-loxP system. Front Cell Neurosci 10:243. [DOI] [PMC free article] [PubMed] [Google Scholar]
- Wang Z, Ma J, Miyoshi C, Li Y, Sato M, Ogawa Y, Lou T, Ma C, Gao X, Lee C, Fujiyama T, Yang X, Zhou S, Hotta-Hirashima N, Klewe-Nebenius D, Ikkyu A, Kakizaki M, Kanno S, Cao L, Takahashi S, et al. (2018) Quantitative phosphoproteomic analysis of the molecular substrates of sleep need. Nature 558:435–439. 10.1038/s41586-018-0218-8 [DOI] [PMC free article] [PubMed] [Google Scholar]
- Wigren HK, Porkka-Heiskanen T (2018) Novel concepts in sleep regulation. Acta Physiol (Oxf) 222:e13017. 10.1111/apha.13017 [DOI] [PubMed] [Google Scholar]
- Xing L, Shi G, Mostovoy Y, Gentry NW, Fan Z, McMahon TB, Kwok PY, Jones CR, Ptáček LJ, Fu YH (2019) Mutant neuropeptide S receptor reduces sleep duration with preserved memory consolidation. Sci Transl Med 11:1–12. [DOI] [PMC free article] [PubMed] [Google Scholar]
- Ziv NE, Garner CC (2004) Cellular and molecular mechanisms of presynaptic assembly. Nat Rev Neurosci 5:385–399. 10.1038/nrn1370 [DOI] [PubMed] [Google Scholar]