

Abstract
Common fusion machinery mediates the Ca2+-dependent exocytosis of synaptic vesicles (SVs) and dense-core vesicles (DCVs). Previously, Synapsin Ia (Syn Ia) was found to localize to SVs, essential for mobilizing SVs to the plasma membrane through phosphorylation. However, whether (or how) the phosphoprotein Syn Ia plays a role in regulating DCV exocytosis remains unknown. To answer these questions, we measured the dynamics of DCV exocytosis by using single-vesicle amperometry in PC12 cells (derived from the pheochromocytoma of rats of unknown sex) overexpressing wild-type or phosphodeficient Syn Ia. We found that overexpression of phosphodeficient Syn Ia decreased the DCV secretion rate, specifically via residues previously shown to undergo calmodulin-dependent kinase (CaMK)-mediated phosphorylation (S9, S566, and S603). Moreover, the fusion pore kinetics during DCV exocytosis were found to be differentially regulated by Syn Ia and two phosphodeficient Syn Ia mutants (Syn Ia-S62A and Syn Ia-S9,566,603A). Kinetic analysis suggested that Syn Ia may regulate the closure and dilation of DCV fusion pores via these sites, implying the potential interactions of Syn Ia with certain DCV proteins involved in the regulation of fusion pore dynamics. Furthermore, we predicted the interaction of Syn Ia with several DCV proteins, including Synaptophysin (Syp) and soluble N-ethylmaleimide-sensitive factor attachment receptor (SNARE) proteins. By immunoprecipitation, we found that Syn Ia interacted with Syp via phosphorylation. Moreover, a proximity ligation assay (PLA) confirmed their phosphorylation-dependent, in situ interaction on DCVs. Together, these findings reveal a phosphorylation-mediated regulation of DCV exocytosis by Syn Ia.
SIGNIFICANCE STATEMENT Although they exhibit distinct exocytosis dynamics upon stimulation, synaptic vesicles (SVs) and dense-core vesicles (DCVs) may undergo co-release in neurons and neuroendocrine cells through an undefined molecular mechanism. Synapsin Ia (Syn Ia) is known to recruit SVs to the plasma membrane via phosphorylation. Here, we examined whether Syn Ia also affects the dynamics of DCV exocytosis. We showed that Syn Ia regulates the DCV secretion rate and fusion pore kinetics during DCV exocytosis. Moreover, Syn Ia-mediated regulation of DCV exocytosis depends on phosphorylation. We further found that Syn Ia interacts with Synaptophysin (Syp) on DCVs in a phosphorylation-dependent manner. Thus, these results suggest that Syn Ia may regulate the release of DCVs via phosphorylation.
Keywords: CaMK-mediated phosphorylation, dense-core vesicles, exocytosis, fusion pore kinetics, Synapsin Ia, Synaptophysin
Introduction
Ca2+-regulated exocytosis mediates neurotransmitter release from two types of vesicles, synaptic vesicles (SVs) and dense-core vesicles (DCVs), which differ in their sizes, cargos, positions relative to the plasma membrane, secretion rates, and fusion pore dynamics (Gondré-Lewis et al., 2012). Many neurons and neuroendocrine cell contain both types of vesicles (Hökfelt et al., 1980; De Camilli and Jahn, 1990). Further evidence has suggested that the cargos of SVs and DCVs can be co-released upon vigorous stimulation (Nusbaum et al., 2001; Levitan and Kaczmarek, 2015; Svensson et al., 2018). In particular, both types of vesicles share common fusion machinery underlying exocytosis; this fusion machinery includes soluble N-ethylmaleimide-sensitive factor attachment receptor (SNARE) proteins, such as syntaxin (Stx), synaptosome-associated protein of 25 kDa (SNAP-25), and synaptobrevin (Syb; Voets, 2000; Jahn and Fasshauer, 2012). For several decades, co-release from SVs and DCVs has been thought to be attributed to the widespread increase in Ca2+ levels upon vigorous stimulation. However, some neurons can selectively release cargos from either SVs or DCVs upon stimulation, implying that a specific molecular mechanism controls selective release from SVs, DCVs, or both (Nusbaum et al., 2001; Levitan and Kaczmarek, 2015; Svensson et al., 2018).
Synapsins (Syns) were shown to localize to SVs and are essential for upregulating SV release by recruiting SVs to the plasma membrane (Cesca et al., 2010). Syn Ia is best studied among the ten homologous proteins in the Syn family. Under resting conditions, Syn Ia tethers SVs to actin, and a depolarizing stimulus triggers the dissociation of Syn Ia from SVs via phosphorylation, thus mobilizing SVs to the releasable pool in the proximity of the plasma membrane (Greengard et al., 1993). Previous studies have shown that phosphorylation of the MAP kinase (MAPK) sites of Syn Ia (mainly S62) decreases Syn Ia binding to SVs upon high-frequency stimulation (Chi et al., 2003; Cesca et al., 2010). In contrast, phosphorylation of the calmodulin-dependent kinase (CaMK) sites of Syn Ia (S9, S566, and S603) decreases its binding to both SVs and actin upon low-frequency stimulation through a remarkable conformational change in the Syn Ia molecule (Benfenati et al., 1990; Ceccaldi et al., 1995). Moreover, the binding of Syn Ia to SVs is more sensitive to phosphorylation by CaMK than MAPK (Cesca et al., 2010), suggesting that the phosphorylation of these residues may have different capacities to modulate the SV secretion rate or dynamics of exocytosis.
Although Syn Ia is well known to regulate SV exocytosis through the actions of various protein kinases at multiple phosphorylation sites, whether (or how) this phosphoprotein regulates DCV exocytosis remains completely unknown. Single-vesicle amperometry has been extensively used to explore the secretion rate and mechanisms of fusion pore kinetics during DCV exocytosis, especially in PC12 cells with catecholamine-containing DCVs (Jankowski et al., 1993; Wang et al., 2001; Chiang et al., 2014). In this study, we aimed to determine whether Syn Ia regulates the dynamics of DCV exocytosis. By combining the results of molecular perturbation, amperometric recordings, bioinformatics analysis, and biochemical experiments, we show that the DCV secretion rate was greatly reduced by a Syn Ia mutant harboring phosphodeficient CaMK sites (Syn Ia-S9,566,603A). In contrast, the fusion pore kinetics of DCVs were found to be differentially regulated by Syn Ia mutants with a phosphodeficient MAPK site (Syn Ia-S62A) or phosphodeficient CaMK sites. Kinetic analysis suggests that Syn Ia may regulate the closure and dilation of DCV fusion pores. We thus predicted the interaction of Syn Ia with several DCV proteins and further verified their interaction by immunoprecipitation and a proximity ligation assay (PLA). Finally, we found that Syn Ia can interact with Synaptophysin (Syp) on DCVs in a phosphorylation-dependent manner. Thus, these results suggest a phosphorylation-mediated mechanism by which Syn Ia regulates DCV exocytosis, similar to its regulation of SV exocytosis.
Materials and Methods
DNA plasmids
cDNA encoding wild-type Syn Ia (from Paul Greengard's laboratory, Rockefeller University) was subcloned into the bicistronic vector pCMV-IRES2-EGFP (control, designated Ctrl hereinafter; Clontech, 6029-1) with the BglII and SacI sites, yielding the plasmid pCMV-Syn Ia-IRES2-EGFP (designated Syn Ia hereinafter). Plasmid containing the sequence of a Syn Ia phosphodeficient mutant, pCMV-Syn Ia-S62A-IRES2-EGFP (designated Syn Ia-S62A hereinafter), was kindly provided by Meyer B. Jackson's laboratory (University of Wisconsin-Madison). Plasmid containing the sequence of the other Syn Ia phosphodeficient mutant, pCMV-Syn Ia-S9,566,603A-IRES2-EGFP (designated Syn Ia-S9,566,603A hereinafter), was acquired by using the QuikChange MultiSite-Directed Mutagenesis kit (Agilent Technologies, 200514) with designed primers (forward primers: 5'-CCgCCTggCggACAgCAACTACATggCCAATC-3′ and 5'-ATTCgTCAggCCggCCAggCAggT-3'; reverse primers: 5'-CTggACCAgAgATAgCTgCCTgACgggTAgC-3'). All of the DNA plasmids were confirmed by automated sequencing and amplified (QIAGEN, 12181) for transfection.
Cell culture
PC12 cells (derived from the pheochromocytoma of rats of unknown sex) were cultured in 10 cm dishes containing PC12 culture medium [DMEM (Sigma, D5648), 3.7 g/l NaHCO3 (Sigma, S6297), 5% bovine calf serum (HyClone, 0805-SH30074.03), and 5% equine serum (HyClone, 0805-SH30072.03), pH 7.4] and maintained in 10% CO2 at 37°C. The medium was renewed every other day. The cells were moved to new dishes upon reaching full confluence.
Transient transfection
Cells were harvested in HBSS (modified; Sigma, H4891), 0.35 g/l NaHCO3, and 1 mm EDTA (Sigma, E5134), pH 7.2] and centrifuged at 1000 × g and room temperature (RT) for 3 min. The cell pellets were resuspended in 500 µl of a DNA (50 µg)-containing Cytomix solution (120 mm KCl, 0.15 mm CaCl2, 10 mm KH2PO4, 2.5 mm HEPES, 2 mm EGTA, and 5 mm MgCl2, pH 7.6) and transferred into a 4-mm cuvette (Harvard Apparatus, 45-0126) for electroporation using a 230-V square pulse for 5 ms (BTX ECM830, square pulse electroporator, Harvard Apparatus, 45-0052). After electroporation, the cells were immediately transferred into recovery medium [PC12 culture medium containing 10% fetal bovine serum (Biological Industries Ltd., 04-004-1A)]. The recovery medium was replaced with fresh PC12 medium on the following day.
Reverse transcriptase-quantitative PCR (RT-qPCR)
At 72 h after transfection, RNA samples were extracted from the transfected cells by TRIzol reagent (Invitrogen) and further phase separated by chloroform (Sigma). The samples were centrifuged at 12,000 × g and 4°C for 15 min. Approximately 0.6 ml of the RNA in the upper aqueous phase was precipitated by mixing with 0.5 ml of isopropanol and further centrifuged at 12,000 × g and 4°C for 10 min. After the supernatants have been discarded, the RNA pellets were washed once with 75% ethanol, followed by centrifugation at 12,000 × g and 4°C for 10 min. The supernatants were then completely discarded. The RNA pellets were air-dried at RT for 20 min, dissolved in 20 μl of DEPC-treated water, and incubated at 60°C for 15 min. The RNA samples were stored at −80°C for additional experiments. cDNA sequences were synthesized from RNA samples by using the ProtoScript II First Strand cDNA Synthesis kit (New England BioLabs). qPCR to amplify the cDNA samples was performed with a LabStar SYBR qPCR kit (TAIGEN Bioscience Corporation) with specific primer sequences that recognized Syn Ia (forward primer: 5'-AgCTCAACAAATCCCAgTCTCT-3' and reverse primers: 5'-CggATggTCTCAgCTTTCAC-3'). The cycle threshold (Ct) values from the SYBR fluorescence data were evaluated by using a thermocycler (QIAGEN Rotor-Gene Q) and supplemental software (QIAGEN Rotor-Gene Series Software 1.7). The mRNA level (ΔCt) was acquired by subtracting the Ct of the reference gene (β-actin) from the Ct of the target gene (Syn Ia). The ΔΔCt value was obtained by subtracting the median of the ΔCt values of the control group from the ΔCt values of the transfection group. Relative Syn Ia mRNA expression levels were calculated as 2(−ΔΔCt).
Single-vesicle amperometry and data analysis
At 60–96 h after transfection, transfected cells were transferred by using a 22-gauge needle and replated on 35 mm dishes coated with poly-D-lysine (BD Biosciences, B354236) and collagen I (BD Biosciences, B354210) at a density of 2 × 10⁵ cells per dish. To load the DCVs with catecholamines, the cells were incubated with PC12 culture medium containing 1.5 mm norepinephrine (NE; Sigma, A5785) and 0.5 mm ascorbate (Sigma, A5960) for 16 h. The culture medium was replaced with fresh medium at least 1 h before amperometric recordings.
During recordings, cells were bathed in a solution containing 150 mm NaCl, 4.2 mm KCl, 1 mm NaH2PO4, 0.7 mm MgCl2, 2 mm CaCl2, and 10 mm HEPES, pH 7.4. Secretion was induced by the pressure ejection of a high-KCl solution (the bathing solution with the NaCl replaced by 140 mm KCl) from a 2-µm micropipette. We used a 5-µm carbon fiber electrode (CFE-1 or CFE-2, ALA Scientific Instruments) connected to a VA-10× amplifier (ALA Scientific Instruments) at a polarization of 650 mV to record NE release from DCVs as an oxidative current. The signals were amplified by the VA-10× amplifier (ALA Scientific Instruments), sent to the Digidata 1440A interface (MDS Analytical Technologies), and processed with pClamp10 software (Molecular Devices).
Amperometry data were analyzed as previously described using a written computer program (Wang et al., 2001, 2003a, 2006; Chiang et al., 2014). Amperometric events with a peak amplitude ≥2 pA (∼7×RMS noise) were collected for the calculation of all secretion events. Notably, the same dataset (Figs. 1–5) was used for this study. To further separate the kiss-an-run (KR) and full-fusion (FF) events, two temporal parameters, t1 and t2, were defined as previously reported (Chiang et al., 2014; Fig. 4). t1 was defined as the duration from onset to when the signal fell to the mean value (50–100%), i.e., the average value of the 50–100% peak amplitude of events. t2 was defined as the duration from onset to when the signal fell back to baseline. The t1/t2 ratio at 3.5 pA was very sensitive to the shape of the two types of fusion events, the FF (spike-shaped) and KR (square or rectangular) events. Thus, a cutoff peak amplitude of 3.5 pA was used to divide FF events from KR events (Figs. 4, 5). Events with a peak amplitude ≥3.5 pA were defined as FF events, and those with a peak amplitude with 2–3.5 pA were defined as KR events. The spike characteristics were analyzed with a written computer program based on the criterion illustrated in Figure 2A and calculated by the cellular mean method, i.e., the double-mean method (Colliver et al., 2000; Wang et al., 2006; Chiang et al., 2014). Briefly, the means for each cell were individually computed and then averaged to yield a cellular mean, with the number of cells (rather than the number of events) used to calculate the standard errors. To measure the prespike foot (PSF), we collected PSF events with a peak amplitude ≥13 pA because events with a large peak amplitude clearly displayed the characteristics of PSF. PSF duration was measured from onset to the end point, which was set as the time corresponding to the intersection between the baseline and a line going through the 35–60% peak amplitude (Fig. 2A, the shaded region). Histograms showing PSF duration were constructed as semi-log plots and fitted by a single-exponential decay function [N(t) = N(0) × exp (-t/τ)] to yield the mean PSF duration (τ; Origin8, OriginLab Corp). The PSF mean amplitude and area were calculated by the cellular mean method.
Figure 1.

Regulation of secretion from DCVs by Syn Ia or phosphodeficient Syn Ia mutants. A, Transfected cells were incubated with NE before amperometric recordings. The release of NE from individual DCVs was induced by puffing a high-KCl solution and detected as an oxidative current at the potentiated CFE. B, Relative Syn Ia mRNA levels were determined by qPCR with primers specific for Syn Ia. All data were normalized to the median value of the Ctrl group and are presented as the mean ± SEM; #p < 0.05 compared with Ctrl, Mann–Whitney test. Numbers in columns indicate the numbers of experiments. C, Representative secretion events from amperometric recordings in cells expressing Ctrl, Syn Ia, Syn Ia-S62A, or Syn Ia-S9,566,603A. The black line on the bottom indicates the application of KCl (20 s). D, Cumulative events (events with a peak amplitude ≥2 pA; normalized by cell number) from the onset of KCl application (black line) to the end of recording. E, Fitted secretion rates for the 0- to 10-s and 10- to 20-s phases in D. F, Bulk secretion rate. All data are presented as the mean ± SEM. Numbers in columns indicate cell numbers; *p < 0.05, **p < 0.01, ***p < 0.001, one-way ANOVA with Student–Newman–Keuls post hoc test; ###p < 0.001 versus Ctrl, two-tailed Student's unpaired t test.
Figure 5.
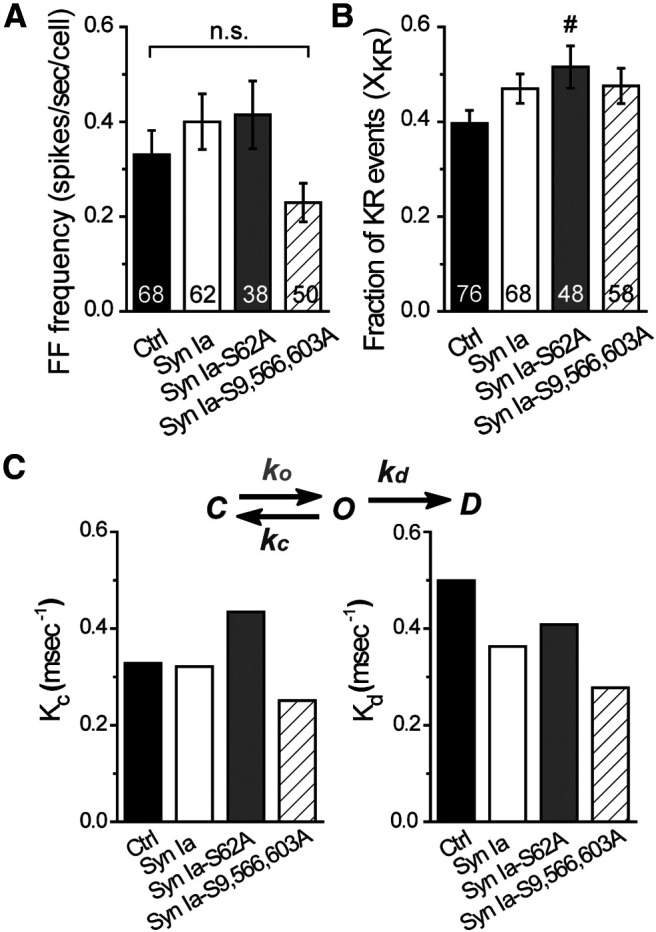
The kinetics of DCV fusion pore regulation by Syn Ia or phosphodeficient Syn Ia mutants. A, FF frequency from FF events (≥3.5 pA). B, Fraction of KR events (XKR) as the ratio of KR event number (2–3.5 pA) versus total event number. For A, B and Figure 1F, cellular means from the same dataset were used. All data are presented as the mean ± SEM. Numbers in columns indicate cell numbers; #p < 0.05 versus Ctrl, Mann–Whitney test. n.s., no significance, Kruskal–Wallis test with Dunn post hoc test or Mann–Whitney test. C, A model of fusion pore kinetics. The rate constant kc represents the rate of fusion pore transition from an open state toward a closed state, and the rate constant kd represents the rate of fusion pore transition from an open state toward a dilated state. Both kc and kd were resolved from the mean PSF duration (Fig. 2C) and XKR (B) using previously reported equations (τ = 1/kc + kd; XKR = kc/kc + kd; Wang et al., 2001, 2006; Chiang et al., 2014).
Figure 4.

Two fusion events for DCV exocytosis in cells overexpressing Syn Ia or phosphodeficient Syn Ia mutants. A, Representative FF (left) and KR (right) events. t1 (gray) represents the duration from onset to the time when the signal fell back to the mean value above the 50% peak amplitude. t2 (black) represents the whole duration from onset to the time when the signal fell back to the baseline. Since the ratio of t1 to t2 is very sensitive to the event shape (KR events with a square shape exhibit larger t1/t2 ratios than spike-shaped FF events), these t1/t2 ratios can be used to distinguish KR events from FF events. A cutoff peak amplitude of 3.5 pA was set to separate FF events from KR events (Chiang et al., 2014). B, Scatter plots of mean KR amplitudes versus duration from individual KR events (dots). R2, coefficient from linear regression (gray). C, Scatter plots of mean PSF amplitudes versus duration from individual events (peak amplitude ≥13 pA; dots). R2, coefficient from linear regression (gray). D, Histograms of the mean amplitudes from individual FF events (≥3.5 pA). Insets, Histograms of mean KR amplitudes from individual KR events fitted as a Gaussian distribution (gray). Mean ± SEM and R2 values from Gaussian distributions are as indicated. Data are from the same datasets as for Figures 1–4. For KR events, n = 320 for Ctrl, 395 for Syn Ia, 274 for Syn Ia-S62A, and 185 for Syn Ia-S9,566,603A. For FF events, n = 607 for Ctrl, 617 for Syn Ia, 387 for Syn Ia-S62A, and 282 for Syn Ia-S9,566,603A.
Figure 2.

The mean open time of fusion pores is regulated by Syn Ia or phosphodeficient Syn Ia mutants. A, A representative FF event. The shaded region indicates a PSF. B, PSF open time distributions (semi-log plots for the histograms of PSF duration) fitted by a single-exponential decay function, N(t) = N(0) × exp (-t/τ), yielding the mean PSF duration, τ (ms); R2, the goodness of fit. C, Mean PSF duration, τ obtained in B. D, E, Mean PSF amplitude and area (events with a peak amplitude ≥13 pA). All data are presented as the mean ± SEM. Numbers in columns indicate event numbers in C or cell numbers in D, E; *p < 0.05, **p < 0.01, ***p < 0.001, one-way ANOVA with Student–Newman–Keuls post hoc test; ##p < 0.01 versus Ctrl, two-tailed Student's unpaired t test. n.s., no significance, one-way ANOVA with Student–Newman–Keuls post hoc test or two-tailed Student's unpaired t test.
To perform the kinetic analysis, the rate constants kc and kd in the kinetic model were resolved from the mean PSF duration [τ = 1/(kc+ kd)] (Fig. 2C) and KR fraction (XKR) [XKR = kc/(kc+ kd)] (Fig. 5B) as previously reported (Wang et al., 2001, 2006; Chiang et al., 2014).
Immunofluorescence staining
Transfected cells were incubated with a high-KCl solution for 5 min. The cells were washed with 1× PBS (137 mm NaCl, 2.7 mm KCl, 4.3 mm Na2HPO4, and 1.47 mm KH2PO4, pH 7.4 with NaOH) and then fixed with 4% paraformaldehyde (PFA), followed by a wash with 1× PBS for 10 min. The cells were permeabilized with 0.1% Triton X-100, followed by three washes with 1× PBS. The cell-containing coverslips were transferred onto a Parafilm sheet. Cells were incubated in blocking buffer [3% normal donkey serum (Jackson ImmunoResearch, 017000121) and 0.1% Triton X-100 in 1× PBS] at RT for 1 h. After blocking, the cells were incubated with primary antibodies [for Fig. 6A, top: rabbit anti-Syn I (Cell Signaling, 5297) and mouse anti-chromogranin B (ChB; BD Transduction Lab, 611646); for Fig. 6A, middle: rabbit anti-Syn I (Cell Signaling, 5297) and mouse anti-Syp (Millipore, MAB5258); for Fig. 6A, bottom: mouse anti-Syp (Millipore, MAB5258) and rabbit anti-ChB (Synaptic Systems, 259103)] in blocking buffer at 4°C overnight, followed by six washes with 1× PBS. Subsequently, the cells were incubated with secondary antibodies in blocking buffer at RT in the dark for 1 h, followed by six washes with 1×PBS. 4',6-diamidino-2-phenylindole (DAPI) was then added to stain the nuclei at RT in the dark for 10 min. Finally, the coverslips were mounted onto glass slides with Fluoromount G (Electron Microscopy Sciences, 17984-25). Images (1.5-μm z-thickness) were acquired by laser scanning confocal microscopy (Leica TCS SP5 or SP8 Spectral). Colocalization was quantified with MetaMorph software (Molecular Devices).
Figure 6.
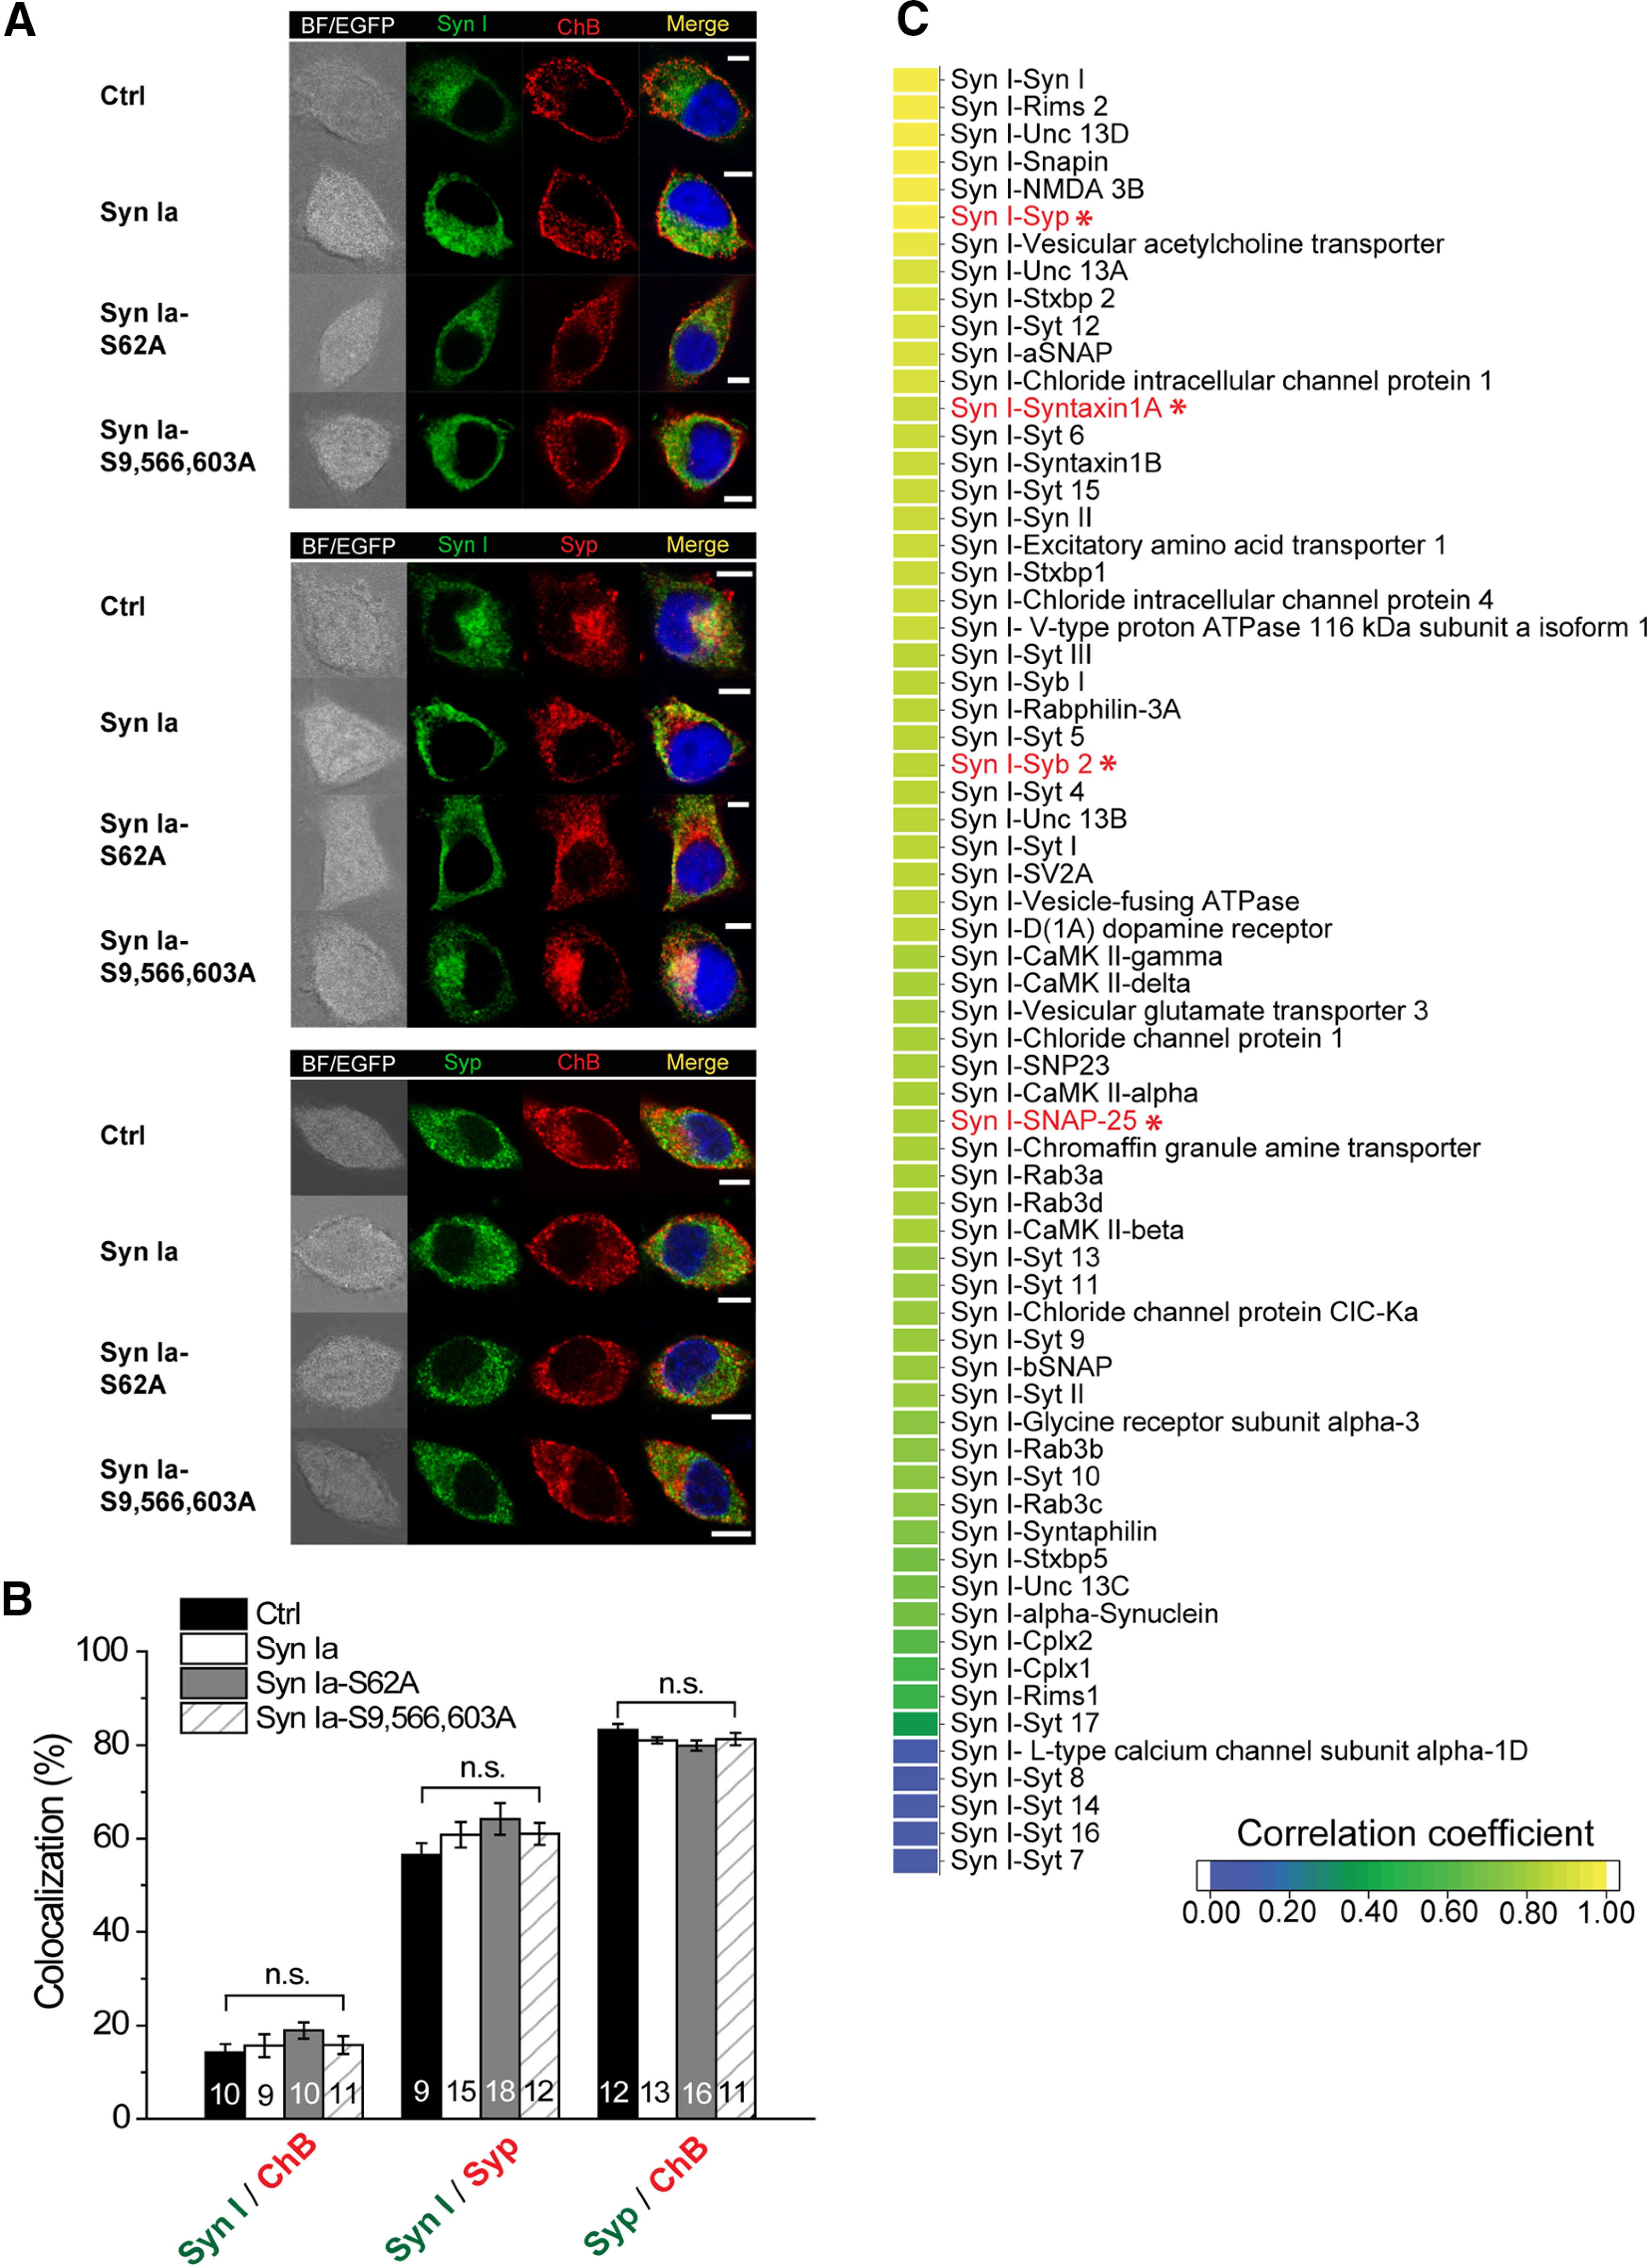
Subcellular localization of Syn Ia and the prediction of putative Syn Ia-interacting proteins. A, Representative immunofluorescence images showing Syn I with a DCV marker (ChB), Syn I with a general vesicle marker (Syp), or Syp with ChB after KCl depolarization. EGFP (white), transfected cells. Merge, immunoreactivity colocalization (yellow). BF, bright field. Scale bars: 5 μm. B, top, The proportion of Syn I immunoreactivity that overlapped ChB immunoreactivity, reflecting the percentage of Syn I that targeted DCVs. Middle, The proportion of Syn I immunoreactivity that overlapped Syp immunoreactivity, reflecting the percentage of Syn I that targeted vesicles in general. Bottom, The proportion of Syp immunoreactivity that overlapped ChB immunoreactivity, reflecting the percentage of Syp that targeted DCVs. All data are presented as the mean ± SEM. Numbers in columns indicate cell numbers. n.s., no significance, one-way ANOVA with Student–Newman–Keuls post hoc test or two-tailed Student's unpaired t test. C, Correlation coefficients in the heat map predict the possibility of interaction between individual protein pairs (n = 66) from 1 (yellow) to 0 (dark blue). A red font and an asterisk indicate an interaction with a protein that functions in DCV release.
Protein-protein interaction (PPI) prediction
Proteins of interest were selected (66 synaptic proteins) for sequence-based PPI prediction with the MirrorTree server (http://csbg.cnb.csic.es/mtserver/, developed by the National Center for Biotechnology, Computational Systems Biology Group, Madrid, Spain; Ochoa and Pazos, 2010). MirrorTree, a computational server, can be used to predict the possibility of protein interaction based on assessing the coevolution of and similarity between two protein families with 800 residues from 120 species, including Homo sapiens, Rattus norvegicus, and many vertebrate species. Individual protein sequence pairs (Syn Ia and 66 putative Syn Ia-interacting proteins) were first imported into the MirrorTree server. The default parameters were used, except for “coverage” [homologs selection: % identity (≥30%), e value (≤1e-5), and % coverage (≥50%); orthologs selection: % identity (≥30%), and % Gap (≤90%)]. The sequence with the highest identity to the query sequence was selected from the multiple sequence alignment (MSA). The correlation coefficients [scoring from 1 (yellow) to 0 (dark blue)] for individual protein pairs were automatically evaluated according to the standard equation for PPI prediction, and the possibility of interaction is represented as a heat map.
Western blot analysis
Transfected cells at 72 h after transfection were incubated with a high-KCl solution for 1 min and further extracted using ice-cold RIPA lysis buffer [1% NP-40 and 150 mm NaCl, 1 mm EDTA, 1 mm phenylmethylsulfonyl fluoride (Sigma, P7626), 1 mm sodium orthovanadate (Sigma, S6508), 10 mm sodium fluoride (Sigma, S7920), and 50 mm HEPES, pH 7.4 supplemented with a protease inhibitor cocktail (Sigma, P2714)], followed by centrifugation to acquire the soluble fraction. The cellular protein lysate (20 µl) with 4× sample buffer [final concentration (1×): 62.5 mm Tris-HCl, 2% SDS (Bioshop, SDS001), 10% glycerol (J. T. Baker, 2136-01), 5% β-mercaptoethanol (Sigma, 3148), 0.002% bromophenol blue (Sigma, B0126), and 100 mm DTT (Sigma, D0632), pH 6.8] was further boiled for 5 min, electrophoresed on 12% SDS polyacrylamide gels, and transferred to polyvinylidene fluoride (PVDF) membranes (Immobilon-P, Millipore). The membranes were blocked in 3% nonfat milk in TBST (50 mm Tris-HCl, pH 7.4, 150 mm NaCl, and 0.1% Tween 20) at RT for 1 h and then incubated with primary antibodies [mouse anti-Syn I (Synaptic Systems, 106011, 1:6000 dilution); mouse anti-Syp (Synaptic Systems, 101002, 1:10,000 dilution); mouse anti-Stx I (Santa Cruz, sc-12 736, 1:8000 dilution); mouse anti-SNAP-25 (Synaptic Systems, 111011, 1:5000 dilution); mouse anti-Syb (Synaptic Systems, 104211, 1:100,000 dilution); and mouse anti-α-tubulin (Sigma, T5168, 1:100,000 dilution)] at 4°C overnight. The membranes were washed three times with TBST and then incubated with secondary antibodies in 3% milk in TBST at RT for 1 h. Finally, the membranes were washed three times with TBST. Signals were visualized by enhanced chemiluminescence (ECL; Millipore), followed by autoradiography with the Western Imaging System (ProteinSimple or Analytik Jena UVP). Protein levels were quantified with ImageJ with background subtraction.
Endogenous coimmunoprecipitation
At 72 h after transfection, the transfected cells were incubated with a high-KCl solution for 1 min and further lysed in ice-cold RIPA buffer, followed by centrifugation to acquire the soluble fraction (500 µg of protein/500 µl of RIPA buffer). The soluble fraction (500 µl) was precleared with 55 µl of protein G Sepharose beads [GE Healthcare Life Science, 71-7083-00; beads have been prewashed twice with ice-cold 1× PBS and once with ice-cold 1× RIPA buffer (1% NP-40, 150 mm NaCl, 1 mm EDTA, and 50 mm HEPES, pH 7.4), followed by centrifugation and resuspension with the same volume of ice-cold 1× RIPA buffer] at 4°C for 10 min. After centrifugation, the supernatant was acquired and incubated with antibody to immunoprecipitate Syn I [1 µl of rabbit anti-Syn I (Cell Signaling, 5297)] at 4°C overnight [or incubated with the same amount of rabbit IgG (The Jackson Laboratory, 011-000-002) as the negative control]. The immunoprecipitated complex was further incubated with 55 µl of protein G Sepharose beads (prepared as above) at 4°C for 2 h. After centrifugation, the pellets (∼25 µl) were acquired and washed three times with ice-cold 1× PBS, after which trace buffer was removed using a 27-gauge needle with a syringe. The immunoprecipitates were boiled with 2× sample buffer (total volume, ∼55 µl) for 5 min. After centrifugation, 20 µl of the sample was loaded for electrophoresis on SDS polyacrylamide gels and transferred to PVDF membranes for Western blot analysis using primary antibodies as described above.
PLA
Intact or transfected cells on coated coverslips were washed with 1× PBS, incubated with a high-KCl solution for 1 min, fixed with 4% PFA, and then washed twice with 1× PBS. The cells were permeabilized with 0.1% Triton X-100, followed by two washes with ice-cold 1× PBS. The cell-containing coverslips were transferred onto a Parafilm sheet and quickly washed with ddH2O to remove salts. The cells were stained according to the protocol of the Duolink PLA Kit. After blocking, cells were incubated with two primary antibodies [for Fig. 9A1–A3: mouse anti-Stx I (Santa Cruz, sc-12 736) and rabbit anti-SNAP-25 (Synaptic Systems, 111002); for Fig. 9A6,A7: mouse anti-Syp (Synaptic Systems, 101011) and rabbit anti-ChB (Synaptic Systems, 259103); for Fig. 9B: rabbit anti-Syn I (Cell Signaling, 5297) and mouse anti-Syp (Synaptic Systems, 101011); for Fig. 9D: rabbit anti-Syn I (Cell Signaling, 5297) and goat anti-Syp (R&D Systems, AF5555)] in the antibody diluent (PLA kit) at 4°C overnight, followed by two washes with 1× wash buffer A (0.01 m Tris-HCl, 0.15 m NaCl, and 0.05% Tween 20, pH 7.4). Subsequently, the cells were incubated with two PLA probes (for Fig. 9A,B, Sigma DUO92002 and DUO92004; for Fig. 9D, Sigma DUO92002 and DUO92003) in the PLA probe solution at 37°C in the dark for 1 h, followed by two washes with 1× wash buffer A. The ligation-ligase solution (for Fig. 9A,B, Sigma DUO92008; for Fig. 9D, Sigma DUO92007) was added to the samples, which were incubated at 37°C in the dark for 30 min. Subsequently, the cells were incubated with the amplification-polymerase solution (for Fig. 9A,B, Sigma, DUO92008; for Fig. 9D, Sigma, DUO92007) at 37°C in the dark for 100 min, followed by two washes with 1× wash buffer B (0.2 m Tris and 0.11 m NaCl, pH 7.5). To counterstain ChB (a DCV marker), after the PLA, the cells were washed twice in 1× wash buffer B for 10 min and rinsed with 1× wash buffer A. After blocking, the cells were incubated with primary antibody against ChB (BD Transduction Lab, 611646) in blocking buffer at 4°C for 24 h, followed by a wash with 1× wash buffer A. Subsequently, the cells were incubated with secondary antibody (Alexa Fluor 647-conjugated donkey anti-mouse secondary antibodies; Invitrogen, a31571) in blocking buffer at RT in the dark for 1 h, followed by a wash with 1× wash buffer A. Then, cells on coated coverslips were washed with 0.01× wash buffer B in the dark for 1 min. Finally, the coverslips were mounted onto glass slides with Duolink In Situ Mounting Medium with DAPI (Sigma, DUO82040). Fluorescence images (1.5-μm z-thickness) were acquired by laser scanning confocal microscopy (Leica TCS SP5 spectral laser scanning confocal microscope), with the same imaging conditions used for all transfected groups. PLA signals and colocalization were quantified with MetaMorph software. Cellular PLA signals (Fig. 9C) were calculated by the ratio of the number of fluorescence pixels versus the total number of pixels in the cell. To quantify colocalization, ratios of the overlapping signals in each cell (Fig. 9E,F) were calculated by MetaMorph and further analyzed by Excel and Origin 8.
Figure 9.
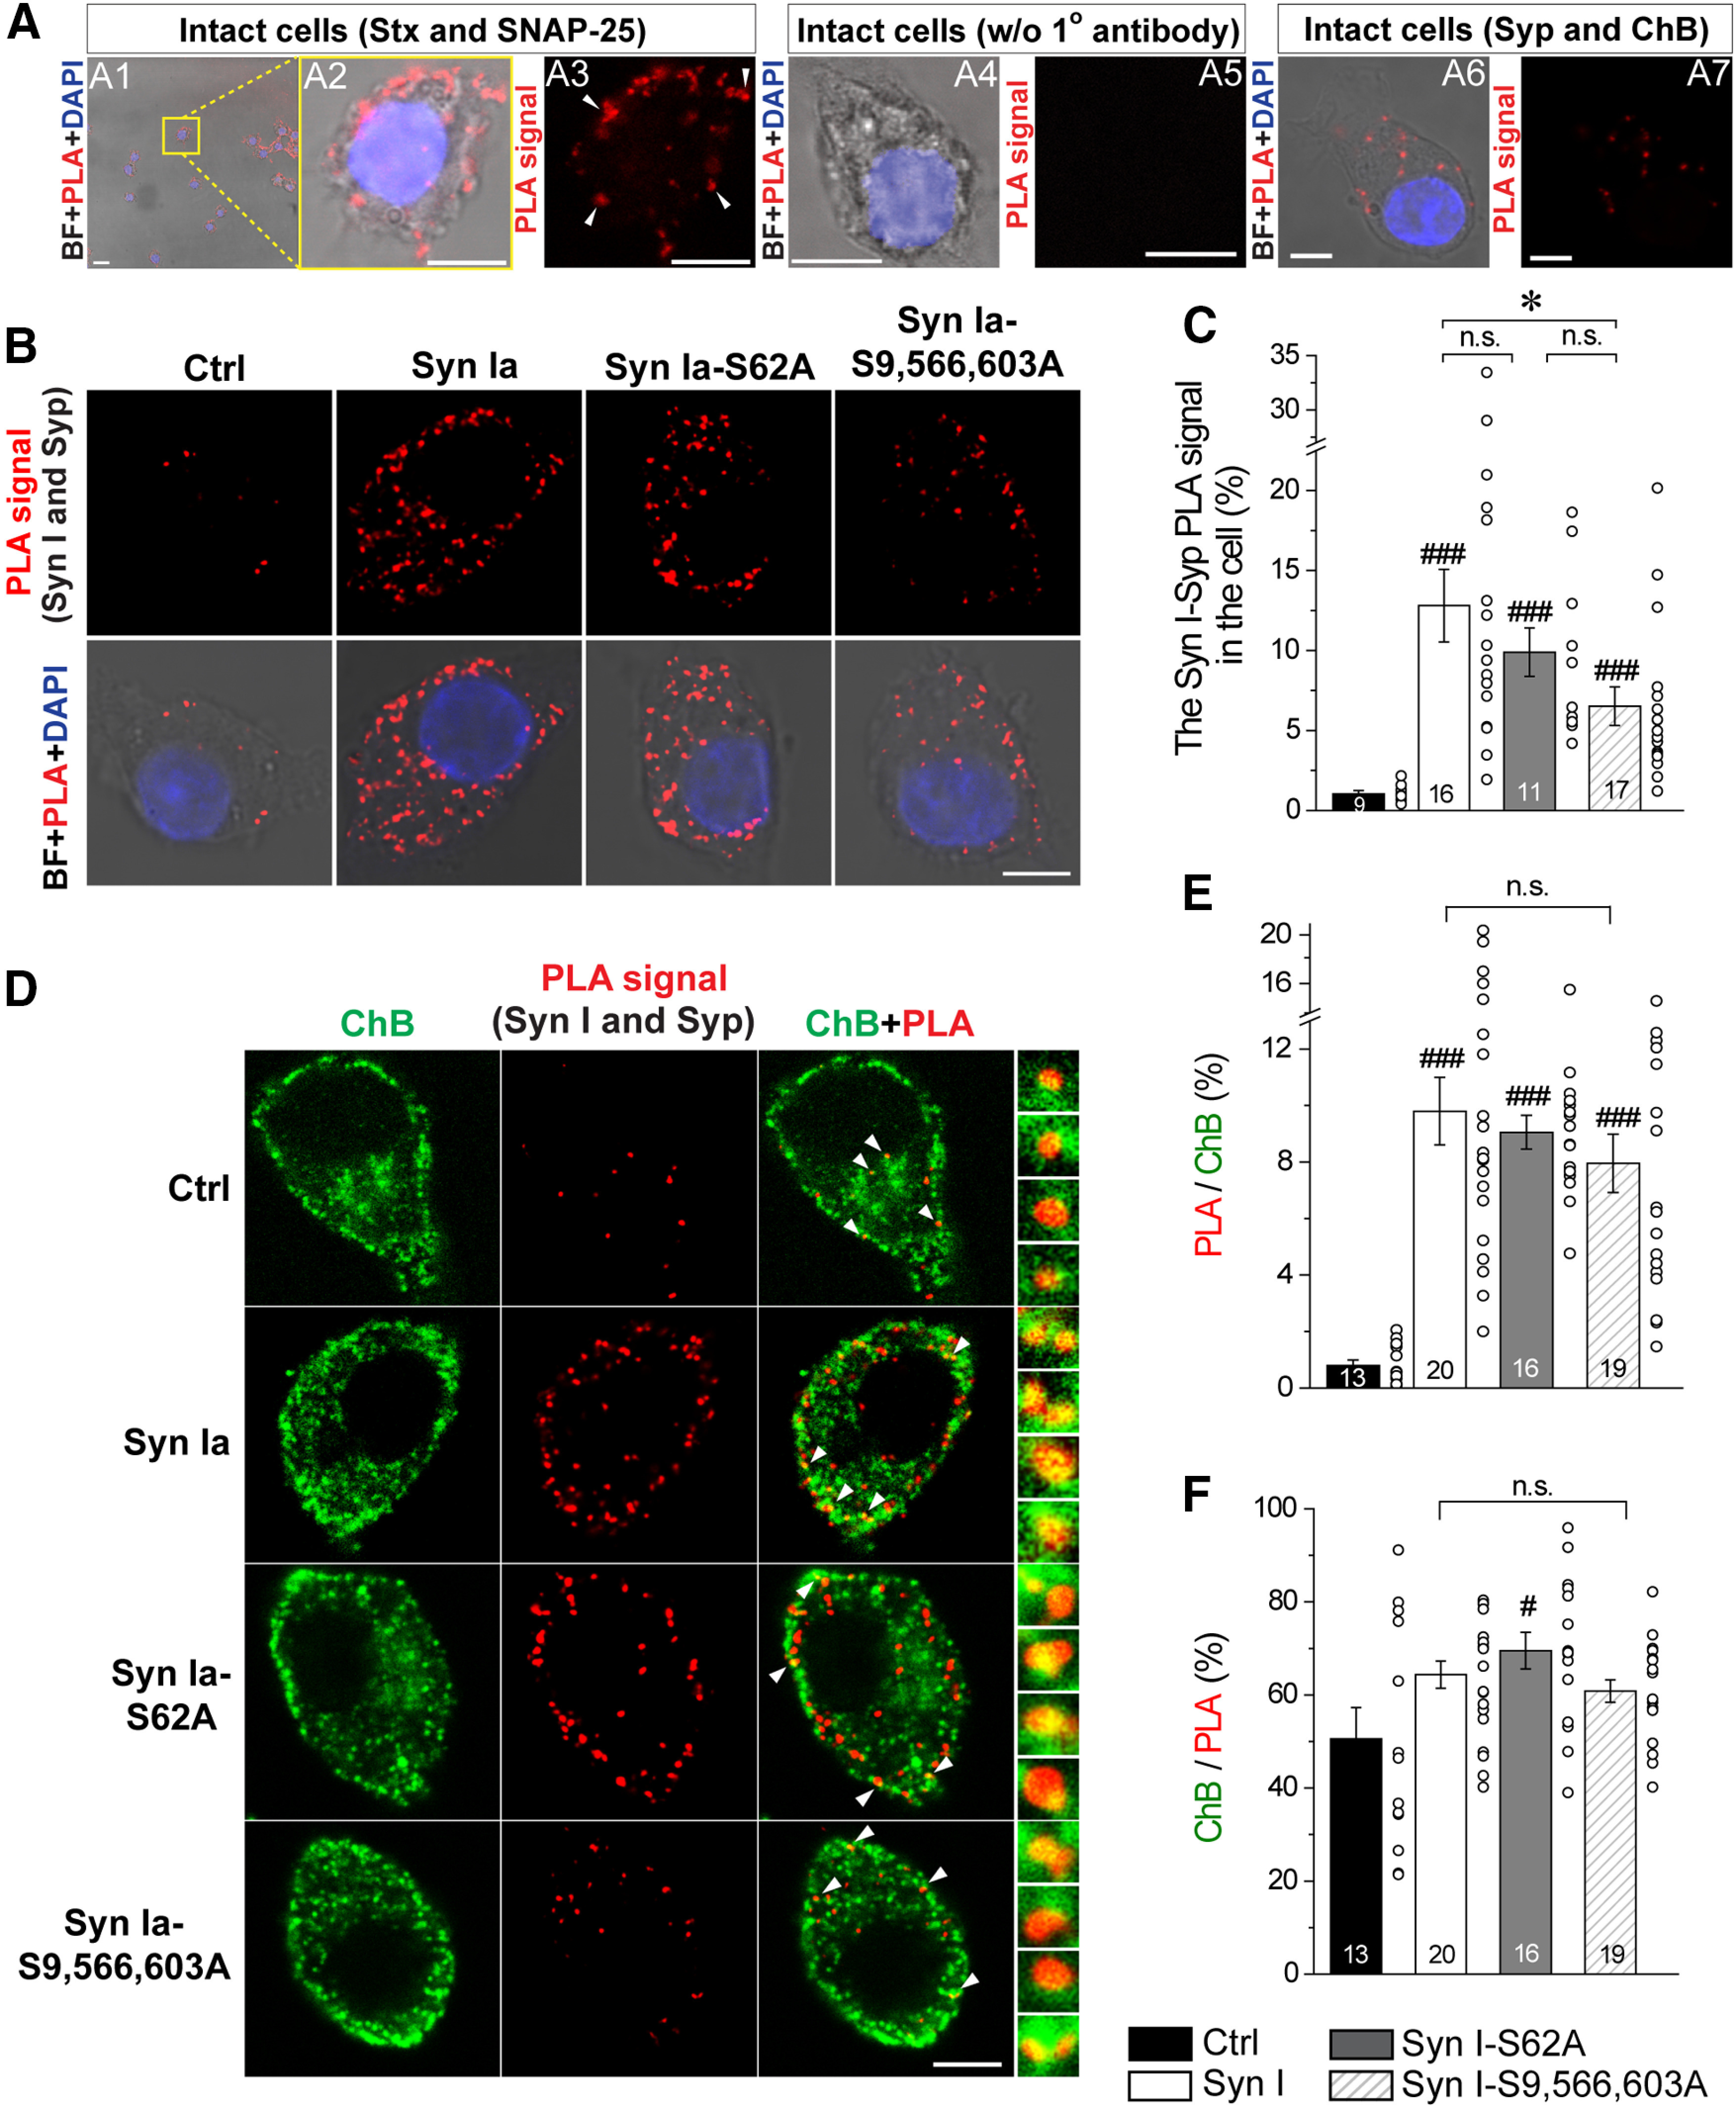
The in situ interaction between Syn I and Syp on DCVs. Individual fluorescent spots (red) represent in situ PPIs detected by the PLA. ChB, green; DAPI, blue; BF, bright field. Scale bars: 5 μm. A1–A3, The interaction of Stx with SNAP-25 in intact cells. A2, A3, The yellow box in A1. A3, The interaction of Stx with SNAP-25 detected by PLA (white arrows). A4, A5, No PLA signal was detected in the absence of primary antibodies. A6, A7, The interaction of Syp with ChB in intact cells. B–F, The interaction of Syn I with Syp in transfected cells. B, The PLA signals showed the interaction of Syn I with Syp in cells overexpressing Syn Ia or phosphodeficient Syn Ia mutants after 1 min of KCl depolarization. C, The ratio of the PLA signal in the cell, reflecting the level of Syn I-Syp interaction in individual transfected cells; *p < 0.05; n.s., no significance, Kruskal–Wallis test followed by Dunn post hoc test; ###p <0.001, two-tailed Student's unpaired t test (Syn I versus Ctrl; Syn I-S62A versus Ctrl) or Mann–Whitney test (Syn I-S9,566,603A versus Ctrl). D, Syn I-Syp PLA signals on DCVs. Magnified signals (white arrows) on the right indicates the colocalization of PLA signals and ChB. The protein pairs were first detected by PLA, after which the cells were immunostained with an antibody against ChB. E, The ratio of DCVs harboring the Syn I-Syp PLA signal. n.s., no significance, one-way ANOVA with Student–Newman–Keuls post hoc test; ###p <0.001 versus Ctrl, two-tailed Student's unpaired t test. F, The ratio of Syn I-Syp PLA signal to DCVs. n.s., no significance, one-way ANOVA with Student–Newman–Keuls post hoc test; #p <0.05 versus Ctrl, two-tailed Student's unpaired t test. For C, E, F, all data are presented as the mean ± SEM. Numbers in columns indicate cell numbers. Circles indicate data from individual cells.
Statistical analyses
Data are presented as the means with SEMs. Statistical significance among three groups (Syn Ia and the two Syn Ia mutants) was evaluated by one-way ANOVA with the Student–Newman–Keuls post hoc test for the parametric method or by the Kruskal–Wallis test with the Dunn post hoc test for the nonparametric method (*p < 0.05, **p < 0.01, ***p < 0.001). Statistical significance between two groups (e.g., the Ctrl and Syn Ia-transfected group) was evaluated by two-tailed Student's unpaired t test as a parametric method or by the Mann–Whitney method as a nonparametric method (#p < 0.05, ##p < 0.01, ###p < 0.001 vs Ctrl; InStat 3, GraphPad).
Results
Syn Ia regulates the DCV secretion rate via phosphorylation
To determine whether Syn Ia regulates DCV exocytosis at the single-vesicle level, we obtained amperometry recordings from transfected PC12 cells loaded with NE. Upon KCl depolarization, NE release from individual DCVs was detected as an oxidative current at the surface of a potentiated CFE (Wang et al., 2001; Fig. 1A). Owing to the slow secretion rate in PC12 cells, the dynamics of individual release events could be resolved in these amperometric recordings because of their high temporal resolution. Single transfected cells were recognized by the appearance of green fluorescence with the aid of the bicistronic vector [control (Ctrl); wild-type Syn Ia (Syn Ia) for Syn Ia overexpression]. Since Syn Ia phosphorylation regulates SV recruitment, we thus examined whether Syn Ia also affects DCV release via phosphorylation. To do this, we constructed two phosphodeficient Syn Ia mutants, one phosphodeficient at S62 (Syn Ia-S62A) and one phosphodeficient at S9, S566, and S603 (Syn Ia-S9,566,603A). Overexpression was confirmed by examining the Syn Ia mRNA levels at 72 h after transfection, which were significantly increased by the transfection of Syn Ia or the phosphodeficient Syn Ia mutants compared with the levels in the Ctrl group [(fold change) Ctrl = 1.11 ± 0.49; Syn Ia = 1575.09 ± 572.05; Syn Ia-S62A = 1009.8 ± 175.2; Syn Ia-S9,566,603A = 1869.5 ± 704.3; Fig. 1B]. Consistently, overexpression of the Syn Ia protein was also verified by Western blot analysis [(fold change) Ctrl = 1.00 ± 0.27; Syn Ia = 4.03 ± 0.68; Syn Ia-S62A = 4.12 ± 0.50; Syn Ia-S9,566,603A = 4.64 ± 0.60; Fig. 7B].
Figure 7.

The expression levels of Syn I, Syp, or SNARE proteins in cells overexpressing Syn Ia or phosphodeficient Syn Ia mutants. A, Representative blots at 72 h after transfection. Cell lysates after 1 min of KCl depolarization were used for immunoblotting using antibodies against Syn I, Syp, Stx, SNAP-25, Syb, or α-tubulin. B–F, Quantitative analysis of protein levels. Data were first normalized to α-tubulin and then to the corresponding Ctrl. Different colored lines show data from individual immunoblots (n = 4). All data are presented as the mean ± SEM; #p < 0.05, ##p < 0.01 versus Ctrl, two-tailed Student's unpaired t test. n.s., no significance, one-way ANOVA with Student–Newman–Keuls post hoc test or two-tailed Student's unpaired t test.
Individual DCV release events were triggered by KCl depolarization and observed as the peaks of amperometric traces (Fig. 1C). To examine DCV secretion, we constructed cumulative events across the recording duration from all cells in various transfected groups that were recorded (Fig. 1D). To further quantify the secretion rate upon KCl depolarization, the plots showing cumulative events were linearly fitted by separating the early stage (from 0 to 10 s) and late stage (from 10 to 20 s) of the recording time [for 0- to 10-s fitting: (in events/s) Ctrl = 0.617 ± 0.015; Syn Ia = 0.712 ± 0.015; Syn Ia-S62A = 0.654 ± 0.016; Syn Ia-S9,566,603A = 0.375 ± 0.008; for 10- to 20-s fitting: (in events/s) Ctrl = 0.492 ± 0.005; Syn Ia = 0.613 ± 0.008; Syn Ia-S62A = 0.506 ± 0.013; Syn Ia-S9,566,603A = 0.334 ± 0.004; Fig. 1E]. The results showed that Syn Ia overexpression increased the fitted rates of DCV secretion at the early and late stages compared with those in the Ctrl group. Instead, Syn Ia-S62A expression decreased the fitted secretion rates at the early and late stages compared with those with Syn Ia expression (to levels to those in the Ctrl group), suggesting that the Syn Ia-mediated upregulation of DCV release requires the phosphorylation of Syn Ia at S62. Moreover, at both stages, Syn Ia-S9,566,603A strongly decreased the fitted secretion rate by two folds compared with those with Syn Ia expression or in the Ctrl group, suggesting that DCV secretion in PC12 cells requires the phosphorylation of these residues of Syn Ia. We also calculated the bulk secretion rate for individual PC12 cells by computing the event numbers across the recording time for each cell and then taking the average over all cells [(in events/s/cell) Ctrl = 0.493 ± 0.076; Syn Ia = 0.600 ± 0.074; Syn Ia-S62A = 0.535 ± 0.092; Syn Ia-S9,566,603A = 0.329 ± 0.050; Fig. 1F]. Syn Ia-S9,566,603A expression significantly decreased the bulk secretion rate compared with that with Syn Ia expression, suggesting that phosphodeficiency at these sites may decrease the secretion rate of DCVs. These findings suggest that Syn Ia regulates the DCV secretion rate via phosphorylation.
Syn Ia regulates the fusion pore kinetics of DCVs via phosphorylation
At the initial step of vesicle fusion, a fusion pore connects the vesicle interior with the extracellular space, allowing vesicles to undergo two types of fusion events, FF or KR fusion (Wang et al., 2003a, 2006; Jackson and Chapman, 2008). The PSF, a foot in the signal preceding the spike, represents transient opening of the initial fusion pores (Fig. 2A, shaded region; Chow et al., 1992). To determine whether Syn Ia phosphorylation affects the opening of these initial pores, we analyzed the PSF characteristics. First, we constructed the PSF open time distributions (Fig. 2B). By fitting the PSF open time distributions with a single-exponential decay function, we acquired the mean PSF duration, τ. We found that Syn Ia overexpression prolonged the mean PSF duration compared with that in the Ctrl group [(in ms) Ctrl = 1.209 ± 0.074; Syn Ia = 1.462 ± 0.059; Syn Ia-S62A = 1.186 ± 0.041; Syn Ia-S9,566,603A = 1.893 ± 0.195; Fig. 2C], suggesting that Syn Ia overexpression stabilizes the open fusion pore. In contrast, Syn Ia-S62A overexpression reduced the mean PSF duration compared with that with Syn Ia overexpression, suggesting that phosphodeficiency at S62 destabilizes fusion pore opening. Moreover, Syn Ia-S9,566,603A overexpression significantly prolonged the mean PSF duration compared with that in all other groups, indicating that phosphodeficiency at these sites strongly stabilizes the open fusion pores. Together, these results suggest that the phosphorylation of Syn Ia at various sites differentially regulates the stabilization of open fusion pores. In contrast, the PSF mean amplitude [(in pA) Ctrl = 1.800 ± 0.170; Syn Ia = 1.605 ± 0.234; Syn Ia-S62A = 1.397 ± 0.250; Syn Ia-S9,566,603A = 1.704 ± 0.405; Fig. 2D] and PSF area [(in pA × ms) Ctrl = 2.748 ± 0.396; Syn Ia = 3.670 ± 0.633; Syn Ia-S62A = 2.917 ± 0.529; Syn Ia-S9,566,603A = 3.604 ± 0.747; Fig. 2E] were not significantly different among the groups, suggesting that Syn Ia or phosphodeficient Syn Ia mutants do not change the flux or number of NE molecules released through the open fusion pore. Moreover, little differences in other spike characteristics were found among the groups [Fig. 3; except for the half-width in Syn Ia-S62A; peak amplitude: (in pA) Ctrl = 9.06 ± 0.66; Syn Ia = 8.12 ± 0.47; Syn Ia-S62A = 7.71 ± 0.46; Syn Ia-S9,566,603A = 9.08 ± 0.71 (Fig. 3A); whole area: (in pA × ms) Ctrl = 58.00 ± .70; Sy n Ia = 54.96 ± 4.20; Syn Ia-S62A = 58.60 ± 3.46; Syn Ia-S9,566,603A = 58.45 ± 3.76 (Fig. 3B); half width: (in ms) Ctrl = 5.42 ± 0.22; Syn Ia = 5.66 ± 0.30; Syn Ia-S62A = 6.30 ± 0.32; Syn Ia-S9,566,603A = 5.98 ± 0.39 (Fig. 3C); 35−90% rise time: (in ms) Ctrl = 1.37 ± 0.12; Syn Ia = 1.53 ± 0.14; Syn Ia-S62A = 1.51 ± 0.10; Syn Ia-S9,566,603A = 1.31 ± 0.09 (Fig. 3D); decay time: (in ms) Ctrl = 25.56 ± 1.74; Syn Ia = 23.63 ± 1.76; Syn Ia-S62A = 31.72 ± 3.85; Syn Ia-S9,566,603A = 28.44 ± 2.15 (Fig. 3E)], suggesting that Syn Ia and phosphodeficient Syn Ia mutants may play a minor role in the postdilation process of DCV exocytosis.
Figure 3.

Spike characteristics in cells overexpressing Syn Ia or phosphodeficient Syn Ia mutants. A, Peak amplitude. B, Event whole area. C, Half width. D, The 35–90% rise time. E, Decay time for FF events (events with a peak amplitude ≥3.5 pA). All data are presented as the mean ± SEM. Numbers in columns indicate cell numbers; #p < 0.05 versus Ctrl, Mann–Whitney test. n.s., no significance, Kruskal–Wallis test with Dunn post hoc test or Mann–Whitney test.
Two types of fusion events, i.e., FF (PSF followed by spikes; Figs. 2A, 4A, left) and KR (square or rectangular) events (Fig. 4A, right), have been resolved during DCV exocytosis (Wang et al., 2006; Chiang et al., 2014). Given that Syn Ia phosphorylation regulates the DCV secretion rate and stabilization of open fusion pores, we next determined whether Syn Ia phosphorylation affects FF or KR events. Previous studies (Wang et al., 2006; Chiang et al., 2014) suggested that the whole population of exocytotic events (Fig. 1C) can be divided into these two types by a cutoff peak amplitude of 3.5 pA (Fig. 4). If the mean amplitudes of KR events are indistinguishable from those of PSF events, both KR and PSF events are likely generated from the same population of fusion pores (Wang et al., 2006; Chiang et al., 2014). To assess this, we plotted and fitted scatter plots for mean KR (or PSF) amplitude versus KR (or PSF) duration (Fig. 4B,C). Linear fitting of the scatter plots for KR events showed little correlation, suggesting that the amplitudes of KR events do not change over time, corresponding to transient opening of the fusion pores (Fig. 4B). Similarly, little correlation was found in the scatter plots for PSF amplitude versus PSF duration (Fig. 4C). Moreover, the mean amplitudes of both KR and PSF events were similar [p > 0.05 for comparison in the same transfection group; (in pA) Ctrl: mean KR event amplitude = 1.09 ± 0.04, mean PSF amplitude = 1.25 ± 0.09; Syn Ia: mean KR event amplitude = 1.18 ± 0.03, mean PSF amplitude = 1.25 ± 0.08; Syn Ia-S62A: mean KR event amplitude = 1.09 ± 0.06, mean PSF amplitude = 1.39 ± 0.15; Syn Ia-S9,566,603A: mean KR event amplitude = 0.99 ± 0.05 pA, mean PSF amplitude = 1.41 ± 0.21; Fig. 4B,C], suggesting that both KR and PSF events are generated from the same population of fusion pores (Wang et al., 2006; Chiang et al., 2014). Certain fusion pores dilate to cause full vesicle fusion, yielding the PSF and subsequent spikes, as demonstrated in amperometric recordings. Furthermore, we confirmed that the population of FF events (Fig. 4D) was distinct from that of KR events (Fig. 4D, insets). As a result, the amplitude distributions of KR events for all groups were well fitted by a single Gaussian distribution (Fig. 4D, insets), consistent with the data from a single population. In contrast, the mean amplitude distributions of FF events were relatively skewed (Fig. 4D). These results suggest that the population of KR events was distinct from that of FF events, as reported in previous studies (Wang et al., 2006; Chiang et al., 2014).
To further determine the effects of Syn Ia phosphorylation on the occurrence of FF or KR events, we first analyzed FF events [(in spikes/s/cell) Ctrl = 0.330 ± 0.051; Syn Ia = 0.400 ± 0.059; Syn Ia-S62A = 0.414 ± 0.072; Syn Ia-S9,566,603A = 0.230 ± 0.041; Fig. 5A] and found no significant difference in FF frequency. Moreover, we analyzed the proportion of KR events (XKR; Ctrl = 0.372 ± 0.029; Syn Ia = 0.440 ± 0.033; Syn Ia-S62A = 0.502 ± 0.046; Syn Ia-S9,566,603A = 0.443 ± 0.041; Fig. 5B). The XKR with Syn Ia-S62A or Syn Ia-S9,566,603A expression was similar to that with Syn Ia overexpression, but the XKR with Syn Ia-S62A overexpression was significantly higher than that in the Ctrl group. These results suggest that Syn Ia phosphorylation may not affect the frequency of KR events.
To further determine the effects of Syn Ia phosphorylation on fusion pore kinetics, the rate constants of fusion pore closure (kc) and dilation (kd) were calculated according to a kinetic model for fusion pores defined in previous studies [(in ms−1) Ctrl: kc = 0.31, kd = 0.52; Syn Ia: kc = 0.30, kd = 0.38; Syn Ia-S62A: kc = 0.42, kd = 0.42; Syn Ia-S9,566,603A: kc = 0.23, kd = 0.29; Fig. 5C,D; Wang et al., 2001, 2003b, 2006; Chiang et al., 2014]. As a result, compared with those in the Ctrl group, Syn Ia overexpression did not alter the kc but decreased the kd, suggesting that Syn Ia may reduce the rate of transition from an open fusion pore toward a dilated fusion pore. In contrast, Syn Ia-S62A overexpression strongly increased the kc compared with that in the Ctrl group or with Syn Ia overexpression and slightly increased the kd compared with that with Syn Ia overexpression, suggesting that Syn Ia-S62A mainly promotes transition of the fusion pore from the open state toward the closed state. Moreover, Syn Ia-S9,566,603A overexpression decreased both kc and kd compared with those in the Ctrl group or with Syn Ia overexpression, suggesting that Syn Ia-S9,566,603A may reduce the rate of fusion pore transition from the open state toward the closed or dilated state. Given that various phosphodeficient Syn Ia mutants can differentially regulate these rate constants, Syn Ia phosphorylation may play an important role in regulating fusion pore kinetics during DCV exocytosis.
The interaction between syn I and endogenous Syp depends on Syn Ia phosphorylation
Syn Ia has been considered as an SV-specific phosphoprotein, so the underlying mechanism that controls Syn Ia-mediated regulation of DCV exocytosis requires further exploration. First, to determine the subcellular localization of Syn I in PC12 cells, we immunostained Syn I with a DCV marker (ChB) or a general vesicle marker (Syp) in cells overexpressing Syn Ia or phosphodeficient Syn Ia mutants. As expected, Syn I mainly colocalized with Syp but colocalized to a lesser degree with ChB (Fig. 6A, top and middle). To further quantify this colocalization, we calculated the ratio of overlap between Syn I immunoreactivity and ChB (or Syp) immunoreactivity. We found that the ratios of Syn I on DCVs were relatively low (<20%) compared with those on general vesicles (∼ 60%; Fig. 6B; for the ratios indicating overlap between Syn I immunoreactivity and ChB immunoreactivity: Ctrl = 14.20 ± 1.79; Syn Ia = 15.67 ± 2.43; Syn Ia-S62A = 18.91 ± 1.74; Syn Ia-S9,566,603A = 15.80 ± 1.90; for the ratios indicating overlap between Syn I immunoreactivity and Syp immunoreactivity: Ctrl = 56.49 ± 2.53; Syn Ia = 60.79 ± 2.77; Syn Ia-S62A = 64.18 ± 3.39; Syn Ia-S9,566,603A = 61.30 ± 2.35%). By contrast, Syp strongly colocalized with ChB (for the ratios indicating overlap between Syp immunoreactivity and ChB immunoreactivity: Ctrl = 83.25 ± 1.32; Syn Ia = 81.03 ± 0.67; Syn Ia-S62A = 79.89 ± 1.14; Syn Ia-S9,566,603A = 81.31 ± 1.29%; Fig. 6A, bottom, B), suggesting that Syp may localize to DCVs. In particular, the ratios of the Syn Ia-ChB overlap were not different among all transfected groups (Fig. 6B), suggesting that the localization of Syn Ia to DCVs is unlikely to occur in a phosphorylation-dependent manner.
Since little Syn I colocalized with the DCV marker, we hypothesized that Syn Ia may modulate the kinetics of DCV exocytosis through interacting with certain DCV protein(s). Presumably, these Syn Ia-interacting protein(s) may be directly involved in regulating exocytosis and thus rapidly affect DCV fusion pores by Syn Ia phosphorylation. To explore putative Syn Ia-interacting protein(s), we performed PPI prediction with the MirrorTree program (Fig. 6C; Pazos and Valencia, 2001; Ochoa and Pazos, 2010). In total, the program predicted 66 synaptic proteins with corresponding correlation coefficients serving as indexes of the interaction possibility (Fig. 6C). The correlation coefficients from PPI prediction were further plotted as a heat map from highest (yellow) to lowest (dark blue). Among the top 5 protein candidates [Regulating synaptic membrane exocytosis protein 2 (Rims 2), Protein unc-13 homolog D (Unc 13D), SNARE-associated protein (Snapin), NMDA 3Bs, and Syp; Jahn et al., 1985; Ilardi et al., 1999; Koch et al., 2000; Chatterton et al., 2002; Shin, 2014], the only protein on the DCV membrane with transmembrane domains is Syp (Schilling and Gratzl, 1988; Winkler, 1997; Berwin et al., 1998; Saegusa et al., 2002). Thus, Syp was selected as the primary putative Syn Ia-interacting protein. In addition, since three SNARE proteins also play important roles in regulating DCV exocytosis (Han et al., 2004; Han and Jackson, 2006; Chang et al., 2015, 2017), these SNARE proteins may serve as putative Syn Ia-interacting proteins. Notably, the expression levels (Fig. 7A) of Syp (Ctrl = 1.00 ± 0.08; Syn Ia = 0.89 ± 0.09; Syn Ia-S62A = 0.93 ± 0.11; Syn Ia-S9,566,603A = 1.00 ± 0.07; Fig. 7C) or SNAREs (Stx in Fig. 7D: Ctrl = 1.00 ± 0.01; Syn Ia = 0.85 ± 0.09; Syn Ia-S62A = 0.84 ± 0.06; Syn Ia-S9,566,603A = 0.89 ± 0.05; SNAP-25 in Fig. 7E: Ctrl = 1.00 ± 0.15; Syn Ia = 0.96 ± 0.15; Syn Ia-S62A = 1.04 ± 0.12; Syn Ia-S9,566,603A = 1.08 ± 0.11; Syb in Fig. 7F: Ctrl = 1.00 ± 0.14; Syn Ia = 1.02 ± 0.10; Syn Ia-S62A = 1.12 ± 0.06; Syn Ia-S9,566,603A = 1.18 ± 0.05) remained unchanged upon the overexpression of Syn Ia or the phosphodeficient Syn Ia mutants, suggesting that alteration of the Syn Ia phosphorylation state may not alter the expression levels of these proteins.
To further confirm the results of the prediction, we examined the interaction between Syn I and the endogenous putative Syn I-interacting proteins. We performed coimmunoprecipitation (co-IP) analysis of PC12 cells after 1 min of KCl depolarization. Our results showed that Syn I interacted with Syp in the cell lysates (Fig. 8A). Moreover, by quantifying changes in the levels of their interaction because of Syn Ia phosphorylation, we found that expression of both phosphodeficient mutants (Syn Ia-S62A and Syn Ia-S9,566,603A) significantly decreased the interaction of Syn with Syp compared with the expression of Syn Ia [(fold change relative to Syn Ia) Syn Ia = 1.00 ± 0.06; Syn Ia-S62A = 0.57 ± 0.03; Syn Ia-S9,566,603A = 0.58 ± 0.06; Fig. 8A,B]. These results suggest that the Syn I-Syp interaction can be regulated by Syn Ia phosphorylation. In addition, we found that Syn I interacts with Stx. However, the level of this interaction was not altered by overexpression of the phosphodeficient Syn Ia mutants compared with overexpression of Syn Ia [(fold change relative to Syn Ia) Syn Ia = 1.00 ± 0.23; Syn Ia-S62A = 0.65 ± 0.11; Syn Ia-S9,566,603A = 0.71 ± 0.19; Fig. 8C,D], suggesting that Syn Ia phosphorylation may not affect the Syn I-Stx interaction. Regarding other SNAREs, we occasionally found SNAP-25 (Fig. 8E, one out of four cell lysates) or Syb (Fig. 8F, one out of five cell lysates) in the coimmunoprecipitates containing Syn I, and the results with the negative control (Fig. 8G) confirmed these immunoreactive bands. These data imply that these two SNAREs may have formed a complex with Syn I by transient or indirect interaction (Söllner et al., 1993; Edelmann et al., 1995) under our experimental conditions. Taken together, these findings show that Syn Ia phosphorylation may specifically regulate the level of the Syn I-Syp interaction.
Figure 8.

In vivo interaction of Syn I with Syn Ia-interacting proteins. A–F, The interaction levels in cells after 1 min of KCl depolarization. Syn I was first immunoprecipitated (IP) from lysates, and then the binding of Syn Ia with putative proteins was determined by immunoblotting (IB). Representative blots showing the interaction of Syn I with Syp (A), Stx (C), SNAP-25 (E), or Syb (F). B, D, Quantitative analysis of changes in the interaction levels. Different colored lines show data from individual immunoblots (n = 5). All data are presented as the mean ± SEM; *p < 0.05, Kruskal–Wallis test with Dunn post hoc test; n.s., no significance, one-way ANOVA with Student–Newman–Keuls post hoc test. G, The negative control for IP experiments. The lysates from cells overexpressing Syn Ia were IP with rabbit immunoglobulin G (IgG). The binding of IgG with putative proteins was determined by immunoblotting using an antibody against the indicated protein. Input, cell lysates after 1 min of KCl depolarization were used for immunoblot analysis.
To further directly examine this interaction in cells, we performed a PLA, which has been used to detect the in situ direct interaction of two proteins in the same cells (Söderberg et al., 2008). First, in the positive control sample, Stx and SNAP-25 showed clear PLA signals (Fig. 9A1–A3), consistent with their direct interaction, as previously reported (Söllner et al., 1993). Second, in the negative control sample, no PLA signal was detected in the absence of any primary antibodies (Fig. 9A4,A5). Moreover, we found PLA signals between Syp and ChB in PC12 cells (Fig. 9A6,A7), supporting the high ratios of Syp colocalization with ChB observed by immunofluorescence staining (Fig. 6A,B). Since PLA signals are generated between protein pairs at a distance <40 nm, these results suggest that Syp may localize to the DCV membrane, possibly interacting with ChB in situ.
Next, to confirm that Syn Ia phosphorylation regulates the level of the Syn Ia-Syp interaction, we detected and quantified PLA signals between Syn I and Syp in transfected cells (as observed by EGFP fluorescence) after KCl depolarization (Fig. 9B,C). In comparison with the Ctrl group, cells overexpressing Syn Ia or the Syn Ia mutants displayed significantly higher PLA signals between Syn I and Syp [(in %) Ctrl = 1.04 ± 0.19; Syn Ia = 12.81 ± 2.27; Syn Ia-S62A = 9.89 ± 1.52; Syn Ia-S9,566,603A = 6.52 ± 1.20; Fig. 9C]. Moreover, compared with cells overexpressing Syn Ia, cells overexpressing Syn Ia-S9,566,603A displayed lower PLA signals between Syn I and Syp (Fig. 9C), suggesting that phosphodeficiency at these residues may profoundly reduce the level of the interaction between Syn Ia and Syp.
To examine whether the Syn Ia-Syp interaction could be found on DCVs, we performed immunofluorescence staining to label ChB after the PLA (Fig. 9D). We found that the Syn Ia-Syp PLA signals colocalized with ChB immunoreactivity (Fig. 9D, right insets, white arrows). By quantifying the overlap, we found that in cells overexpressing Syn Ia or the Syn Ia mutants, a significantly greater population of DCVs harbored the Syn I-Syp PLA signal [(in %) Ctrl = 0.80 ± 0.20; Syn Ia = 9.80 ± 1.20; Syn Ia-S62A = 9.06 ± 0.60; Syn Ia-S9,566,603A = 7.96 ± 1.03; Fig. 9E], supporting our observation that Syn Ia and the Syn Ia mutants could regulate DCV exocytosis. Moreover, we found high (>50%) and comparable Syn I-Syp PLA signals localized to DCVs among all groups [except when the Syn Ia-S62A and Ctrl groups were compared; (in %) Ctrl = 50.56 ± 6.72; Syn Ia = 64.37 ± 2.92; Syn Ia-S62A = 69.52 ± 3.92; Syn Ia-S9,566,603A = 60.81 ± 2.41; Fig. 9F], suggesting that Syn Ia and Syp may interact in situ on DCVs.
Discussion
In this study, we show that overexpression of phophodeficient Syn Ia mutants (especially Syn Ia-S9,566,603A) significantly decreased the rate of NE-laden vesicle secretion in PC12 cells, suggesting that Syn Ia regulates the DCV secretion rate via phosphorylation. Moreover, both phophodeficient Syn Ia mutants regulated the mean PSF duration and fusion pore kinetics during DCV exocytosis. We further identified Syn I-interacting proteins that can directly regulate DCV exocytosis. From the PPI prediction results, we selected Syp and SNAREs as putative Syn I-interacting proteins. Finally, we confirmed that the Syn Ia-Syp interaction is dependent on Syn Ia phosphorylation and Syn Ia and Syp may directly interact on DCVs.
Previous studies have shown that phosphorylation of the MAPK sites of Syn Ia decreases Syn Ia binding to SVs (Chi et al., 2003; Cesca et al., 2010), but phosphorylation of the CaMK sites of Syn Ia decreases its binding to both SVs and actin, specifically through a marked conformational change in Syn Ia (Benfenati et al., 1990; Ceccaldi et al., 1995). Moreover, the binding of Syn Ia to SVs is relatively sensitive to CaMK-mediated phosphorylation (Cesca et al., 2010). Similarly, our results from experiments with two phosphodeficient mutants (S62A at the MAPK site; S9,566,603A at the CaMK sites) revealed that phosphorylation of the CaMK sites may also play a relatively profound role in regulating DCV exocytosis.
The complete fusion of vesicles with the plasma membrane is termed a FF event. In contrast, a KR event involves transient vesicle fusion in which neurotransmitters are partially released, and then the vesicles reform and finally leave the plasma membrane. In our kinetic model (Wang et al., 2001, 2003a, 2006; Chiang et al., 2014), if the kc is high, the opening fusion pore preferentially enters a state of closure (KR events). In contrast, if the kd is high, the opening fusion pore preferentially enters a state of dilation (FF events). Syn Ia-S62A overexpression increased both the kc and kd compared with those upon Syn Ia overexpression (Fig. 5C); however, Syn Ia-S62A overexpression did not increase the frequency of KR events compared with that upon Syn Ia overexpression (Fig. 5B). Given that XKR is calculated as kc/(kc + kd), these results may be because the increase in the sum of kc and kd is similar to the increase in kc alone, leaving the ratio of kc versus kc and kd (XKR) unchanged. In addition, the decreased mean PSF duration upon Syn Ia-S62A overexpression is consistent with the inverse of the increased sum of kc and kd. In contrast, the increased mean PSF duration upon Syn Ia-S9,566,603A overexpression is because of a decreased sum of kc and kd compared with that with Syn Ia. The KR frequency (XKR) with Syn Ia-S9,566,603A remained similar to that with Syn Ia, mainly because of the similar decrease in kc or kd, which resulted in no change in the ratio of KR frequencies with Syn Ia-S9,566,603A. These results also suggest that phosphorylation at various sites may differentially regulate fusion pore kinetics during DCV exocytosis. In our study, we found that phosphodeficiency at these CaMK sites (rather than at S62) significantly reduced the in situ interaction between Syn I and Syp. Recently, Syn I was found to harbor a C-terminal intrinsically disordered region (IDR), which captures small lipid vesicles by forming a distinct liquid condensate that is dispersed upon CaMKII-mediated phosphorylation (Milovanovic et al., 2018). Hence, further investigation of the partners that bind the IDR of Syn I could advance our understanding of the mechanisms that control Syn Ia-mediated regulation of DCV exocytosis.
Among the top five protein candidates from the PPI prediction results, we identified Syp as the primary Syn Ia-interacting protein involved in the regulation of DCV exocytosis via phosphorylation. First, Syp has been suggested to regulate neurotransmitter release because of its abundant expression in pre-SVs, anchoring the vesicle membrane through four transmembrane domains (Jahn et al., 1985; Thomas et al., 1988). Second, with the abundant expression of Syp in presynaptic terminals, the integral membrane domains of Syp can form a hexameric channel-like structure (Thomas et al., 1988; Gincel and Shoshan-Barmatz, 2002), implying that Syp may be involved in the regulation of vesicle fusion. Third, Syp has been found in both SVs and DCVs (Jahn et al., 1985; Liu et al., 1994; Winkler, 1997; Berwin et al., 1998; Saegusa et al., 2002; Wheeler et al., 2002; Lukinius et al., 2003). In addition, Syp-lipid interactions contribute to the biogenesis of SVs (Thiele et al., 2000). Despite these findings, the function of Syp in regulating DCV exocytosis has remained elusive. In this study, we found that Syn Ia can regulate DCV exocytosis via phosphorylation and have further provided evidence of the phosphorylation-dependent Syn I-Syp interaction on DCVs. Moreover, our PLA data suggest that Syp may directly interact with ChB in situ. Thus, by modulating the Syn I-Syp interaction on DCVs, Syn Ia phosphorylation may dynamically regulate DCV exocytosis, serving as a molecular basis underlying the co-release of SVs and DCVs.
In addition to Syp, other synaptic proteins may also interact with Syn Ia. For example, Rims 2, the effector of a group of small GTPases (Ras-related protein Rab), mainly regulates the priming of SVs (Koushika et al., 2001; Stevens et al., 2011). NMDA 3B, a postsynaptic receptor protein, may also interact with Syn Ia. However, Rims 2 and NMDA 3B were clearly not putative Syn Ia-interacting proteins that mediate DCV exocytosis in our experiment because of their failure to localize to DCVs. The Unc 13 family (Unc 13A-D) also plays important roles in the first part of the priming step, rather than docking or fusion during DCV exocytosis (Augustine et al., 1999; Richmond et al., 1999; Ashery et al., 2000; Man et al., 2015). Unc13D is abundantly expressed in the lung, spleen, and testis and classified as a nonneuronal isoform of the Unc 13 family (Koch et al., 2000; Man et al., 2015). Thus, Unc13D is not thought to play a functional role in neuronal exocytosis. Snapin, a cytosolic protein, can bind SNAP-25 via phosphorylation (Chheda et al., 2001). Most studies have shown that Snapin can enhance the interactions of SNAREs and Synaptotagmin I and thus plays an important role in the priming step (Ilardi et al., 1999; Stevens et al., 2011) but not the fusion step during exocytosis (Vites et al., 2004).
Here, we also show that Syn I can interact with Stx, but this interaction is not dependent on Syn Ia phosphorylation. In addition, we occasionally detected the interaction of Syn I with SNAP-25 or Syb, suggesting a relatively transient or indirect interaction under our experimental conditions. For comparison with the results from our amperometry recordings, we harvested cells after KCl depolarization for all biochemical assays. KCl depolarization may preferentially increase the number of cis-SNARE complexes (postfusion) over trans-SNARE complexes (prefusion; Söllner et al., 1993; Edelmann et al., 1995; Malsam et al., 2020). The residues in SNAP-25 and Syb that interact with Syn Ia may be concealed in the cis-SNARE complex, masking the discovery of their interaction with Syn Ia. How the interactions between Syn Ia and SNAREs are important for regulating DCV exocytosis requires further investigation. In summary, exploring the mechanisms underlying the Syn Ia-mediated regulation of DCV exocytosis would advance our understanding of the functions of the nervous system.
Footnotes
This work was supported by NTU Grants NTU-CC-109L893602 and NTU-CC-110L891702 and Ministry of Science and Technology Grants MOST-106-2311-B-002-007, 108-2311-B-002-008, and 109-2311-B-002-008-MY3 (to C.-T.W.); the Ministry of Science and Technology Grant MOST-107-2627-M-002-005 (to C.-Y.C.); Chang Gung Medical Research Project Grants CMRPD1G0503, CMRPD1K0091, and BMRPC03; and Ministry of Science and Technology Grants MOST-107-2320-B-182-041 and MOST-109-2320-B-182-007 (to J.-C.L.). We thank Dr. Paul Greengard (Rockefeller University) and Dr. Meyer B. Jackson (University of Wisconsin-Madison) for the generous gift of plasmid; Dr. Payne Chang for the amperometry analysis software; Dung-Chi Wu (Chen lab) for help with the PPI prediction; the staff of Technology Commons, College of Life Science and Center for Systems Biology, National Taiwan University (NTU) for help with confocal microscopy and core facility; Dr. Li-Chung Hsu (NTU) for help with PLA; and members of the Wang, Chen, and Lu lab for technical assistance.
The authors declare no competing financial interests.
References
- Ashery U, Varoqueaux F, Voets T, Betz A, Thakur P, Koch H, Neher E, Brose N, Rettig J (2000) Munc13-1 acts as a priming factor for large dense-core vesicles in bovine chromaffin cells. EMBO J 19:3586–3596. 10.1093/emboj/19.14.3586 [DOI] [PMC free article] [PubMed] [Google Scholar]
- Augustine GJ, Burns ME, DeBello WM, Hilfiker S, Morgan JR, Schweizer FE, Tokumaru H, Umayahara K (1999) Proteins involved in synaptic vesicle trafficking. J Physiol 520:33–41. 10.1111/j.1469-7793.1999.00033.x [DOI] [PMC free article] [PubMed] [Google Scholar]
- Benfenati F, Neyroz P, Bähler M, Masotti L, Greengard P (1990) Time-resolved fluorescence study of the neuron-specific phosphoprotein synapsin I. Evidence for phosphorylation-dependent conformational changes. J Biol Chem 265:12584–12595. [PubMed] [Google Scholar]
- Berwin B, Floor E, Martin TFJ (1998) CAPS (mammalian UNC-31) protein localizes to membranes involved in dense-core vesicle exocytosis. Neuron 21:137–145. 10.1016/S0896-6273(00)80521-8 [DOI] [PubMed] [Google Scholar]
- Ceccaldi PE, Grohovaz F, Benfenati F, Chieregatti E, Greengard P, Valtorta F (1995) Dephosphorylated synapsin I anchors synaptic vesicles to actin cytoskeleton: an analysis by videomicroscopy. J Cell Biol 128:905–912. 10.1083/jcb.128.5.905 [DOI] [PMC free article] [PubMed] [Google Scholar]
- Cesca F, Baldelli P, Valtorta F, Benfenati F (2010) The synapsins: key actors of synapse function and plasticity. Prog Neurobiol 91:313–348. 10.1016/j.pneurobio.2010.04.006 [DOI] [PubMed] [Google Scholar]
- Chang CW, Hui E, Bai J, Bruns D, Chapman ER, Jackson MB (2015) A structural role for the synaptobrevin 2 transmembrane domain in dense-core vesicle fusion pores. J Neurosci 35:5772–5780. 10.1523/JNEUROSCI.3983-14.2015 [DOI] [PMC free article] [PubMed] [Google Scholar]
- Chang CW, Chiang CW, Jackson MB (2017) Fusion pores and their control of neurotransmitter and hormone release. J Gen Physiol 149:301–322. 10.1085/jgp.201611724 [DOI] [PMC free article] [PubMed] [Google Scholar]
- Chatterton JE, Awobuluyi M, Premkumar LS, Takahashi H, Talantova M, Shin Y, Cui J, Tu S, Sevarino KA, Nakanishi N, Tong G, Lipton SA, Zhang D (2002) Excitatory glycine receptors containing the NR3 family of NMDA receptor subunits. Nature 415:793–798. 10.1038/nature715 [DOI] [PubMed] [Google Scholar]
- Chheda MG, Ashery U, Thakur P, Rettig J, Sheng ZH (2001) Phosphorylation of Snapin by PKA modulates its interaction with the SNARE complex. Nat Cell Biol 3:331–338. 10.1038/35070000 [DOI] [PubMed] [Google Scholar]
- Chi P, Greengard P, Ryan TA (2003) Synaptic vesicle mobilization is regulated by distinct synapsin I phosphorylation pathways at different frequencies. Neuron 38:69–78. 10.1016/s0896-6273(03)00151-x [DOI] [PubMed] [Google Scholar]
- Chiang N, Hsiao YT, Yang HJ, Lin YC, Lu JC, Wang CT (2014) Phosphomimetic mutation of cysteine string protein-α increases the rate of regulated exocytosis by modulating fusion pore dynamics in PC12 cells. PLoS One 9:e99180. 10.1371/journal.pone.0099180 [DOI] [PMC free article] [PubMed] [Google Scholar]
- Chow RH, von Rüden L, Neher E (1992) Delay in vesicle fusion revealed by electrochemical monitoring of single secretory events in adrenal chromaffin cells. Nature 356:60–63. 10.1038/356060a0 [DOI] [PubMed] [Google Scholar]
- Colliver TL, Hess EJ, Pothos EN, Sulzer D, Ewing AG (2000) Quantitative and statistical analysis of the shape of amperometric spikes recorded from two populations of cells. J Neurochem 74:1086–1097. 10.1046/j.1471-4159.2000.741086.x [DOI] [PubMed] [Google Scholar]
- De Camilli P, Jahn R (1990) Pathways to regulated exocytosis in neurons. Annu Rev Physiol 52:625–645. 10.1146/annurev.ph.52.030190.003205 [DOI] [PubMed] [Google Scholar]
- Edelmann L, Hanson PI, Chapman ER, Jahn R (1995) Synaptobrevin binding to synaptophysin: a potential mechanism for controlling the exocytotic fusion machine. EMBO J 14:224–231. [DOI] [PMC free article] [PubMed] [Google Scholar]
- Gincel D, Shoshan-Barmatz V (2002) The synaptic vesicle protein synaptophysin: purification and characterization of its channel activity. Biophys J 83:3223–3229. 10.1016/S0006-3495(02)75324-1 [DOI] [PMC free article] [PubMed] [Google Scholar]
- Gondré-Lewis MC, Park JJ, Loh YP (2012) Cellular mechanisms for the biogenesis and transport of synaptic and dense-core vesicles. Int Rev Cell Mol Biol 299:27–115. 10.1016/B978-0-12-394310-1.00002-3 [DOI] [PubMed] [Google Scholar]
- Greengard P, Valtorta F, Czernik AJ, Benfenati F (1993) Synaptic vesicle phosphoproteins and regulation of synaptic function. Science 259:780–785. 10.1126/science.8430330 [DOI] [PubMed] [Google Scholar]
- Han X, Jackson MB (2006) Structural transitions in the synaptic SNARE complex during Ca2+-triggered exocytosis. J Cell Biol 172:281–293. 10.1083/jcb.200510012 [DOI] [PMC free article] [PubMed] [Google Scholar]
- Han X, Wang CT, Bai J, Chapman ER, Jackson MB (2004) Transmembrane segments of syntaxin line the fusion pore of Ca2+-triggered exocytosis. Science 304:289–292. 10.1126/science.1095801 [DOI] [PubMed] [Google Scholar]
- Hökfelt T, Johansson O, Ljungdahl A, Lundberg JM, Schultzberg M (1980) Peptidergic neurones. Nature 284:515–521. 10.1038/284515a0 [DOI] [PubMed] [Google Scholar]
- Ilardi JM, Mochida S, Sheng Z-H (1999) Snapin: a SNARE-associated protein implicated in synaptic transmission. Nat Neurosci 2:119–124. 10.1038/5673 [DOI] [PubMed] [Google Scholar]
- Jackson MB, Chapman ER (2008) The fusion pores of Ca2+ -triggered exocytosis. Nat Struct Mol Biol 15:684–689. 10.1038/nsmb.1449 [DOI] [PMC free article] [PubMed] [Google Scholar]
- Jahn R, Fasshauer D (2012) Molecular machines governing exocytosis of synaptic vesicles. Nature 490:201–207. 10.1038/nature11320 [DOI] [PMC free article] [PubMed] [Google Scholar]
- Jahn R, Schiebler W, Ouimet C, Greengard P (1985) A 38,000-dalton membrane protein (p38) present in synaptic vesicles. Proc Natl Acad Sci USA 82:4137–4141. 10.1073/pnas.82.12.4137 [DOI] [PMC free article] [PubMed] [Google Scholar]
- Jankowski JA, Schroeder TJ, Ciolkowski EL, Wightman RM (1993) Temporal characteristics of quantal secretion of catecholamines from adrenal medullary cells. J Biol Chem 268:14694–14700. 10.1016/S0021-9258(18)82389-4 [DOI] [PubMed] [Google Scholar]
- Koch H, Hofmann K, Brose N (2000) Definition of Munc13-homology-domains and characterization of a novel ubiquitously expressed Munc13 isoform. Biochem J 349:247–253. 10.1042/0264-6021:3490247 [DOI] [PMC free article] [PubMed] [Google Scholar]
- Koushika SP, Richmond JE, Hadwiger G, Weimer RM, Jorgensen EM, Nonet ML (2001) A post-docking role for active zone protein Rim. Nat Neurosci 4:997–1005. 10.1038/nn732 [DOI] [PMC free article] [PubMed] [Google Scholar]
- Levitan IB, Kaczmarek LK (2015) The neuron, Ed 4. New York: Oxford University Press. [Google Scholar]
- Liu Y, Schweitzer ES, Nirenberg MJ, Pickel VM, Evans CJ, Edwards RH (1994) Preferential localization of a vesicular monoamine transporter to dense core vesicles in PC12 cells. J Cell Biol 127:1419–1433. 10.1083/jcb.127.5.1419 [DOI] [PMC free article] [PubMed] [Google Scholar]
- Lukinius A, Stridsberg M, Wilander E (2003) Cellular expression and specific intragranular localization of chromogranin A, chromogranin B, and synaptophysin during ontogeny of pancreatic islet cells: an ultrastructural study. Pancreas 27:38–46. 10.1097/00006676-200307000-00006 [DOI] [PubMed] [Google Scholar]
- Malsam J, Bärfuss S, Trimbuch T, Zarebidaki F, Sonnen AF, Wild K, Scheutzow A, Rohland L, Mayer MP, Sinning I, Briggs JAG, Rosenmund C, Söllner TH (2020) Complexin suppresses spontaneous exocytosis by capturing the membrane-proximal regions of VAMP2 and SNAP25. Cell Rep 32:107926. 10.1016/j.celrep.2020.107926 [DOI] [PMC free article] [PubMed] [Google Scholar]
- Man KN, Imig C, Walter AM, Pinheiro PS, Stevens DR, Rettig J, Sørensen JB, Cooper BH, Brose N, Wojcik SM (2015) Identification of a Munc13-sensitive step in chromaffin cell large dense-core vesicle exocytosis. Elife 4:e10635. 10.7554/eLife.10635 [DOI] [PMC free article] [PubMed] [Google Scholar]
- Milovanovic D, Wu Y, Bian X, De Camilli P (2018) A liquid phase of synapsin and lipid vesicles. Science 361:604–607. 10.1126/science.aat5671 [DOI] [PMC free article] [PubMed] [Google Scholar]
- Nusbaum MP, Blitz DM, Swensen AM, Wood D, Marder E (2001) The roles of co-transmission in neural network modulation. Trends Neurosci 24:146–154. 10.1016/s0166-2236(00)01723-9 [DOI] [PubMed] [Google Scholar]
- Ochoa D, Pazos F (2010) Studying the co-evolution of protein families with the Mirrortree web server. Bioinformatics 26:1370–1371. 10.1093/bioinformatics/btq137 [DOI] [PubMed] [Google Scholar]
- Pazos F, Valencia A (2001) Similarity of phylogenetic trees as indicator of protein-protein interaction. Protein Eng 14:609–614. 10.1093/protein/14.9.609 [DOI] [PubMed] [Google Scholar]
- Richmond JE, Davis WS, Jorgensen EM (1999) UNC-13 is required for synaptic vesicle fusion in C. elegans. Nat Neurosci 2:959–964. 10.1038/14755 [DOI] [PMC free article] [PubMed] [Google Scholar]
- Saegusa C, Fukuda M, Mikoshiba K (2002) Synaptotagmin V is targeted to dense-core vesicles that undergo calcium-dependent exocytosis in PC12 cells. J Biol Chem 277:24499–24505. 10.1074/jbc.M202767200 [DOI] [PubMed] [Google Scholar]
- Schilling K, Gratzl M (1988) Quantification of p38/synaptophysin in highly purified adrenal medullary chromaffin vesicles. FEBS Lett 233:22–24. 10.1016/0014-5793(88)81348-6 [DOI] [PubMed] [Google Scholar]
- Shin OH (2014) Exocytosis and synaptic vesicle function. Compr Physiol 4:149–175. 10.1002/cphy.c130021 [DOI] [PubMed] [Google Scholar]
- Söderberg O, Leuchowius KJ, Gullberg M, Jarvius M, Weibrecht I, Larsson LG, Landegren U (2008) Characterizing proteins and their interactions in cells and tissues using the in situ proximity ligation assay. Methods 45:227–232. 10.1016/j.ymeth.2008.06.014 [DOI] [PubMed] [Google Scholar]
- Söllner T, Bennet MK, Whiteheart SW, Scheller RH, Rothman JE (1993) A protein assembly disassembly pathway in vitro that may correspond to sequential steps. Cell 75:409–418. 10.1016/0092-8674(93)90376-2 [DOI] [PubMed] [Google Scholar]
- Stevens DR, Schirra C, Becherer U, Rettig J (2011) Vesicle pools: lessons from adrenal chromaffin cells. Front Synaptic Neurosci 3:2. 10.3389/fnsyn.2011.00002 [DOI] [PMC free article] [PubMed] [Google Scholar]
- Svensson E, Apergis-Schoute J, Burnstock G, Nusbaum MP, Parker D, Schiöth HB (2018) General principles of neuronal co-transmission: insights from multiple model systems. Front Neural Circuits 12:117. 10.3389/fncir.2018.00117 [DOI] [PMC free article] [PubMed] [Google Scholar]
- Thiele C, Hannah MJ, Fahrenholz F, Huttner WB (2000) Cholesterol binds to synaptophysin and is required for biogenesis of synaptic vesicles. Nat Cell Biol 2:42–49. 10.1038/71366 [DOI] [PubMed] [Google Scholar]
- Thomas L, Hartung K, Langosch D, Rehm H, Bamberg E, Franke WW, Betz H (1988) Identification of synaptophysin as a hexameric channel protein of the synaptic vesicle membrane. Science 242:1050–1053. 10.1126/science.2461586 [DOI] [PubMed] [Google Scholar]
- Vites O, Rhee JS, Schwarz M, Rosenmund C, Jahn R (2004) Reinvestigation of the role of snapin in neurotransmitter release. J Biol Chem 279:26251–26256. 10.1074/jbc.M404079200 [DOI] [PubMed] [Google Scholar]
- Voets T (2000) Dissection of three Ca2+-dependent steps leading to secretion in chromaffin cells from mouse adrenal slices. Neuron 28:537–545. 10.1016/s0896-6273(00)00131-8 [DOI] [PubMed] [Google Scholar]
- Wang CT, Grishanin R, Earles CA, Chang PY, Martin TF, Chapman ER, Jackson MB (2001) Synaptotagmin modulation of fusion pore kinetics in regulated exocytosis of dense-core vesicles. Science 294:1111–1115. 10.1126/science.1064002 [DOI] [PubMed] [Google Scholar]
- Wang CT, Lu JC, Bai J, Chang PY, Martin TF, Chapman ER, Jackson MB (2003a) Different domains of synaptotagmin control the choice between kiss-and-run and full fusion. Nature 424:943–947. 10.1038/nature01857 [DOI] [PubMed] [Google Scholar]
- Wang P, Wang CT, Bai J, Jackson MB, Chapman ER (2003b) Mutations in the effector binding loops in the C2A and C2B domains of synaptotagmin I disrupt exocytosis in a nonadditive manner. J Biol Chem 278:47030–47037. 10.1074/jbc.M306728200 [DOI] [PubMed] [Google Scholar]
- Wang CT, Bai J, Chang PY, Chapman ER, Jackson MB (2006) Synaptotagmin-Ca2+ triggers two sequential steps in regulated exocytosis in rat PC12 cells: fusion pore opening and fusion pore dilation. J Physiol 570:295–307. 10.1113/jphysiol.2005.097378 [DOI] [PMC free article] [PubMed] [Google Scholar]
- Wheeler TC, Chin LS, Li Y, Roudabush FL, Li L (2002) Regulation of synaptophysin degradation by mammalian homologues of seven in absentia. J Biol Chem 277:10273–10282. 10.1074/jbc.M107857200 [DOI] [PubMed] [Google Scholar]
- Winkler H (1997) Membrane composition of adrenergic large and small dense core vesicles and synaptic vesicles: consequences for their biogenesis. Neurochem Res 22:921–932. 10.1023/a:1022410506476 [DOI] [PubMed] [Google Scholar]