

Abstract
Hodgkin lymphoma (HL) is composed of neoplastic Hodgkin and Reed‐Sternberg cells in an inflammatory background. The neoplastic cells are derived from germinal center B cells that, in most cases, are infected by Epstein‐Barr virus (EBV), which may play a role in tumorigenesis. Given that EBV‐latent membrane protein 1 (LMP1) regulates autophagy in B cells, we explored the role of autophagy mediated by EBV or LMP1 in HL. We found that EBV‐LMP1 transfection in HL cells induced a modest increase in autophagy signals, attenuated starvation‐induced autophagic stress, and alleviated autophagy inhibition‐ or doxorubicin‐induced cell death. LMP1 knockdown leads to decreased autophagy LC3 signals. A xenograft mouse model further showed that EBV infection significantly increased expression of the autophagy marker LC3 in HL cells. Clinically, LC3 was expressed in 15% (19/127) of HL samples, but was absent in all cases of nodular lymphocyte‐predominant and lymphocyte‐rich classic HL cases. Although expression of LC3 was not correlated with EBV status or clinical outcome, autophagic blockade effectively eradicated LMP1‐positive HL xenografts with better efficacy than LMP1‐negative HL xenografts. Collectively, these results suggest that EBV‐LMP1 enhances autophagy and promotes the viability of HL cells. Autophagic inhibition may be a potential therapeutic strategy for treating patients with HL, especially EBV‐positive cases.
Keywords: autophagy, chloroquine, Epstein‐Barr virus, Hodgkin lymphoma, latent membrane protein‐1, xenograft
EBV‐LMP1 enhances autophagy and promotes viability of Hodgkin lymphoma cells. Autophagic inhibition may be a potential therapeutic strategy for treating patients with Hodgkin lymphoma, especially EBV‐positive cases.

1. INTRODUCTION
Hodgkin lymphoma (HL) is characterized by the presence of a spectrum of neoplastic cells, including mononuclear Hodgkin (H) cells and classic multinucleated Reed‐Sternberg (RS) cells. 1 These cells are derived from germinal center B cells with defective surface B‐cell receptors, crippled immunoglobulin transcripts, and lost B‐cell programs due to epigenetic silencing. 2 , 3 Epstein‐Barr virus (EBV) may play a role in HL tumorigenesis. 4 Accumulation of viral proteins in endoplasmic reticulum (ER) causes stress responses and leads to either apoptosis or survival depending on driving signals. 5 , 6 We have previously found that survival signals of ER stress response are expressed over ER death signals in a dominant fashion in all histological subtypes of HL with a similar level in both EBV‐positive and EBV‐negative cases. 7 Given that HL cells dominantly express survival signals of ER stress response, and autophagy occurs in response to ER stress and ER protein aggregates, it would be interesting to decipher the role of EBV or latent membrane protein‐1 (LMP1) in the HL‐associated autophagy.
Autophagy is a bulk degradation process involved in the clearance of long‐lived proteins and organelles. 8 It is initiated in response to ER stress through the ER‐activated autophagy (ERAA) pathway, which activates a partial unfolded protein response involving PERK and/or IRE1, and a calcium‐mediated signaling cascade. 9 The formation and turnover of the autophagosomes are regulated by autophagy‐related genes (ATGs) and divided into distinct stages. 10 The function of autophagy is multifaceted and complex; it involves a wide range of physiological processes and diseases in humans. 11 The role of autophagy in cancer is also complex and highly controversial, and is linked with both tumor suppression and promotion of cancer. As a homeostatic housekeeper, autophagy is capable of preventing accumulation of toxins or carcinogens, triggering autophagic cell death and apoptosis for damaged cells, and inhibiting inflammation and cell proliferation, thus autophagy can function as a tumor suppressor. 8 , 12 , 13 , 14 On the other hand, autophagy can support cell survival in circumstances of hypoxia and nutrient starvation, augment resistance to apoptosis, and assist tumor survival. 8 , 13 , 15 , 16
We reasoned that LMP1 transfection or EBV infection may regulate autophagy expression in HL cells. Here, by using in vivo and in vitro models with HL cell lines we get novel findings that EBV‐LMP1 transfection in HL cells induced a modest increase in autophagy signals, attenuated starvation‐induced autophagic stress, and alleviated autophagy inhibition‐ or doxorubicin‐induced cell death. LMP1 knockdown led to decreased autophagy LC3 signals. In vivo EBV infection significantly increased autophagy LC3 expression in HL xenografts. Although LC3 expression was uncommon in clinical HL samples and unassociated with EBV status or clinical outcome, autophagic blockade effectively eradicated LMP1‐positive HL xenografts with better efficacy than their LMP1‐negative HL counterparts.
2. MATERIALS AND METHODS
2.1. HL cell lines and lymphoblastoid cell lines
The EBV‐negative HL cell lines L428 and KM‐H2 (DSMZ) were grown in RPMI‐1640 medium supplemented with 10% fetal bovine serum (HyClone). The vector expressing B95.8 EBV‐derived LMP1, pEGFP‐LMP1 (N‐terminally GFP‐tagged LMP1), and its control vector, pEGFP‐C3, were generated by ligation of PCR‐amplified DNA fragments to HindIII/BamHI‐treated pEGFP‐C3. 17 , 18 The LMP1 expression construct was transfected by an electroporation machine Microporator (Digital Bio Technology Co., Ltd) with 2 μg of DNA at 1100 V for 30 mS. 7 , 18 Transfection efficiency was determined by flow cytometric immunophenotypic analysis (FACSCalibur with CellQuest software; Becton Dickinson). The EBV‐infected HL cell line KM‐H2‐EBV was generated by in vitro infection with recombinant Akata EBV and selected following G418 treatment, as described previously. 19 L428 and KM‐H2 cells have been shown to be representative of HL cells. 20 Expression of LMP1 and EBER was detected by immunoblotting and in situ hybridization, respectively. Stable cell lines (L428‐LMP1, KM‐H2‐EBV) were cultured in RPMI‐1640, supplemented with 10% fetal bovine serum (FBS) with puromycin dihydrochloride (Thermo‐Fisher Scientific, A1113803). For unknown reasons, we cannot successfully create L428‐EBV or KM‐H2‐LMP1 stable cell lines. The authentication of cell lines was performed by short‐tandem repeat profiling, and Mycoplasma testing was done by conventional PCR methods.
To study the role of EBV‐associated autophagic flux in blood B cells, we created B‐lymphoblastoid cell lines (LCLs), which were derived from human blood B cells (Taiwan Blood Services Foundation, Tainan Blood Center) immortalized by EBV infection. 19 , 21 LCLs were cultured in RPMI‐1640, supplemented with 20% FBS. All cells were incubated at 37°C in humidified atmosphere of 5% CO2. On starvation experiment, serum‐containing medium was removed, and cells were washed twice with sterile phosphate buffer saline (PBS). Then, each 2 × 10⁵/100 μL of L428‐GFP and L428‐LMP1 cells were serum starved in 2.5% FBS for up to 72 hours. 22
2.2. Western blot analysis
The cell lines were lysed in 1× Radio‐Immunoprecipitation Assay (RIPA) sample buffer (Upstate Biotechnology) containing 50 mM Tris‐HCl (pH 8.8) and supplemented with protease and phosphatase inhibitor cocktails (Upstate Biotechnology). The lysates were centrifuged, and the supernatants were collected to a new 1.5 mL microcentrifuge tube. Polyacrylamide gel electrophoresis and immunodetection were performed. 21 Protein concentrations were expressed as the amount of protein divided by the corresponding amount of glyceraldehyde 3‐phosphate dehydrogenase (GAPDH, 1:2500, sc‐32233, Santa Cruz Biotechnology) using an imaging analyzer (White Light Transilluminator, Bio‐Rad Laboratories). The antibodies for immunodetection are provided in Table S1.
2.3. Immunofluorescence staining
L428‐GFP (1 × 10⁶) and L428‐LMP1 (1 × 10⁶) cells were cultured in six‐well plates. After cytospinning at 350 rpm for 15 minutes, cells were transferred onto poly‐l‐lysine‐coated glass slides for immunofluorescence staining, as previously described. 21 The primary antibody was LC3 A/B (D3U4C, 1:20, cell signaling). Nuclear DNA was stained with 4'‐6‐diamidino‐2‐phenylindole (DAPI, 1:1000; Invitrogen) for 15 minutes at room temperature in the dark. Finally, the cell signal was detected by fluorescence microscopy.
2.4. Cell death analysis
Cytotoxic effects of chloroquine (CQ, Sigma‐Aldrich, C6628) and doxorubicin (DOX, Adriblastina, Actavis Italy SpA) were assessed in L428‐GFP, L428‐LMP1, KM‐H2‐GFP, and KM‐H2‐EBV cell lines. Cell death was measured by externalization of phosphatidylserine on the plasma membrane detected by Annexin V (BD Biosciences, APC Annexin V 550475). According to the manufacturer's guidelines, 1.5 × 10⁶ cells were treated with CQ (5, 10, and 20 µM) or DOX (0.1, 1, and 10 µM) for 24, 48, and 72 hours. The samples were centrifuged, washed twice with cold PBS, and re‐suspended in 1 ml of 1× binding buffer (BD Biosciences, 51‐66121E). Next, 100 µL of sample was transferred to 1.5‐mL Eppendorf tubes, and 5 µL of APC Annexin V and 5 µL of 7‐amino‐actinomycin D (7‐ADD) staining solution (BD Biosciences, 559925) were added for 15 minutes at 4°C in the dark. Core DNA content was measured using a logarithmic amplification in the FL2 (for annexin V) and FL3 (for 7‐AAD) channels of the flow cytometer (BD FACSCanto II with BD FACSDiva software, Becton Dickinson). Each assay was repeated in triplicate.
2.5. Short hairpin RNA targeting LMP1
The design of the short‐hairpin RNAs (shRNAs) targeting LMP1 (full sequences for cloning in Table S2) was based on splashRNA and cloned into the donor vector below by Gibson assembly. 23 The forward and reverse oligos were cloned into an AAVS1 locus‐donor vector expressing GFP and the shRNA in tandem as described, 24 except that the Thy1.1 was replaced by GFP for staining‐free assessment of the induction. Five micrograms of the donor vector and 5 µg of the px459‐based AAVS1‐targeting vector were electroporated into the recipient cells with NEPA21 system. The electroporated cells were selected with 300, 400, and 600 µg/mL of hygromycin 2 days later and assayed as described in the results.
2.6. Xenograft murine model with EBV‐positive and EBV‐negative KM‐H2 HL cells
The xenograft tumors yielded by inoculation of KM‐H2‐GFP (EBV‐negative) and KM‐H2‐EBV (EBV‐positive) cells were from a previous study, 18 where 10 tumor nodules from each group were paraffin‐embedded and analyzed immunohistochemically for LC3A/B expression to assess whether EBV infection correlated with LC3 expression.
2.7. Hodgkin lymphoma cases
The study group included 127 formalin‐fixed, paraffin‐embedded cases of HL, with 23 cases from First Children Hospital, Ho‐Chi‐Minh City, Vietnam, 43 cases from the National Cheng Kung University Hospital, Taiwan, and 61 cases from the Veterans General Hospital (VGH)‐Taipei from 1985 to 2006. The diagnosis and subtype of each case of HL were reviewed by two pathologists (KCC and PCHC) and the immunophenotype of the HRS cells was CD30+/CD15±/CD45‐/CD3‐/CD20±. The study protocol was approved by our institutional review board (NCKUH‐ER‐99‐406) and was in accord with the Helsinki Declaration of 1975, as revised in 2013.
All HL cases were classified according to the World Health Organization (WHO) classification scheme. 25 Clinical data including sex, age, serum lactate dehydrogenase (LDH) level, tumor site, Ann Arbor stage, treatment modality, and disease‐specific survival, were obtained by reviewing patient charts. All patients with available information were followed and the duration of follow‐up ranged from 3.4 to 208 months. All HL patients were treated with chemotherapy regimens with curative intent, using the ABVD (epirubicin/Adriamycin, bleomycin, vinblastine, and dacarbazine) or BEACOPP (bleomycin, etoposide, epirubicin/Adriamycin, cyclophosphamide, oncovin, procarbazine, and prednisolone) regimens. For selected patients, surgical intervention and/or radiotherapy preceded chemotherapy.
2.8. Immunohistochemistry
Immunostaining on clinical HL samples (n = 127) was performed to measure autophagic activity with the relevant marker LC3A/B (MAP1LC3, microtubule‐associated protein 1 light chain 3, rabbit monoclonal, D3U4C, 1:25, cell signaling). 26 Expression of LC3A/B was analyzed to test any potential associations with EBV positivity, LMP1 expression, and prognosis. Immunohistochemical staining was performed on 4‐μm‐thick formalin‐fixed paraffin‐embedded sections of clinical HL specimens. The procedures were performed using a Bond‐Max Automated IHC stainer (Leica Biosystems Newcastle Ltd), and developed with 3,3’‐diaminobenzidine (DAB) chromogen. Counterstaining was carried out with hematoxylin.
2.9. EBV detection
In situ hybridization was performed to detect EBV‐encoded small RNAs (EBER) using an RNA probe cocktail (Ventana Medical System, Inc). 27 The nucleotide integrity was tested using a poly‐A tail RNA positive control probe (Ventana Medical System). Positivity was defined as more than 10% of HL cells showing unequivocal EBER signals. 28
2.10. Subcutaneous xenograft mouse model for CQ treatment
The xenograft model was performed on 5‐week‐old male nonobese diabetes/severe combined immunodeficiency (NOD/SCID) mice (CB17‐Prkdcscid/NcrCrl; BioLASCO Taiwan, Bltw). The L428‐GFP and L428‐LMP1 cells were grown in culture to confluence. Cells were passed by removing feeding medium, and the suspension with PBS was centrifuged at 1000 rpm for 5 minutes. Each 1 × 10⁶ L428 cells in 100 μL PBS were subcutaneously injected into right thigh of NOD/SCID mice. On day 7 after tumor injection, the mice were injected intraperitoneally with 60 mg/kg of CQ every day for 25 days. The dose (60 mg/kg) used was in accord with a previous study. 29 As controls, mice were injected with PBS, starting at day 7 after tumor injection, and were treated every day for 25 days. The mice were monitored daily and sacrificed to assess the tumor weight and volume using the formula 1/2 (length × width2). All procedures were performed in accord with institutional animal policies (IACUC Approval No. 100078 and 106091) and national laws.
2.11. Statistical analysis
Statistical analysis was performed using GraphPad Prism software (GraphPad, Inc). The χ2 test (or two‐tailed Fisher's exact test when expected number <5) was used for categorical variables. Student's t‐test or ANOVA test was used for continuous variables. Error bars represented the standard error of the mean (SEM) of three separate experiments and statistical analysis was considered to be significant when the P value was <.05 (*P < .05, **P < .01, ***P < .001). The correlations of LC3 expression in clinical samples with clinicopathologic parameters were evaluated by Kendall's tau (Τ) correlation test. The Bonferroni correlation was used to avoid spurious positive results in multiple comparisons. Tumor‐specific survival was measured from initial diagnosis to death and follow‐up data of surviving patients were assessed at the last contact date. Estimates of survival distribution were calculated using the Kaplan‐Meier method. Time‐to‐event distributions were compared using the log‐rank test. The Cox proportional‐hazard model was used to test the simultaneous influence on survival of relevant covariates. The P values were two‐sided.
3. RESULTS
3.1. LMP1 increases autophagy in HL cells and helps HL cells adapt to starvation‐induced autophagic stress
To investigate the effect of EBV infection on the induction of autophagy signals, sorted peripheral blood mononuclear cells (PBMCs) were infected with EBV to form LCLs (Figure 1A). LCLs expressed an EBV type III latency program (LMP1+/EBNA2+), the L428‐LMP1 cell line demonstrated an EBV type II latency program (LMP1+/EBNA2−), and KM‐H2‐EBV was consistent with EBV type I latency program (LMP1−/EBNA2−/EBNA1+). Compared with PBMCs, LCLs showed decreased expression of autophagic protein LC3‐II in both long‐term and newly formed LCLs, although the cytosolic form of LC3 (LC3‐I) was increased (Figure 1B). Notably, LCLs with lower expression of LMP1 showed a higher expression level of early autophagy LC3‐I. Interestingly, LMP1 transfection increased autophagic flux of LC3‐II in L428 HL cells but the KM‐H2‐EBV stable line showed decreased autophagic flux LC3‐II (Figure 1C), highlighting the role of LMP1 in autophagy induction in HL cells. We further studied the effects of starvation on autophagic flux of HL cells. As shown in Figure 1D, serum starvation in L428‐GFP cells showed increased autophagic flux of LC3‐II, which persisted for 72 hours. Instead, LMP1‐transfected L428 cells showed increased starvation‐induced autophagic flux of LC3‐II at 24 hours, but attenuated autophagic flux at 48 and 72 hours. Other autophagic proteins showed a similar trend with LC3‐II. It appears that HL cells with EBV‐LMP1 expression adapted to starvation‐induced autophagic stress more quickly. Immunofluorescence staining also confirmed LMP1 transfection increased autophagic flux of LC3‐II in L428 HL cells (Figure 1E).
FIGURE 1.
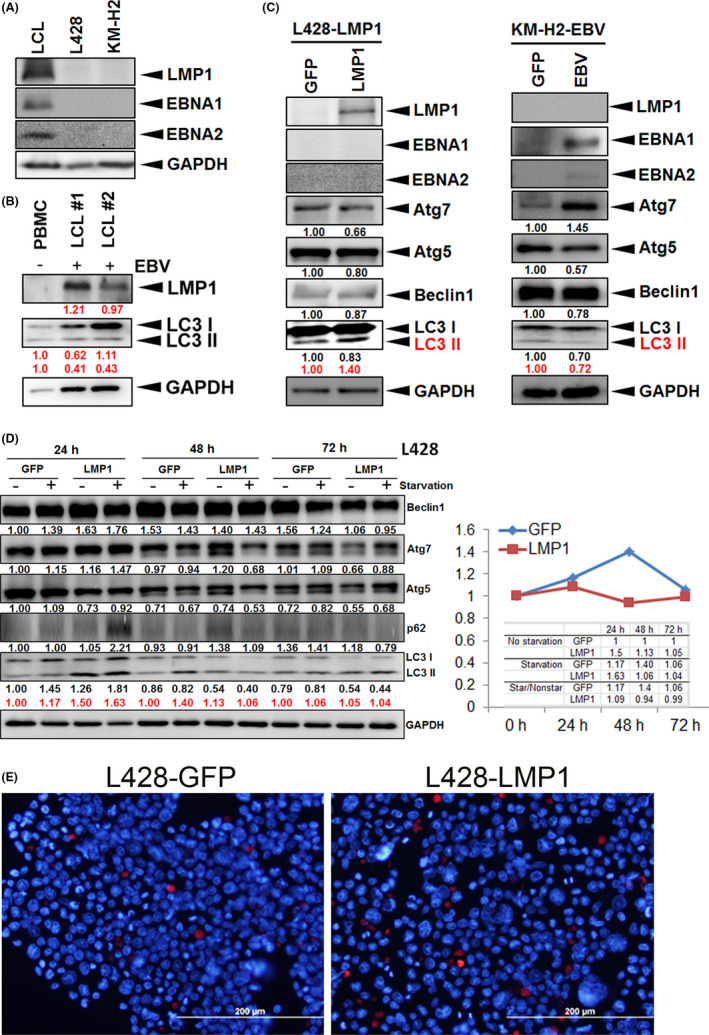
LMP1 increases autophagy in HL cells and helps HL cells adapt to starvation‐induced autophagic stress. A, Expression patterns of LMP1 in LCL, parental EBV‐negative L428 or KM‐H2 cell lines. The cell lines (LCL, L428, and KM‐H2) were blotted with antibodies against LMP1 and GAPDH. GAPDH served as the loading control. B, Expression of LMP1 and autophagic markers in PBMCs infected with EBV. The samples from parental PBMCs, EBV‐infected newly formed (#1) and long‐termed (#2) LCLs were blotted with αLMP1 (LMP1) and αLC3 (LC3‐I and ‐II) antibodies. The red numbers represent relative band intensities normalized by GAPDH. C, Expression of autophagic markers in L428‐LMP1 (left) and KM‐H2‐EBV (right) cells. C, left panel, The LMP1‐transfected L428 cells had undergone stable selection and show expression of LMP1 but not EBNA1 or EBNA2. Stably transfected L428 cells with a GFP‐expressing vector served as the nonexpressing control. LMP1 transfection increased LC3‐II expression but decreased expression of other autophagic proteins. C, right panel, KM‐H2‐EBV cells expressed EBNA1 but not LMP1 or EBNA2. Stably‐transfected KM‐H2 cells with a GFP‐expressing vector served as the nonexpressing control. EBV type I latency program augmented Atg7 expression but attenuated expression of LC3‐II, Atg5 and Beclin 1. The red numbers represent the relative band intensity of LC3‐II normalized by GAPDH. D, The changes in autophagic markers induced by starvation in L428 HL cells. The L428‐GFP and L428‐LMP1 cells (each 2 × 10⁵ cells) were cultured in 100 μL of 2.5% FBS medium for 72 h. The samples were harvested at respective time points and assayed by blotting with antibodies against Beclin1, Atg7, Atg5, p62, LC3, and GAPDH. The numbers represent the relative band intensities normalized by GAPDH (red for LC3‐II). The changes of LC3‐II ratio (starvation divided by nonstarvation) are plotted. Other autophagic proteins show a similar trend with LC3‐II. E, Stable cell lines (L428‐GFP and L428‐LMP1) were stained by αLC3 antibody on immunofluorescence, which shows more LC3‐II signals (red) in L428‐LMP than those in L428‐GFP cells (31/383 = 8.1% vs 9/449 = 2.0%, P < .001; blue, DAPI for nuclear staining)
3.2. LMP1 or EBV increases autophagic flux of LC3‐II and rescues chloroquine‐induced death in HL cells
CQ, an autophagy inhibitor, prevents autophagosome fusion with the lysosome 13 and induces caspase‐dependent apoptosis of lymphoma cells. 30 We used CQ to block autophagy and found that in comparison with L428‐GFP, L428‐LMP1 showed increased autophagic flux of LC3‐I/II and decreased CQ‐induced cell death, especially at 24 hours (Figure 2A‐C). Notably, both L428‐GFP and L428‐LMP1 showed dose‐dependent increased cell death along with increased autophagy LC3‐II. Other autophagic proteins showed a similar pattern with LC3‐II or unremarkable changes in protein expression. The treatment of CQ in EBV‐negative (KM‐H2‐GFP) and EBV‐infected KM‐H2 (KM‐H2‐EBV) cells revealed similar results with L428 cells, that is, KM‐H2‐EBV cells showed increased autophagic flux of LC3‐II as well as other autophagic proteins, and decreased CQ‐induced cell death than KM‐H2‐GFP cells, especially at 48 hours (Figure S1).
FIGURE 2.
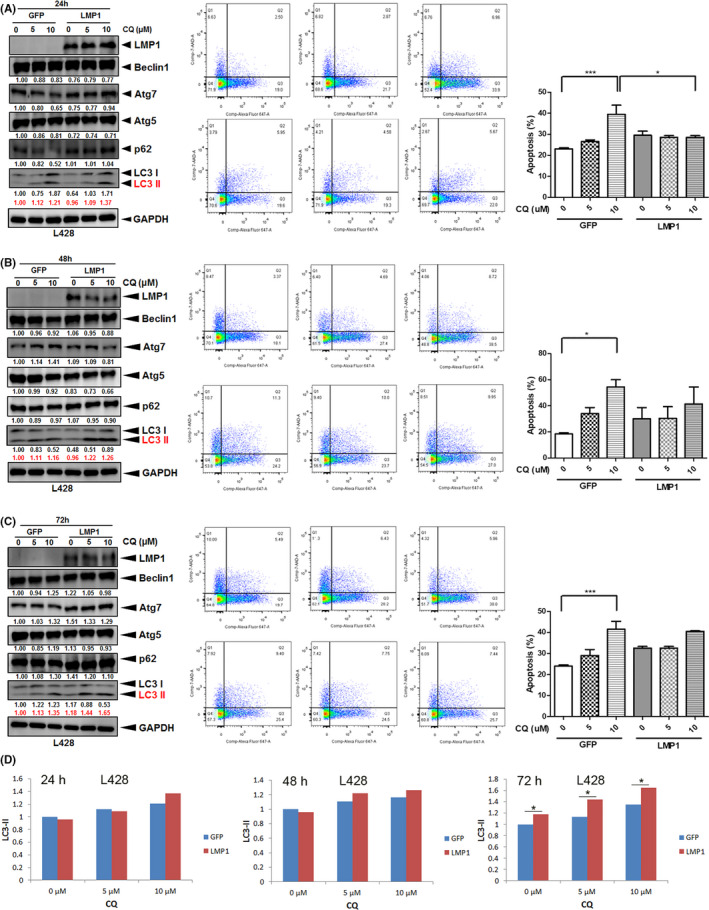
LMP1 increases autophagic flux LC3‐II and rescues chloroquine (CQ)‐induced death in HL cells. L428‐LMP1 and the control L428‐GFP (1.5 × 10⁶ cells for each) were treated with 0, 5, or 10 µM chloroquine (CQ) for 24 h (A), 48 h (B), and 72 h. C, left panel, The samples were harvested and blotted with αLMP1, αBeclin1, αAtg7, αAtg5, αp62, αLC3, and αGAPDH antibodies. Red numbers indicate relative band intensities of LC3‐II normalized by GAPDH. Other autophagic proteins show a similar pattern with LC3‐II or unremarkable changes in protein expression. C, middle panel, Representative flow‐cytometry plots to evaluate the apoptotic cell death occurring in the identical samples in the left panel, which were harvested and stained for Annexin V (FL2) and 7‐AAD (FL3). C, right panel, Quantification of the flow data in the middle panel. The percentage of cells in quadrants 2 + 3 was used for plotting (n = 3, mean ± SEM). Asterisks represent P < .05 by paired t‐test (*P < .05, **P < .01, ***P < .001). D, LC3‐II ratios are plotted based on relative band intensities of LC3‐II normalized by GAPDH (red numbers)
3.3. LMP1 increases autophagic flux of LC3‐II and rescues doxorubicin‐induced death in HL cells
Doxorubicin (DOX), which interacts with DNA by intercalation and inhibition of macromolecular biosynthesis, 31 is a standard chemotherapeutic agent used for HL treatment. 32 We tested whether DOX‐induced HL cell death was associated with autophagy and was affected by EBV or LMP1. After treatment with DOX for 24, 48, or 72 hours, we found that in comparison with control (L428‐GFP), L428‐LMP1 showed increased autophagic flux of LC3‐I/II and decreased DOX‐induced cell death, especially at 48 (Figure 3B) and 72 hours (Figure 3C). In contrast, other autophagic proteins demonstrated decreased expression along with HL cell death, especially at 10 μM DOX and at 48 and 72 hours. Both L428‐GFP and L428‐LMP1 showed dose‐dependent increased cell death along with increased autophagy. Interestingly, KM‐H2‐EBV cells showed a trend on enhancing autophagic flux of LC3‐II but no effect on rescuing DOX‐induced death compared with KM‐H2‐GFP cells (Figure S2). Other autophagic proteins demonstrated decreased expression along with HL cell death. Taken together, LMP1 rescued DOX‐induced cell death and promoted cell viability in L428, but EBV (EBNA1/type I latency program) showed no rescuing effect on DOX‐induced KM‐H2 cell death.
FIGURE 3.
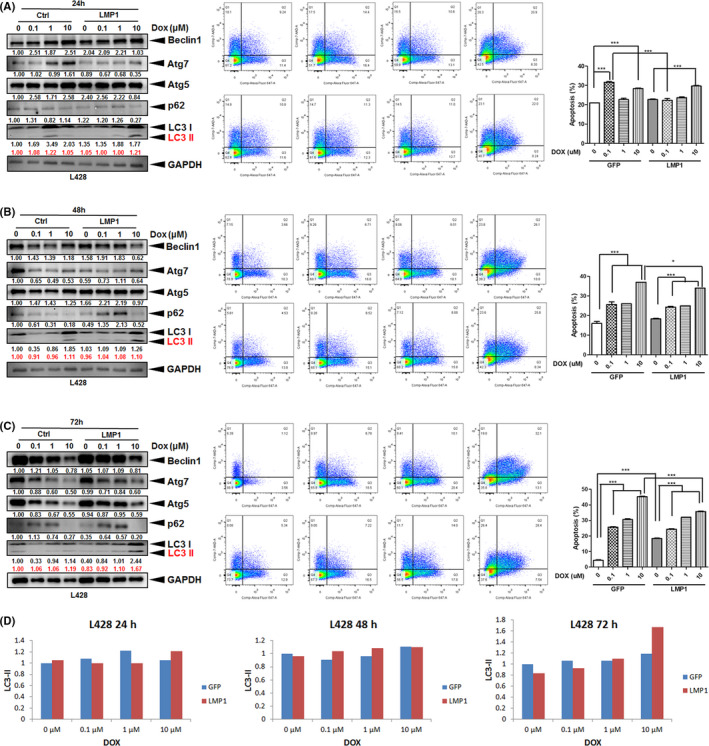
LMP1 increases autophagic flux LC3‐II and rescues doxorubicin (DOX)‐induced death in HL cells. L428‐LMP1 and the control L428‐GFP (1.5 × 10⁶ cells for each) were treated with 0, 0.1, 1, or 10 µM doxorubicin (DOX) for 24 h (A), 48 h (B), and 72 h. C, left panel, The samples were harvested and blotted with αBeclin1, αAtg7, αAtg5, αp62, αLC3 and αGAPDH antibodies. Red numbers indicate relative band intensities of LC3‐II normalized by GAPDH. In contrast to LC3‐I/II, other autophagic proteins demonstrated decreased expression along with HL cell death, especially at 10 μM DOX and at 48 and 72 h. C, middle panel, Representative flow‐cytometry plots to evaluate the apoptotic cell death occurring in the identical samples in the left panel, which were harvested and stained for Annexin V (FL2) and 7‐AAD (FL3). C, right panel, Quantification of the flow data in the middle panel. The percentage of cells in quadrants 2 + 3 was used for plotting (n = 3, mean ± SEM). Asterisks represent P value <.05 by paired t‐test (*P < .05, **P < .01, ***P < .001). D, Plots of the LC3‐II ratio normalized by GAPDH in immunoblotting
3.4. LMP1 knockdown leads to decreased autophagy LC3 signals in HL cells
To test whether EBV‐LMP1 directly contributes to increased autophagic flux of LC3, we knocked down LMP1 by shRNA to see the effect on L428 HL cells. As shown in Figure S3, the expression of LC3‐I and LC3‐II was decreased along with the attenuation of LMP1. Regarding the NFκB pathway, the noncanonical factor phospho(p)‐RelB was also decreased along with LMP1 knockdown, whereas the canonical pathway factors p‐RelA and p‐c‐Rel were relatively unchanged.
3.5. The relation between NFκB pathway and autophagy pathway
As constitutive activation of NFκB pathway is the hallmark of HL tumor cells, we further examined the relation between NFκB pathway and autophagy pathway in association with CQ and DOX treatment. For CQ treatment, LMP1 increased autophagic flux of LC3‐II in L428 HL cells but decreased expression of both canonical (p‐RelA and p‐c‐Rel) and noncanonical (p‐RelB) NFκB pathways, especially at 72 hours (Figure S4A). EBV increased autophagic flux of LC3‐II in KM‐H2 HL cells and increased expression of the noncanonical (p‐RelB) pathway but the effect on expression of the canonical NFκB pathway was variable (Figure S4B). For DOX treatment, LMP1 or EBV increased autophagic flux of LC3‐II in L428 or KM‐H2 HL cells, respectively, but the expression of both canonical (p‐RelA and p‐c‐Rel) and noncanonical (p‐RelB) pathways was not changed significantly (Figure S5). It appears that autophagy pathway is associated with the NFκB pathway in the presence of EBV or LMP1, but the effect of association may depend on different HL cell lines and different reagent treatments.
3.6. EBV infection enhances LC3 expression in xenograft tumors of KM‐H2 cells
In vitro studies show that LMP1 or EBV enhances autophagic flux of LC3‐II and rescues CQ‐induced cell death. We tested whether the findings held true in the animal models. In parallel, KM‐H2‐EBV xenografts showed significantly higher expression of LC3 than KM‐H2‐GFP xenografts (8/10 vs 2/10, P = .007, Figure 4). Although tumor necrosis was also more frequently found in KM‐H2‐EBV compared with KM‐H2‐GFP xenografts (9/10 vs 7/10), the difference was not significant (P = .264).
FIGURE 4.
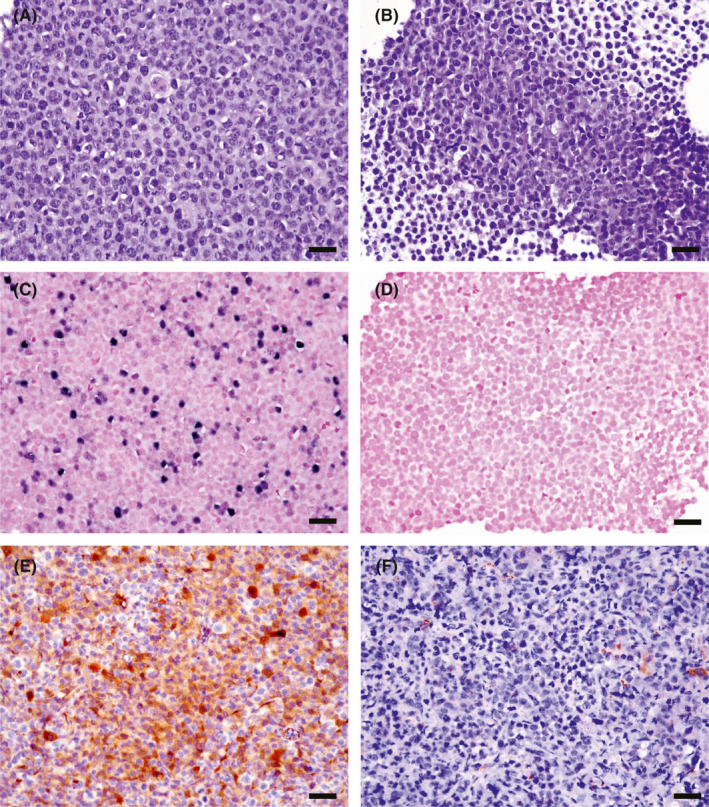
Xenograft mouse model shows that KM‐H2‐EBV HL cells (A, C, E, X400) express autophagic protein LC3A/B more frequently than KM‐H2‐GFP HL cells (B, D, F, X400). NOD/SCID mice were injected with KM‐H2‐EBV HL cells vs. KM‐H2‐GFP HL cells and were harvested 16 weeks later. The formed xenograft tumors from both groups (n = 10 for each) were examined immunohistochemically for LC3 expression. Histologically, KM‐H2‐EBV (A) and KM‐H2‐GFP (B) tumor cells are similar on H&E staining sections. EBER in situ hybridization confirms the presence of EBV‐encoded RNA in KM‐H2‐EBV (C) but not in KM‐H2‐GFP (D) xenograft. The in vivo model shows a higher expression rate of LC3A/B in KM‐H2‐EBV (E) vs KM‐H2‐GFP (F) tumors (8/10 vs 2/10, P = .007, Chi2‐test). Scale bar = 50 µM
3.7. Relative frequency and clinicopathological features in clinical HL cases
We analyzed clinical HL cases to test the correlation of LC3 expression with clinicopathologic features. The distribution and clinicopathologic features of the HL cases (n = 127) are summarized in Table 1. There were 83 men and 44 women with a mean age of 37 years at diagnosis. The distribution of HL subtypes was as follows: nodular lymphocyte‐predominant (NLP, n = 4, 3%), nodular sclerosis (NS, n = 82, 65%), mixed cellularity (MC, n = 24, 19%), lymphocyte‐rich classic (LRC, n = 10, 8%), lymphocyte depletion (LD, n = 3, 2%), and unclassified HL (n = 4, 3%).
TABLE 1.
Results of clinicopathologic features in HL
| Subtype | No. | % | Sex (M/F) | Mean age (range) | EBV+ (%) | LMP1+ (%) | LC3+ (%) | Stage (3‐4) (%) | |
|---|---|---|---|---|---|---|---|---|---|
| NLP | 4 | 3% | 2/2 | 1.0 | 57.5 (29‐77) | 0 (0) | 0 (0) | 0 (0) | 0 (0) |
| NS | 82 | 65% | 48/34 | 1.4 | 35.0 (2‐81) | 42/81 (52) | 20/57 (35) | 10 (12) | 33/57 (58) |
| MC | 24 | 19% | 22/2 | 11.0 | 40.3 (4‐87) | 17/23 (74) | 8/14 (57) | 5 (21) | 6/10 (60) |
| LRC | 10 | 8% | 5/5 | 1.0 | 37.4 (5‐69) | 2 (20) | 2 (20) | 0 (0) | 2/7 (29) |
| LD | 3 | 2% | 3/0 | ‐ | 13.7 (7‐27) | 2 (67) | 1 (33) | 3 (100) | NA (NA) |
| HL* | 4 | 3% | 3/1 | 3.0 | 54.8 (39‐71) | 4 (100) | 3 (75) | 1 (25) | 4 (100) |
| Total | 127 | 100% | 83/44 | 1.9 | 37.0 (2‐87) | 67/125 (54) | 34/92 (37) | 19/127 (15) | 45/82 (55) |
Abbreviations: *HL, unclassified HL; LD, lymphocyte depletion; LRC, lymphocyte‐rich classic; MC, mixed cellularity; NLP, nodular lymphocyte‐predominant; NS, nodular sclerosis.
Expression of EBV by EBER in situ hybridization was found in 54% (67/125) of all HL cases tested. The overall positive rates for LMP1, LC3A/B, and high‐stage disease (stage 3‐4) were 37% (34/92), 15% (19/127), and 55% (45/82), respectively. Interestingly, LC3 expression (Figure 5) was positive in all three cases of LD subtype (3/3, Figure 5C) and was absent in all cases of NLP (0/4) and LRC (0/10) types. However, the expression of autophagy marker LC3 was not correlated with EBV status (P = .161), LMP1 expression (P = .909), or clinical outcome (P = .709). The clinicopathologic factors affecting survival are listed in Table 2. In a univariate analysis, the significant parameters related to poorer prognosis included old age (>60 years, P < .001), EBV association (P = .091), and LMP1 expression (P = .022).
FIGURE 5.
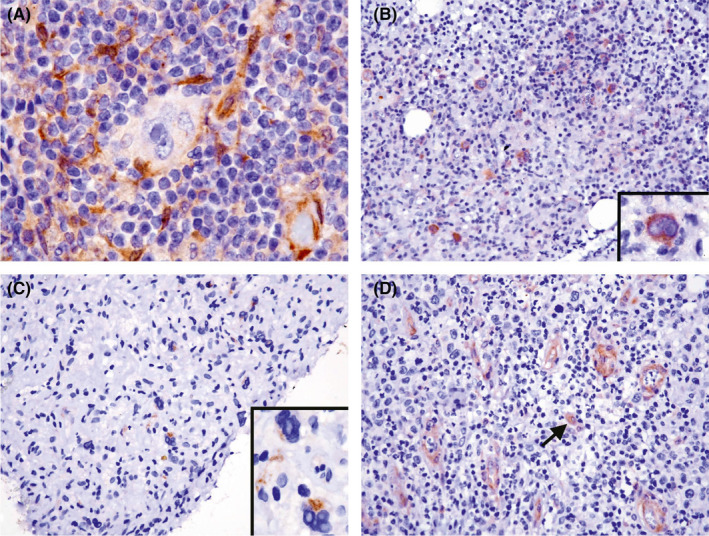
LC3 expression in clinical HL samples is infrequent and only positive in ~15% of cases. A, This nodal case shows LC3 expression in the cytoplasm of histiocytes, but not in HL tumor cells (1000×, hematoxylin counterstain). B, This case with bone marrow involvement shows cytoplasmic expression of LC3 in HL tumor cells (200× inset, 1000× hematoxylin counterstain). C, The tumor cells of lymphocyte‐depleted (LD) subtype are positive for LC3 expression (400× inset, 1000× hematoxylin counterstain). D, Vascular endothelial cells and histiocytes (arrow) are typically positive for LC3 expression (400× hematoxylin counterstain)
TABLE 2.
Clinicopathologic parameters affecting survival of HL patients
| Factors | Poor prognosis | (%) |
Uni1 P |
Multi P |
HR | 95% CI | |
|---|---|---|---|---|---|---|---|
| Lower | Upper | ||||||
| Old age | >60 y | 29% | <.001 | .008 | 3.395 | 1.372 | 8.399 |
| Sex | Male | 65% | .739 | ‐ | ‐ | ‐ | ‐ |
| Stage | High (3‐4) | 55% | .884 | .358 | 1.448 | 0.658 | 3.187 |
| LDH | >200 IU/L | 54% | .584 | ‐ | ‐ | ‐ | ‐ |
| B symptoms | Presence | 35% | .694 | ‐ | ‐ | ‐ | ‐ |
| Subtype | Non‐NS | 35% | .520 | ‐ | ‐ | ‐ | ‐ |
| EBV | Presence | 54% | .091 | .803 | 1.167 | 0.346 | 3.936 |
| LC3 | Presence | 15% | .855 | .274 | 0.496 | 0.141 | 1.743 |
| LMP1 | Presence | 38% | .022 | .769 | 1.211 | 0.337 | 4.356 |
Abbreviations: CI, confidence interval; LDH, lactate dehydrogenase; Multi, multivariate analysis; Non‐NS, non‐nodular sclerosis type HL; Uni, univariate analysis.
3.8. CQ treatment effectively eradicates L428‐LMP1 xenograft in a better efficacy than L428‐GFP xenograft
Although LC3 expression was not correlated with patient survival, we tested whether autophagic blockade by CQ treatment inhibited tumor growth in vivo. NOD/SCID mice were divided into four groups (Figure 6A): GFP + PBS (n = 6), GFP + CQ (n = 7), LMP1 + PBS (n = 7), and LMP1 + CQ (n = 7). After CQ or PBS treatment for 25 days, the LMP1 + CQ group showed complete tumor regression (0/7), in contrast with the GFP + PBS (6/6), GFP + CQ (5/7), and LMP1 + PBS (5/7) groups, although the GFP + CQ group also showed persistent tumor regression (Figure 6B‐E). However, the body weights of tumor‐bearing mice were not significantly different (Figure 6F). It appears that CQ treatment abrogates the pro‐tumoral effects of LMP1.
FIGURE 6.
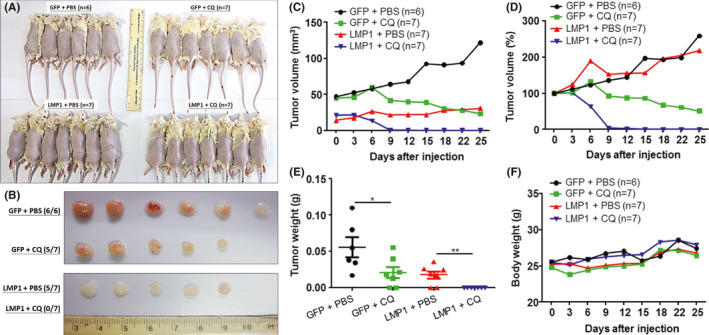
Xenograft mouse model shows that CQ treatment effectively eradicated L428‐LMP1 xenograft more efficiently than did L428‐GFP xenograft. NOD/SCID mice were divided into four groups: GFP + PBS (n = 6), GFP + CQ (n = 7), LMP1 + PBS (n = 7), and LMP1 + CQ (n = 7). GFP, L428‐GFP xenograft; LMP1, L428‐LMP1 xenograft; CQ, CQ treatment (60 mg/kg for 25 days); PBS, PBS mock treatment control. A, Appearances of the mice and their injection sites on the back 25 days after tumor cell injection and treatment. B, The gross morphology of the excised tumors in (A). C‐F, Plots of the xenograft tumor sizes (C, mm3; D, percentages of the original size), tumor weights (E, grams), and the corresponding mouse weights (F, grams). Black, GFP + PBS; green, GFP + CQ; red, LMP1 + PBS; blue, LMP1 + CQ. Asterisks represent P value <.05 by Student t‐test
4. DISCUSSION
HL is derived from germinal center B cells and EBV‐LMP1 likely plays a role in the transformation event of HL precursor cells. 33 Accumulation of viral proteins in ER causes ER stress responses whereby the HL cells predominantly express survival signals over the death signals of the ER stress response. 7 Herein, we further found that EBV‐LMP1 transfection induced a modest increase in autophagy signals, helped HL cells adapt to starvation‐induced autophagic stress, and alleviated autophagy inhibition‐ or doxorubicin‐induced cell death. Using a xenograft mouse model, we also showed that EBV infection significantly increased autophagy LC3 expression in HL cells. Clinically, LC3 was infrequently expressed in HL samples and undetected in NLP and LRC cases, but interestingly all three LD cases were positive. Although expression of LC3 was not correlated with EBV status or clinical outcome, autophagic blockade more effectively eradicated L428‐LMP1 xenografts than L428‐GFP xenografts. Collectively, these results suggest that EBV‐LMP1 enhances autophagic flux in HL cells and that autophagic inhibition may be a potentially therapeutic strategy for HL patients.
It is known that LMP1 induces autophagy in a dose‐dependent manner and that B cells that express low levels of LMP1 display early stages of autophagy LC3‐I. 34 Accordingly, we found that lymphoblastoid cell lines with lower expression of LMP1 showed higher expression of early autophagy LC3‐I. In addition, LMP1 transfection increased autophagic flux of LC3‐II in L428 cells, but EBV infection in KM‐H2 cells decreased autophagic flux of LC3‐II. L428‐LMP1 cells, a modified EBV‐infected status in HL cells, have a type II latency program (LMP1+/EBNA2−), which is consistent with the EBV latency program expressed in clinical HL cases. 35 In contrast, the KM‐H2‐EBV cells, which have a type I latency program, showed no significant effect on resistance to DOX‐induced cell death. LMP1 augmented autophagic flux and chemoresistance in HL cell lines, and LMP1‐bearing HL xenografts more effectively responded to autophagic blockade therapy.
LMP1, an EBV oncoprotein, acts as a CD40 functional homologue and activates several downstream pathways such as NFκB, mitogen‐activated protein kinase (MAPK), phosphatidylinositol 3‐kinase (PI3‐K), IRF7, and JAK‐STAT. 36 The more resistant effect of the L428‐LMP1 cell line (type II latency) than KM‐H2‐EBV cell line (type I latency) on DOX‐induced cell death may reflect the pivotal role of LMP1 on HL cell survival. We found that EBV‐LMP1 expression in HL cells attenuated starvation‐induced autophagic stress and alleviated CQ‐ or DOX‐induced HL cell death through upregulation of autophagy LC3‐I/II. It appears that the dynamics of autophagic flux reflects the cellular stresses of HL. When HL cells meet with a low cellular stress such as serum starvation, autophagy is activated and then subsequently returns to basal status. When HL cells encounter a high cellular stress such as CQ or DOX treatment, which goes beyond the compensated ability of elevated autophagy, the cells undergo apoptosis. Interestingly, we found that prolonged high stress led to increased expression of LC3 and decreased expression of other autophagic proteins along with HL cell death (Figures 3 and S2). In these processes regulated by autophagy, EBV‐LMP1 may augment the compensation function of autophagy through activation of the NFκB pathway. 37 , 38 We additionally demonstrated that EBV increased autophagic flux of LC3‐II in KM‐H2 HL cells and increased expression of the noncanonical (p‐RelB) pathway (Figure S4B).
Autophagic flux is characteristically dynamic over time. In addition, cellular expression of LMP1 at variable levels may further alter autophagic flux in different HL tumor cells. 34 Although, our in vitro and in vivo models demonstrated that LMP1 enhanced autophagic flux of LC3‐II, expression of LC3‐II in clinical HL cases was uncommon and uncorrelated with LMP1 expression or EBV infection. Because HL tumorigenesis is a long‐term process and EBV plays an etiologic role in early tumorigenesis, 4 it is plausible that in a well‐established HL case the tumor cells may have adapted to autophagic stress on overexpression of LMP1 or other EBV‐associated proteins.
Birkenmeier et al 29 have reported that basal autophagy is expressed in HL tumor cells and is pivotal for survival and growth of HL cells, but nothing was mentioned about EBV. Our findings are largely consistent with their data that through increased autophagic flux the HL tumor cells can attenuate drug‐induced cell death and CQ treatment effectively eradicates HL xenograft. Regarding the trigger of basal autophagy, Birkenmeier et al 29 consider genetic instability‐associated protein misfolding to be the culprit. Here, we further found that EBV or LMP1 can enhance autophagic LC3 expression. Other factors may also contribute to the autophagic expression, especially in EBV‐negative cases, such as hypoxia, cell starvation or microenvironmental stress. Tumor cell hypoxia has been found to induce expression of vascular endothelial growth factor (VEGF) in HL cells along with increased tumor cell density. 39 , 40 Another possibility, which would be more attractive and reasonable, is that the EBV‐negative cases by conventional methods are really EBV‐infected when higher‐sensitive methods are used to detect EBV traces, 41 although the EBV viral load may be lower. Taken together with our present finding that EBV‐LMP1 upregulates autophagy, it seems possible that both EBV‐positive and EBV‐negative HL cases have been infected by EBV but a subset of HL tumor clone may largely loose the EBV genome over time, leading to a much lower viral load status and lower autophagy signaling. In addition, since HL tumor formation and progression is a chronic process, besides EBV, other factors such as tumor microenvironment (angiogenesis, immune cells) would also contribute to the dynamic changes of autophagic flux. Therefore, in clinical samples the EBV status detected by EBER‐ISH or LMP1 immunostaining may not be associated with LC3 autophagy expression.
Autophagy, a pivotal mechanism of cytoprotection activated by cellular stresses, also has been associated with cell death. 14 Autophagy may be involved in pathogenesis, prognostic prediction, and targeted therapies in cancers. 13 Higher levels of baseline autophagy LC3‐II in peripheral blood lymphocytes have been found to be a good prognosticator in patients with relapsed or refractory HL. 42 In a phase II trial of sorafenib, a multikinase inhibitor, baseline LC3‐II levels in responders were higher before treatment and significantly declined 30 days after therapy. 42 The findings suggest involvement of autophagy in response to tumor treatment and the idea of combined inhibition of autophagy and kinases. 14 Our study, instead, showed that overexpression of LC3 in tumor cells of clinical HL cases was uncommon and unassociated with patient outcomes. Nevertheless, the effective eradication of established LMP1‐positive HL xenografts in our study may further underlie the clinical application of autophagy inhibitors as a novel therapeutic strategy for patients with HL, especially for older patients and EBV‐positive cases. We have previously found that EBV‐positive HL cases are strongly associated with old age (>60 years), poorer prognosis, and cytokine hypersecretion. 18 Combined blockade of autophagy and the NFκB pathway may be also promising for recurrent and refractory HL cases. 43
CQ is an autophagy inhibitor. The addition of CQ blocked autophagic flux and hence increased levels of LC3‐II in HL cell lines. Bartolome et al 44 found that inhibition of autophagy by CQ makes the cells hypersensitive to ER stress‐mediated apoptosis via increased caspase‐3 and diminished Bcl‐2. It is intriguing that L428‐LMP1 HL cells showed partial resistance on CQ‐induced cell death in vitro but showed more efficacy on CQ eradication of existing xenografts in vivo. Two reasons may explain this: first, the inflammatory tumor microenvironment in vivo is different from the tumor cell‐only condition in vitro; second, the CQ dose for the in vivo treatment is quite high (60 mg/kg), more than that in another animal (dog) model (12.5 mg/kg). 45
The role of autophagy in HL growth is controversial. In HL cell lines (L428 and KM‐H2), histone deacetylase inhibition or estrogen receptor β activation induces autophagy and contributes to cell death. 46 , 47 On the other hand, HL cells require basal autophagy for growth, survival, and sustained metabolism. 29 We found that increased autophagy was associated with enhanced cell death and LMP1 or EBV rescued the cell death along with autophagy increments. It appears that the dual roles of autophagy in HL survival are context‐dependent. 48 Although the mechanisms underlying these paradoxical effects need to be further explored, our xenograft murine models support targeting autophagy as a useful new strategy for HL treatment. 29 Clinically, LC3 was interestingly expressed in all LD cases and absent in NLP and LRC cases. The reason underlying this finding is currently obscure. However, since HL subtype inherently bears prognostic significance, being poorer in LD and better in NLP and LRC, the expression of the LC3 autophagic signal in HL tumor cells may herald an aggressive behavior or reflect a cell‐poor tumor microenvironment. It has been found that overexpression of autophagy in cancer cells negatively affects sensitivity toward NK‐ and cytotoxic T‐lymphocyte‐mediated cell lysis through degradation of granzyme B and inhibition of the immunological synapse, which may further lead to lymphocyte depletion. 49
In conclusion, in a steady state we found that clinical HL tumor cells express a low level of autophagic activity, whereas EBV‐LMP1 upregulates autophagy signaling. Treatment with autophagy inhibitors or cytotoxic agents induces HL cell death, suggesting a potential strategy of targeting autophagy as a part of HL therapy.
DISCLOSURE
The authors declare no conflicts of interest.
Supporting information
Supplementary Material
ACKNOWLEDGMENTS
This work was supported by grants (MOST‐103‐2320‐B‐006‐020‐MY3, MOST 106‐2320‐B‐006‐037‐MY3 and 109‐2320‐B‐006‐045‐MY3) from the Ministry of Science and Technology, Taiwan to KC Chang. The authors are grateful to Dr Hao‐Ping Liu (Chang Gung University, Taoyuan, Taiwan) for providing the pEGFP‐LMP1 and pEGFP‐C3 vectors, Dr Mi‐Chia Ma (Department of Statistics, National Cheng Kung University, Tainan, Taiwan) for advice about statistical interpretations, Dr Kenzo Takada (Department of Tumor Virology, Institute for Genetic Medicine, Hokkaido University, Sapporo, Japan) for providing the Akata‐EGFP EBV, and the Taiwan Blood Services Foundation, Tainan Blood Center for providing packed white blood cells. The authors are also grateful to Dr Chih‐Peng Chang (Department of Microbiology and Immunology, National Cheng Kung University, Tainan, Taiwan) for critical review and valuable advice.
Lin H‐C, Chang Y, Chen R‐Y, et al. Epstein‐Barr virus latent membrane protein‐1 upregulates autophagy and promotes viability in Hodgkin lymphoma: Implications for targeted therapy. Cancer Sci. 2021;112:1589–1602. 10.1111/cas.14833
Yao Chang, Ruo‐Yu Chen, and Liang‐Yi Hung contributed equally to this work.
Contributor Information
Po‐Min Chiang, Email: pchiang@mail.ncku.edu.tw.
Kung‐Chao Chang, Email: changkc@mail.ncku.edu.tw.
REFERENCES
- 1. Diehl V, Thomas RK, Re D. Part II: Hodgkin's lymphoma–diagnosis and treatment. Lancet Oncol. 2004;5(1):19‐26. [DOI] [PubMed] [Google Scholar]
- 2. Kuppers R. The biology of Hodgkin's lymphoma. Nat Rev Cancer. 2009;9(1):15‐27. [DOI] [PubMed] [Google Scholar]
- 3. Ushmorov A, Leithauser F, Sakk O, et al. Epigenetic processes play a major role in B‐cell‐specific gene silencing in classical Hodgkin lymphoma. Blood. 2006;107(6):2493‐2500. [DOI] [PubMed] [Google Scholar]
- 4. Piris MA, Medeiros LJ, Chang KC. Hodgkin lymphoma: a review of pathological features and recent advances in pathogenesis. Pathology. 2020;52(1):154‐165. [DOI] [PubMed] [Google Scholar]
- 5. Schroder M, Kaufman RJ. The mammalian unfolded protein response. Annu Rev Biochem. 2005;74:739‐789. [DOI] [PubMed] [Google Scholar]
- 6. Wang HC, Chang WT, Chang WW, et al. Hepatitis B virus pre‐S2 mutant upregulates cyclin A expression and induces nodular proliferation of hepatocytes. Hepatology. 2005;41(4):761‐770. [DOI] [PubMed] [Google Scholar]
- 7. Chang KC, Chen PC, Chen YP, Chang Y, Su IJ. Dominant expression of survival signals of endoplasmic reticulum stress response in Hodgkin lymphoma. Cancer Sci. 2011;102(1):275‐281. [DOI] [PubMed] [Google Scholar]
- 8. Ravikumar B, Sarkar S, Davies JE, et al. Regulation of mammalian autophagy in physiology and pathophysiology. Physiol Rev. 2010;90(4):1383‐1435. [DOI] [PubMed] [Google Scholar]
- 9. Ding WX, Yin XM. Sorting, recognition and activation of the misfolded protein degradation pathways through macroautophagy and the proteasome. Autophagy. 2008;4(2):141‐150. [DOI] [PubMed] [Google Scholar]
- 10. Mizushima N, Yoshimori T, Ohsumi Y. The role of Atg proteins in autophagosome formation. Annu Rev Cell Dev Biol. 2011;27:107‐132. [DOI] [PubMed] [Google Scholar]
- 11. Loos B, du Toit A, Hofmeyr JH. Defining and measuring autophagosome flux‐concept and reality. Autophagy. 2014;10(11):2087‐2096. [DOI] [PMC free article] [PubMed] [Google Scholar]
- 12. Takamura A, Komatsu M, Hara T, et al. Autophagy‐deficient mice develop multiple liver tumors. Genes Dev. 2011;25(8):795‐800. [DOI] [PMC free article] [PubMed] [Google Scholar]
- 13. Levy JMM, Towers CG, Thorburn A. Targeting autophagy in cancer. Nat Rev Cancer. 2017;17(9):528‐542. [DOI] [PMC free article] [PubMed] [Google Scholar]
- 14. Pierdominici M, Barbati C, Vomero M, et al. Autophagy as a pathogenic mechanism and drug target in lymphoproliferative disorders. FASEB J. 2014;28(2):524‐535. [DOI] [PubMed] [Google Scholar]
- 15. Yamamoto K, Venida A, Yano J, et al. Autophagy promotes immune evasion of pancreatic cancer by degrading MHC‐I. Nature. 2020;581(7806):100‐105. [DOI] [PMC free article] [PubMed] [Google Scholar]
- 16. Ma XH, Piao SF, Dey S, et al. Targeting ER stress‐induced autophagy overcomes BRAF inhibitor resistance in melanoma. J Clin Invest. 2014;124(3):1406‐1417. [DOI] [PMC free article] [PubMed] [Google Scholar]
- 17. Liu HP, Wu CC, Chang YS. PRA1 promotes the intracellular trafficking and NF‐kappaB signaling of EBV latent membrane protein 1. Embo J. 2006;25(17):4120‐4130. [DOI] [PMC free article] [PubMed] [Google Scholar]
- 18. Chang KC, Chen PC, Chang Y, et al. Epstein‐Barr virus latent membrane protein‐1 up‐regulates cytokines and correlates with older age and poorer prognosis in Hodgkin lymphoma. Histopathology. 2017;70(3):442‐455. [DOI] [PubMed] [Google Scholar]
- 19. Chang Y, Tung CH, Huang YT, Lu J, Chen JY, Tsai CH. Requirement for cell‐to‐cell contact in Epstein‐Barr virus infection of nasopharyngeal carcinoma cells and keratinocytes. J Virol. 1999;73(10):8857‐8866. [DOI] [PMC free article] [PubMed] [Google Scholar]
- 20. Kuppers R, Klein U, Schwering I, et al. Identification of Hodgkin and Reed‐Sternberg cell‐specific genes by gene expression profiling. J Clin Invest. 2003;111(4):529‐537. [DOI] [PMC free article] [PubMed] [Google Scholar]
- 21. Dai YH, Hung LY, Chen RY, Lai CH, Chang KC. ON 01910.Na inhibits growth of diffuse large B‐cell lymphoma by cytoplasmic sequestration of sumoylated C‐MYB/TRAF6 complex. Transl Res. 2016;175:129‐143.e13. [DOI] [PubMed] [Google Scholar]
- 22. Mandenius CF. Advances in Micro‐Bioreactor Design for Organ Cell Studies. Basel, Switzerland: MDPI AG; 2018:168. [DOI] [PMC free article] [PubMed] [Google Scholar]
- 23. Pelossof R, Fairchild L, Huang CH, et al. Prediction of potent shRNAs with a sequential classification algorithm. Nat Biotechnol. 2017;35(4):350‐353. [DOI] [PMC free article] [PubMed] [Google Scholar]
- 24. Chen PC, Hsueh YW, Lee YH, Tsai HW, Tsai KJ, Chiang PM. FGF primes angioblast formation by inducing ETV2 and LMO2 via FGFR1/BRAF/MEK/ERK. Cell Mol Life Sci. 2020. [Epub ahead of print]. 10.1007/s00018-020-03630-8 [DOI] [PMC free article] [PubMed] [Google Scholar]
- 25. Swerdlow SH, Campo E, Harris NL, et al. WHO Classification of Tumours of Haematopoietic and Lymphoid Tissues (Revised 4th edition). Lyon: IARC; 2017. [Google Scholar]
- 26. Koukourakis MI, Kalamida D, Giatromanolaki A, et al. Autophagosome proteins LC3A, LC3B and LC3C have distinct subcellular distribution kinetics and expression in cancer cell lines. PLoS One. 2015;10(9):e0137675. [DOI] [PMC free article] [PubMed] [Google Scholar]
- 27. Chang KC, Khen NT, Jones D, Su IJ. Epstein‐Barr virus is associated with all histological subtypes of Hodgkin lymphoma in Vietnamese children with special emphasis on the entity of lymphocyte predominance subtype. Hum Pathol. 2005;36(7):747‐755. [DOI] [PubMed] [Google Scholar]
- 28. Chang KC, Chen PC, Jones D, Su IJ. Changing patterns in the frequency of Hodgkin lymphoma subtypes and Epstein‐Barr virus association in Taiwan. Cancer Sci. 2008;99(2):345‐349. [DOI] [PMC free article] [PubMed] [Google Scholar]
- 29. Birkenmeier K, Moll K, Newrzela S, Hartmann S, Drose S, Hansmann ML. Basal autophagy is pivotal for Hodgkin and Reed‐Sternberg cells' survival and growth revealing a new strategy for Hodgkin lymphoma treatment. Oncotarget. 2016;7(29):46579‐46588. [DOI] [PMC free article] [PubMed] [Google Scholar]
- 30. Yamasaki M, Yuasa T, Uehara S, et al. Improvement of renal function by changing the bone‐modifying agent from zoledronic acid to denosumab. Int J Clin Oncol. 2016;21(6):1191‐1195. [DOI] [PMC free article] [PubMed] [Google Scholar]
- 31. Tacar O, Sriamornsak P, Dass CR. Doxorubicin: an update on anticancer molecular action, toxicity and novel drug delivery systems. J Pharm Pharmacol. 2013;65(2):157‐170. [DOI] [PubMed] [Google Scholar]
- 32. Boll B, Plutschow A, Burkle C, et al. Doxorubicin, vinblastine, dacarbazine and lenalidomide for older Hodgkin lymphoma patients: final results of a German Hodgkin Study Group (GHSG) phase‐I trial. Br J Haematol. 2019;185(1):42‐52. [DOI] [PubMed] [Google Scholar]
- 33. Vockerodt M, Morgan S, Kuo M, et al. The Epstein‐Barr virus oncoprotein, latent membrane protein‐1, reprograms germinal centre B cells towards a Hodgkin's Reed‐Sternberg‐like phenotype. J Pathol. 2008;216:83‐92. [DOI] [PubMed] [Google Scholar]
- 34. Lee DY, Sugden B. The latent membrane protein 1 oncogene modifies B‐cell physiology by regulating autophagy. Oncogene. 2008;27(20):2833‐2842. [DOI] [PubMed] [Google Scholar]
- 35. Thorley‐Lawson DA, Gross A. Persistence of the Epstein‐Barr virus and the origins of associated lymphomas. N Engl J Med. 2004;350(13):1328‐1337. [DOI] [PubMed] [Google Scholar]
- 36. Kieser A, Sterz KR. The latent membrane protein 1 (LMP1). Curr Top Microbiol Immunol. 2015;391:119‐149. [DOI] [PubMed] [Google Scholar]
- 37. Copetti T, Bertoli C, Dalla E, Demarchi F, Schneider C. p65/RelA modulates BECN1 transcription and autophagy. Mol Cell Biol. 2009;29(10):2594‐2608. [DOI] [PMC free article] [PubMed] [Google Scholar]
- 38. Kroemer G, Marino G, Levine B. Autophagy and the integrated stress response. Mol Cell. 2010;40(2):280‐293. [DOI] [PMC free article] [PubMed] [Google Scholar]
- 39. Doussis‐Anagnostopoulou IA, Talks KL, Turley H, et al. Vascular endothelial growth factor (VEGF) is expressed by neoplastic Hodgkin‐Reed‐Sternberg cells in Hodgkin's disease. J Pathol. 2002;197(5):677‐683. [DOI] [PubMed] [Google Scholar]
- 40. Khnykin D, Troen G, Berner JM, Delabie J. The expression of fibroblast growth factors and their receptors in Hodgkin's lymphoma. J Pathol. 2006;208(3):431‐438. [DOI] [PubMed] [Google Scholar]
- 41. Mundo L, Del Porro L, Granai M, et al. Frequent traces of EBV infection in Hodgkin and non‐Hodgkin lymphomas classified as EBV‐negative by routine methods: expanding the landscape of EBV‐related lymphomas. Mod Pathol. 2020;33(12):2407‐2421. [DOI] [PMC free article] [PubMed] [Google Scholar]
- 42. Guidetti A, Carlo‐Stella C, Locatelli SL, et al. Phase II study of sorafenib in patients with relapsed or refractory lymphoma. Br J Haematol. 2012;158(1):108‐119. [DOI] [PubMed] [Google Scholar]
- 43. Bryant KL, Stalnecker CA, Zeitouni D, et al. Combination of ERK and autophagy inhibition as a treatment approach for pancreatic cancer. Nat Med. 2019;25(4):628‐640. [DOI] [PMC free article] [PubMed] [Google Scholar]
- 44. Bartolome A, Guillen C, Benito M. Autophagy plays a protective role in endoplasmic reticulum stress‐mediated pancreatic beta cell death. Autophagy. 2012;8(12):1757‐1768. [DOI] [PMC free article] [PubMed] [Google Scholar]
- 45. Barnard RA, Wittenburg LA, Amaravadi RK, Gustafson DL, Thorburn A, Thamm DH. Phase I clinical trial and pharmacodynamic evaluation of combination hydroxychloroquine and doxorubicin treatment in pet dogs treated for spontaneously occurring lymphoma. Autophagy. 2014;10(8):1415‐1425. [DOI] [PMC free article] [PubMed] [Google Scholar]
- 46. Klein JM, Henke A, Sauer M, et al. The histone deacetylase inhibitor LBH589 (panobinostat) modulates the crosstalk of lymphocytes with Hodgkin lymphoma cell lines. PLoS One. 2013;8(11):e79502. [DOI] [PMC free article] [PubMed] [Google Scholar]
- 47. Pierdominici M, Maselli A, Locatelli SL, et al. Estrogen receptor beta ligation inhibits Hodgkin lymphoma growth by inducing autophagy. Oncotarget. 2017;8(5):8522‐8535. [DOI] [PMC free article] [PubMed] [Google Scholar]
- 48. Zhang H. Targeting autophagy in lymphomas: a double‐edged sword? Int J Hematol. 2018;107(5):502‐512. [DOI] [PubMed] [Google Scholar]
- 49. Folkerts H, Hilgendorf S, Vellenga E, Bremer E, Wiersma VR. The multifaceted role of autophagy in cancer and the microenvironment. Med Res Rev. 2019;39(2):517‐560. [DOI] [PMC free article] [PubMed] [Google Scholar]
Associated Data
This section collects any data citations, data availability statements, or supplementary materials included in this article.
Supplementary Materials
Supplementary Material