

Abstract
Traditional observational studies have reported a positive association between higher body mass index (BMI) and the risk of colorectal cancer (CRC). However, evidence from other approaches to pursue the causal relationship between BMI and CRC is sparse. A two‐sample Mendelian randomization (MR) study was undertaken using 68 single nucleotide polymorphisms (SNPs) from the Japanese genome‐wide association study (GWAS) and 654 SNPs from the GWAS catalogue for BMI as sets of instrumental variables. For the analysis of SNP‐BMI associations, we undertook a meta‐analysis with 36 303 participants in the Japanese Consortium of Genetic Epidemiology studies (J‐CGE), comprising normal populations. For the analysis of SNP‐CRC associations, we utilized 7636 CRC cases and 37 141 controls from five studies in Japan, and undertook a meta‐analysis. Mendelian randomization analysis of inverse‐variance weighted method indicated that a one‐unit (kg/m2) increase in genetically predicted BMI was associated with an odds ratio of 1.13 (95% confidence interval, 1.06‐1.20; P value <.001) for CRC using the set of 68 SNPs, and an odds ratio of 1.07 (1.03‐1.11, 0.001) for CRC using the set of 654 SNPs. Sensitivity analyses robustly showed increased odds ratios for CRC for every one‐unit increase in genetically predicted BMI. Our MR analyses strongly support the evidence that higher BMI influences the risk of CRC. Although Asians are generally leaner than Europeans and North Americans, avoiding higher BMI seems to be important for the prevention of CRC in Asian populations.
Keywords: Asia, body mass index, colorectal cancer, epidemiology, Mendelian randomization
Traditional observational studies reported a positive association between higher body mass index (BMI) and colorectal cancer (CRC) risk. However, these studies suffer from biases such as reverse causality and confounding. This Mendelian randomization study consistently showed that the genetically predicted higher BMI was associated with an increased risk of CRC in Japanese populations.

Abbreviations
- BBJ
Biobank Japan
- BMI
body mass index
- CRC
colorectal cancer
- GWAS
genome‐wide association study
- HERPACC
Hospital‐based Epidemiologic Research Program at Aichi Cancer Centre
- IVW
inverse‐variance weighted
- J‐CGE
Japanese Consortium of Genetic Epidemiology studies
- J‐MICC
Japan Multi‐Institutional Collaborative Cohort Study
- JPHC
Japan Public Health Centre‐based Prospective Study
- MR
Mendelian randomization
- MR‐PRESSO
Mendelian randomization pleiotropy residual sum and outlier
- NAGANO
NAGANO hospital‐based study
- SNP
single nucleotide polymorphism
1. INTRODUCTION
According to a 2018 worldwide report, CRC represents 10.2% of cancer incidence and 9.2% of cancer mortality. 1 The GLOBOCAN database 2 shows that the number of new cases and deaths from CRC are increasing rapidly, such that it is predicted to exceed 2.2 million new cases and 1.1 million deaths by 2030. 3 To control this increasing disease burden, it is essential to explore approaches for the prevention of CRC.
To date, numerous observational studies have reported an association between higher BMI and increased CRC risk. 4 However, these traditional observational studies possess certain inherent limitations like reverse causality and residual confounding. For example, early life environments, 5 which could influence both adult BMI and CRC risk, were not adjusted in any of these studies, possibly leading to residual confounding. Moreover, even with information on confounders, observational studies might yield biased results, as covariate adjustments need to be done with considerable caution. Although socioeconomic status and smoking behavior would be confounders of the BMI and CRC association, they could also act as mediators in the association; higher BMI could influence CRC through employment status 6 or through smoking behavior. 7 In such a case, adjusting for both factors fails to estimate the total effect of BMI on CRC.
To overcome these limitations, we used the MR analysis, which is currently gaining popularity. Mendelian randomization analysis regards gene variants as instrumental variables and exploits Mendel’s second law or the law of independent assortment. 8 The random allocation of genotypes at conception mimics natural, randomized, controlled study conditions, thus allowing observational studies to overcome biases such as residual confounding and reverse causality. 9 Although BMI is time‐dependent and could decrease during the early stages of cancer, 4 the use of BMI‐associated gene variants as a proxy for BMI can help reflect the typical lifetime BMI and counteract reverse causality and misclassification issues arising from one‐time point measurements.
Recent MR studies have suggested a positive association between BMI and CRC in Europeans. 10 , 11 However, it is unclear if this association can be applied to other ethnicities like Asians, because the allele frequencies of SNPs vary widely across ethnicities, 12 and the prevalence and features of obesity are different across countries. Generally, Asians are leaner than Europeans and North Americans. 13 However, they possess higher body fat for given body weight compared to White populations. 14 Furthermore, Asians tend to develop diabetes at lower BMI values compared to Europeans. 15 This could be attributed to their stronger glucose intolerance for a given BMI compared to other populations. 16 Therefore, the interpretation of each BMI value and the biological mechanisms of obesity might not be the same across all populations. These heterogeneities between ethnicities warrant the need for an Asian population‐specific MR study to evaluate the association between BMI and CRC.
We recently established the J‐CGE, comprising normal Japanese populations. By using the data obtained from this large consortium and combining it with publicly available summary statistics‐level data, 17 we undertook the two‐sample MR analyses and examined whether a genetically predicted higher BMI increased the CRC risk in Japanese populations.
2. MATERIALS AND METHODS
Using two sets of instrumental variables, we carried out two‐sample MR analyses. In the two‐sample approach, SNPs of instrumental variables associated with exposure are examined in one dataset, and the associations of these SNPs with CRC are investigated in a separate dataset. The study design is depicted in Figure 1.
FIGURE 1.
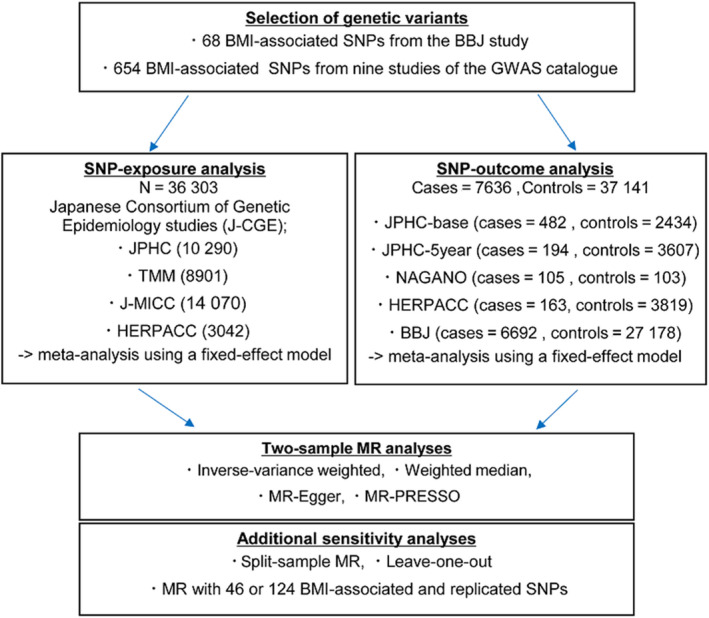
Study design. BBJ, Biobank Japan; BMI, body mass index; J‐MICC, Japan Multi‐Institutional Collaborative Cohort Study; JPHC, Japan Public Health Centre‐based Prospective Study; JPHC‐5 year, participants who did not respond to the baseline survey but responded to the 5‐year follow‐up survey in JPHC; JPHC‐base, responders to the baseline survey in JPHC; MR, Mendelian randomization; NAGANO, NAGANO hospital‐based study; SNP, single nucleotide polymorphism; TMM, Tohoku Medical Megabank Community‐Based Cohort Study
The MR analysis is a method that uses genetic variables, like SNPs, as instrumental variables. To obtain unbiased results, the instrumental variables used in the analysis must satisfy three assumptions: (a) the instrumental variable must be associated with the exposure (the relevance assumption), (b) the instrumental variable must not be associated with any confounder of the exposure‐outcome association (the independent assumption) and, (c) given the exposure and confounders, the instrumental variable must be conditionally independent of the outcome (the exclusion restriction assumption). 8 , 18 Concisely, the second and third assumptions indicate that no horizontal pleiotropy must occur. Pleiotropy is the phenomenon in which a single SNP affects multiple phenotypes. 19 In the MR framework, pleiotropy includes two types, vertical and horizontal. 18 , 20 In vertical pleiotropy, a single SNP influences the exposure and the other phenotypes in the pathway through exposure to the outcome (eg biomarkers); it is generally not problematic. In contrast, in horizontal pleiotropy, a single SNP not only influences the exposure but also influences phenotypes in other pathways without exposure to the outcome; it is a violation of the second and third assumptions. As the ability of SNPs to cause pleiotropy is not verifiable, we used several MR methods to relax these assumptions and assess the robustness.
2.1. Data source for the selection of BMI‐associated SNPs
In this study, we used two sets of SNPs as instrumental variables. First, we selected BMI‐associated SNPs from a previous Japanese GWAS reported by the BBJ project. 21 , 22 Among the SNPs reported, we identified 68 SNPs that had a P value of less than 5.0 × 10⁻⁸ at the discovery GWAS in the Japanese population (Table S1).
Second, on 29 July 2019, we undertook a search for the BMI‐associated SNPs in the GWAS catalogue (https://www.ebi.ac.uk/gwas/) comprising all ethnic populations in strict criteria. Details of this selection is provided in Figure S1. Finally, we identified 654 SNPs (Table S2) from nine studies (Table S3), and used them in our study.
The coefficients (effect size of the SNP on BMI) of all selected SNPs were obtained from previous studies and compared with our coefficients. We encountered certain studies where all the obtained data were not reported in the manuscript. In such cases, we extracted the data that was publicly available on their websites. Furthermore, regardless of the statistical significance of the SNP‐BMI associations in the J‐CGE, all selected SNPs were included in sets of instrumental variables to overcome biases from false negatives arising from insufficient power 20 and from overfitting. 23
2.2. Data source for the estimations of SNP effect on exposure
For the analysis of SNP‐BMI associations, we used study data from the J‐CGE and undertook a meta‐analysis with 36 303 subjects. The J‐CGE consisted of Japanese population‐based and hospital‐based studies: the Tohoku Medical Megabank Community‐Based Cohort (TMM) Study (n = 8901), the JPHC Study (n = 10 290), the J‐MICC Study (n = 14 070), and the HERPACC (n = 3042). The data obtained from these studies are summarized below the same protocol. In each study, the BMI was assessed at baseline through health check‐ups (83%) or self‐administered questionnaires. Although the question style differed in each study, the BMI was calculated as follows: weight (in kilograms) divided by the square of the height (in meters). All studies were approved by the respective institutional review boards. The characteristics of each study are described in Table S4.
2.3. Data source for the estimations of SNP effect on outcome
For the analysis of SNP‐CRC associations, we used individual‐level data from the JPHC study, the NAGANO study, and the HERPACC study, and publicly available summary statistics‐level data from a previous GWAS reported by the BBJ project. 17 Briefly, these studies were all based on individuals of Japanese ancestry and included cases and controls from the JPHC case‐cohort study‐base (JPHC‐base; 482 cases and 2434 controls), the JPHC case‐cohort study‐5 year (JPHC‐5 year; 194 cases and 3607 controls), the NAGANO study (105 cases and 103 controls), the HERPACC study (163 cases and 3819 controls), and the BBJ study (6692 cases and 27 178 controls). All studies were approved by the respective institutional review boards. For each study, the characteristics and ascertainment of CRC are described in Table S5.
2.4. Statistical analysis
Meta‐analysis was carried out on the study‐level data and publicly available summary statistics‐level data using the IVW method in a fixed‐effect model, using META (version 1.7) or METAL, 24 and the overall SNP‐exposure or SNP‐outcome effect (coefficient) was calculated. Methods of association analysis and information on DNA‐typing based on individual‐level data are listed in Table S6.
We undertook the two‐sample MR analyses to assess the association between BMI and CRC risk, using the MR‐Base platform. 25 We used the IVW method as the main analysis to combine the ratio estimates of all BMI‐associated SNPs on CRC, based on a fixed‐effects model. 26 As our sets of instrumental variables consist of many SNPs, certain invalid SNPs that may not meet the MR assumption might have also been included in them. Therefore, to assess the robustness and to relax the assumptions, we used several MR methods: the funnel plot analysis, the leave‐one‐out analysis, and three other MR methods including weighted median, 27 MR‐Egger, 28 and MR‐PRESSO. 29 The weighted median method provides robust results even when the instruments include 50% invalid SNPs. The MR‐Egger and MR‐PRESSO methods examine the violation of the assumptions by testing the intercept of regression or the outlier SNPs.
Additionally, we also carried out split‐sample MR analyses using the aforementioned methods for sensitivity analyses. Generally, two‐sample MR analysis identifies SNPs associated with exposure in one dataset and investigates the association of these SNPs with the outcome in a separate dataset, to reduce the bias toward conventional observational analysis results 30 , 31 ; however, our exposure and outcome datasets showed slight overlap of samples. Therefore, we used the split‐sample MR analyses as the sensitivity analyses to remove sample overlap bias. 32 , 33 Our split‐sample MR design is depicted in Figure S2.
Furthermore, for additional sensitivity analyses, we excluded the unreplicated SNPs from the set of 68 or 654 selected SNPs and conducted MR analyses using 46 or 124 replicated SNPs. We did not utilize estimates from previous GWAS reports of BMI‐associated SNPs because there is a possibility of the overestimation of SNP‐BMI associations (called winner’s curse) in the GWAS discovery stage, which could lead to the underestimation of MR results. 34 , 35 However, analysis of the SNP effect on BMI in the normal Japanese populations of J‐CGE revealed that some of the SNPs used as instrumental variables were not significant. Therefore, we carried out analyses with the replication criteria, using the same directions of SNP‐exposure effects between the J‐CGE and previous studies, and P value less than .05 in the J‐CGE.
Power calculations for MR analysis are presented in Table S7, suggesting that this study possessed the power to detect the association. Thresholds for nominal significance were set at a P value less than .05. Statistical analyses were carried out using SAS (version 9.4) or R (version 3.5.2), with the TwoSampleMR and MR‐PRESSO packages.
3. RESULTS
3.1. Participant characteristics
The characteristics of the 36 303 participants of the J‐CGE used in the SNP‐exposure analysis are reported in Table S8. The proportion of female participants and the mean age ranged from 50.6% to 65.8% and 52.1 to 60.7 years, respectively. The mean BMI was between 22.7 and 23.8 kg/m2.
The characteristics of the participants from the five studies included in the SNP‐outcome analysis are reported in Table S9. There were 37 141 controls and 7636 CRC cases. The proportion of female participants and the mean age ranged from 37.0% to 62.3% and 52.1 to 66.9 years, respectively. Except for the data obtained from the publicly available summary statistics, the mean BMI was between 22.7 and 23.8 kg/m2 in cases and 22.7 and 23.7 kg/m2 in controls.
3.2. Associations of SNP‐BMI and SNP‐CRC
Of the 68 BMI‐associated SNPs selected from a previous Japanese GWAS, seven SNPs replicated at genome‐wide significance levels (P value less than 5.0 × 10⁻⁸), 19 SNPs reached the Bonferroni‐corrected significance level (P value less than 7.35 × 10⁻⁴), and 46 SNPs reached nominal significance association levels in our SNP‐exposure analysis of the J‐CGE (Table S10). Comparison of the direction of effect of our SNP‐exposure analysis and the previous GWAS revealed a consistency in the effect direction for almost all SNPs (Figure S3).
Of the 654 BMI‐associated SNPs from the GWAS catalogue of all ethnic populations, seven SNPs replicated at genome‐wide significant levels, 18 SNPs attained the Bonferroni‐corrected significance level (P value less than 7.64 × 10⁻⁵), and 131 SNPs attained nominal significant levels in our SNP‐exposure analysis of the J‐CGE (Table S11). Comparison of the direction of effect of our SNP‐exposure analysis and the GWAS catalogue revealed a high consistency between them (Figure S4).
In the J‐CGE, the total explained variance in BMI was approximately 2.0% on a set of 68 SNPs and approximately 5.0% on the set of 654 SNPs (Tables S1 and S2).
The SNP‐CRC associations estimated by using a fixed‐effect meta‐analysis of five studies are shown in Tables S10 and S11.
3.3. Association between BMI and CRC in the MR framework
In the main MR analysis using the IVW method on 68 SNPs, a one‐unit (kg/m2) increase in BMI was associated with an odds ratio of 1.13 (95% confidence interval, 1.06‐1.20) for CRC (Table 1 and Figure 2). Sensitivity analyses consistently showed increased odds ratios for CRC for every one‐unit (kg/m2) increase in BMI (Table 1 and Figure 2). The odds ratios from the MR‐Egger and weighted median were 1.11 (0.99‐1.24) and 1.17 (1.07‐1.28), respectively. The MR‐Egger intercept P value was .72. Additionally, no outlier was detected while using the MR‐PRESSO method (Table S12), thus suggesting the absence of pleiotropic effect. Moreover, this symmetrical funnel plot of one divided by the standard error of the MR effects against the MR effects of 68 individual SNPs indicated the absence of heterogeneity between the MR effects of each SNP and balanced pleiotropy (Figure S5).
TABLE 1.
Mendelian randomization (MR) analyses of body mass index (BMI) and colorectal cancer (CRC) risk
| MR methods | 68 SNPs | 654 SNPs | ||||||||||
|---|---|---|---|---|---|---|---|---|---|---|---|---|
| Two‐sample MR | Split‐sample MR | Two‐sample MR | Split‐sample MR | |||||||||
| OR a | (95% CI) | P value | OR a | (95% CI) | P value | OR a | (95% CI) | P value | OR a | (95% CI) | P value | |
| IVW | 1.13 | (1.06‐1.20) | <.001 | 1.10 | (1.04‐1.17) | .001 | 1.07 | (1.03‐1.11) | .001 | 1.06 | (1.02‐1.09) | .001 |
| MR‐Egger | 1.11 | (0.99‐1.24) | .07 | 1.13 | (1.03‐1.25) | .012 | 1.08 | (1.02‐1.15) | .013 | 1.04 | (0.99‐1.09) | .157 |
| Weighted median | 1.17 | (1.07‐1.28) | <.001 | 1.16 | (1.07‐1.26) | <.001 | 1.11 | (1.04‐1.18) | .001 | 1.09 | (1.04‐1.14) | <.001 |
| MR‐PRESSO | 1.13 | (1.06‐1.20) | <.001 | NA | 1.07 | (1.03‐1.11) | .001 | NA | ||||
| MR‐Egger test | Intercept (95% CI) | P value | Intercept (95% CI) | P value | Intercept (95% CI) | P value | Intercept (95% CI) | P value | ||||
|---|---|---|---|---|---|---|---|---|---|---|---|---|
| Intercept test | 0.002 | (−0.009‐0.012) | .72 | −0.004 | (−0.014‐0.006) | .45 | −0.001 | (−0.004‐0.002) | .68 | 0.002 | (−0.001‐0.005) | .27 |
Abbreviations: CI, confidence interval; IVW, inverse variance weighted; MR‐Egger, Mendelian randomization‐Egger; MR‐PRESSO, Mendelian randomization pleiotropy residual sum and outlier; NA, not applicable; SNP, single nucleotide polymorphism.
Odds ratio (OR) are shown per a one‐unit (kg/m2) increase in BMI.
FIGURE 2.
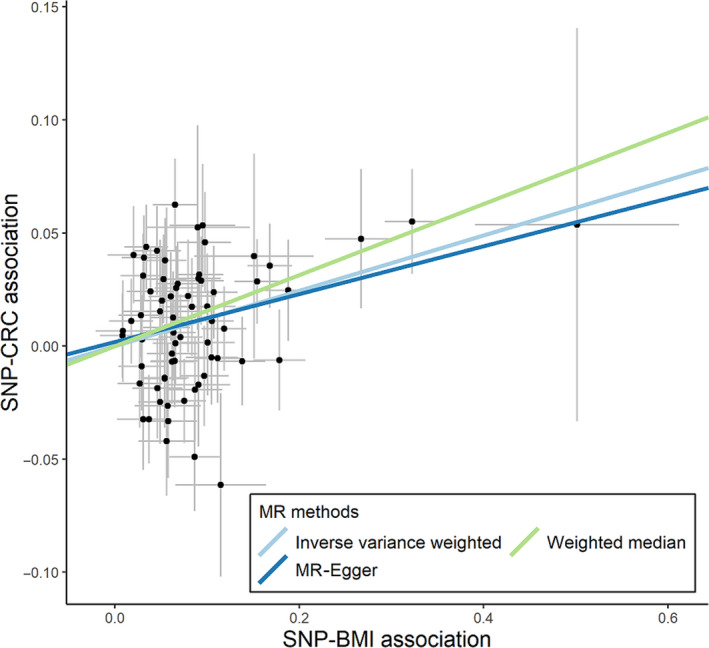
Scatter plot of single nucleotide polymorphism (SNP)‐body mass index (BMI) associations against SNP‐colorectal cancer (CRC) associations using 68 SNPs. MR, Mendelian randomization
Mendelian randomization analyses of 654 SNPs showed a slightly weaker association between BMI and CRC (IVW, 1.07 [1.03‐1.11]; MR‐Egger, 1.08 [1.02‐1.15]; Egger‐intercept P value, .68; weighted median, 1.11 [1.04‐1.18]; MR‐PRESSO, 1.07 [1.03‐1.11]; Tables 1 and S12, Figure 3). The funnel plot showed a roughly symmetrical distribution (Figure S5), suggesting little evidence of estimates biased by pleiotropy.
FIGURE 3.
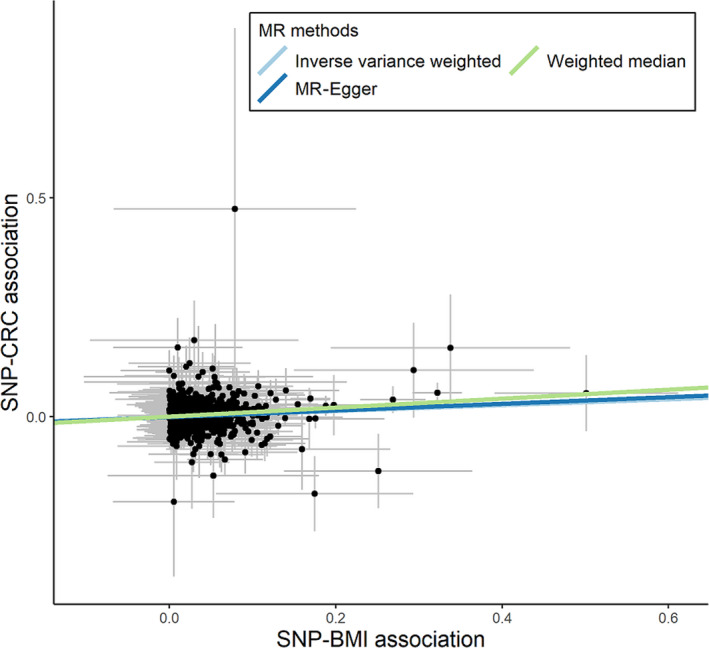
Scatter plot of single nucleotide polymorphism (SNP)‐body mass index (BMI) associations against SNP‐colorectal cancer (CRC) associations using 654 SNPs. MR, Mendelian randomization
Similar results were observed in the spilt‐sample MR analyses, which were used to avoid sample overlap between the exposure and outcome datasets (Tables 1 and S13‐S16). As the split‐sample analyses yielded almost identical results, sample overlap bias was not a concern in this study. Furthermore, the application of restrictions to 46 or 124 replicated SNPs also showed similar results (Table S17 and Figure S6).
Finally, we assessed the impact of a potential outlier SNP using the leave‐one‐out analysis. We excluded one SNP from the instrument variables and applied the IVW method in turn. All analyses on the 68 SNPs and 654 SNPs showed consistent results (Tables S18 and S19).
4. DISCUSSION
In this MR study, we showed that genetically predicted higher BMI was associated with an increased risk of CRC, using individual‐level, study‐level, and publicly available summary statistics‐level data in Japanese populations. The results remained consistent despite strict variant selection, and across a variety of sensitivity analyses. To our best knowledge, this is the first study to provide evidence of a link between BMI and CRC risk using the MR framework in an Asian population. Importantly, the identified positive association between higher BMI and CRC risk is in line with the findings of previous MR studies in Europeans. 10 , 11 In contrast to the differences in the distributions of SNPs 12 and BMI 36 across ethnicities, our findings seem to suggest that the MR estimates for the BMI‐CRC association remain consistent across different ethnicities. Moreover, as this association was observed in a population of relatively low mean BMI, current findings could be important for the prevention of CRC.
The largest systematic review of seven million participants showed that the relative risk of a one‐unit increase in BMI was 1.03 (95% confidence interval, 1.03‐1.04). 37 With respect to the Asian populations, a prospective observational study of 300 000 Japanese participants reported that the adjusted hazard ratio for a one‐unit increase in BMI was 1.03 (1.02‐1.04) for male participants and 1.02 (1.00‐1.03) for female participants. 38 Nevertheless, conventional observational studies have inherent limitations, such as residual confounding and reverse causation. Additionally, evidence from other approaches to pursue the causal relationship between BMI and CRC is sparse. Here, to evaluate that higher BMI influences increased risk of CRC, we undertook an MR study, which resulted in the positive association. The magnitude of the association, identified through our MR study (odds ratio 1.13), was larger than that observed in conventional observational studies (odds ratio 1.03). 37 This difference of magnitude could be explained by the fact that genetically determined BMI is likely to reflect lifelong exposure. 39 , 40 In fact, there is empirical evidence showing that the magnitude of the association for lifelong exposure to the risk of disease estimated by the MR approach is larger than that for the short‐term exposure beginning later in life estimated by the randomized controlled trial. 41 Considering the differences in the timing and duration of the exposure between the MR approach and other study designs, our MR estimates might have been inflated, to some extent, compared with the real‐world effects. Although we believe our sets of instrumental variables satisfy three MR assumptions, another possibility is an overestimation due to the violation of the assumptions.
For the relevance assumption, only a part of the SNPs used as instrumental variables reached significant levels. However, as the explained variance in BMI in the study population was 2.0% and 5.0% on a set of 68 and 654 SNPs, respectively, we realized that our sets of SNPs were related to the BMI. For the independent assumption, the population structure could be a confounding factor in the association between BMI and CRC. 9 Nevertheless, as the subjects were restricted to the Japanese population and our SNP‐BMI and SNP‐CRC analyses were adjusted for it using principal components, the population structure is unlikely to distort the results. For the exclusion restriction assumption, multiple BMI‐associated SNPs affect other traits, a condition termed as horizontal pleiotropy. However, the results of MR‐PRESSO and the weighted median method consistently showed the association. Furthermore, MR‐Egger, the intercept of which could indicate the overall pleiotropy in the same way as small study bias in meta‐analysis, 28 did not detect pleiotropy. Although each SNP might show a pleiotropy effect, in our sets of instrumental variables, the overall pleiotropy could be balanced and not introduce any bias on our estimates. 28 , 42 In addition, the symmetrical distribution in the funnel plot supported balanced pleiotropy (Figure S5). For the study design, although the bias arising from slight sample overlap between the analyses of SNP‐BMI and SNP‐CRC associations could lead to overestimation, 31 our results were robust for biases arising from the violation of the MR assumption or design.
A previous MR study from Europe showed the odds ratio of 1.50 (1.13‐2.01) for every five‐unit increase in BMI corresponding to the odds ratio of 1.08 (1.02‐1.15) for every one‐unit increase in BMI. 10 Another European study showed an odds ratio of 1.26 (1.10‐1.44) for every one‐unit increase in BMI. 11 Apart from ethnicity, certain other differences also exist between the aforementioned studies and the current study. The current study has progressed one step ahead of the aforementioned MR studies. Neither of the previous studies considered sample overlap between SNP‐BMI and SNP‐CRC analyses, resulting in bias toward to non‐null. 31 In contrast, we used the split‐sample analyses, a more robust method compared to the previously mentioned analysis methods, to evaluate the association between BMI and CRC. Second, we utilized two sets of instrumental variables for BMI. One was limited to the SNPs identified in the Japanese population, which explained 2.0% (68 SNPs) in BMI variance. The other covered all SNPs identified in any ethnicity in order to obtain more precise estimates, which explained 5.0% (654 SNPs) of the variance. The latter explained variance was higher than the studies by Thrift et al (1.2%; 77 SNPs) 10 or Jarvis et al (3.0%; 76 SNPs). 11
The strengths of the study include the harmonization of the MR framework and the identification of two sets of instrumental variables. For the SNP‐BMI analysis, we used a common protocol and undertook a meta‐analysis on normal Japanese populations. For SNP‐CRC analyses, we used individual‐level and publicly available summary statistics‐level data of Japanese populations to obtain a relatively large sample size of non‐Europeans. In addition, we systematically identified instrumental variables from multiple GWAS. We believe that this selection of a comprehensive set of SNPs makes our estimates precise.
Our study has also several limitations. First, similar to previous MR studies, we failed to exclude the possibility of violation of assumptions by the SNPs used as instrumental variables. Second, as we used the two‐sample MR framework and assumed that BMI had a linear effect on CRC risk, we could not investigate whether the effect of BMI on CRC risk varies across the BMI range. Third, we could not access information on the histological and molecular subtype of the CRC. To assess complex pathological processes from adiposity to CRC, 13 further epidemiological research is warranted. Finally, as Japanese populations possess different allele frequencies for the SNPs 12 compared to South Asians, the extrapolation of the study findings to other Asians populations might be limited. Further MR study is required for other populations as well.
Our findings add to the current body of evidence that obesity strongly influences the development of CRC. Many observational studies have reported the association between higher BMI and CRC. However, repeating the study by the same method is not enough to pursue the truth. To present the evidence confidently, the concept of triangulation, which is the practice of using multiple approaches to address one question, is useful. Each approach uses different unrelated assumptions that are likely to cause bias. 43 , 44 As the development of CRC occurs over a period of time in obese individuals, randomized controlled studies are not feasible. Therefore, we undertook an MR study using genetically predicted BMI to improve the quality of evidence. However, the biological functions of many SNPs used as instrumental variables are not clear. Previous GWAS have reported that SNPs might play a role in the central nervous systems, 21 , 45 whereas traditional studies have proposed three hormonal mechanisms—sex hormone hypothesis, insulin‐IGF hypothesis, and inflammatory mediators and adipokine hypothesis—to explain the association between adiposity and cancer risk. 46 , 47 Therefore, further experimental research is needed to elucidate the underlying mechanisms. This is essential to strengthen the confidence of the evidence.
In addition, this is the first MR study that evaluated the association between BMI and CRC among an Asian population. Of note, in recent years, the proportion of obesity 36 , 48 and CRC incidence 3 , 49 is on the rise in Asian populations. Although Asians are leaner than Europeans and North Americans, Asians possess higher body fat for a given body weight compared to matched Caucasians. 14 Moreover, they also have stronger tendency towards predominance of insulin resistance than other populations, 16 , 50 , 51 thereby suggesting that Asians could be more likely to develop obesity‐related diseases. Therefore, it is critical to reveal the association between BMI and CRC, and implement preventive strategies to avert obesity in Asians.
In conclusion, we found the positive association between genetically predicted BMI and CRC risk in an Asian population. This MR study strongly supports the role of higher BMI in the development of CRC. Although generally Asians are leaner than Europeans and North Americans, averting higher BMI could be important for the prevention of CRC in Asian populations.
DISCLOSURE
All authors declare no conflict of interest.
Supporting information
Supplementary Material
ACKNOWLEDGMENTS
We thank the participants and all the staff members in this study. We also thank Drs. Hiromi Sakamoto and Teruhiko Yoshida and staff at the Genetics Division and Department of Clinical Genomics, Fundamental Innovative Oncology Core, National Cancer Center Research Institute and Drs. Yukihide Momozawa and Michiaki Kubo and staff at the RIKEN Center for Integrative Medical Sciences for genotyping. We appreciate Dr Akira Saito and Mr Mitsuhiro Amemiya at StaGen Co. Ltd for their support on genetic analysis. We also thank Drs. Nobuyuki Hamajima and Hideo Tanaka for their work in initiating and organizing the J‐MICC Study as former principal investigators.
Suzuki S, Goto A, Nakatochi M, et al. Body mass index and colorectal cancer risk: A Mendelian randomization study. Cancer Sci. 2021;112:1579–1588. 10.1111/cas.14824
Funding information
The Japan Agency for Medical Research and Development, Grant/Award Number: 15ck0106095h0002, 16ck0106095h0003, 17ck0106266h00, JP20km0105001, 20km0105003; JSPS KAKENHI Grant from the Japanese Ministry of Education, Culture, Sports, Science and Technology, Grant/Award Number: JP16H06277, JP26253041, JP20K10463, JP18K10095, JP19H03913; Grants from the Reconstruction Agency, the Ministry of Education, Culture, Sports, Science and Technology; Grants‐in‐Aid for Scientific Research for Innovative Areas from the Japanese Ministry of Education, Culture, Sports, Science and Technology, Grant/Award Number: 221S0001; National Cancer Center Research and Development Fund, Grant/Award Number: 23‐A‐31 (toku), 26‐A‐2, 28‐A‐19, 29‐A‐4, 31‐A‐18; Grant‐in‐Aid for the Third Term Comprehensive 10‐year Strategy for Cancer Control from the Ministry of Health, Labour and Welfare of Japan; Grants‐in‐Aid for Scientific Research for Priority Areas of Cancer from the Japanese Ministry of Education, Culture, Sports, Science and Technology, Grant/Award Number: 17015018.
REFERENCES
- 1. Bray F, Ferlay J, Soerjomataram I, Siegel RL, Torre LA, Jemal A. Global cancer statistics 2018: GLOBOCAN estimates of incidence and mortality worldwide for 36 cancers in 185 countries. CA Cancer J Clin. 2018;68:394‐424. [DOI] [PubMed] [Google Scholar]
- 2. Ferlay J, Soerjomataram I, Dikshit R, et al. Cancer incidence and mortality worldwide: sources, methods and major patterns in GLOBOCAN 2012. Int J Cancer. 2015;136:E359‐386. [DOI] [PubMed] [Google Scholar]
- 3. Arnold M, Sierra MS, Laversanne M, Soerjomataram I, Jemal A, Bray F. Global patterns and trends in colorectal cancer incidence and mortality. Gut. 2017;66:683‐691. [DOI] [PubMed] [Google Scholar]
- 4. The International Agency for Research on Cancer . Absence of excess body fatness. 2018;16. [PubMed]
- 5. Haugen AC, Schug TT, Collman G, Heindel JJ. Evolution of DOHaD: the impact of environmental health sciences. J Dev Orig Health Dis. 2015;6:55‐64. [DOI] [PMC free article] [PubMed] [Google Scholar]
- 6. Tyrrell J, Jones SE, Beaumont R, et al. Height, body mass index, and socioeconomic status: mendelian randomisation study in UK Biobank. BMJ. 2016;352:i582. [DOI] [PMC free article] [PubMed] [Google Scholar]
- 7. Carreras‐Torres R, Johansson M, Haycock PC, et al. Role of obesity in smoking behaviour: Mendelian randomisation study in UK Biobank. BMJ. 2018;361:k1767. [DOI] [PMC free article] [PubMed] [Google Scholar]
- 8. Lawlor DA, Harbord RM, Sterne JA, Timpson N, Davey SG. Mendelian randomization: using genes as instruments for making causal inferences in epidemiology. Stat Med. 2008;27:1133‐1163. [DOI] [PubMed] [Google Scholar]
- 9. Smith GD, Ebrahim S. 'Mendelian randomization': can genetic epidemiology contribute to understanding environmental determinants of disease? Int J Epidemiol. 2003;32:1‐22. [DOI] [PubMed] [Google Scholar]
- 10. Thrift AP, Gong J, Peters U, et al. Mendelian randomization study of body mass index and colorectal cancer risk. Cancer Epidemiol Biomarkers Prev. 2015;24:1024‐1031. [DOI] [PMC free article] [PubMed] [Google Scholar]
- 11. Jarvis D, Mitchell JS, Law PJ, et al. Mendelian randomisation analysis strongly implicates adiposity with risk of developing colorectal cancer. Br J Cancer. 2016;115:266‐272. [DOI] [PMC free article] [PubMed] [Google Scholar]
- 12. Kanai M, Tanaka T, Okada Y. Empirical estimation of genome‐wide significance thresholds based on the 1000 Genomes Project data set. J Hum Genet. 2016;61:861‐866. [DOI] [PMC free article] [PubMed] [Google Scholar]
- 13. Haslam DW, James WPT. Obesity. Lancet. 2005;366:1197‐1209. [DOI] [PubMed] [Google Scholar]
- 14. WHO expert consultation . Appropriate body‐mass index for Asian populations and its implications for policy and intervention strategies. Lancet. 2004;363:157‐163. [DOI] [PubMed] [Google Scholar]
- 15. Yoon K‐H, Lee J‐H, Kim J‐W, et al. Epidemic obesity and type 2 diabetes in Asia. Lancet. 2006;368:1681‐1688. [DOI] [PubMed] [Google Scholar]
- 16. Ramachandran A, Chamukuttan S, Shetty SA, Arun N, Susairaj P. Obesity in Asia–is it different from rest of the world. Diabetes Metab Res Rev. 2012;28(Suppl 2):47‐51. [DOI] [PubMed] [Google Scholar]
- 17. Tanikawa C, Kamatani Y, Takahashi A, et al. GWAS identifies two novel colorectal cancer loci at 16q24.1 and 20q13.12. Carcinogenesis. 2018;39:652‐660. [DOI] [PubMed] [Google Scholar]
- 18. Davies NM, Holmes MV, Davey SG. Reading Mendelian randomisation studies: a guide, glossary, and checklist for clinicians. BMJ. 2018;362:k601. [DOI] [PMC free article] [PubMed] [Google Scholar]
- 19. Stearns FW. One hundred years of pleiotropy: a retrospective. Genetics. 2010;186:767‐773. [DOI] [PMC free article] [PubMed] [Google Scholar]
- 20. Davey Smith G, Hemani G. Mendelian randomization: genetic anchors for causal inference in epidemiological studies. Hum Mol Genet. 2014;23:R89‐98. [DOI] [PMC free article] [PubMed] [Google Scholar]
- 21. Akiyama M, Okada Y, Kanai M, et al. Genome‐wide association study identifies 112 new loci for body mass index in the Japanese population. Nat Genet. 2017;49:1458‐1467. [DOI] [PubMed] [Google Scholar]
- 22. Hirata M, Kamatani Y, Nagai A, et al. Cross‐sectional analysis of BioBank Japan clinical data: a large cohort of 200,000 patients with 47 common diseases. J Epidemiol. 2017;27:S9‐S21. [DOI] [PMC free article] [PubMed] [Google Scholar]
- 23. Burgess S, Thompson SG, Collaboration CCG. Avoiding bias from weak instruments in Mendelian randomization studies. Int J Epidemiol. 2011;40:755‐764. [DOI] [PubMed] [Google Scholar]
- 24. Willer CJ, Li Y, Abecasis GR. METAL: fast and efficient meta‐analysis of genomewide association scans. Bioinformatics. 2010;26:2190‐2191. [DOI] [PMC free article] [PubMed] [Google Scholar]
- 25. Hemani G, Zheng J, Elsworth B, et al. The MR‐Base platform supports systematic causal inference across the human phenome. Elife. 2018;7. [DOI] [PMC free article] [PubMed] [Google Scholar]
- 26. Burgess S, Butterworth A, Thompson SG. Mendelian randomization analysis with multiple genetic variants using summarized data. Genet Epidemiol. 2013;37:658‐665. [DOI] [PMC free article] [PubMed] [Google Scholar]
- 27. Bowden J, Davey Smith G, Haycock PC, Burgess S. Consistent Estimation in Mendelian randomization with some invalid instruments using a weighted median estimator. Genet Epidemiol. 2016;40:304‐314. [DOI] [PMC free article] [PubMed] [Google Scholar]
- 28. Bowden J, Davey Smith G, Burgess S. Mendelian randomization with invalid instruments: effect estimation and bias detection through Egger regression. Int J Epidemiol. 2015;44:512‐525. [DOI] [PMC free article] [PubMed] [Google Scholar]
- 29. Verbanck M, Chen CY, Neale B, Do R. Detection of widespread horizontal pleiotropy in causal relationships inferred from Mendelian randomization between complex traits and diseases. Nat Genet. 2018;50:693‐698. [DOI] [PMC free article] [PubMed] [Google Scholar]
- 30. Tchetgen Tchetgen EJ, Walter S, Glymour MM. Commentary: building an evidence base for mendelian randomization studies: assessing the validity and strength of proposed genetic instrumental variables. Int J Epidemiol. 2013;42:328‐331. [DOI] [PMC free article] [PubMed] [Google Scholar]
- 31. Burgess S, Davies NM, Thompson SG. Bias due to participant overlap in two‐sample Mendelian randomization. Genet Epidemiol. 2016;40:597‐608. [DOI] [PMC free article] [PubMed] [Google Scholar]
- 32. Joshua DA, Alan BK. Split‐sample instrumental variables estimates of the return to schooling. J Bus Econ Stat. 2012;13:10. [Google Scholar]
- 33. Henry A, Katsoulis M, Masi S, et al. The relationship between sleep duration, cognition and dementia: a Mendelian randomization study. Int J Epidemiol. 2019;48:849‐860. [DOI] [PMC free article] [PubMed] [Google Scholar]
- 34. Taylor AE, Davies NM, Ware JJ, VanderWeele T, Smith GD, Munafo MR. Mendelian randomization in health research: using appropriate genetic variants and avoiding biased estimates. Econ Hum Biol. 2014;13:99‐106. [DOI] [PMC free article] [PubMed] [Google Scholar]
- 35. Haycock PC, Burgess S, Wade KH, Bowden J, Relton C, Davey SG. Best (but oft‐forgotten) practices: the design, analysis, and interpretation of Mendelian randomization studies. Am J Clin Nutr. 2016;103:965‐978. [DOI] [PMC free article] [PubMed] [Google Scholar]
- 36. 36NCD Risk Factor Collaboration . Trends in adult body‐mass index in 200 countries from 1975 to 2014: a pooled analysis of 1698 population‐based measurement studies with 19·2 million participants. Lancet. 2016;387:1377‐1396. [DOI] [PMC free article] [PubMed] [Google Scholar]
- 37. Ning Y, Wang L, Giovannucci EL. A quantitative analysis of body mass index and colorectal cancer: findings from 56 observational studies. Obes Rev. 2010;11:19‐30. [DOI] [PubMed] [Google Scholar]
- 38. Matsuo K, Mizoue T, Tanaka K, et al. Association between body mass index and the colorectal cancer risk in Japan: pooled analysis of population‐based cohort studies in Japan. Ann Oncol. 2012;23:479‐490. [DOI] [PubMed] [Google Scholar]
- 39. Burgess S, Davey Smith G, Davies NM, et al. Guidelines for performing Mendelian randomization investigations. Wellcome Open Res. 2019;4. [DOI] [PMC free article] [PubMed] [Google Scholar]
- 40. Burgess S, O'Donnell CJ, Gill D. Expressing results from a Mendelian randomization analysis: separating results from inferences. JAMA Cardiol. 2020. [DOI] [PMC free article] [PubMed] [Google Scholar]
- 41. Ference BA, Yoo W, Alesh I, et al. Effect of long‐term exposure to lower low‐density lipoprotein cholesterol beginning early in life on the risk of coronary heart disease: a Mendelian randomization analysis. J Am Coll Cardiol. 2012;60:2631‐2639. [DOI] [PubMed] [Google Scholar]
- 42. White J, Swerdlow DI, Preiss D, et al. Association of lipid fractions with risks for coronary artery disease and diabetes. JAMA Cardiol. 2016;1:692‐699. [DOI] [PMC free article] [PubMed] [Google Scholar]
- 43. Lawlor DA, Tilling K, Davey SG. Triangulation in aetiological epidemiology. Int J Epidemiol. 2016;45:1866‐1886. [DOI] [PMC free article] [PubMed] [Google Scholar]
- 44. Munafò MR, Davey SG. Robust research needs many lines of evidence. Nature. 2018;553:399‐401. [DOI] [PubMed] [Google Scholar]
- 45. Locke AE, Kahali B, Berndt SI, et al. Genetic studies of body mass index yield new insights for obesity biology. Nature. 2015;518:197‐206. [DOI] [PMC free article] [PubMed] [Google Scholar]
- 46. Renehan AG, Zwahlen M, Egger M. Adiposity and cancer risk: new mechanistic insights from epidemiology. Nat Rev Cancer. 2015;15:484‐498. [DOI] [PubMed] [Google Scholar]
- 47. Murphy N, Jenab M, Gunter MJ. Adiposity and gastrointestinal cancers: epidemiology, mechanisms and future directions. Nat Rev Gastroenterol Hepatol. 2018;15:659‐670. [DOI] [PubMed] [Google Scholar]
- 48. Pearson‐Stuttard J, Zhou B, Kontis V, Bentham J, Gunter MJ, Ezzati M. Worldwide burden of cancer attributable to diabetes and high body‐mass index: a comparative risk assessment. Lancet Diabetes Endocrinol. 2018;6:e6‐e15. [DOI] [PMC free article] [PubMed] [Google Scholar]
- 49. Bray F, Jemal A, Grey N, Ferlay J, Forman D. Global cancer transitions according to the Human Development Index (2008–2030): a population‐based study. Lancet Oncol. 2012;13:790‐801. [DOI] [PubMed] [Google Scholar]
- 50. McKeigue PM, Shah B, Marmot MG. Relation of central obesity and insulin resistance with high diabetes prevalence and cardiovascular risk in South Asians. Lancet. 1991;337:382‐386. [DOI] [PubMed] [Google Scholar]
- 51. Matsumoto K, Miyake S, Yano M, et al. Glucose tolerance, insulin secretion, and insulin sensitivity in nonobese and obese Japanese subjects. Diabetes Care. 1997;20:1562‐1568. [DOI] [PubMed] [Google Scholar]
Associated Data
This section collects any data citations, data availability statements, or supplementary materials included in this article.
Supplementary Materials
Supplementary Material