

Abstract
Oxaliplatin (OX) and irinotecan (IRI) are used as key drugs for the first‐line treatment of metastatic colorectal cancer (mCRC). However, no biomarkers have been identified to decide which of the drugs is initially used. In this translational research (TR) of the TRICOLORE trial, the advanced colorectal cancer subtype (aCRCS) was analyzed as a potential biomarker for the selection of OX or IRI. We collected 335 (68.8%) formalin‐fixed, paraffin‐embedded (FFPE) primary tumor specimens from 487 patients registered in the TRICOLORE trial and performed direct sequencing and immunohistochemical staining of CRC‐related genes, comprehensive gene‐expression analysis, and genome‐wide methylation analysis. The progression‐free survival (PFS) of the IRI group was significantly better compared with the OX group in BRAF wild‐type (WT), PTEN‐positive, and aCRCS A1 patients. Among the molecular factors, aCRCS were only associated with the PFS of OX and IRI groups. The PFS of the IRI group was significantly better compared with the OX group in aCRCS A1 + B1 (hazard ratio [HR] = 0.58; 95% confidence interval [CI] = 0.41‐0.82; P = .0023). In contrast, the OX group had better PFS compared with the IRI group in aCRCS B2, although this was not statistically significant (HR = 1.66; 95% CI = 0.94‐2.96; P = .083). Nearly half of patients with mCRC (46.8%, aCRCS A1 + B1) respond well to IRI, while only about 18.5% (aCRCS B2) of patients with mCRC responded well to OX. In conclusion, the aCRCS might be a predictive factor for the clinical outcomes of OX‐based and IRI‐based therapies.
Keywords: aCRCS, irinotecan, oxaliplatin, predictive biomarker, TRICOLORE
From translational research of TRICOLORE trail, the advanced colorectal cancer subtypes (aCRCS) can help to select oxaliplatin‐based or irinotecan‐based therapy for first‐line metastatic colorectal cancer treatment.
Abbreviations
- 5‐FU
5‐fluorouracil
- aCRCS
advanced colorectal cancer subtype
- AKT1
v‐akt murine thymoma viral oncogene homolog 1
- BRAF
v‐raf murine sarcoma viral oncogene homolog B1
- CI
confidence interval
- CIPM
CpG island methylator phenotype
- CMS
consensus molecular subtypes of colorectal cancer
- EGFR
epidermal growth factor receptor
- FFPE
formalin‐fixed, paraffin‐embedded
- HMCC
highly methylated colorectal cancer
- HR
hazard ratio
- IRI
irinotecan
- LMCC
low methylated colorectal cancer
- MMR
mismatch repair
- OS
overall survival
- OX
oxaliplatin
- PFS
progression‐free survival
- PIK3CA
phosphatidylinositol‐4,5‐bisphosphate 3‐kinase catalytic subunit alpha
- PTEN
phosphatase and tensin homolog
- RDI
relative dose intensity
- TR
translational research
1. INTRODUCTION
Oxaliplatin (OX)‐based and irinotecan (IRI)‐based therapies are commonly used as first‐line treatment for metastatic colorectal cancer (mCRC). 1 , 2 Several randomized trials comparing clinical outcomes of OX‐based and IRI‐based therapies have been conducted. 3 , 4 , 5 Prospective studies comparing OX‐based or IRI‐based therapy with bevacizumab have shown that the median PFS with OX‐based therapy is 10.1‐10.8 mo, while that with IRI‐based therapy is 12.1‐14.0 mo. 3 , 4 The PFS after IRI‐based therapy is consistently better compared with OX‐based therapy, although the difference was not statistically significant. 3 , 4 One of the reasons for this difference is believed to be the difficulty in continuing OX‐based combination therapy for a long period because of long‐lasting peripheral neuropathy. 4 Therefore, IRI is thought to be better compared with OX in terms of the quality of life (QOL). 4 , 6 Although OX is used more frequently than IRI as a first‐line treatment for mCRC worldwide, the above information suggests that IRI‐based therapy might be more suitable than OX‐based therapy as a first‐line treatment. If some patient subtypes show better outcomes with IRI‐based compared with OX‐based therapy, then IRI can be recommended for them.
CRC can be classified into several subtypes based on molecular markers such as RAS and BRAF mutations, the CpG island methylator phenotype (CIMP), and mismatch repair deficiency (dMMR). 7 , 8 , 9 , 10 To date, however, no biomarkers have been determined for selection of OX or IRI. There are several classification methods based on gene‐expression profiles of tumor tissues such as consensus molecular subtypes of colorectal cancer (CMS) 11 and advanced colorectal cancer subtypes (aCRCS). 12
aCRCS was developed using specimens only from unresectable or recurrent colorectal cancer to provide a novel classification method specific for mCRC. mCRCs are classified by aCRCS into 4 subtypes (A1, A2, B1, and B2). aCRCS has been reported to be a predictive factor for anti‐EGFR antibody therapy in KRAS WT mCRC. 12
The TRICOLORE trial is an open‐label, multicenter, randomized phase III trial that examines the noninferiority of bevacizumab + IRI + S‐1 combination therapy to bevacizumab + OX‐based combination therapy (mFOLFOX6 or CapeOX) in terms of the PFS in untreated mCRC; the noninferiority of the former therapy has been statistically confirmed, and supports previous studies reporting IRI‐based therapy as moderately superior. 3 , 4
In this TR of the TRICOLORE trial, the aCRCS was analyzed as a potential biomarker for the selection of OX or IRI. 13
2. MATERIALS AND METHODS
2.1. Patients and materials
The TRICOLORE trial for untreated mCRC was designed in compliance with the Declaration of Helsinki and the Ethical Guidelines for Medical and Health Research Involving Human Subjects. The TR of the TRICOLORE trial was approved by the institutional review board of each participated facility. Only patients who provided informed consent for the TR before the start of treatment were included. We collected 335 (68.8%) FFPE samples from surgical or biopsy specimens of the primary tumor of 487 patients registered in the TRICOLORE trial. The number of patients in the control group (mFOLFOX6 or CapeOX + bevacizumab; OX group) was 169, and the number in the test group (S‐1 and irinotecan + bevacizumab; IRI group) was 166.
2.2. Mutational analysis
We performed gene mutational analysis of KRAS (codons 12, 13, 59, and 61), NRAS (codons 12, 13, 59, and 61), BRAF (codon 600), PIK3CA (exons 9 and 20), and AKT1 (codon 17) using direct sequencing. 14
2.3. Immunohistochemical staining
Immunohistochemical staining of mismatch repair (MMR)‐related proteins (MLH1, MSH2, MSH6, and PMS2) and PTEN was performed at the Department of Pathology, Tohoku University Hospital, Japan, using the following antibodies: an anti‐human mouse MLH‐1 clone G168‐15 (1/100; BD Biosciences, San Jose, CA, USA), an anti‐MSH2 mouse mAb clone FE11 (1/200; Sigma‐Aldrich, St. Louis, MO, USA), an anti‐MSH6 mouse clone 44 (1/1000; BD Biosciences), an anti‐PMS2 mouse clone 16‐4 (1/100; BD Biosciences), and a PTEN clone 6H2.1 (1/100; DAKO, Carpinteria, CA, USA). Cases in which nuclei were stained were deemed positive for MMR‐related proteins, while cases in which the cytoplasm was stained were deemed positive for PTEN.
2.4. Comprehensive gene‐expression analysis
We performed comprehensive gene‐expression analysis using the Whole Human Genome 4 x 44K Microarray (Agilent Technologies, Santa Clara, CA, USA). Briefly, we collected tumor cells by macrodissection and performed comprehensive gene‐expression analysis, as previously described. 12 Microarray data are available from GSE147571. Gene‐expression data were analyzed and imaged using GeneSpring GX version 14.5 (Agilent Technologies). The patients with aCRCS were classified into 4 subtypes, A1, A2, B1, and B2, as previously described. 12 The numbers of patients in subtype A1 were 39 (12.7%); A2, 107 (34.7%); B1, 105 (34.0%), and B2, 57 (18.5%). CMS analysis 11 was performed, as previously described. 15 Finally, principal component analysis (PCA) was performed using GeneSpring GX version 14.5 (Agilent Technologies) using the aCRCS gene set.
2.5. DNA methylation analysis
We performed genome‐wide methylation analysis using the Infinium Methylation EPIC BeadChip (Illumina, San Diego, CA, USA), as previously described. 16 In addition, we evaluated the methylation state of the CpG site by the β‐value (intensity of methylated probe/[intensity of methylated probe + intensity of unmethylated probe]). β ≥ 0.5 was defined as methylation positive. After excluding probes on the X and Y chromosomes, we selected probes with a standard deviation of β ≥ 0.25 across all cases. Using the selected probes, we used unsupervised hierarchical clustering to classify patients into HMCC or LMCC. In CIMP analysis, cases in which 3 or more of the 5 promoter regions of CACNA1G, IGF2, NEUROG1, RUNX3, and SOCS1 were methylated were deemed CIMP positive. 10
2.6. Gene set enrichment analysis
Gene set enrichment analysis (GSEA) was performed using the comprehensive gene‐expression data by GSEA software (Version 4.1.0, BROAD Institute) as described in the instructions, with the number of permutations set to 1000 and c6: oncogenic signature. 17 We performed GSEA on aCRCS A1 + B1 vs. A2, B2 vs. A1 + B1 and B2 vs. A2. A gene set was considered significantly enriched when the P‐value was less than .05 and the false discovery rate was less than 0.25.
2.7. Clinical outcomes
The primary endpoint of the study, as in the TRICOLORE trial, was the PFS, which was defined as the period from the date of enrollment to the date of either tumor progression or death due to any reason. The OS was defined as the period from the date of enrollment to the date of death.
2.8. Statistical analysis
This study was registered in UMIN‐CTR (http://www.umin.ac.jp/ctr/) (000 007 834). All statistical analyses were performed using JMP Pro version 15.0.0 (SAS, Cary, NC, USA). We used two‐sided Fisher exact test and Wilcoxon rank‐sum test (or Kruskal‐Wallis test) for patient background, tumor response, and adverse events analysis. The PFS and OS were estimated using the Kaplan‐Meier method, and the log rank test was used for between‐group comparison. In addition, we performed univariate analyses of molecular markers that may contribute to the PFS or OS using a Cox proportional hazards model and calculated the HR and its CI. Wilcoxon rank‐sum test was used to compare RDI, tumor reduction and excision repair cross‐complementing 1 (ERCC1) gene expression. P < .05 was considered statistically significant.
3. RESULTS
3.1. Patients and clinical outcomes
Figure 1 shows the CONSORT diagram for this study. There were no differences in patient characteristics between the parental TRICOLORE and TR cohorts (Table S1). The PFS and OS in the TR cohort were almost the same as those in the entire TRICOLORE cohort (Figure S1). In the clinicopathological and molecular background (Table 1), we found a significant between‐group difference only in aCRCS.
FIGURE 1.
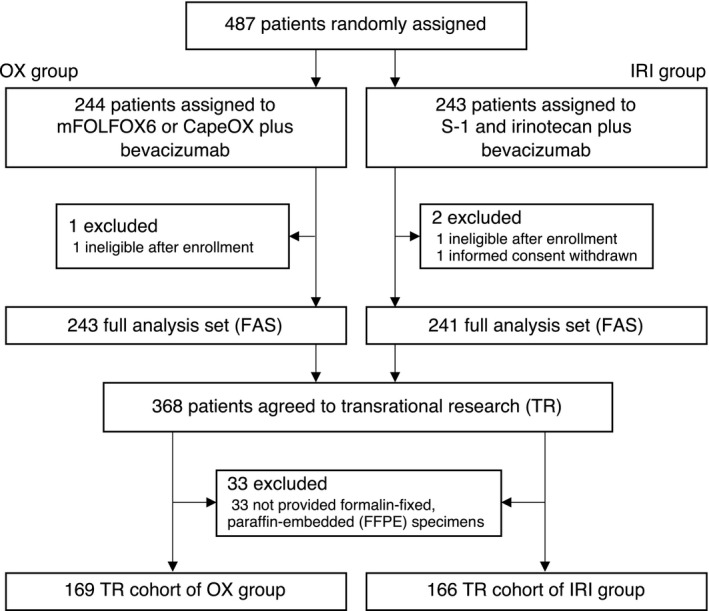
CONSORT diagram. OX, oxaliplatin; IRI, irinotecan
TABLE 1.
Patients characteristics and results of molecular marker of TR cohort
| mFOLFOX6 or CapeOX plus bevacizumab (n = 169) | S‐1 and irinotecan plus bevacizumab (n = 166) | P | |||
|---|---|---|---|---|---|
| n | % | n | % | ||
| Sex | |||||
| Male | 95 | 56.2 | 101 | 60.8 | .39 |
| Female | 74 | 43.8 | 65 | 39.2 | |
| PS (ECOG) | |||||
| 0 | 138 | 81.7 | 144 | 86.8 | .20 |
| 1 | 31 | 18.3 | 22 | 13.3 | |
| Age | |||||
| Median [range] | 65 [29‐85] | 65 [22‐87] | .78 | ||
| ≥65 | 94 | 55.6 | 81 | 48.8 | |
| Ccr at enrollment | |||||
| Median [range] | 82.1 [60.0‐153.1] | 82.6 [60.0‐182.8] | .46 | ||
| ≥70 | 125 | 74.0 | 127 | 76.5 | |
| Complications | |||||
| Yes | 73 | 43.2 | 81 | 48.8 | .30 |
| No | 96 | 56.8 | 85 | 51.2 | |
| Adjuvant chemotherapy for colorectal cancer | |||||
| Yes | 19 | 11.2 | 25 | 15.1 | .30 |
| No | 150 | 88.8 | 141 | 84.9 | |
| Differentiation assessed by histology | |||||
| Well or moderate | 144 | 85.2 | 146 | 88.0 | .68 |
| Poorly | 13 | 7.7 | 9 | 5.4 | |
| Other | 12 | 7.1 | 11 | 6.6 | |
| Primary tumor location | |||||
| Right side | 45 | 26.6 | 54 | 32.5 | .24 |
| Left side | 124 | 73.4 | 112 | 67.5 | |
| Primary tumor resection | |||||
| Yes | 127 | 75.2 | 128 | 77.1 | .67 |
| No | 42 | 24.9 | 38 | 22.9 | |
| Metastatic organs | |||||
| 0‐1 | 88 | 52.1 | 91 | 54.8 | .61 |
| ≥2 | 81 | 47.9 | 75 | 45.2 | |
| Target lesion | |||||
| Yes | 153 | 90.5 | 148 | 89.2 | .68 |
| No | 16 | 9.5 | 18 | 10.8 | |
| RAS mutation | |||||
| Wild‐type | 99 | 58.6 | 105 | 63.3 | .45 |
| Mutant type | 65 | 38.5 | 58 | 34.9 | |
| Not definable | 5 | 3.0 | 3 | 1.8 | |
| BRAF mutation | |||||
| Wild‐type | 153 | 90.5 | 152 | 91.6 | .81 |
| Mutant type | 9 | 5.3 | 10 | 6.0 | |
| Not definable | 7 | 4.1 | 4 | 2.4 | |
| PIK3CA mutation | |||||
| Wild‐type | 148 | 87.6 | 148 | 89.2 | 1.00 |
| Mutant type | 14 | 8.3 | 14 | 8.4 | |
| Not definable | 7 | 4.1 | 4 | 2.4 | |
| AKT mutation | |||||
| Wild‐type | 159 | 94.1 | 161 | 97.0 | .57 |
| Mutant type | 1 | 0.6 | 2 | 1.2 | |
| Not definable | 9 | 5.3 | 3 | 1.8 | |
| CIMP | |||||
| Negative | 94 | 55.6 | 99 | 59.6 | .28 |
| Positive | 20 | 11.8 | 14 | 8.4 | |
| Not definable | 55 | 32.5 | 53 | 32.0 | |
| Genome‐wide methylation status | |||||
| LMCC | 82 | 48.5 | 79 | 47.6 | .74 |
| HMCC | 32 | 18.9 | 34 | 20.5 | |
| Not definable | 55 | 32.5 | 53 | 31.9 | |
| MMR | |||||
| Proficient | 158 | 93.5 | 158 | 95.2 | .26 |
| Deficient | 5 | 3.0 | 2 | 1.2 | |
| Not definable | 6 | 3.5 | 6 | 3.6 | |
| PETN | |||||
| Positive | 138 | 81.7 | 131 | 78.9 | .42 |
| Negative | 23 | 13.6 | 28 | 16.9 | |
| Not definable | 8 | 4.7 | 7 | 4.2 | |
| CMS | |||||
| CMS1 | 25 | 14.8 | 22 | 13.3 | .14 |
| CMS2 | 28 | 16.6 | 44 | 26.5 | |
| CMS3 | 52 | 30.8 | 47 | 28.3 | |
| CMS4 | 51 | 30.2 | 39 | 23.5 | |
| Not definable | 13 | 7.7 | 14 | 8.4 | |
| aCRCS | |||||
| Subtype A1 | 28 | 16.6 | 11 | 6.6 | .03 |
| Subtype A2 | 48 | 28.4 | 59 | 35.5 | |
| Subtype B1 | 54 | 32.0 | 51 | 30.7 | |
| Subtype B2 | 26 | 15.4 | 31 | 18.7 | |
| Not definable | 13 | 7.7 | 14 | 8.4 | |
Abbreviations: aCRCS, advanced colorectal cancer subtype; CIMP, CpG island methylator phenotype; CMS, consensus molecular subtype; HMCC, highly methylated colorectal cancer; LMCC, low methylated colorectal cancer; MMR, mismatch repair; TR, translational research.
3.2. Clinical outcomes in accordance with a molecular subtype
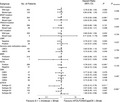
In accordance with PFS subgroup analysis results (Figure 2 and Figure S2), the PFS of the IRI group was significantly better compared with the OX group in BRAF WT, PTEN‐positive, and aCRCS A1 patients. In no molecular subtypes was the PFS of the OX group better compared with the IRI group. In the interaction test, only the aCRCS was a significant predictive factor for the PFS after OX‐based and IRI‐based therapies.
FIGURE 2.
HRs for PFS events in accordance with molecular markers. The HR and its CI in the Cox proportional hazards model were calculated. *Statistically significant (P < .05). HR, hazard ratio; aCRCS, advanced colorectal cancer subtypes; CI, confidence interval; CIMP, CpG island methylator phenotype; CMS, consensus molecular subtypes of colorectal cancer; HMCC, highly methylated colorectal cancer; LMCC, low methylated colorectal cancer; MMR, mismatch repair; PFS, progression‐free survival
3.3. Relationship between aCRCS and clinical outcomes of OX‐based and IRI‐based therapies
Table S2 presents the clinicopathological and molecular backgrounds in all aCRCS. The patient backgrounds of the OX and IRI groups were generally well balanced, and there was little chance that the patient background affected the clinical outcomes of OX‐based and IRI‐based therapies (Table S2). There were significantly fewer PTEN‐negative cases in the OX group compared with the IRI group in aCRCS A2. There were more CIMP‐positive cases in the IRI group compared with the OX group in aCRCS B1. No other factors differed between the 2 groups.
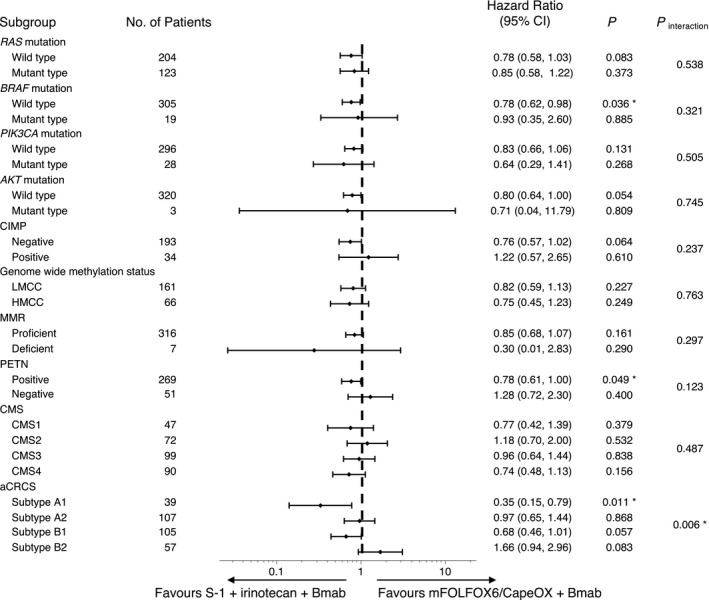
Figure 3 shows survival curves of the PFS. The PFS of the IRI group was significantly better compared with the OX group in aCRCS A1 (Figure 3A). The PFS of the IRI group was better compared with the OX group in aCRCS B1 (Figure 3C), although the difference was not statistically significant. In contrast, the PFS of the OX group was better compared with the IRI group in aCRCS B2 although the difference was not statistically significant (Figure 3D). In aCRCS A2, the PFS in both groups was comparable (Figure 3B).
FIGURE 3.
Kaplan‐Meier survival curves for the PFS in the OX (blue line) and the IRI (red line) group in accordance with subtypes: (A) aCRCS A1; (B) aCRCS A2; (C) aCRCS B1; (D) aCRCS B2; (E) aCRCS A1 + B1. aCRCS, advanced colorectal cancer subtypes; CI, confidence interval; IRI, irinotecan; OX, oxaliplatin; PFS, progression‐free survival
PCA results of aCRCS are shown in Figure 4. Notably, aCRCS A1 and B1 were close to each other, indicating that some fractions of the gene‐expression patterns among aCRCS A1 and B1 are similar. Since aCRCS A1 and B1 had relatively similar gene‐expression patterns and similar therapeutic effects for OX and IRI, we considered them as a single subtype (A1 + B1) in terms of OX‐based and IRI‐based therapy selection. The PFS of the IRI group was significantly better compared with the OX group (HR = 0.58; 95% CI = 0.41‐0.82; P = .0023) in aCRCS A1 + B1 (Figure 3E).
FIGURE 4.
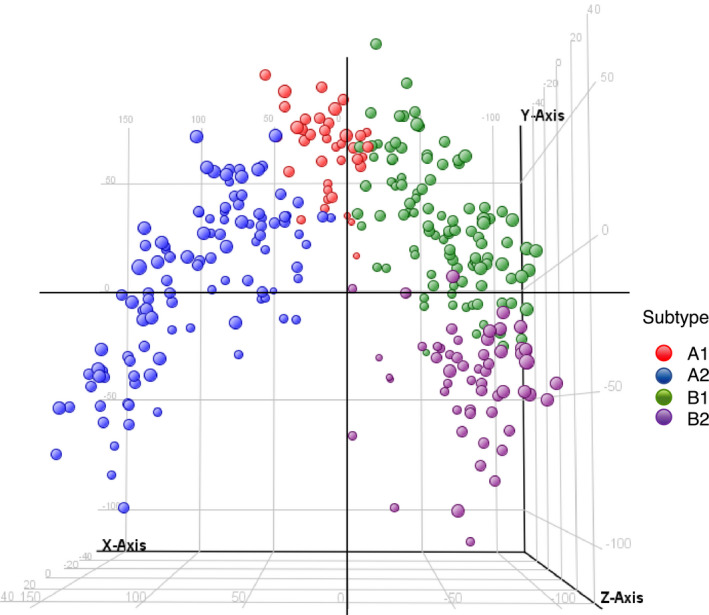
PCA using a gene set of aCRCS. Each dot indicates 1 sample. Colors indicate subtypes: red, aCRCS A1; blue, aCRCS A2; green, aCRCS B1; purple, aCRCS B2. aCRCS, advanced colorectal cancer subtype; PCA, principal component analysis
The PFS by all subtypes of aCRCS in OX‐based treatment group and in IRI‐based treatment group are shown in Figure S3. In OX‐based treatment group, PFS of aCRCS B2 was significantly better than that of aCRCS A1 + B1 (Figure S3A). Conversely, in the IRI‐based treatment group, there were no significant difference in PFS between all subtypes (Figure S3B).
Figure 5 shows the best reduction in the target lesion size from the baseline. Tumor shrinkage in the IRI group was better compared with the OX group in aCRCS A1 + B1 (Figure 5A), while it was better in the OX group compared with the IRI group in aCRCS B2 (Figure 5C). All patients in the OX group showed a reduction in the target lesion size in aCRCS B2. The trend in tumor shrinkage was similar between the OX and IRI groups in aCRCS A2 (Figure 5B). Best overall response was shown in Table S3.
FIGURE 5.
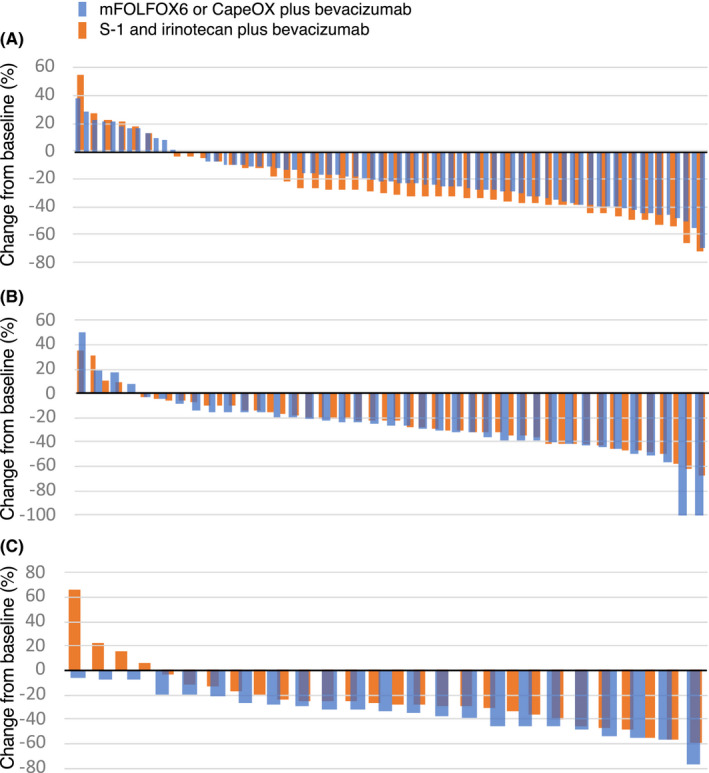
Best reduction in the target lesion size from the baseline. The waterfall plot shows the change in the sum of the diameters of target lesions from the baseline to the best response. A, aCRCS A1 + B1; B, aCRCS A2; C, aCRCS B2
Adverse events data were shown in Table S4. In aCRCS A1 + B1, the incidence of grade 3 or higher adverse events of leucopenia, anemia, febrile neutropenia, and thromboembolism was significantly higher in the IRI group than in the OX group. Grade 3 or higher peripheral sensory neuropathy was only observed in the OX group in all aCRCS subtypes.
The RDI of IRI tended to be lower compared with OX in aCRCS A1 + B1, but there was no difference in aCRCS A2 and B2 (Figure S4A). The RDI of fluoropyrimidines (5‐fluorouracil [5‐FU] or capecitabine) in the OX group was significantly lower than the RDI of S‐1 in the IRI group in aCRCS A2, but there was no difference in aCRCS A1 + B1 and B2 (Figure S4B). In addition, there was no difference in the RDI of bevacizumab between OX and IRI groups in all aCRCS (Figure S4C).
Also, the OS was the same between OX and IRI groups in all aCRCS (Figure S5).
3.4. Oncogenic pathways associated with aCRCS
GSEA analysis was performed to identify the oncogenic pathways associated with aCRCS. The results of the GSEA (top 20 of enriched gene sets) are shown in Table S3. KRAS signaling pathways were markedly enriched in aCRCS A1 + B1 compared with A2. In aCRCS B2 compared with A1 + B1 and B2 compared with A2, KRAS signaling pathways were also markedly enriched. These data indicated that activation of KRAS was low in A2, intermediate in A1 + B1 and high in B2.
3.5. Gene‐expression levels for ERCC1 gene
It has been reported that high expression of the ERCC1 gene is associated with resistance to OX. 18 Comparing the expression level of the ERCC1 gene, the expression level was significantly lower in aCRCS A1 compared with in aCRCSA1 + B1 (Figure S6).
4. DISCUSSION
To the best of our knowledge, no comprehensive biomarker analysis of the therapeutic effects of OX and IRI in the TR of a prospective clinical trial has been reported. Recently, retrospective molecular analyses of several prospective clinical trials on the prognosis and therapeutic effects of an anti‐EGFR antibody and bevacizumab in accordance with CMS were reported. 19 , 20 , 21 However, there are still no clinically useful biomarkers for OX‐based and IRI‐based therapy selection, and the adverse event profile is the only factor considered in treatment selection.
The TRICOLORE trial compares bevacizumab + mFOLFOX6 or CapeOX with bevacizumab + IRI + S‐1. Representative prospective clinical trials comparing fluoropyrimidines (FIRIS, SOFT, NO16966, and AXEPT) in mCRC have shown that the PFS rates of 5‐FU, capecitabine, and S‐1 are comparable. 22 , 23 , 24 , 25 Therefore, we believe that our findings can be used to compare the clinical outcomes of OX‐based and IRI‐based therapies.
Among the molecular factors, aCRCS were only associated with the PFS of OX and IRI groups (Figure 2). In aCRCS A1 and B1, IRI‐based therapy led to better PFS compared with OX‐based therapy, while in aCRCS B2, OX‐based therapy led to better PFS compared with IRI‐based therapy. The aCRCS A1 and B1 are close to each other on the gene‐expression profile by PCA (Figure 4), and the 2 groups have similar therapeutic outcomes with OX and IRI. In aCRCS A1 + B1, IRI‐based therapy led to better PFS (Figure 3E) and better tumor shrinkage compared with OX‐based therapy (Figure 5A), although the RDI of IRI tends to be lower compared with OX (Figure S4). These findings consistently suggest that aCRCS A1 + B1 are more responsive to IRI compared with OX. In aCRCS B2, the PFS, and tumor shrinkage after OX‐based therapy are better compared with IRI‐based therapy, despite the lack of significant differences between the RDIs of OX and IRI. These findings suggest that aCRCS B2 is more responsive to OX compared with IRI. Taken together, aCRCS, which enabled the classification of mCRC into 3 subtypes, A1 + B1, A2, and B2, can be a biomarker for predicting the PFS after OX‐based and IRI‐based therapies.
From GSEA, KRAS signaling activation was highest in aCRCS B2 among aCRCS (Table S3). It was reported that KRAS mutant colorectal cancer cell lines were sensitive to OX compared with KRAS WT colorectal cancer cell lines. 26 Therefore, the degree of activation of KRAS signaling may be responsible for the better PFS in aCRCS B2 and the poorer PFS in A1 + B1 and A2 in the OX‐based treatment group (Figure S3A). Furthermore, the expression level of the ERCC1 gene, which is considered to be a predictor of the efficacy of OX, was significantly higher in aCRCS A1 + B1 than in the other subtypes, suggesting that the sensitivity to OX might be poorer in aCRCS A1 + B1 than in the others (Figure S6). In fact, the PFS of OX tended to be better in aCRCS A2 compared with in aCRCS A1 + B1 (P = .11) (Figure S3A). In contrast, regardless of the aCRCS subtype, the sensitivity of IRI was consistently good (Figure S3B). Therefore, the reason why the sensitivity of IRI was better than that of OX in aCRCS A1 (or aCRCS A1 + B1) was the poor sensitivity of OX due to KRAS signaling activation and ERCC1 expression. In contrast, the reason why the PFS was not different between OX and IRI in aCRCS A2 might be the intermediate sensitivity of OX.
From the adverse events data (Table S4), in aCRCS A1 + B1, the incidence of grade 3 or higher adverse events of leucopenia, anemia, febrile neutropenia, and thromboembolism was significantly higher in the IRI group compared with in the OX group. The reason for this may be due to the significantly longer duration for IRI‐based treatment compared with the duration for OX‐based treatment in aCRCS A1 + B1. Therefore, the total doses of cytotoxic drugs and bevacizumab would be higher in the IRI group than in the OX group.
Nearly half of patients with mCRC responded well to IRI (aCRCS A1 + B1, 46.8%), while only about 20% responded well to OX (aCRCS B2, 18.5%). Therefore, the PFS of IRI‐based therapy was consistently better compared with OX‐based therapy, although the difference was not statistically significant. 3 , 4 , 6
The OS did not differ significantly after OX‐based and IRI‐based therapies among aCRCS, but this might be because IRI is used in 60.7% of OX patients and OX is used in 56.6% of IRI patients as second‐line treatment. 6 In considering treatment strategies for mCRC, the key issue is QOL. Chemotherapy‐induced peripheral neuropathy (CIPN) by OX are long lasting and reduce QOL. 27 To decrease the duration of CIPN, it is better to use OX in later line treatment. Therefore, IRI as first‐line treatment may be preferable in aCRCS A1 + B1, who are more responsive to IRI than to OX, and in subtype A2, who have similar responsivity to both OX and IRI.
Okita et al reported the relationship between CMS and the efficacy of OX and IRI using a cohort of 193 patients with mCRC. 15 In that report, PFS, and OS were significantly better in the IRI group than in the OX group in CMS4. In CMS2 and CMS3, PFS of both groups was equivalent. Unfortunately, we were unable to replicate those results; our results exhibited the same trend as that of Okita et al. CMS was developed using gene‐expression data of early‐stage CRC and mCRC, whereas aCRCS was developed using the gene‐expression data of unresectable or recurrent colorectal cancer only. It is possible that aCRCS, which is specific to the classification of mCRC, may have an advantage in predicting the sensitivity of OX and IRI to mCRC.
This is the first report on specific CRC subtypes based on comprehensive molecular analysis: (a) being related to OX and IRI efficacy, and (b) being a biomarker in mCRC. However, this study had a few limitations. First, the TRICOLORE trial was conducted on a Japanese population. Second, S‐1 is not widely used as for mCRC treatment in the West. Third, this was an exploratory study, and future validation studies are needed to determine the significance of aCRCS as a biomarker for OX‐based and IRI‐based therapy selection.
In conclusion, the PFS after IRI‐based therapy was significantly better compared with OX‐based therapy in the aCRCS A1 + B1 group. aCRCS may be a predictive factor of the outcomes of OX‐based and IRI‐based therapies. Given that IRI has advantages in the proportion of sensitive cases and QOL, the therapeutic strategy of selecting IRI as the first‐line treatment for mCRC may be effective.
DISCLOSURE
ST has received honoraria from Taiho and Asahi Kasei and research grants from Merck Biopharma and Ono. TD has received honoraria from Sawai and Sysmex and research grants from Taiho, MSD, and Ono. AT has received honoraria from Chugai, Takeda, Eli Lilly, Ono, Taiho, and Sanofi, and research grants from Ono, MSD, Sumitomo Dainippon, Taiho, and Takeda. YK has received honoraria from Asahi Kasei, EA Pharma, MSD, Otsuka, Ono, Shiseido, Yakult, Kyowa Kirin, Sanofi, Sawai, Shire, Daiichi Sankyo, Taiho, Takeda, Mitsubishi Tanabe, Chugai, Nipro, Eli Lilly, Nippon‐Kayaku, Bayer, Pfizer, Bristol‐Myers Squibb, Merck Biopharma, and Novartis, and research grants from Takeda, Shionogi, Ono, Taiho, Chugai, Asahi Kasei, Kyowa Kirin, Nippon Zoki, Eli Lilly, and Daiichi Sankyo. MN has received honoraria from Chugai, Taiho, Merck Biopharma, Takeda, Ono, Eli Lilly, Otsuka, Yakult, Sanofi, and Bayer. TY has received honoraria from Chugai and Taiho. HB has received honoraria from Eli Lilly, Taiho, Ono, Chugai, and Takeda and research funds from Ono, Merck Biopharma, MSD, and Taiho and research grants from Taiho, Yakult, and Chugai. KS has received honoraria from Taiho, Chugai, and Daiichi Sankyo. AS has received honoraria from Taiho, Chugai, Daiichi Sankyo, Eli Lilly, and Ono. SY has received honoraria from Chugai, Takeda, and Bristol‐Myers. SM has received honoraria from AstraZeneca, Bristol‐Myers Squibb, Chugai, Eli Lilly, MSD, Boehringer Ingelheim, Ono, Pfizer, and Taiho, and research grants from Boehringer Ingelheim. CI has received research grants from Hitachi, Chugai, Taiho, Ono, Eisai, Taleda, Asahi Kasei, and Daiichi Sankyo. All remaining authors declare no conflict of interest.
Supporting information
Appendix S1
Appendix S2
ACKNOWLEDGMENTS
We thank our patients and medical and technical staff, especially Ms Hiromi Nakano. A list of participating institutions to TR is given in the Appendix S2. This work was supported by the Tokyo Cooperative Oncology Group with funding from Taiho Pharmaceutical Co. Ltd., Japan [no grant number] under the study contract, and partly supported by a grant from the Project for Development of Innovative Research on Cancer Therapeutics (P‐DIRECT) [grant number 11110018] and the Project for Cancer Research and Therapeutic Evolution (P‐CREATE) [grant number 16770660] by the Japan Agency for Medical Research and Development.
Takahashi S, Sakamoto Y, Denda T, et al. Advanced colorectal cancer subtypes (aCRCS) help select oxaliplatin‐based or irinotecan‐based therapy for colorectal cancer. Cancer Sci. 2021;112:1567–1578. 10.1111/cas.14841
REFERENCES
- 1. Van Cutsem E, Cervantes A, Adam R, et al. ESMO consensus guidelines for the management of patients with metastatic colorectal cancer. Ann Oncol. 2016;27(8):1386‐1422. [DOI] [PubMed] [Google Scholar]
- 2. National Comprehensive Cancer Network (NCCN). Available from: https://www.nccn.org. Colon Cancer, Version 2. 2021, Accessed January 21, 2021. Rectal cancer, Version 1. 2021, Accessed December 22, 2020.
- 3. Parikh AR, Lee FC, Yau L, et al. MAVERICC, a randomized, biomarker‐stratified, Phase II Study of mFOLFOX6‐Bevacizumab versus FOLFIRI‐Bevacizumab as First‐line Chemotherapy in Metastatic Colorectal Cancer. Clin Cancer Res. 2019;25(10):2988‐2995. [DOI] [PMC free article] [PubMed] [Google Scholar]
- 4. Yamazaki K, Nagase M, Tamagawa H, et al. Randomized phase III study of bevacizumab plus FOLFIRI and bevacizumab plus mFOLFOX6 as first‐line treatment for patients with metastatic colorectal cancer (WJOG4407G). Ann Oncol. 2016;27(8):1539‐1546. [DOI] [PubMed] [Google Scholar]
- 5. Tournigand C, Andre T, Achille E, et al. FOLFIRI followed by FOLFOX6 or the reverse sequence in advanced colorectal cancer: a randomized GERCOR study. J Clin Oncol. 2004;22(2):229‐237. [DOI] [PubMed] [Google Scholar]
- 6. Yamada Y, Denda T, Gamoh M, et al. S‐1 and irinotecan plus bevacizumab versus mFOLFOX6 or CapeOX plus bevacizumab as first‐line treatment in patients with metastatic colorectal cancer (TRICOLORE): a randomized, open‐label, phase III, noninferiority trial. Ann Oncol. 2018;29(3):624‐631. [DOI] [PMC free article] [PubMed] [Google Scholar]
- 7. Sanz‐Garcia E, Argiles G, Elez E, Tabernero J. BRAF mutant colorectal cancer: prognosis, treatment, and new perspectives. Ann Oncol. 2017;28(11):2648‐2657. [DOI] [PubMed] [Google Scholar]
- 8. Sorich MJ, Wiese MD, Rowland A, Kichenadasse G, McKinnon RA, Karapetis CS. Extended RAS mutations and anti‐EGFR monoclonal antibody survival benefit in metastatic colorectal cancer: a meta‐analysis of randomized, controlled trials. Ann Oncol. 2015;26(1):13‐21. [DOI] [PubMed] [Google Scholar]
- 9. Hewish M, Lord CJ, Martin SA, Cunningham D, Ashworth A. Mismatch repair deficient colorectal cancer in the era of personalized treatment. Nature reviews Clinical oncology. 2010;7(4):197‐208. [DOI] [PubMed] [Google Scholar]
- 10. Weisenberger DJ, Siegmund KD, Campan M, et al. CpG island methylator phenotype underlies sporadic microsatellite instability and is tightly associated with BRAF mutation in colorectal cancer. Nat Genet. 2006;38(7):787‐793. [DOI] [PubMed] [Google Scholar]
- 11. Guinney J, Dienstmann R, Wang X, et al. The consensus molecular subtypes of colorectal cancer. Nat Med. 2015;21(11):1350‐1356. [DOI] [PMC free article] [PubMed] [Google Scholar]
- 12. Inoue M, Takahashi S, Soeda H, et al. Gene‐expression profiles correlate with the efficacy of anti‐EGFR therapy and chemotherapy for colorectal cancer. Int J Clin Oncol. 2015;20(6):1147‐1155. [DOI] [PubMed] [Google Scholar]
- 13. Komatsu Y, Ishioka C, Shimada K, et al. Study protocol of the TRICOLORE trial: a randomized phase III study of oxaliplatin‐based chemotherapy versus combination chemotherapy with S‐1, irinotecan, and bevacizumab as first‐line therapy for metastatic colorectal cancer. BMC Cancer. 2015;15:626. [DOI] [PMC free article] [PubMed] [Google Scholar]
- 14. Soeda H, Shimodaira H, Gamoh M, et al. Phase II trial of cetuximab plus irinotecan for oxaliplatin‐ and irinotecan‐based chemotherapy‐refractory patients with advanced and/or metastatic colorectal cancer: evaluation of efficacy and safety based on KRAS mutation status (T‐CORE0801). Oncology. 2014;87(1):7‐20. [DOI] [PubMed] [Google Scholar]
- 15. Okita A, Takahashi S, Ouchi K, et al. Consensus molecular subtypes classification of colorectal cancer as a predictive factor for chemotherapeutic efficacy against metastatic colorectal cancer. Oncotarget. 2018;9(27):18698‐18711. [DOI] [PMC free article] [PubMed] [Google Scholar]
- 16. Ouchi K, Takahashi S, Yamada Y, et al. DNA methylation status as a biomarker of anti‐epidermal growth factor receptor treatment for metastatic colorectal cancer. Cancer Sci. 2015;106(12):1722‐1729. [DOI] [PMC free article] [PubMed] [Google Scholar]
- 17. Subramanian A, Tamayo P, Mootha VK, et al. Gene set enrichment analysis: a knowledge‐based approach for interpreting genome‐wide expression profiles. Proc Natl Acad Sci USA. 2005;102(43):15545‐15550. [DOI] [PMC free article] [PubMed] [Google Scholar]
- 18. Baba H, Baba Y, Uemoto S, et al. Changes in expression levels of ERCC1, DPYD, and VEGFA mRNA after first‐line chemotherapy of metastatic colorectal cancer: results of a multicenter study. Oncotarget. 2015;6(32):34004‐34013. [DOI] [PMC free article] [PubMed] [Google Scholar]
- 19. Stintzing S, Wirapati P, Lenz HJ, et al. Consensus molecular subgroups (CMS) of colorectal cancer (CRC) and 1st‐line efficacy of FOLFIRI plus cetuximab or bevacizumab in the FIRE3 (AIO KRK‐0306) trial. Ann Oncol. 2019;30(11):1796‐1803. [DOI] [PMC free article] [PubMed] [Google Scholar]
- 20. Lenz HJ, Ou FS, Venook AP, et al. Impact of consensus molecular subtype on survival in patients with metastatic colorectal cancer: Results from CALGB/SWOG 80405 (Alliance). J Clin Oncol. 2019;37(22):1876‐1885. [DOI] [PMC free article] [PubMed] [Google Scholar]
- 21. Aderka D, Stintzing S, Heinemann V. Explaining the unexplainable: discrepancies in results from the CALGB/SWOG 80405 and FIRE‐3 studies. Lancet Oncol. 2019;20(5):e274‐e283. [DOI] [PubMed] [Google Scholar]
- 22. Muro K, Boku N, Shimada Y, et al. Irinotecan plus S‐1 (IRIS) versus fluorouracil and folinic acid plus irinotecan (FOLFIRI) as second‐line chemotherapy for metastatic colorectal cancer: a randomised phase 2/3 non‐inferiority study (FIRIS study). Lancet Oncol. 2010;11(9):853‐860. [DOI] [PubMed] [Google Scholar]
- 23. Yamada Y, Takahari D, Matsumoto H, et al. Leucovorin, fluorouracil, and oxaliplatin plus bevacizumab versus S‐1 and oxaliplatin plus bevacizumab in patients with metastatic colorectal cancer (SOFT): an open‐label, non‐inferiority, randomised phase 3 trial. Lancet Oncol. 2013;14(13):1278‐1286. [DOI] [PubMed] [Google Scholar]
- 24. Xu RH, Muro K, Morita S, et al. Modified XELIRI (capecitabine plus irinotecan) versus FOLFIRI (leucovorin, fluorouracil, and irinotecan), both either with or without bevacizumab, as second‐line therapy for metastatic colorectal cancer (AXEPT): a multicentre, open‐label, randomised, non‐inferiority, phase 3 trial. Lancet Oncol. 2018;19(5):660‐671. [DOI] [PubMed] [Google Scholar]
- 25. Cassidy J, Clarke S, Díaz‐Rubio E, et al. Randomized phase III study of capecitabine plus oxaliplatin compared with fluorouracil/folinic acid plus oxaliplatin as first‐line therapy for metastatic colorectal cancer. J Clin Oncol. 2008;26(12):2006‐2012. [DOI] [PubMed] [Google Scholar]
- 26. Orlandi A, Di Salvatore M, Bagalà C, et al. ERCC1 induction after oxaliplatin exposure may depend on KRAS mutational status in colorectal cancer cell line: In vitro Veritas. J Cancer. 2015;6(1):70‐81. [DOI] [PMC free article] [PubMed] [Google Scholar]
- 27. Nakamura M, Takashima A, Denda T, et al. 475P Updated analysis and exploratory analysis of primary tumor location in the TRICOLORE trial: A randomized phase III trial of S‐1 and irinotecan plus bevacizumab versus mFOLFOX6 or CapeOX plus bevacizumab as first‐line treatment for metastatic colorectal cancer. Ann Oncol. 2018;29(suppl_8):23. [DOI] [PMC free article] [PubMed] [Google Scholar]
Associated Data
This section collects any data citations, data availability statements, or supplementary materials included in this article.
Supplementary Materials
Appendix S1
Appendix S2