Abstract
Resident adipocytes under a hypoxic tumor microenvironment exert an increasingly important role in cell growth, proliferation, and invasion in cancers. However, the communication between adipocytes and cancer cells during nasopharyngeal carcinoma (NPC) progression is poorly understood. Here, we demonstrate that hypoxic adipocyte‐derived exosomes are key information carriers that transfer low expression of miR‐433‐3p into NPC cells. In addition, luciferase reporter assays detected that hypoxia inducible factor‐1α (HIF‐1α) induced miR‐433‐3p transcription through five binding sites at its promoter region. Concordantly, the low expression of miR‐433‐3p promoted proliferation, migration, and lipid accumulation in NPC cells via targeting stearoyl‐CoA desaturase 1 (SCD1) are suggested by functional studies. Consistent with these findings, in tumor‐bearing mice, NPC cells with low HIF‐1α expression, high miR‐433‐3p expression, and low SCD1 expression were equally endowed with remarkably reduced potential of tumorigenesis. Collectively, our study highlights the critical role of the HIF‐1α‐miR‐433‐3p‐SCD1 axis in NPC progression, which can serve as a mechanism‐based potential therapeutic approach.
Keywords: adipocyte‐derived exosomes, HIF‐1α, miR‐433‐3p, NPC, SCD1
Briefly, we first clarified the intricate and context‐dependent role of hypoxic adipocyte‐derived exosomes in nasopharyngeal carcinoma (NPC) progression. Then, we identified miR‐433‐3p as a tumor suppressor gene and stearoyl‐CoA desaturase 1 (SCD1) as a novel meaningful target of miR‐433‐3p, thus regulating cell growth, migration, and lipid synthesis in NPC. The results provide new insights into the function of the HIF‐1α‐miR‐433‐3p‐SCD1 axis and suggest potential avenues for therapeutic intervention of NPC.
1. INTRODUCTION
Nasopharyngeal carcinoma (NPC) is an aggressive malignancy that occurs on the top and sidewall of the nasopharynx cavity mostly in young and middle‐aged adults. 1 According to a previous report, there are roughly 80 000 new cases in China every year while the total incidence accounts for 80% of the cases reported worldwide. 2 In particular, it has been demonstrated that cervical lymph node metastasis has already appeared in 75%‐90% of patients at the time of initial diagnosis, 3 which is different from other head and neck squamous cell carcinoma (HNSCC). Generally, once metastasis occurs, the 5‐year survival rate is 25%‐30%. 4 However, it is still not clear which key components and molecular mechanisms contribute to the proliferation and metastasis of NPC. Therefore, it would be of considerable interest to identify the biological processes and molecular mechanisms that control the progression and improve the prognosis of NPC.
One critically essential, yet frequently ignored, part of cancer progression is the hypoxic microenvironment, 5 which includes tumor cells and stromal cells. Adipocytes are abundant cancer stromal cells. 6 As key energy storage and supplements cells, they can not only provide raw materials but also energy for the proliferation and metastasis of tumor cells. 7 Many efforts have been made in recent years to uncover the mystery of adipocytes in tumor progression. For example, tumor cells tend to switch from glucose to lipid metabolism while facing hypoxia and, simultaneously, adipocytes “donate” their lipids to tumor cells by enhancing lipolysis progression, fueling their growth both at the primary site and during metastasis. 8 Intriguingly, NPC tissues and cell lines have been determined strikingly lipid accumulation compared to normal samples and NP69 cells, 9 highlighting the importance of lipid accumulation in NPC progression. However, the underlying mechanism of how NPC cells interact with mature adipocytes is not fully understood. One potential mechanism that could link adipocytes to cancer cell interorgan signaling is via circulating exosomes. 10 Exosomes are membranous vesicles of diameter 30‐150 nm secreted by most cell types. 11 It is clear that exosomes are currently viewed as specifically secreted vesicles for cell‐cell communication either locally or distally. Wang et al's research showed that promoted breast cancer cell growth, mediated by adipocyte‐derived exosomes, occurred because of hippo pathway activation. 12 The promotion of atherosclerosis by increasing angiogenesis has also been demonstrated to be associated with adipocyte‐secreted exosomes. 13 Hypoxia signal has been proposed to guide exosome trafficking to tumors. 14 Moreover, it is unclear how hypoxic adipocyte‐derived exosomes affect NPC cells.
microRNAs (miRNA) are small noncoding RNA molecules that serve as indispensable regulators of a series of biological processes. 15 Our investigations showed that miR‐433‐3p was reduced in hypoxic adipocyte‐derived exosomes compared with exosomes in normoxia. miR‐433‐3p shows diverse functions in cancer initiation and progression. 16 In particular, miR‐433‐3p is usually considered to be a tumor suppressor. Although low expression of miR‐433‐3p was observed in gastric carcinoma and hepatocellular carcinoma, 17 research has revealed the miR‐433‐3p level and related functions in NPC. A cohort of genes, including dickkopf WNT signaling pathway inhibitor 1 (DKK1), 18 histone deacetylase 619 (HDAC6), 19 and cAMP response element‐binding protein (CREB), 20 has been clearly validated as targeted genes of miR‐433‐3p. In this communication, several online websites have predicted binding sites between miR‐433‐3p and stearoyl‐CoA desaturase 1 (SCD1). SCD1 is the key regulatory gene for the synthesis of monounsaturated fatty acids (MUFA) and plays an important role in lipid metabolism of tumors. 21 A number of earlier studies have identified SCD1 as overexpressed in many malignant tumors. 22 , 23 , 24 As it is involved in different aspects of tumor development, including cell proliferation, cell cycle, apoptosis and metastasis, 25 SCD1 presents a unique opportunity to discover ways to better diagnose, understand and treat NPC.
In this study, to verify the communication between adipocytes and cancer cells in NPC progression, we focused on adipocyte‐derived exosomes. On exposure to hypoxia stress, overexpressed HIF‐1α in hypoxic adipocytes inhibits miR‐433‐3p expression in adipocyte‐derived exosomes, and subsequently promotes the progression of NPC by targeting SCD1. The discovery of the HIF‐1α‐miR‐433‐3p‐SCD1 axis provides novel insights into the diagnosis and treatment of NPC.
2. MATERIALS AND METHODS
2.1. Cell cultures and treatments
All the NPC cell lines were cultivated in RPMI‐1640 (Gibco BRL) with 10% FBS (Gibco). Simultaneously, the immortalized normal nasopharyngeal epithelial cell line NP69 was cultured in keratinocyte‐serum‐free medium (Invitrogen). Human preadipocytes‐subcutaneous (HPA) was purchased from ScienCell Co. Ltd (Cat.7220) and cultivated in preadipocyte medium and induced by preadipocyte differentiation medium (ScienCell). The plasmids were designed and provided by Genechem Co. Ltd. The SCD1 overexpression plasmid (NM_005063) was constructed into the GV141 vector, while the HIF‐1α (NM_001530) overexpression plasmid was synthesized into the GV362 vector. The SCD1 knockdown plasmid (77769‐1) was designed and introduced into the GV112 vector with the target sequence: ctACGGCTCTTTCTGATCATT. The specific si‐HIF‐1α RNA was designed and obtained from Biomics Biotechnologies Co. Ltd (China). HIF‐1α‐targeted siRNA (sense, 5′‐CGAUGGAAGCACUAGACAAdTdT 3′; antisense, 5′ UUGUCUAGUGCUUCCAUCGdTdT‐3′). Hs‐miR‐433‐3p mimic: 5′‐AUCAUGAUGGGCUCCUCGGUGU‐3′. Hs‐miR‐433‐3p inhibitor: ACACCGAGGAGCCCAUCAUGAU. Lipofectamine 3000 (Invitrogen) was used to transfect the siRNA and plasmid. For physical hypoxia treatment, the concentration of oxygen was controlled at below 1%.
2.2. Patient information and tissue samples
As described by our group before, all tissues used in this study were obtained from the Affiliated Hospital of Nantong University (Nantong, China). 26 Following the provisions of the Declaration of Helsinki, informed consent was provided by all patients. All the methods were carried out by following the approved guidelines and regulations in line with the Ethics Committee at the local hospital (ethics number 2019‐L063). A total of 13 normal samples and 13 NPC tissues were collected in these sections.
2.3. Isolation of exosomes
Exosomes were isolated from the cellular supernatant phase. First, small cell debris was removed by a penultimate centrifugation step followed by ultracentrifugation at 100 000 ×g for 1.5 hours to generate exosomes with Type 90 Ti rotor (Beckman Coulter).
2.4. Western blot
Tissues and cells were lysed in cold RIPA buffer. After detecting the concentration of protein by bicinchoninic acid (BCA), 10% separation adhesive and 4% concentration adhesive was prepared and placed in SDS/polyacrylamide gel in an electrophoresis tank, and the denatured samples were added for electrophoresis. The proteins were transferred at a constant current of 300 mA. After blocking in 5% nonfat milk, membranes were immunoblotted with antibodies against SCD1 (ab265220), ACTB (ab6276) and HIF‐1α (ab1) (Abcam) at 4℃ overnight. The target bands were washed and the secondary antibodies were incubated. After adding ECL luminescent liquid to the protein bands, the tablet pressing time was determined by the fluorescence intensity of the protein bands.
2.5. qRT‐PCR
TRIzol (Invitrogen) was used to isolate the total RNA of the cells and tissues. The process of reverse transcription was carried out in two steps. The reverse transcription cycling conditions were 42℃ for 60 minutes, then 70℃ for 10 minutes. The amplification consisted of 40 cycles. The PCR cycles were 95°C for 15 seconds for denaturing and 60°C for 1 minute for annealing and extension. The primer sequences were SCD1, 5′ CCATCGCCTGTGGAGTCAC 3′ (forward), 5′ GTCGGATAAATCTAGCGTAGCA 3′ (reverse); HIF‐1α, 5′ ACTCAGGACACAGATTTAGACTTG 3′ (forward), 5′ TGGCATTAGCAGTAGGTTCTTG 3′ (reverse); GAPDH, 5′ GAACGGGAAGCTCACTGG 3′ (forward), 5′ GCCTGCTTCACCACCTTCT 3′ (reverse). One RT primer and a pair of qPCR primers specific for miR‐433‐3p were designed by RiboBio.
2.6. CCK‐8 assay
A CCK8 assay was performed according to the manufacturer's protocol (C0037, Beyotime). Tumor cells transfected with plasmids were seeded into 96‐well plates at a concentration of 5000 cells per pore. Then, CCK‐8 solution was added to each well and the absorbance examined after incubating at 37℃ for 1.5 hours.
2.7. EdU (5‐ethynyl‐2´‐deoxyuridine, EdU) assay
Detection of EdU was performed used a Cell‐Light Edu Apollo 567 In Vitro Kit (Ribobio). The reagents were EdU solution (reagent A), Apollo reaction buffer (reagent B), Apollo catalyst solution (reagent C), Apollo fluorescent dye (reagent D), Apollo buffer additives (reagent E), Hoechst (reagent F). After the transfection of plasmids for 48 hours, cells were counted and seeded at 5000 cells per well. After undergoing EdU labeling, cell fixation, and staining, the numbers of cells labeled with (red dots) or without (blue dots) were calculated. EdU incorporation (%) = EdU‐positive cells (red dots)/(EdU‐positive cells (red dots) + Hoechst‐positive cells (blue dots).
2.8. Transwell migration
Using the Transwell chamber system (Corning), with 24‐well plates and 8‐μm pore‐size chambers, cells were counted and suspended in the upper chamber, while the lower chamber was filled with complete medium. Overnight, the cells were fixed and stained on the undersurface of the membrane.
2.9. Oil red O and BODIPY staining
After supernatant removal, cells were first fixed in 4% paraformaldehyde and washed with cold PBS. They were then stained with Oil Red O (Sigma) or BODIPY (Thermo Fisher Scientific) in the dark for 1 hour. The floating colors were washed off with isopropanol and the cells were photographed.
2.10. Dual‐luciferase reporter assay
Assays were conducted according to the manufacturer's protocol as described previously. 26 Renilla luciferase activity was used to normalize the relative luciferase activity. The primers used in the experiments were supported by Ribobio, China. The sequences of primers were SCD1wt, 5′ CTAGTTGTTTAAACGAGCTCGCTAG CCTCGAGAAAGGGGCCTGAGTGGAGGATTATCAGTAT 3′ (forward), 5′ AGCCGGATCAGCTTGCATGCCTGCAGGTCGACATCCCAAAATGCTTTCTAAAAAGCATTAGT 3′ (reverse); SCD1mut, 5′ CTAGTTGTTAAACGAGCTCGCTAGCCTCGAGAAAGGGGCCTGAGTGGAGGATTATCAGTAT 3′ (forward), 5′AGCCGGATCAGCTTGCATGCCTGCAGGTCGACATCCCAAAATGCTTTCTAAAAAGCATTAGT‐3′ (reverse).
2.11. Xenograft experiments
In vivo study was approved by the committee on the Ethics of Animal Experiments of Nantong University (RDD number: 20180227‐008). First, 1 × 10⁶ CNE2 cells transfected with different groups were subcutaneously injected into male BALB/c nude mice (4 weeks old). The tumor volume was calculated as (length × width2)/2. Finally, tumor tissues were removed and collected.
2.12. Immunohistochemistry
Paraffin sections were deparaffinized, after antigen retrieval and block endogenous peroxidase, tissue sections were incubated with the primary antibody at 4℃ overnight. Then, tissues were counterstained with diamine benzidine (DAB) and hematoxylin (Sigma) staining. The staining intensity A was divided into: 1, negative; 2, weakly positive; 3, moderately positive; 4, strongly positive. The dyeing area B was divided into: 1, 0%‐25%; 2, 26%‐50%; 3, 51%‐75%; 4, >75%. The staining score was defined as dyeing intensity area A × dyeing area B.
2.13. In situ hybridization
In situ hybridization for miR‐433‐3p was conducted by an LNATM microRNA in situ hybridization kit (Exiqon, YD00610154‐BCG). 26 According to the intensity of the nuclear or cytoplasmic staining, the staining intensities were scored as follows: 1, negative; 2, weakly positive; 3, moderately positive; 4, strongly positive. The positive cell proportions were: 1, 0%‐25%; 2, 26%‐50%; 3, 51%‐75%; 4, >75%. The final staining score was obtained by multiplying the two scores. The miRNA expression cut‐off value was determined by the median relative expression level.
2.14. Statistical analyses
Each experiment was performed at least three times and the results were expressed as the mean ± SD. Data were analyzed using Student's t‐test, one‐way and two‐way ANOVA. Survival analysis was performed by Kaplan‐Meier survival curves. When P < 0.05, the differences between control and experimental groups were considered statistically significant.
3. RESULTS
3.1. Hypoxia promotes adipogenic differentiation of HPA cells
As part of an effort to clarify the influence of hypoxia on adipogenic differentiation of HPA cells, we cultured HPA cells under normoxia (21% O2) or hypoxia (0.2% O2). Two days after hypoxic treatment, cells were induced in adipogenic differentiation medium for 15 days. As shown in Figure 1A, we observed the cellular morphology of HPA cells during adipogenic differentiation. Compared with cells under normoxia, prehypoxic HPA formed mature adipocyte more easily. The intracellular lipid droplets were visualized by Oil Red O and BODIPY staining (Figure 1C). The HPA cells displayed mesenchymal markers, for example CD44, while high expression of fatty acid synthase (FASN) is a marker of successful induction. CD44 expression decreased faster and FASN expression increased faster in the hypoxia group (Figure 1E,F). Hypoxia inducible factor‐1α (HIF‐1α) is a key transcription factor in response to hypoxic stress. 27 To identify whether HIF‐1α affects the ability to give rise to adipocytes, HPA cells were treated with si‐HIF‐1α and si‐NC before induction. We found that the downregulation of HIF‐1α induced fewer lipid droplets (Figure 1B,D), simultaneously, CD44 expression declined more slowly and FASN expression increased more slowly (Figure 1G,H). Collectively, these data suggest that prehypoxia in the stem‐cell state promotes subsequent HPA adipogenic differentiation.
FIGURE 1.
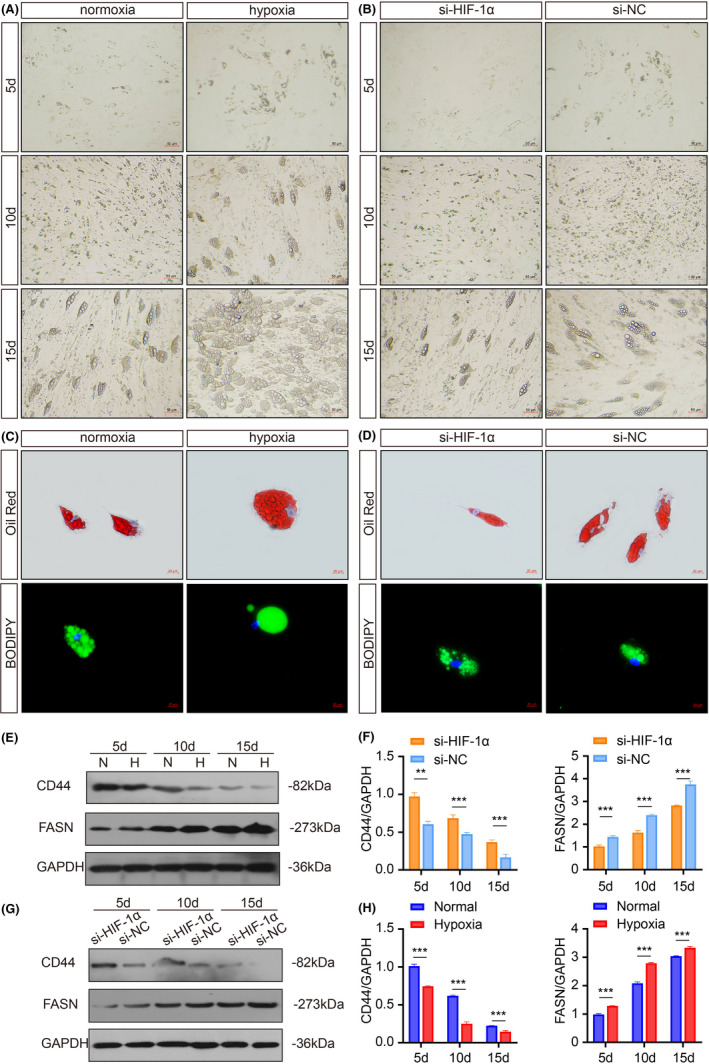
Hypoxia promotes adipogenic differentiation of HPA cells. A, B, The morphology of adipocytes was monitored by light microscopy. Scale bars: 50 μm. C, D, The representative images of Oil Red O and BODIPY staining. Scale bars: 20 μm. E, F, Western blots and grey value analysis of CD44 and FASN expression of cells in si‐HIF‐1α and si‐NC groups. G, H Western blots and grey value analysis of CD44 and FASN expression of cells in the normal and hypoxia groups. GAPDH was used as an internal reference gene
3.2. Hypoxic adipocyte‐derived exosomes promote CNE2 cells proliferation, migration and lipid synthesis
We have previously shown that exosomes from adipocytes play an important role in breast cancer cell proliferation through activation of the Hippo signaling pathway. 12 Previous studies also highlighted a significant role of hypoxic cancer cells‐derived exosomes in promoting malignant phenotype. 28 However, the effects of hypoxic adipocyte‐derived exosomes remains unknown. We purified exosomes from the conditioned medium (CM) of normoxic and hypoxic adipocytes. Electron microscopy and immunoblot analysis confirmed the presence of exosomes (Figure 2A,B). There was no significant difference between the morphology of exosomes. We sought to clarify the effects of hypoxic adipocyte‐derived exosomes on NPC cells. As shown by fluorescence microscopy, the PKH67‐labeled exosomes could be efficiently assimilated by CNE2 cells (Figure 2C), without a significant difference. We further explored the effects of different sources of exosomes on the malignant biological behavior of tumor cells. EdU assay was used to evaluate the cell proliferation capabilities of CNE2 cells (Figure 2D). Transwell assays showed that hypoxic adipocyte‐derived exosomes could accelerate the metastasis capacity of CNE2 cells (Figure 2E). Adipocytes, the major cell type in the microenvironment, play an essential role in maintaining adipocellular tissue architecture and endocrine functions. Traditionally, adipocytes are considered to be energy storage cells. Once cancer cells colonize the stroma, they initiate lipolytic signals in adipocytes, resulting in the release of fatty acids (FAs). We speculated that adipocytes could affect the lipid metabolism of tumor cells, and BODIPY staining showed that the number of green‐positive puncta was greatly increased with hypoxic exosomes compared to normal conditions (Figure 2F).
FIGURE 2.
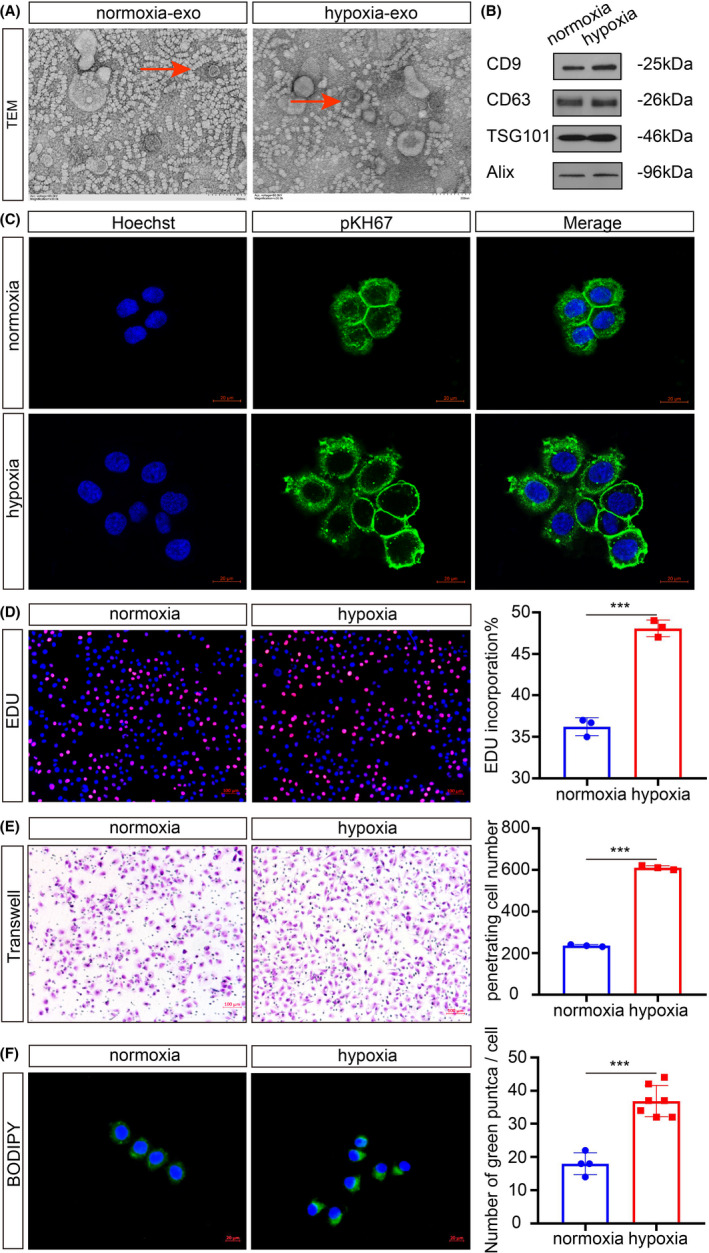
Hypoxic adipocyte‐derived exosomes promote CNE2 cell proliferation, migration, and lipid synthesis. A, Electron micrograph of exosomes isolated from normoxia and hypoxia conditions. Scale bars: 200 nm. B, The presence of exosome markers detected by Western blot analysis. C, CNE2 cells internalized PKH67‐labeled exosomes from adipocytes. Scale bars: 20 μm. D, Analysis of tumor cell proliferation by EdU, the rate of EdU incorporation (%) was quantified. Scale bars: 100 μm. E, Analysis of tumor cell migration by Transwell assays. Scale bars: 100 μm. F, After treatment with normoxic or hypoxic adipocyte‐derived exosomes, BODIPY was used to show the cellular lipid droplets. Scale bars: 20 μm. *P < 0.05; **P < 0.01; ***P < 0.001
3.3. HIF‐1α inhibits the expression of miR‐433‐3p in hypoxic adipocyte‐derived exosomes
As HIF‐1α is the most active transcription factor in the tumor hypoxic microenvironment, we further explored the underlying mechanism by which HIF‐1α regulates adipocyte‐derived exosomes. To investigate the regulatory roles of miRNA in adipocytes under hypoxia, identification of the HIF‐1α downstream target genes is essential. Since miR‐433‐3p was downregulated in hypoxic adipocyte‐derived exosomes compared with that in normoxic adipocyte‐derived exosomes (Figure 3A), online analysis software JASPAR revealed five putative binding sites of HIF‐1α based on the conserved region between HIF‐1α and the 3’UTR of miR‐433‐3p at its promoter region (Figure 3B). Comparing the wild‐type and mutant miR‐433‐3p promoters, the mutation substantially reduced HIF‐1α‐induced promoter luciferase activity in 293T cells (Figure 3C). Transient transfections indicated that ectopic expression of HIF‐1α repressed the 3′UTR reporter activities of miR‐433‐3p in a dose‐dependent manner (Figure 3D). So far, no functional association of miR‐433‐3p with hypoxic adipocyte‐derived exosomes has been reported. Therefore, we focused our studies on the role of miR‐433‐3p in the interaction between adipocytes and NPC cells. The expression of miR‐433‐3p in adipocyte‐derived exosomes was detected by qRT‐PCR (Figure 3E) and the results showed that compared with the NC group, the expression of miR‐433‐3p in the HIF‐1α group was significantly decreased. We therefore performed EdU, Transwell assays and BODIPY staining to evaluate the malignant biological function of CNE2 cells after co‐culturing with adipocyte‐derived exosomes in normoxia or hypoxia conditions (Figure 3F). The results indicated that the HIF‐1α overexpression group increased the proliferation, migration and lipid synthesis of CNE2 cells; in contrast, the miR‐433‐3p overexpression group decreased the malignant behaviors of CNE2 cells. By using a complementation rescue approach, simultaneous overexpression of both HIF‐1α and miR‐433‐3p in CNE2 cells restored biological function to control levels. In summary, HIF‐1α in adipocytes promotes the malignant biological behavior of CNE2 cells by inhibiting miR‐433‐3p expression in hypoxic adipocyte‐derived exosomes.
FIGURE 3.
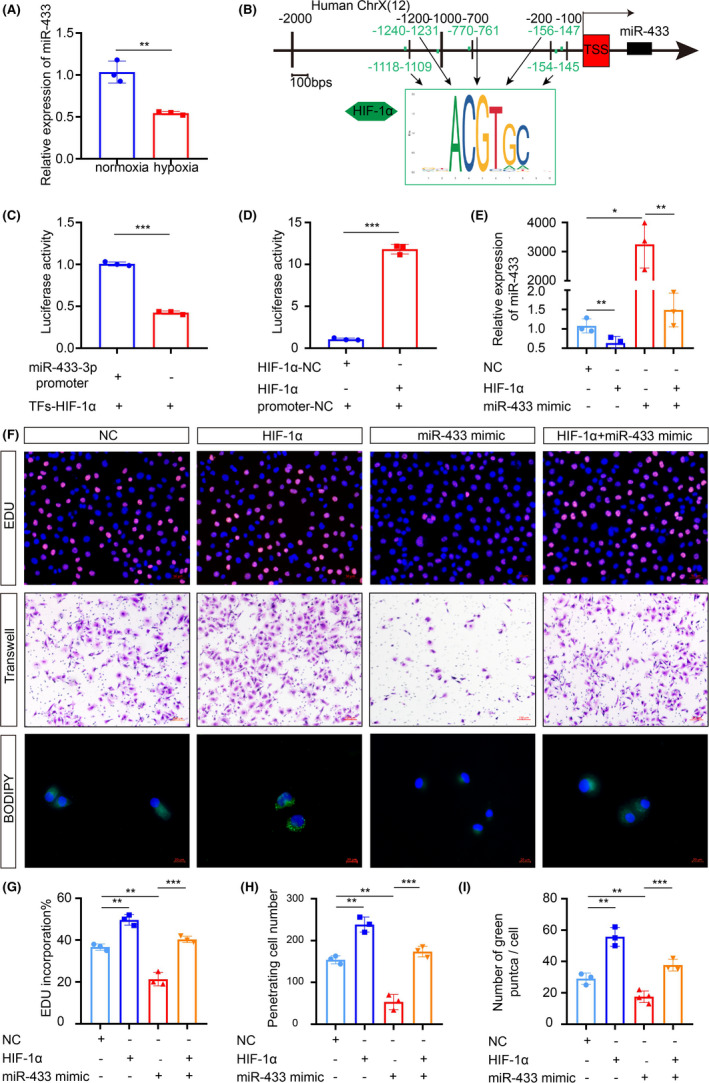
HIF‐1α inhibits the expression of miR‐433‐3p in hypoxic adipocyte‐derived exosomes. A, The differential expression of indicated miR‐433‐3p mRNA on normoxia and hypoxic adipocyte‐derived exosomes was determined by qRT‐PCR. GAPDH was used as an internal reference control. B, Schematic diagram of five predicted binding sites between miR‐433‐3p and HIF‐1α. C, D, Binding of HIF‐1α to the miR‐433‐3p promoter in 293T cells was detected by dual‐luciferase reporter assays. E, Adipocytes were treated with plasmids for 48 hours. The miR‐433‐3p expression in the different adipocyte‐CM was measured by qRT‐PCR. F, CNE2 cells were treated with adipocyte‐derived exosomes from different groups for 24 h, the proliferation, migration, and lipid synthesis were determined by EdU (G), Transwell (H), and BODIPY staining (I). *P < 0.05; **P < 0.01; ***P < 0.001
3.4. SCD1 is a direct target gene of miR‐433‐3p
In situ hybridization with NPC tissue microarrays showed that miR‐433‐3p overexpression was more prominent in patients with clinical stage I‐II NPC than in patients with clinical stage III‐IV NPC (Figure 4A,B). Interestingly, patients with low miR‐433‐3p expression were significantly correlated with shorter survival time (Figure 4C). We next evaluated the expression of miR‐433‐3p in NPC tissues compared with normal samples, and low expression of miR‐433‐3p in the tumor was detected (Figure 4D). miR‐433‐3p targets were identified using two common bioinformatic tools to generate a pool of predicted candidate genes (Figure 4E). SCD1 was selected due to the potentially high‐affinity binding sites of miR‐433‐3p (Figure 4F) and its important role in lipid metabolism. 21 The other candidates were CREB1, Rap1a, Azin1, GRB2, HDAC6, GBP2, DKK1, and ANXA2. These genes are not key enzymes for lipid metabolism. A dual‐luciferase experiment was used to verify the targeting effect relationship (Figure 4G). Additionally, the protein and mRNA expression levels of SCD1 were decreased in the miR‐433‐3p mimics group and increased in the miR‐433‐3p inhibitor group (Figure 4H,I). To determine a functional relationship between miR‐433‐3p and SCD1, we transfected CNE2 cells with shRNA‐SCD1 alone or combination with miR‐433‐3p inhibitor and examined the effects on the CNE2 cells malignant phenotype (Figure 4J,K). In the presence of cotransfected shRNA‐SCD1, the effects on the proliferation of miR‐433‐3p inhibitor were markedly diminished (Figure 4K,L). Similarly, the cells transfected with shRNA‐SCD1 exhibited decreased migration, and the potency of miR‐433‐3p inhibitor to induce cell migration was attenuated when coexpressed with shRNA‐SCD1 (Figure 4K,M). When it comes to lipid synthesis, compared with the NC group, the cells transfected with shRNA‐SCD1 showed weaker lipid synthesis, which could be enhanced when the expression of miR‐433‐3p was suppressed (Figure 4K,N). These results suggest that SCD1 is a direct target gene of miR‐433‐3p and is involved in the regulation of the malignant behavior of CNE2 cells.
FIGURE 4.
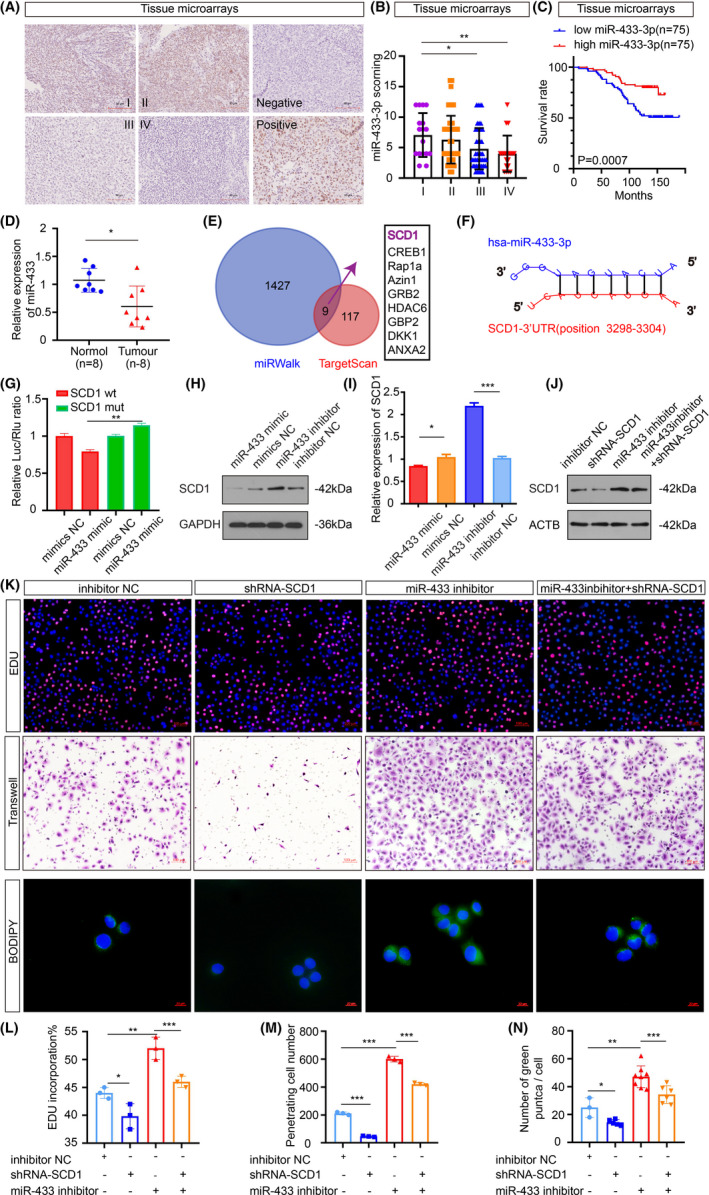
Stearoyl‐CoA desaturase 1 is a direct target gene of miR‐433‐3p. A, Representative miR‐433‐3p in situ hybridization staining of NPC tissue microarrays. Scale bar: 90 μm. B, Statistical comparison of miR‐433‐3p expression across clinical stages using one‐way ANOVA. C, Patients were classified into high and low expression groups according to the median value of the miRNA expression. Kaplan‐Meier analysis was used to compare the overall survival. D, The relative expression of miR‐433‐3p in normal and NPC samples (n = 8 per group) was measured by qRT‐PCR. E, Venn diagram depicting predicted miR‐433‐3p targets. F, Schematic of predicted miR‐433‐3p binding sequences in the 3′‐UTR of SCD1. G, Luciferase reporter assay was conducted to confirm the relative luciferase activities of wild and mut SCD1 reporters. H, I, The protein and mRNA expression of SCD1 when miR‐433‐3p expression was increased or decreased. J, Rescue experiments with Western blot of changes in SCD1 protein levels induced by miR‐433‐3p suppression and SCD1 knockdown. K, CNE2 cells were treated with different plasmids for 48 h. Proliferation, migration, and lipid synthesis were determined by EdU (L), Transwell (M), and BODIPY staining (N). *P < 0.05; **P < 0.01; ***P < 0.001
3.5. Downregulation of SCD1 restrains the carcinogenicity of CNE2 cells in vitro
Recently, SCD1 has been recognized as a tumor oncogene in several cancer types such as ovarian cancer, 22 breast cancer, 23 and colon cancer. 24 Thus, we carried out Western blot and qRT‐PCR in non‐cancerous nasopharyngeal and fresh NPC samples to validate the SCD1 expression. The results showed that the increase in SCD1 level was prominent in tumorous samples at both mRNA and protein levels (Figure 5A,B). In parallel, SCD1 expression was dramatically increased in NPC cell lines, particularly the CNE2 cell line (Figure 5C,D). To further corroborate that the overexpression of SCD1 results in accelerated malignancy, CNE2 cells were transfected with overexpression and knockdown plasmids of SCD1. By CCK8 and Transwell, we found a specific inhibition capacity in proliferation and migration when the expression of SCD1 was suppressed (Figure 5F‐H). Among the key enzymes of lipid synthesis, SCD1 catalyzes the synthesis of MUFA by adding one double bond to saturated fatty acids (SFA). To measure the effects of SCD1 on CNE2 lipid synthesis, we conducted Oil Red O and BODIPY staining. As shown in Figure 5E, more lipid droplets were found in cells when the expression of SCD1 was overexpressed. Taken together, these data support a potential role for SCD1 in the carcinogenicity of NPC cells.
FIGURE 5.
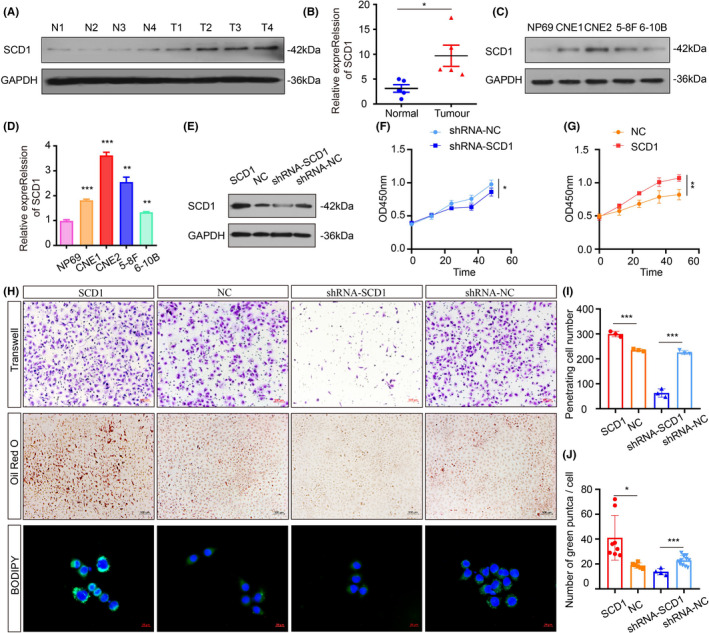
Downregulation of SCD1 restrains the carcinogenicity of CNE2 cells in vitro. A, B, SCD1 levels in tumor and noncancerous nasopharyngeal samples were measured by Western blot (n = 4 per group) and qRT‐PCR (n = 5 per group). C, D, Representative Western blot and qRT‐PCR data of SCD1 expression in various NPC cell lines (CNE1, CNE2, 5‐8F, 6‐10B) compared with NP69. E, Rescue experiments with Western blot analysis of SCD1 expression in different conditions. F, G, CCK8 assay of CNE2 cells was used to investigate the effects of SCD1 on proliferation. H, The role of SCD1 in migration in CNE2 cells was assessed by in vitro Transwell assay (I). The lipid accumulation in CNE2 cells was measured by Oil Red O and BODIPY staining (J). *P < 0.05; **P < 0.01; ***P < 0.001
3.6. The HIF‐1α‐miR‐433‐3p‐SCD1 axis regulates the malignant behavior of CNE2 cells
To gain a mechanistic insight into how miR‐433‐3p and SCD1 might promote the carcinogenicity of CNE2 cells under hypoxia, we performed an additional recovery experiment. We first examined the stability of SCD1 in the presence and absence of miR‐433‐3p and HIF‐1α. As shown in Figure 6A, low basal SCD1 expression was detectable in the si‐HIF‐1α and miR‐433‐3p mimics groups, but was strongly induced when miR‐433‐3p expression was inhibited. By using EdU (Figure 6B), Transwell assays (Figure 6C) and BODIPY staining (Figure 6D) we detect the carcinogenicity ability of CNE2 cells (Figure 6E). In line with decreased SCD1 expression, proliferation, migration, and lipid synthesis were decreased. Rescue experiments using activators and inhibitors of these molecules were performed to investigate the relative contributions of the HIF‐1α‐miR‐433‐3p‐SCD1 axis in mediating the tumor progression in vivo (Figure 6F‐H). Immunohistochemistry analysis showed that proliferation capacity was also reduced when the overall SCD1 expression was low in the NPC xenograft group (Figure 6I‐L). In summary, our study reveals important roles for the HIF‐1α‐miR‐433‐3p‐SCD1 axis in tumor cell proliferation, migration, and lipid synthesis.
FIGURE 6.
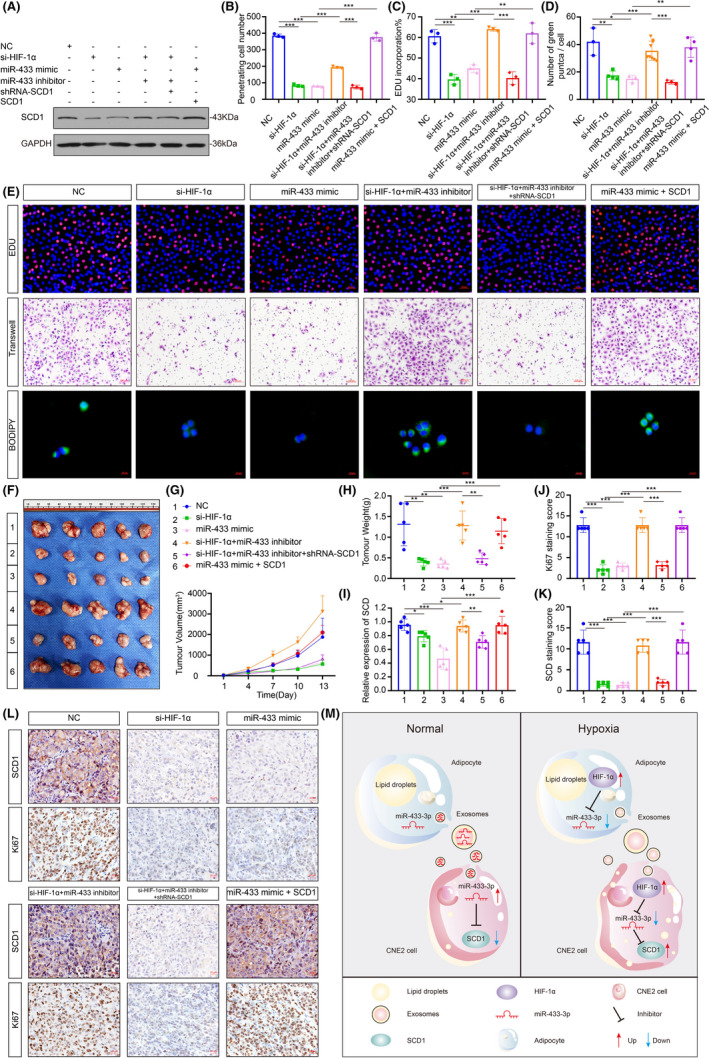
The HIF‐1α‐miR‐433 ‐SCD1 axis regulates the malignant behavior of CNE2 cells. A, Expression of SCD1 conversion was measured by Western blot in CNE2 cells in different groups. B‐E, CNE2 cells were treated with different plasmids: (1) NC; (2) si‐HIF‐1α; (3) miR‐433 mimics; (4) si‐HIF‐1α + miR‐433 inhibitor; (5) si‐HIF‐1α + miR‐433 inhibitor + shRNA‐SCD; (6)miR‐433 mimics + SCD1 for 48 h, proliferation, migration, and lipid synthesis were determined by EdU, Transwell and BODIPY staining. F, Representative NPC xenografts are showed on the left. Right, tumorigenic effects of CNE2 cells in six groups: 1, NC group; 2, si‐HIF‐1α treated cells; 3, miR‐433 mimics treated cells; 4, si‐HIF‐1α + miR‐433 inhibitor treated cells; 5, si‐HIF‐1α + miR‐433 inhibitor + shRNA‐SCD1 treated cells; 6, miR‐433 mimics + SCD1.G. H, Tumor growth with different levels of miR‐433 and SCD1 over time. I, The mRNA expression of SCD1 in different groups. J‐L, Immunohistochemistry detection of SCD1 and Ki67. Scale bar: 50 μm. M, The graphical summary of HIF‐1α‐miR‐433 ‐SCD1 axis in regulating NPC malignant behavior. *P < 0.05; **P < 0.01; ***P < 0.001
4. DISCUSSION
A lot of research has shown that the hypoxic tumor microenvironment could cooperate to regulate malignant biological functions of tumor stromal cells and cancer cells. 5 , 6 Increasing evidence shows that almost all primary NPC tissues contain hypoxic regions which contribute to more and more distant metastases. 29 Adipocytes used to be considered to be one of the major sources for inflammatory cytokines such as IL‐6 and several complement factors. 30 Our data show that hypoxia promotes adipogenic differentiation of HPA (Figure 1A,B). It is clear that HIF‐1α plays an important role that may accelerate the malignant effects of adipocytes on tumor progression and the release of inflammatory factors.
Dynamic and reciprocal communication between tumor cells and surrounding tumor stomal cells has recently come into focus. Previous studies concentrated mainly on tumor cell‐derived exosomes, and little attention has been paid to the exosomes from tumor stromal cells, especially adipocytes. At present, accumulating evidence suggests that adipocytes not only act as energy storage cells, but also serve as endocrine cells by secreting exosomes and other factors. Of note, adipocyte‐derived exosomes are emerging as a novel mediator in several tumors by delivering various protein molecules and RNA. For instance, adipocyte‐derived exosomes promote lung cancer metastasis by increasing MMP9 activity. 31 Our study suggests that exosomes secreted from adipocytes could be absorbed by CNE2 cells (Figure 2C), while at the same time hypoxic adipocyte‐derived exosomes are able to accelerate the malignant phenotype of NPC cells (Figure 2D‐F). Therefore, to elucidate the molecular mechanisms at play that enable this phenomenon, we carried out further study.
Quite recently, exosomes were determined to accelerate cell‐cell communications, in which exosomes would transduce the miRNAs into the target cells. 32 In parallel, our study initially suggested that hypoxia signal transduction of HIF‐1α is identified to be an upstream regulatory molecule of miR‐433‐3p (Figure 3A) because there are five putative binding sites on the miR‐433‐3p promoter (Figure 3B). Meanwhile, the results of the dual‐luciferase reporter assay confirmed that miR‐433‐3p is regulated by HIF‐1α. It is worth noting that previous studies mostly defined miR‐433‐3p as a tumor suppressor. 19 , 33 Similarly, we showed that miR‐433‐3p is downregulated in NPC (Figure 4A) and confirmed this by a later study in which miR‐433‐3p overexpression inhibited the proliferation, migration, and lipid synthesis of CNE2 cells (Figure 3F‐I). Therefore, the findings mentioned above showing that hypoxic adipocyte‐derived exosomes stimulate tumor malignant biological phenotype by inhibiting miR‐433‐3p. Consequently, quantification of miR‐433‐3p levels before initiation of therapy may provide clues for predicting both the recurrence and survival rate of NPC.
Delineating the mechanisms that negatively modulate tumor cells is critical for the development of new molecular‐targeted and therapeutic approaches. Our data showed a novel and important finding that SCD1 participates in a positive regulatory feedback loop of HIF‐1α signaling by being identified as an innovative target of miR‐433‐3p (Figure 4E). SCD1 is a key enzyme in the catalysis of SFA to MUFA conversion. 34 SCD1 is anchored to the endoplasmic reticulum with four transmembrane junctions and is tightly bound with coenzyme NAD (P), cytochrome reductase, and cytochrome b5, catalyzing double bonds between the △9 and △10 sites. 35 Oleic acid and palmitic acids, the final products of SCD1, are substrates for preferential utilization of multiple structural lipids such as triacylglycerol, cholesterol ester, and membrane phospholipid. Thus, SCD1 plays an important role in mediating the SFA/MUFA balance for promoting biofilm formation, supporting rapid tumor cell division to regulate functional lipid rafts and mediate proliferation, as well as survival signal transduction. 36 According to previous studies, SCD1 is closely related to tumorigenesis and development. 37 , 38 More importantly, blocking SCD1 in vitro attenuated lipid accumulation and halted the progression of CNE2 cell proliferation and migration (Figure 5F‐J). Data from recent studies has shown that SCD1 has become a new type of antitumor therapy target. Inhibition of SCD1 may be an effective therapy to combat tumor‐related energy mobilization. Lipid synthesis signaling is critical for mediating the biological effects induced by growth factors through SREBP‐1c. 37 First, FAs are essential materials for lipid synthesis, which may in turn be necessary for tumor develpoment. 38 Second, enhanced FAs synthesis in turn promotes inflammation phenotypes. In summary, synthesis is required for carcinogenesis. These results led us to propose that specific promotion of SCD1 may enhance tumor sensitivity to energy mobilization by accelerating lipid synthesis.
Taken together, in a tumor hypoxia microenvironment, tumor‐associated adipose tissue secreted exosomes contain less miR‐433‐3p than in normal conditions. Tumor cells ingest exosomes containing fewer miR‐433‐3p, leading to increased intracellular SCD1, and then promote the proliferation, migration, and lipid synthesis of tumor cells. Lastly, by combining the current findings with previous studies, we propose a HIF‐1α‐miR‐433‐3p‐SCD1 axis delineating the role of miR‐433‐3p and SCD1 in the hypoxia signaling pathway during tumor procession in vivo xenotransplantation model (Figure 6M). The present results allowed us to conclude that knockdown of HIF‐1α expression suppressed tumorigenic potential by inhibiting SCD1 expression via overexpression of miR‐433‐3p. Additionally, since HIF‐1α and miR‐433‐3p may have multiple target genes, we only paid attention to the regulation of the HIF‐1α‐miR‐433‐3p‐SCD1 axis in NPC, but other possible regulatory pathways are equal worth exploring.
Briefly, we clarified the intricate and context‐dependent role of hypoxic adipocyte‐derived exosomes in NPC progression. We then identified miR‐433‐3p as a tumor suppressor gene and SCD1 as a novel meaningful target of miR‐433‐3p, thus regulating cell growth, migration, and lipid synthesis in NPC. The results provide new insights into the function of the HIF‐1α‐miR‐433‐3p‐SCD1 axis and suggest potential avenues for therapeutic intervention of NPC.
DISCLOSURE
The authors have no conflict of interest.
ACKNOWLEDGMENTS
This work was supported by grants from the National Natural Science Foundation of China (Grant No. 81972554, No. 81672682, No. 81602385), the Natural Science Foundation of Jiangsu Province (Grant No. BK20201208), the key Medical Project of Jiangsu Commission of Health (Class A, Grant No. ZDA 2020010), the Clinical Frontier Technology of Jiangsu (Grant No. BE2017680), the CSCO Clinical Oncology Research Foundation of Beijing (Grant No. Y‐HS2017‐074), and the innovative research project for postgraduate students of Jiangsu province (No. SJCX19_0872).
Yin H, Qiu X, Shan Y, et al. HIF‐1α downregulation of miR‐433‐3p in adipocyte‐derived exosomes contributes to NPC progression via targeting SCD1. Cancer Sci. 2021;112:1457–1470. 10.1111/cas.14829
Haimeng Yin and Xiaoxia Qiu contributed equally.
Contributor Information
Jianmei Zhao, Email: zjmheart@163.com.
Yiwen You, Email: youyiwen_nantong@163.com.
REFERENCES
- 1. You B, Shan Y, Shi S, Li X, You Y. Effects of ADAM10 upregulation on progression, migration, and prognosis of nasopharyngeal carcinoma. Cancer Sci. 2015;106:1506‐1514. [DOI] [PMC free article] [PubMed] [Google Scholar]
- 2. Lam WKJ, Chan JYK. Recent advances in the management of nasopharyngeal carcinoma. F1000Res. 2018;7:1829. [DOI] [PMC free article] [PubMed] [Google Scholar]
- 3. Liang T‐S, Zheng Y‐J, Wang J, Zhao J‐Y, Yang D‐K, Liu Z‐S. MicroRNA‐506 inhibits tumor growth and metastasis in nasopharyngeal carcinoma through the inactivation of the Wnt/β‐catenin signaling pathway by down‐regulating LHX2. J Exp Clin Cancer Res. 2019;38:97. [DOI] [PMC free article] [PubMed] [Google Scholar] [Retracted]
- 4. Wong EHC, Liew YT, Loong SP, Prepageran N. Five‐year survival data on the role of endoscopic endonasal nasopharyngectomy in advanced recurrent rT3 and rT4 nasopharyngeal carcinoma. Ann Otol Rhinol Laryngol. 2020;129:287‐293. [DOI] [PubMed] [Google Scholar]
- 5. Tong Y, Yang H, Xu X, et al. Effect of a hypoxic microenvironment after radiofrequency ablation on residual hepatocellular cell migration and invasion. Cancer Sci. 2017;108:753‐762. [DOI] [PMC free article] [PubMed] [Google Scholar]
- 6. Tokuda Y, Satoh Y, Fujiyama C, Toda S, Sugihara H, Masaki Z. Prostate cancer cell growth is modulated by adipocyte‐cancer cell interaction. BJU Int. 2003;91:716‐720. [DOI] [PubMed] [Google Scholar]
- 7. Choi J, Cha YJ, Koo JS. Adipocyte biology in breast cancer: From silent bystander to active facilitator. Prog Lipid Res. 2018;69:11‐20. [DOI] [PubMed] [Google Scholar]
- 8. Nieman KM, Kenny HA, Penicka CV, et al. Adipocytes promote ovarian cancer metastasis and provide energy for rapid tumor growth. Nat Med. 2011;17:1498‐1503. [DOI] [PMC free article] [PubMed] [Google Scholar]
- 9. Zhou X, Wei J, Chen F, et al. Epigenetic downregulation of the ISG15‐conjugating enzyme UbcH8 impairs lipolysis and correlates with poor prognosis in nasopharyngeal carcinoma. Oncotarget. 2015;6:41077‐41091. [DOI] [PMC free article] [PubMed] [Google Scholar]
- 10. He C, Zheng S, Luo Y, Wang B. Exosome theranostics: biology and translational medicine. Theranostics. 2018;8:237‐255. [DOI] [PMC free article] [PubMed] [Google Scholar]
- 11. Ruiz‐López L, Blancas I, Garrido JM, et al. The role of exosomes on colorectal cancer: a review. J Gastroenterol Hepatol. 2018;33:792‐799. [DOI] [PubMed] [Google Scholar]
- 12. Wang S, Su X, Xu M, et al. Exosomes secreted by mesenchymal stromal/stem cell‐derived adipocytes promote breast cancer cell growth via activation of Hippo signaling pathway. Stem Cell Res Ther. 2019;10:117. [DOI] [PMC free article] [PubMed] [Google Scholar]
- 13. Wang F, Chen F‐F, Shang Y‐Y, et al. Insulin resistance adipocyte‐derived exosomes aggravate atherosclerosis by increasing vasa vasorum angiogenesis in diabetic ApoE mice. Int J Cardiol. 2018;265:181‐187. [DOI] [PubMed] [Google Scholar]
- 14. Shao C, Yang F, Miao S, et al. Role of hypoxia‐induced exosomes in tumor biology. Mol Cancer. 2018;17:120. [DOI] [PMC free article] [PubMed] [Google Scholar]
- 15. Saliminejad K, Khorram Khorshid HR, Soleymani Fard S, Ghaffari SH. An overview of microRNAs: biology, functions, therapeutics, and analysis methods. J Cell Physiol. 2019;234:5451‐5465. [DOI] [PubMed] [Google Scholar]
- 16. Tao L, Bei Y, Chen P, et al. Crucial role of miR‐433 in regulating cardiac fibrosis. Theranostics. 2016;6:2068‐2083. [DOI] [PMC free article] [PubMed] [Google Scholar]
- 17. Yang Z, Tsuchiya H, Zhang Y, Hartnett ME, Wang L. MicroRNA‐433 inhibits liver cancer cell migration by repressing the protein expression and function of cAMP response element‐binding protein. J Biol Chem. 2013;288:28893‐28899. [DOI] [PMC free article] [PubMed] [Google Scholar]
- 18. Tang X, Lin J, Wang G, Lu J. MicroRNA‐433‐3p promotes osteoblast differentiation through targeting DKK1 expression. PLoS One. 2017;12:e0179860. [DOI] [PMC free article] [PubMed] [Google Scholar]
- 19. Mansini AP, Lorenzo Pisarello MJ, Thelen KM, et al. MicroRNA (miR)‐433 and miR‐22 dysregulations induce histone‐deacetylase‐6 overexpression and ciliary loss in cholangiocarcinoma. Hepatology. 2018;68:561‐573. [DOI] [PMC free article] [PubMed] [Google Scholar]
- 20. Sun S, Wang X, Xu X, et al. MiR‐433‐3p suppresses cell growth and enhances chemosensitivity by targeting CREB in human glioma. Oncotarget. 2017;8:5057‐5068. [DOI] [PMC free article] [PubMed] [Google Scholar]
- 21. Zhang J, Song F, Zhao X, et al. EGFR modulates monounsaturated fatty acid synthesis through phosphorylation of SCD1 in lung cancer. Mol Cancer. 2017;16:127. [DOI] [PMC free article] [PubMed] [Google Scholar]
- 22. Tesfay L, Paul BT, Konstorum A, et al. Stearoyl‐CoA desaturase 1 protects ovarian cancer cells from ferroptotic cell death. Cancer Res. 2019;79:5355‐5366. [DOI] [PMC free article] [PubMed] [Google Scholar]
- 23. Angelucci C, D'Alessio A, Iacopino F, et al. Pivotal role of human stearoyl‐CoA desaturases (SCD1 and 5) in breast cancer progression: oleic acid‐based effect of SCD1 on cell migration and a novel pro‐cell survival role for SCD5. Oncotarget. 2018;9:24364‐24380. [DOI] [PMC free article] [PubMed] [Google Scholar]
- 24. Wang G, Li Z, Li X, Zhang C, Peng L. RASAL1 induces to downregulate the SCD1, leading to suppression of cell proliferation in colon cancer via LXRα/SREBP1c pathway. Biol Res. 2019;52:60. [DOI] [PMC free article] [PubMed] [Google Scholar]
- 25. Jain P, Nattakom M, Holowka D, et al. Runx1 role in epithelial and cancer cell proliferation implicates lipid metabolism and scd1 and soat1 activity. Stem Cells. 2018;36:1603‐1616. [DOI] [PMC free article] [PubMed] [Google Scholar]
- 26. Bao L, You B, Shi S, et al. Metastasis‐associated miR‐23a from nasopharyngeal carcinoma‐derived exosomes mediates angiogenesis by repressing a novel target gene TSGA10. Oncogene. 2018;37:2873‐2889. [DOI] [PMC free article] [PubMed] [Google Scholar]
- 27. Tirpe AA, Gulei D, Ciortea SM, Crivii C, Hypoxia B‐N. Overview on hypoxia‐mediated mechanisms with a focus on the role of HIF genes. Int J Mol Sci. 2019;20:6140. [DOI] [PMC free article] [PubMed] [Google Scholar]
- 28. Xue M, Chen W, Xiang A, et al. Hypoxic exosomes facilitate bladder tumor growth and development through transferring long non‐coding RNA‐UCA1. Mol Cancer. 2017;16:143. [DOI] [PMC free article] [PubMed] [Google Scholar]
- 29. Shan Y, You B, Shi S, et al. Hypoxia‐induced matrix metalloproteinase‐13 expression in exosomes from nasopharyngeal carcinoma enhances metastases. Cell Death Dis. 2018;9:382. [DOI] [PMC free article] [PubMed] [Google Scholar]
- 30. Zhang X, Chen L, Xiao B, Liu H, Su Y. Circ_0075932 in adipocyte‐derived exosomes induces inflammation and apoptosis in human dermal keratinocytes by directly binding with PUM2 and promoting PUM2‐mediated activation of AuroraA/NF‐κB pathway. Biochem Biophys Res Commun. 2019;511:551‐558. [DOI] [PubMed] [Google Scholar]
- 31. Wang J, Wu Y, Guo J, Fei X, Yu L, Ma S. Adipocyte‐derived exosomes promote lung cancer metastasis by increasing MMP9 activity via transferring MMP3 to lung cancer cells. Oncotarget. 2017;8:81880‐81891. [DOI] [PMC free article] [PubMed] [Google Scholar]
- 32. You Y, Shan Y, Chen J, et al. Matrix metalloproteinase 13‐containing exosomes promote nasopharyngeal carcinoma metastasis. Cancer Sci. 2015;106:1669‐1677. [DOI] [PMC free article] [PubMed] [Google Scholar]
- 33. Qu Y, Zhu J, Liu J, Qi L. Circular RNA circ_0079593 indicates a poor prognosis and facilitates cell growth and invasion by sponging miR‐182 and miR‐433 in glioma. J Cell Biochem. 2019;120:18005‐18013. [DOI] [PubMed] [Google Scholar]
- 34. Yamamoto T, Endo J, Kataoka M, et al. Sirt1 counteracts decrease in membrane phospholipid unsaturation and diastolic dysfunction during saturated fatty acid overload. J Mol Cell Cardiol. 2019;133:1‐11. [DOI] [PubMed] [Google Scholar]
- 35. Sinha RA, Singh BK, Zhou J, et al. Loss of ULK1 increases RPS6KB1‐NCOR1 repression of NR1H/LXR‐mediated Scd1 transcription and augments lipotoxicity in hepatic cells. Autophagy. 2017;13:169‐186. [DOI] [PMC free article] [PubMed] [Google Scholar]
- 36. Zhang X, Liu J, Su W, et al. Liver X receptor activation increases hepatic fatty acid desaturation by the induction of SCD1 expression through an LXRα‐SREBP1c‐dependent mechanism. J Diabetes. 2014;6:212‐220. [DOI] [PubMed] [Google Scholar]
- 37. Liu G, Kuang S, Cao R, Wang J, Peng Q, Sun C. Sorafenib kills liver cancer cells by disrupting SCD1‐mediated synthesis of monounsaturated fatty acids the ATP‐AMPK‐mTOR‐SREBP1 signaling pathway. FASEB J. 2019;33:10089‐10103. [DOI] [PubMed] [Google Scholar]
- 38. Röhrig F, Schulze A. The multifaceted roles of fatty acid synthesis in cancer. Nat Rev Cancer. 2016;16:732‐749. [DOI] [PubMed] [Google Scholar]


